User login
Review finds mortality rates low in young pregnant women with SJS, TEN
Investigators who but higher rates of C-sections.
The systematic review found that early diagnosis and withdrawal of the causative medications, such as antiretrovirals, were beneficial.
While SJS and TEN have been reported in pregnant women, “the outcomes and treatment of these cases are poorly characterized in the literature,” noted Ajay N. Sharma, a medical student at the University of California, Irvine, and coauthors, who published their findings in the International Journal of Women’s Dermatology.
“Immune changes that occur during pregnancy create a relative state of immunosuppression, likely increasing the risk of these skin reactions,” Mr. Sharma said in an interview. Allopurinol, antiepileptic drugs, antibacterial sulfonamides, nevirapine, and oxicam NSAIDs are agents most often associated with SJS/TEN.
He and his coauthors conducted a systematic literature review to analyze the risk factors, outcomes, and treatment of SJS and TEN in pregnant patients and their newborns using PubMed and Cochrane data from September 2019. The review included 26 articles covering 177 pregnant patients with SJS or TEN. Affected women were fairly young, averaging 29.9 years of age and more than 24 weeks along in their pregnancy when they experienced a reaction.
The majority of cases (81.9%) involved SJS diagnoses. Investigators identified antiretroviral therapy (90% of all cases), antibiotics (3%), and gestational drugs (2%) as the most common causative agents. “Multiple large cohort studies included in our review specifically assessed outcomes in only pregnant patients with HIV, resulting in an overall distribution of offending medications biased toward antiretroviral therapy,” noted Mr. Sharma. Nevirapine, a staple antiretroviral in developing countries (the site of most studies in the review), emerged as the biggest causal agent linked to 75 cases; 1 case was linked to the antiretroviral drug efavirenz.
Approximately 85% of pregnant women in this review had HIV. However, the young patient population studied had few comorbidities and low transmission rates to the fetus. In the 94 cases where outcomes data were available, 98% of the mothers and 96% of the newborns survived. Two pregnant patients in this cohort died, one from septic shock secondary to a TEN superinfection, and the other from intracranial hemorrhage secondary to metastatic melanoma. Of the 94 fetuses, 4 died: 2 of sepsis after birth, 1 in utero with its mother, and there was 1 stillbirth.
“Withdrawal of the offending drug was enacted in every recorded case of SJS or TEN during pregnancy. This single intervention was adequate in 159 patients; no additional therapy was needed in these cases aside from standard wound care, fluid and electrolyte repletion, and pain control,” wrote the investigators. Clinicians administered antibiotics, fluid resuscitation, steroids, and intravenous immunoglobulin in patients needing further assistance.
The investigators also reported high rates of C-section – almost 50% – in this group of pregnant women.
Inconsistent reporting between studies limited results, Mr. Sharma and colleagues noted. “Not every report specified body surface area involvement, treatment regimen, maternal or fetal outcome, or delivery method. Although additional studies in the form of large-scale, randomized, clinical trials are needed to better delineate treatment, this systematic review provides a framework for managing this population.”
The study authors reported no conflicts of interest and no funding for the study.
SOURCE: Sharma AN et al. Int J Womens Dermatol. 2020 Apr 13;6(4):239-47.
FROM THE INTERNATIONAL JOURNAL OF WOMEN’S DERMATOLOGY
Teen affective disorders raise risk for midlife acute MI
in a Swedish national registry study presented at the virtual annual congress of the European Society of Cardiology.
The association was mediated in part by poor stress resilience and lack of physical fitness among these teenagers with an affective disorder, reported Cecilia Bergh, PhD, of Obrero (Sweden) University.
Her study was made possible by Sweden’s comprehensive national health care registries coupled with the Nordic nation’s compulsory conscription for military service. The mandatory conscription evaluation during the study years included a semistructured interview with a psychologist to assess stress resilience through questions about coping with everyday life, a medical history and physical examination, and a cardiovascular fitness test using a bicycle ergometer.
The study included 238,013 males born in 1952-1956. They were aged 18-19 years when they underwent their conscription examination, at which time 34,503 of them either received or already had a diagnosis of depression or anxiety. During follow-up from 1987 to 2010, a first acute MI occurred in 5,891 of the men. The risk was increased 51% among those with an earlier teen diagnosis of depression or anxiety.
In a Cox regression analysis adjusted for levels of adolescent cardiovascular risk factors, including blood pressure, body mass index, and systemic inflammation, as well as additional potential confounders, such as cognitive function, parental socioeconomic index, and a summary disease score, the midlife MI risk associated with adolescent depression or anxiety was attenuated, but still significant, with a 24% increase. Upon further statistical adjustment incorporating adolescent stress resilience and cardiovascular fitness, the increased risk of acute MI in midlife associated with adolescent depression or anxiety was further attenuated yet remained significant, at 18%.
Dr. Bergh shared her thoughts on preventing this increased risk of acute MI at a relatively young age: “Effective prevention might focus on behavior, lifestyle, and psychosocial stress in early life. If a healthy lifestyle is encouraged as early as possible in childhood and adolescence, it is more likely to persist into adulthood and to improve longterm health. So look for signs of stress, depression, or anxiety that is beyond normal teenager behavior and a persistent problem. Teenagers with poor well-being could benefit from additional support to encourage exercise and also to develop strategies to deal with stress.”
She reported having no financial conflicts regarding her study, conducted free of commercial support.
SOURCE: Bergh C et al. ESC 2020, Abstract 90524.
FROM ESC CONGRESS 2020
A possible benchmark for Barrett’s esophagus surveillance
A population-based cohort analysis of Barrett’s esophagus patients undergoing surveillance endoscopy suggests that the neoplasia detection rate (NDR) and the rate of missed dysplasia during the index endoscopy may be lower than previously reported in studies of referral-based cohorts. The new results suggest that NDR may be a useful quality control measure for Barrett’s esophagus surveillance.
The finding is welcome. “Just like we’ve done in colonoscopy with the adenoma detection rate, we need to have a quality metric to determine whether or not we’re adequately finding neoplasia while screening our patients with Barrett’s esophagus,” Jeffrey Mosko, MD, a gastroenterologist and interventional endoscopist at the University of Toronto’s St. Michael’s Hospital, said in an interview.
Societal guidelines recommend endoscopic screening in Barrett’s esophagus patients, with the goal of identifying dysplastic Barrett’s esophagus and eradicating it endoscopically before it can develop into esophageal adenocarcinoma (EAC). Despite this, 90% of patients with esophageal adenocarcinoma are diagnosed outside of a surveillance program.
Missed high-grade dysplasia or early EAC could become more invasive or metastasize, potentially leading to greater morbidity, mortality, and cost, although that relationship hasn’t been absolutely established yet the way it has with colonoscopy and colorectal cancer, according to Dr. Mosko.
Variation in endoscopy performance can be caused by the patchy and subtle appearance of dysplasia, and because procedural guidelines are not always closely followed. There is often a significant difference between procedures performed by specialists and nonspecialists. “Endoscopists in general don’t take enough time to examine the segment, they don’t wash appropriately, and when they do look, they may not be well enough trained to know what they’re looking at. The only way to improve on this aside from additional training is to have a metric that measures how you’re doing, and I think [the neoplasia detection rate] is as close as we get to doing that. I think the exact threshold for NDR is not as important as figuring out what your number is and then ways to improve it,” said Dr. Mosko.
A recent meta-analysis estimated NDR to be 7%, but the patient cohort used was derived from referrals to academic centers, where experienced gastroenterologists may register a higher than average NDR. The study also lacked data on patients, providers, or biopsy quality, which prevented assessment of the effects of NDR on subsequent missed dysplasia or predictors of high or low NDR.
To get a better estimate of NDR, researchers led by Lovekirat Dhaliwal, MD, at the Mayo Clinic in Rochester, Minn., analyzed data from the Rochester Epidemiology Project, including patients from 11 counties in Minnesota. They identified 1,066 patients with Barrett’s esophagus, 71.1% of whom were male, with a mean age of 63 years. 77% had surveillance endoscopies performed by gastroenterologists, the remainder by nongastroenterologists such as doctors, surgeons, or internal medicine physicians. About 60% of participants received adequate biopsies per Seattle protocol.
The NDR was 4.9% (95% CI, 3.8%-6.4%), including 3.1% high-grade dysplasia (HGD) and 1.8% EAC. One-quarter of EAC cases had metastatic lymphadenopathy at endoscopy or surgery, and 10.6% had low-grade dysplasia (LGD). Although high-definition monitors and high-resolution endoscopes were added to practices, particularly after 2000, the researchers found no evidence of increasing NDR over time on multivariate analysis. In a separate analysis of targeted biopsies in 54 patients with a visible lesion, 9 had LGD (7.96% of all LGD diagnoses) and 10 had EAC (50.0% of all EAC diagnoses). Visible lesions were more often reported by gastroenterologists than nongastroenterologists (odds ratio, 3.7; P = .0120). Gastroenterologists had a higher rate of NDR on univariate analysis (5.8% vs. 1.7%; P = .0098).
There were 391 Barrett’s esophagus patients with no diagnosis of HGD or EAC at the initial endoscopy underwent another endoscopy at 12 months. At the follow-up procedure, eight patients were found to have HGD/EAC, amounting to 13% of HGD/EAC cases being missed at the index endoscopy. There was no statistically significant association between a missed dysplasia or found dysplasia and segment length (4.7 cm vs. 3.7 cm; P = .4), Seattle protocol adherence (62% vs. 58.7%; P = .8), visibility of lesions (OR, 0.6; P = .55), age, smoking history, or practitioner specialty.
The study was funded by the National Cancer Institute and the National Institute of Aging. Dr. Mosko has no relevant financial disclosures.
SOURCE: Dhaliwal L et al. Clin Gastro Hepatol. 2020 Jul 21. doi: 10.1016/j.cgh.2020.07.034.
FROM CLINICAL GASTROENTEROLOGY AND HEPATOLOGY
One measure of child COVID-19 may be trending downward
After increasing for several weeks, the proportion of new COVID-19 cases occurring in children has dropped for the second week in a row, according to data in a new report from the American Academy of Pediatrics and the Children’s Hospital Association.
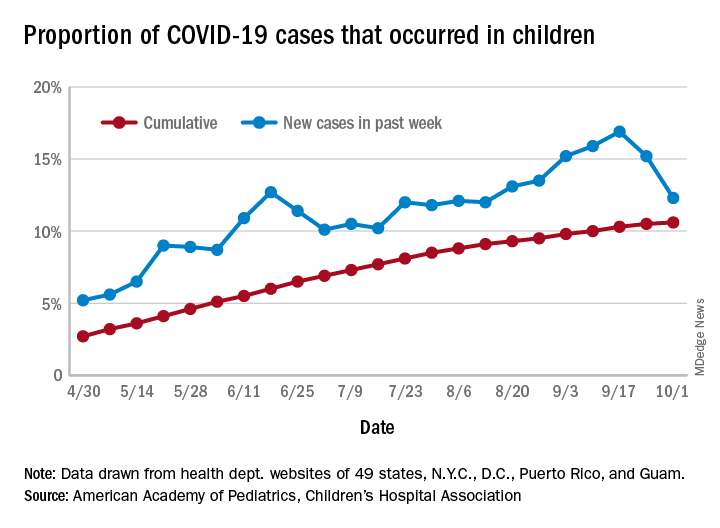
COVID-19 cases in children accounted for 12.3% of all new cases in the United States for the week ending Oct. 1, down from 15.2% the previous week. That measure had reached its highest point, 16.9%, just one week earlier (Sept. 17), the AAP and the CHA said in their weekly COVID-19 report.
based on data from the health departments of 49 states (New York does not provide ages on its website), as well as the District of Columbia, New York City, Puerto Rico, and Guam.
The child COVID-19 rate for the United States was 874 per 100,000 children as of Oct. 1, and that figure has doubled since the end of July. At the state level, the highest rates can be found in Tennessee (2,031.4 per 100,000), North Dakota (2,029.6), and South Carolina (2,002.6), with the lowest rates in Vermont (168.9), Maine (229.1), and New Hampshire (268.3), the AAP/CHA report shows.
The children of Wyoming make up the largest share, 22.4%, of any state’s COVID-19 cases, followed by North Dakota and Tennessee, both at 18.3%. New Jersey is lower than any other state at 3.9%, although New York City is a slightly lower 3.6%, the AAP and CHA said.
“The data are limited because the states differ in how they report the data, and it is unknown how many children have been infected but not tested. It is unclear how much of the increase in child cases is due to increased testing capacity,” the AAP said in an earlier statement.
After increasing for several weeks, the proportion of new COVID-19 cases occurring in children has dropped for the second week in a row, according to data in a new report from the American Academy of Pediatrics and the Children’s Hospital Association.
COVID-19 cases in children accounted for 12.3% of all new cases in the United States for the week ending Oct. 1, down from 15.2% the previous week. That measure had reached its highest point, 16.9%, just one week earlier (Sept. 17), the AAP and the CHA said in their weekly COVID-19 report.
based on data from the health departments of 49 states (New York does not provide ages on its website), as well as the District of Columbia, New York City, Puerto Rico, and Guam.
The child COVID-19 rate for the United States was 874 per 100,000 children as of Oct. 1, and that figure has doubled since the end of July. At the state level, the highest rates can be found in Tennessee (2,031.4 per 100,000), North Dakota (2,029.6), and South Carolina (2,002.6), with the lowest rates in Vermont (168.9), Maine (229.1), and New Hampshire (268.3), the AAP/CHA report shows.
The children of Wyoming make up the largest share, 22.4%, of any state’s COVID-19 cases, followed by North Dakota and Tennessee, both at 18.3%. New Jersey is lower than any other state at 3.9%, although New York City is a slightly lower 3.6%, the AAP and CHA said.
“The data are limited because the states differ in how they report the data, and it is unknown how many children have been infected but not tested. It is unclear how much of the increase in child cases is due to increased testing capacity,” the AAP said in an earlier statement.
Hidradenitis suppurativa therapy options should be patient guided
of their most challenging symptoms, according to an expert summary presented at the Skin of Color Update 2020.

“If your patient is only focused on the appearance of the lesions or the presence of sinus tracts, they might not think your treatment is working,” said Ginette A. Okoye, MD, professor and chair, department of dermatology, Howard University, Washington.
Instead, she advised working with patients to define priorities, allowing them to measure and appreciate improvement. The most difficult symptoms for one patient, such as pain or persistent abscess drainage, might not be the same for another.
There is a large array of treatment options for HS. These were once typically employed in stepwise manner, moving from steroids to hormonal therapies, antibiotics, and on to biologics and lasers, but Dr. Okoye reported that she layers on treatments, guided by patient priorities and responses. “Most of my patients are not on just one treatment at a time,” she said.
In addition to patient goals, her treatment choices are also influenced by the presence of comorbidities such as metabolic syndrome, polycystic ovarian syndrome (PCOS), or inflammatory bowel disease (IBD). For example, she reported she is more likely to include metformin among treatment options in patients with central obesity or insulin resistance, whereas she moves more quickly to a biologic for those with another systemic inflammatory disease such as IBD.
Although multiple factors appear to contribute to the symptoms of HS, the pathophysiology remains incompletely understood, but follicular occlusion is often “a primary inciting event,” Dr. Okoye said.
For this reason, laser hair removal can provide substantial benefit, she noted. Not only does it eliminate the occlusion, but the heat generated by the laser eliminates some of the pathogens, such as Porphyromonas gingivalis, associated with HS.
“Lasers work well for preventing new lesions from forming but also in making active lesions go away faster,” said Dr. Okoye, who relies on the Nd:YAG laser when treating this disease in darker skin. She has found lasers to be particularly effective in mild to moderate disease.
When using lasers, one challenge is third-party insurance, according to Dr. Okoye, who reported that she has tried repeatedly to convince payers that this treatment is medically indicated for HS, but claims have been routinely denied. As a result, she has had to significantly discount the cost of laser at her center in order to provide access to “a modality that actually works.”
Incision and drainage of inflamed painful lesions is a common intervention in HS, but Dr. Okoye discourages this approach. Because of the high recurrence rates, the benefits are temporary. Instead, she recommends an intralesional injection of triamcinolone acetonide diluted with equal amounts of lidocaine.
With this injection, “there is immediate pain relief followed by significant resolution of the inflammation,” she said. Because of the likelihood that patients seeking care in the emergency department for acutely inflamed lesions will receive surgical treatment, Dr. Okoye recommends offering patients urgent appointments for steroid injections when painful and inflamed lesions need immediate attention.
In contrast, marsupialization of abscesses or sinus tracts, often called deroofing, is associated with a relatively low risk of recurrence, can be done under local anesthesia in an office, and can lead to resolution of persistent nodules in patients with mild disease.
“This is an easy procedure that takes relatively little time,” advised Dr. Okoye, who provided CPT codes (10060 and 10061) that will provide reimbursement as long as procedural notes describe the rationale.
Metformin is an attractive adjunctive therapy for HS in patients with type 2 diabetes or features that suggest metabolic disturbances, such as central obesity, hypercholesterolemia, hypertension, or hypertriglyceridemia. It should also be considered in patients with PCOS because metformin decreases ovarian androgen production, she said.
When prescribing metformin in HS, which is an off-label indication, “I prefer the extended release formulation. It has a better profile in regard to gastrointestinal side effects and it can be taken once-daily,” Dr. Okoye said.
Citing a study that suggests patients with HS have even worse quality of life scores than do patients with diabetes, Dr. Okoye also emphasized the importance of psychosocial support and lifestyle modification as part of a holistic approach. With multiple manifestations of varying severity, individualizing therapy to control symptoms that the patient finds most bothersome is essential for optimizing patient well being.
Tien Viet Nguyen, MD, who practices dermatology and conducts clinical research in Bellevue, Wash., agrees that a comprehensive treatment program is needed. First author of a recent review article on HS, Dr. Nguyen agreed that common comorbidities like IBD, PCOS, and diabetes are accompanied frequently by a host of mental health and behavioral issues that contribute to impaired quality of life, such as depression, low self-esteem, sexual dysfunction, impaired sleep, and substance use disorders.
“Therefore, addressing these important comorbidities and quality of life issues with other health care professionals as a team is the best approach to improving health outcomes,” he said in an interview.
Dr. Nguyen also recently authored a chapter on quality of life issues associated with HS in the soon-to-be-published Comprehensive Guide to Hidradenitis Suppurativa (1st Edition, Dermatology Clinics). He agreed that optimal outcomes are achieved by an interdisciplinary team of health care providers who can address the sometimes independent but often interrelated comorbidities associated with this disorder.
Dr. Okoye has financial relationships with Pfizer and Unilver, but neither is relevant to this topic.
of their most challenging symptoms, according to an expert summary presented at the Skin of Color Update 2020.
“If your patient is only focused on the appearance of the lesions or the presence of sinus tracts, they might not think your treatment is working,” said Ginette A. Okoye, MD, professor and chair, department of dermatology, Howard University, Washington.
Instead, she advised working with patients to define priorities, allowing them to measure and appreciate improvement. The most difficult symptoms for one patient, such as pain or persistent abscess drainage, might not be the same for another.
There is a large array of treatment options for HS. These were once typically employed in stepwise manner, moving from steroids to hormonal therapies, antibiotics, and on to biologics and lasers, but Dr. Okoye reported that she layers on treatments, guided by patient priorities and responses. “Most of my patients are not on just one treatment at a time,” she said.
In addition to patient goals, her treatment choices are also influenced by the presence of comorbidities such as metabolic syndrome, polycystic ovarian syndrome (PCOS), or inflammatory bowel disease (IBD). For example, she reported she is more likely to include metformin among treatment options in patients with central obesity or insulin resistance, whereas she moves more quickly to a biologic for those with another systemic inflammatory disease such as IBD.
Although multiple factors appear to contribute to the symptoms of HS, the pathophysiology remains incompletely understood, but follicular occlusion is often “a primary inciting event,” Dr. Okoye said.
For this reason, laser hair removal can provide substantial benefit, she noted. Not only does it eliminate the occlusion, but the heat generated by the laser eliminates some of the pathogens, such as Porphyromonas gingivalis, associated with HS.
“Lasers work well for preventing new lesions from forming but also in making active lesions go away faster,” said Dr. Okoye, who relies on the Nd:YAG laser when treating this disease in darker skin. She has found lasers to be particularly effective in mild to moderate disease.
When using lasers, one challenge is third-party insurance, according to Dr. Okoye, who reported that she has tried repeatedly to convince payers that this treatment is medically indicated for HS, but claims have been routinely denied. As a result, she has had to significantly discount the cost of laser at her center in order to provide access to “a modality that actually works.”
Incision and drainage of inflamed painful lesions is a common intervention in HS, but Dr. Okoye discourages this approach. Because of the high recurrence rates, the benefits are temporary. Instead, she recommends an intralesional injection of triamcinolone acetonide diluted with equal amounts of lidocaine.
With this injection, “there is immediate pain relief followed by significant resolution of the inflammation,” she said. Because of the likelihood that patients seeking care in the emergency department for acutely inflamed lesions will receive surgical treatment, Dr. Okoye recommends offering patients urgent appointments for steroid injections when painful and inflamed lesions need immediate attention.
In contrast, marsupialization of abscesses or sinus tracts, often called deroofing, is associated with a relatively low risk of recurrence, can be done under local anesthesia in an office, and can lead to resolution of persistent nodules in patients with mild disease.
“This is an easy procedure that takes relatively little time,” advised Dr. Okoye, who provided CPT codes (10060 and 10061) that will provide reimbursement as long as procedural notes describe the rationale.
Metformin is an attractive adjunctive therapy for HS in patients with type 2 diabetes or features that suggest metabolic disturbances, such as central obesity, hypercholesterolemia, hypertension, or hypertriglyceridemia. It should also be considered in patients with PCOS because metformin decreases ovarian androgen production, she said.
When prescribing metformin in HS, which is an off-label indication, “I prefer the extended release formulation. It has a better profile in regard to gastrointestinal side effects and it can be taken once-daily,” Dr. Okoye said.
Citing a study that suggests patients with HS have even worse quality of life scores than do patients with diabetes, Dr. Okoye also emphasized the importance of psychosocial support and lifestyle modification as part of a holistic approach. With multiple manifestations of varying severity, individualizing therapy to control symptoms that the patient finds most bothersome is essential for optimizing patient well being.
Tien Viet Nguyen, MD, who practices dermatology and conducts clinical research in Bellevue, Wash., agrees that a comprehensive treatment program is needed. First author of a recent review article on HS, Dr. Nguyen agreed that common comorbidities like IBD, PCOS, and diabetes are accompanied frequently by a host of mental health and behavioral issues that contribute to impaired quality of life, such as depression, low self-esteem, sexual dysfunction, impaired sleep, and substance use disorders.
“Therefore, addressing these important comorbidities and quality of life issues with other health care professionals as a team is the best approach to improving health outcomes,” he said in an interview.
Dr. Nguyen also recently authored a chapter on quality of life issues associated with HS in the soon-to-be-published Comprehensive Guide to Hidradenitis Suppurativa (1st Edition, Dermatology Clinics). He agreed that optimal outcomes are achieved by an interdisciplinary team of health care providers who can address the sometimes independent but often interrelated comorbidities associated with this disorder.
Dr. Okoye has financial relationships with Pfizer and Unilver, but neither is relevant to this topic.
FROM SOC 2020
Expert offers tips for combining lasers and injectables on the same day
While if it involves the same area.
“Swelling from the laser can potentially make the toxin migrate and cause ptosis,” Arisa E. Ortiz, MD, said at the virtual annual Masters of Aesthetics Symposium. “Even though this is temporary, your patient’s not going to be very happy with you. I would separate these at least 1 day apart, and then you should be OK.”
When using a filler on the same day as a laser treatment, Dr. Ortiz, who is director of laser and cosmetic dermatology at the University of California, San Diego, performs the laser procedure after injecting the filler, “because you may get some swelling, which can distort your need for filler,” she said. “I like to do the filler first to make sure I can assess how much volume loss they have. Then I’ll do the laser procedure right after.”
Another general rule of thumb is that, when combining lasers on the same day, consider lowering the device settings, “because it’s going to be a more aggressive treatment when you’re combining various laser procedures,” she said. “Treat vascular lesions first to not exacerbate nonspecific erythema. Then treat pigment, then resurfacing, followed by liquid nitrogen if needed to treat seborrheic keratoses.”
For periorbital rejuvenation, Dr. Ortiz likes to use a neurotoxin 1 week before performing the laser-resurfacing or skin-tightening procedure, followed by injection of a filler. “This augments your results,” she said. “Studies have shown that, if you start with a neuromodulator, you can get more improvement with your resurfacing procedure,” she said. “That makes sense, because you’re not contracting the muscle while you’re healing from the laser, so you get more effective collagen remodeling.”
When using a neuromodulator for dynamic periorbital rhytides, place it superficially to avoid bruising and stay superior to the maxillary prominence to avoid the zygomaticus major “so you don’t get a droopy smile,” she said. “The approved dosing is 24 units, 12 on each side. Less may be required for younger patients and more for more severe rhytides.”
For static rhytides, fractional resurfacing procedures will provide a more modest result with less downtime, while fully ablative laser resurfacing procedures will provide more dramatic improvement with more downtime. “You’re really going to tailor your treatment to what the patient is looking for,” Dr. Ortiz said. “If you use a fractional device you may need multiple treatments. Using a corneal shield when you’re resurfacing within the periorbital rim is a must, so you need to know how to place these if you’re going to be resurfacing in that area.”
For anesthesia, Dr. Ortiz likes to use injectable lidocaine, “because if you use a topical it can creep into the eye, and then you get a chemical corneal abrasion. This resolves after a few days but it’s really painful and your patient won’t be very happy.”
For tear troughs, use a hyaluronic acid filler with a low G prime. “If you use a thicker filler it can look lumpy or too full,” she said. While some clinicians use a needle to administer the filler, Dr. Ortiz prefers to use a blunt-tipped cannula. “It’s less painful and there’s less risk of bruising or swelling,” she said. “There’s also less risk of cannulizing a vessel. This is not zero risk. It’s been shown that the 27-gauge can actually cannulize the vessel, so it shouldn’t give you a false sense of security, but there is less risk, compared with using a needle. You can use the cannula to thread. If you’re using a needle you can inject a bolus and then massage it in, or you can use the microdroplet technique.”
With the cannula technique, bruising or swelling can occur even in the most experienced hands, “so make sure your patients don’t have an important event coming up,” Dr. Ortiz said. “With filler, not only do you improve the volume loss, but sometimes you improve the dark circles. I tend to see this more in lighter-skinned patients. In darker-skinned patients, the dark circles can be caused by racial pigmentation. That’s hard to fix, so I never promise that we can improve dark circles, but sometimes it does improve.”
For dynamic perioral rhytides, Dr. Ortiz generally treats with a neuromodulator 1 week in advance of laser resurfacing, followed by a filler for any etched-in lines. Use of a neuromodulator in the perioral region of musicians or singers is contraindicated “because it can affect their phonation,” she said. “Also, older patients might complain that it’s difficult for them to pucker their lips when they’re putting on a lip liner or lipstick. There are four injection sites on the upper lip and two on the lower lip. I do 1 unit at each injection site, with a max of 6-8 units. Any more than that and they’ll have difficulty puckering.”
Two main options for treating submental fullness include cryolipolysis or deoxycholic acid. “If you have a lot of volume, you want to use cryolipolysis,” Dr. Ortiz said. “The general rule is, if it fits in the cup [of the applicator], hook them up.” Use deoxycholic acid for areas of smaller volume, or to fine-tune, she added.
For platysmal bands, Dr. Ortiz favors injecting 2 units of botulinum toxin at three to four sites along the band. She pulls away and injects superficially and limits the treatment dose to 40 units in one session “because excessive doses can cause dysphagia,” she said. “If they need additional units, I’ll have them come back in 2 weeks.”
The Nefertiti lift combines the treatment of the platysma with the insertion point of the platysma along the jawline. Treatment of the patient along the lateral jawline with 2 units of botulinum toxin every centimeter or so can actually improve the definition of the jawline, “because your platysma is pulling down on your lower face,” Dr. Ortiz explained. “So, if you relax that, it can help to define the jawline. By treating the platysma, you can also prevent or soften the horizontal bands that occur across the neck.”
For necklace creases, she likes to inject 1-2 units of a low-HA filler along the crease – evenly spaced all along. “I’ll dilute it even further with 0.5 cc of lidocaine with epinephrine,” she said. “Then you can do serial punctures or you can thread along that line.”
For treating static rhytides on the neck, laser-resurfacing procedures work best, but at low settings. “Because there are fewer adnexal structures, the neck is at increased risk for scarring,” Dr. Ortiz said. “You want to use a lower fluence because your neck skin is thin. Your fluence determines your depth with resurfacing. Most importantly, use a lower density for a more conservative setting”
Options for treating poikiloderma of Civatte include the vascular laser, an IPL [intense pulsed light device], or a 1927-nm thulium laser. To avoid footprinting, or a “chicken wire” appearance to the treated area, Dr. Ortiz recommends using a large spot size with the pulsed dye laser or the IPL.
She concluded her presentation by underscoring the importance of communicating realistic expectations with patients. “There is some delayed gratification here,” she said. “For procedures that take time to see results, consider adding another procedure that will give them immediate results.”
Dr. Ortiz disclosed having financial relationships with numerous pharmaceutical and device companies. She is also cochair of the MOA.
EXPERT ANALYSIS FROM MOA 2020
Medical Communities Go Virtual
Throughout history, physicians have formed communities to aid in the dissemination of knowledge, skills, and professional norms. From local physician groups to international societies and conferences, this drive to connect with members of our profession across the globe is timeless. We do so to learn from each other and continue to move the field of medicine forward.
Yet, these communities are being strained by necessary physical distancing required during the COVID-19 pandemic. Many physicians accustomed to a sense of community are now finding themselves surprisingly isolated and alone. Into this distanced landscape, however, new digital groups—specifically social media (SoMe), online learning communities, and virtual conferences—have emerged. We are all active members in virtual communities; all of the authors are team members of The Clinical Problem Solvers podcast and one author of this paper, A.P., has previously served as the medical education lead for the Human Diagnosis Project. Both entities are described later in this article. Here, we provide an overview of these virtual communities and discuss how they have the potential to more equitably and effectively disseminate medical knowledge and education both during and after the COVID-19 pandemic (Table).

SOCIAL MEDIA
Even prior to the COVID-19 pandemic, SoMe—especially Twitter—had become a virtual gathering place where digital colleagues exchange Twitter handles like business cards.1,2 They celebrate each other’s achievements and provide support during difficult times.
Importantly, the format of Twitter tends toward a flattened hierarchy. It is this egalitarian nature that has served SoMe well in its position as a modern learning community. Users from across the experience spectrum engage with and create novel educational content. This often occurs in the form of Tweetorials, or short lessons conveyed over a series of linked tweets. These have gained immense popularity on the platform and are becoming increasingly recognized forms of scholarship.3 Further, case-based lessons have become ubiquitous and are valuable opportunities for users to learn from other members of their digital communities. During the current pandemic, SoMe has become extremely important in the early dissemination and critique of the slew of research on the COVID-19 crisis.4
Beyond its role as an educational platform, SoMe functions as a virtual gathering place for members of the medical community to discuss topics relevant to the field. Subspecialists and researchers have gathered in digital journal clubs (eg, #NephJC, #IDJClub, #BloodandBone) and a number of journals have hosted live Twitter chats covering topics like controversies in clinical practice or professional development (eg, #JHMChat). More recently, social issues affecting the medical field, such as gender equity and the growing antiracism movement, have led to robust discussion on this medium.
Beyond Twitter, many medical professionals gather and exchange ideas on other platforms. Virtual networking and educational groups have arisen using Slack and Facebook.5-7 Trainees and faculty members alike consume and produce content on YouTube, which often serve to teach technical skills.8 Given widespread use of SoMe, we anticipate that the range of platforms utilized by medical professionals will continue to expand in the future.
ONLINE LEARNING COMMUNITIES
There have long existed multiple print and online forums dedicated to the development of clinical skills. These include clinical challenges in medical journals, interactive online cases, and more formal diagnostic education curricula at academic centers.9-11 With the COVID-19 pandemic, it has become more difficult to ensure that trainees have an in-person learning community to discuss and receive feedback. This has led to a wider adoption of application-based clinical exercises, educational podcasts, and curricular innovations to support these virtual efforts.
The Human Diagnosis Project (Human Dx) is a smart-phone application that provides a platform for individuals to submit clinical cases that can be rapidly peer-reviewed and disseminated to the larger user pool. Human Dx is notable for fostering a strong sense of community amongst its users.12,13 Case consumers and case creators are able to engage in further discussion after solving a case, and opportunities for feedback and growth are ample.
Medical education podcasts have taken on greater importance during the pandemic.14,15 Many educators have begun referring their learners towards certain podcasts as in-person learning communities have been put on hold. Medical professionals may appreciate the up-to-date and candid conversations held on many podcasts, which can provide both educationally useful and emotionally sympathetic connections to their distanced peers. Similarly, while academic clinicians previously benefitted from invited grand rounds speakers, they may now find that such expert discussants are most easily accessible through their appearances on podcasts.
As institutions suspended clerkships during the pandemic, many created virtual communities for trainees to engage in diagnostic reasoning and education. They built novel curricula that meld asynchronous learning with online community-based learning.14 Gamified learning tools and quizzes have also been incorporated into these hybrid curricula to help ensure participation of learners within their virtual communities.16,17
VIRTUAL CONFERENCES
Perhaps the most notable advance in digital communities catalyzed by the COVID-19 pandemic has been the increasing reliance on and comfort with video-based software. While many of our clinical, administrative, and social activities have migrated toward these virtual environments, they have also been used for a variety of activities related to education and professional development.
As institutions struggled to adapt to physical distancing, many medical schools and residency programs have moved their regular meetings and conferences to virtual platforms. Similar free and open-access conferences have also emerged, including the “Virtual Morning Report” (VMR) series from The Clinical Problem Solvers podcast, wherein a few individuals are invited to discuss a case on the video conference, with the remainder of the audience contributing via the chat feature.
Beyond the growing popularity of video conferencing for education, these virtual sessions have become their own community. On The Clinical Problem Solvers VMR, many participants, ranging from preclinical students to seasoned attendings, show up on a daily basis and interact with each other as close friends, as do members of more insular institutional sessions (eg, residency run reports). In these strangely isolating times, many of us have experienced comfort in seeing the faces of our friends and colleagues joining us to listen and discuss cases.
Separately, many professional societies have struggled with how to replace their large yearly in-person conferences, which would pose substantial infectious risks were they to be held in person. While many of those scheduled to occur during the early days of the pandemic were canceled or held limited online sessions, the trend towards virtual conference platforms seems to be accelerating. Organizers of the 2020 Conference on Retroviruses and Opportunistic Infections (March 8-11, 2020) decided to convert from an in-person to entirely virtual conference 48 hours before it started. With the benefit of more forewarning, other conferences are planning and exploring best practices to promote networking and advancement of research goals at future academic meetings.18,19
BENEFITS OF VIRTUAL COMMUNITIES
The growing importance of these new digital communities could be viewed as a necessary evolution in the way that we gather and learn from each other. Traditional physician communities were inherently restricted by location, specialty, and hierarchy, thereby limiting the dissemination of knowledge and changes to professional norms. These restrictions could conceivably insulate and promote elite institutions in a fashion that perpetuates the inequalities within global medical systems. Unrestricted and open-access virtual communities, in contrast, have the potential to remove historical barriers and connect first-class mentors with trainees they would never have met otherwise.
Beyond promoting a more equitable distribution of knowledge and resources, these virtual communities are well suited to harness the benefits of group learning. The concept of communities of practice (CoP) refers to groupings of individuals involved in a personal or professional endeavor, with the community facilitating advancement of their own knowledge and skill set. Members of the CoP learn from each other, with more established members passing down essential knowledge and cultural norms. The three main components of CoP are maintaining a social network, a mutual enterprise (eg, a common goal), and a shared repertoire (eg, experiences, languages, etc).
Designing virtual learning spaces with these aspects in mind may allow these communities to function as CoPs. Some strategies include use of chat functions in videoconferences (to promote further dialogue) and development of dedicated sessions for specific subgroups or aims (eg, professional mentorship). The anticipated benefits of integrating virtual CoPs into medical education are notable, as a number of studies have already suggested that they are effective for disseminating knowledge, enhancing social learning, and aiding with professional development.7,20-23 These virtual CoPs continue to evolve, however, and further research is warranted to clarify how best to utilize them in medical education and professional societies.
CONCLUSION
Amidst the tragic loss of lives and financial calamity, the COVID-19 pandemic has also spurred innovation and change in the way health professionals learn and communicate. Going forward, the medical establishment should capitalize on these recent innovations and work to further build, recognize, and foster such digital gathering spaces in order to more equitably and effectively disseminate knowledge and educational resources.
Despite physical distancing, health professionals have grown closer during these past few months. Innovations spurred by the pandemic have made us stronger and more united. Our experience with social media, online learning communities, and virtual conferences suggests the opportunity to grow and evolve from this experience. As Anthony Fauci, MD, director of the National Institute of Allergy and Infectious Diseases, said in March 2020, “...life is not going to be how it used to be [after the pandemic]…” Let’s hope he’s right.
ACKNOWLEDGMENTS
We thank Reza Manesh, MD, Rabih Geha, MD, and Jack Penner, MD, for their careful review of the manuscript.
1. Markham MJ, Gentile D, Graham DL. Social media for networking, professional development, and patient engagement. Am Soc Clin Oncol Educ Book. 2017;37:782-787. https://doi.org/10.1200/EDBK_180077
2. Melvin L, Chan T. Using Twitter in clinical education and practice. J Grad Med Educ. 2014;6(3):581-582. https://doi.org/10.4300/JGME-D-14-00342.1
3. Breu AC. Why is a cow? Curiosity, Tweetorials, and the return to why. N Engl J Med. 2019;381(12):1097-1098. https://doi.org/10.1056/NEJMp1906790
4. Chan AKM, Nickson CP, Rudolph JW, Lee A, Joynt GM. Social media for rapid knowledge dissemination: early experience from the COVID-19 pandemic. Anaesthesia. 2020:10.1111/anae.15057. https://doi.org/10.1111/anae.15057
5. Pander T, Pinilla S, Dimitriadis K, Fischer MR. The use of Facebook in medical education--a literature review. GMS Z Med Ausbild. 2014;31(3):Doc33. https://doi.org/10.3205/zma000925
6. Cree-Green M, Carreau AM, Davis SM, et al. Peer mentoring for professional and personal growth in academic medicine. J Investig Med. 2020;68(6):1128-1134. https://doi.org/10.1136/jim-2020-001391
7. Yarris LM, Chan TM, Gottlieb M, Juve AM. Finding your people in the digital age: virtual communities of practice to promote education scholarship. J Grad Med Educ. 2019;11(1):1-5. https://doi.org/10.4300/JGME-D-18-01093.1
8. Sterling M, Leung P, Wright D, Bishop TF. The use of social media in graduate medical education: a systematic review. Acad Med. 2017;92(7):1043-1056. https://doi.org/10.1097/ACM.0000000000001617
9. Manesh R, Dhaliwal G. Digital tools to enhance clinical reasoning. Med Clin North Am. 2018;102(3):559-565. https://doi.org/10.1016/j.mcna.2017.12.015
10. Subramanian A, Connor DM, Berger G, et al. A curriculum for diagnostic reasoning: JGIM’s exercises in clinical reasoning. J Gen Intern Med. 2019;34(3):344-345. https://doi.org/10.1007/s11606-018-4689-y
11. Olson APJ, Singhal G, Dhaliwal G. Diagnosis education - an emerging field. Diagnosis (Berl). 2019;6(2):75-77. https://doi.org/10.1515/dx-2019-0029
12. Chatterjee S, Desai S, Manesh R, Sun J, Nundy S, Wright SM. Assessment of a simulated case-based measurement of physician diagnostic performance. JAMA Netw Open. 2019;2(1):e187006. https://doi.org/10.1001/jamanetworkopen.2018.7006
13. Russell SW, Desai SV, O’Rourke P, et al. The genealogy of teaching clinical reasoning and diagnostic skill: the GEL Study. Diagnosis (Berl). 2020;7(3):197-203. https://doi.org/10.1515/dx-2019-0107
14. Geha R, Dhaliwal G. Pilot virtual clerkship curriculum during the COVID-19 pandemic: podcasts, peers, and problem-solving. Med Educ. 2020;54(9):855-856. https://doi.org/10.1111/medu.14246
15. AlGaeed M, Grewal M, Richardson PK, Leon Guerrero CR. COVID-19: Neurology residents’ perspective. J Clin Neurosci. 2020;78:452-453. https://doi.org/10.1016/j.jocn.2020.05.032
16. Moro C, Stromberga Z. Enhancing variety through gamified, interactive learning experiences. Med Educ. 2020. Online ahead of print. https://doi.org/10.1111/medu.14251
17. Morawo A, Sun C, Lowden M. Enhancing engagement during live virtual learning using interactive quizzes. Med Educ. 2020. Online ahead of print. https://doi.org/10.1111/medu.14253
18. Rubinger L, Gazendam A, Ekhtiari S, et al. Maximizing virtual meetings and conferences: a review of best practices. Int Orthop. 2020;44(8):1461-1466. https://doi.org/10.1007/s00264-020-04615-9
19. Woolston C. Learning to love virtual conferences in the coronavirus era. Nature. 2020;582(7810):135-136. https://doi.org/10.1038/d41586-020-01489-0
20. Cruess RL, Cruess SR, Steinert Y. Medicine as a community of practice: implications for medical education. Acad Med. 2018;93(2):185-191. https://doi.org/10.1097/ACM.0000000000001826
21. McLoughlin C, Patel KD, O’Callaghan T, Reeves S. The use of virtual communities of practice to improve interprofessional collaboration and education: findings from an integrated review. J Interprof Care. 2018;32(2):136-142. https://doi.org/10.1080/13561820.2017.1377692
22. Barnett S, Jones SC, Caton T, Iverson D, Bennett S, Robinson L. Implementing a virtual community of practice for family physician training: a mixed-methods case study. J Med Internet Res. 2014;16(3):e83. https://doi.org/10.2196/jmir.3083
23. Healy MG, Traeger LN, Axelsson CGS, et al. NEJM Knowledge+ Question of the Week: a novel virtual learning community effectively utilizing an online discussion forum. Med Teach. 2019;41(11):1270-1276. https://doi.org/10.1080/0142159X.2019.1635685
Throughout history, physicians have formed communities to aid in the dissemination of knowledge, skills, and professional norms. From local physician groups to international societies and conferences, this drive to connect with members of our profession across the globe is timeless. We do so to learn from each other and continue to move the field of medicine forward.
Yet, these communities are being strained by necessary physical distancing required during the COVID-19 pandemic. Many physicians accustomed to a sense of community are now finding themselves surprisingly isolated and alone. Into this distanced landscape, however, new digital groups—specifically social media (SoMe), online learning communities, and virtual conferences—have emerged. We are all active members in virtual communities; all of the authors are team members of The Clinical Problem Solvers podcast and one author of this paper, A.P., has previously served as the medical education lead for the Human Diagnosis Project. Both entities are described later in this article. Here, we provide an overview of these virtual communities and discuss how they have the potential to more equitably and effectively disseminate medical knowledge and education both during and after the COVID-19 pandemic (Table).
SOCIAL MEDIA
Even prior to the COVID-19 pandemic, SoMe—especially Twitter—had become a virtual gathering place where digital colleagues exchange Twitter handles like business cards.1,2 They celebrate each other’s achievements and provide support during difficult times.
Importantly, the format of Twitter tends toward a flattened hierarchy. It is this egalitarian nature that has served SoMe well in its position as a modern learning community. Users from across the experience spectrum engage with and create novel educational content. This often occurs in the form of Tweetorials, or short lessons conveyed over a series of linked tweets. These have gained immense popularity on the platform and are becoming increasingly recognized forms of scholarship.3 Further, case-based lessons have become ubiquitous and are valuable opportunities for users to learn from other members of their digital communities. During the current pandemic, SoMe has become extremely important in the early dissemination and critique of the slew of research on the COVID-19 crisis.4
Beyond its role as an educational platform, SoMe functions as a virtual gathering place for members of the medical community to discuss topics relevant to the field. Subspecialists and researchers have gathered in digital journal clubs (eg, #NephJC, #IDJClub, #BloodandBone) and a number of journals have hosted live Twitter chats covering topics like controversies in clinical practice or professional development (eg, #JHMChat). More recently, social issues affecting the medical field, such as gender equity and the growing antiracism movement, have led to robust discussion on this medium.
Beyond Twitter, many medical professionals gather and exchange ideas on other platforms. Virtual networking and educational groups have arisen using Slack and Facebook.5-7 Trainees and faculty members alike consume and produce content on YouTube, which often serve to teach technical skills.8 Given widespread use of SoMe, we anticipate that the range of platforms utilized by medical professionals will continue to expand in the future.
ONLINE LEARNING COMMUNITIES
There have long existed multiple print and online forums dedicated to the development of clinical skills. These include clinical challenges in medical journals, interactive online cases, and more formal diagnostic education curricula at academic centers.9-11 With the COVID-19 pandemic, it has become more difficult to ensure that trainees have an in-person learning community to discuss and receive feedback. This has led to a wider adoption of application-based clinical exercises, educational podcasts, and curricular innovations to support these virtual efforts.
The Human Diagnosis Project (Human Dx) is a smart-phone application that provides a platform for individuals to submit clinical cases that can be rapidly peer-reviewed and disseminated to the larger user pool. Human Dx is notable for fostering a strong sense of community amongst its users.12,13 Case consumers and case creators are able to engage in further discussion after solving a case, and opportunities for feedback and growth are ample.
Medical education podcasts have taken on greater importance during the pandemic.14,15 Many educators have begun referring their learners towards certain podcasts as in-person learning communities have been put on hold. Medical professionals may appreciate the up-to-date and candid conversations held on many podcasts, which can provide both educationally useful and emotionally sympathetic connections to their distanced peers. Similarly, while academic clinicians previously benefitted from invited grand rounds speakers, they may now find that such expert discussants are most easily accessible through their appearances on podcasts.
As institutions suspended clerkships during the pandemic, many created virtual communities for trainees to engage in diagnostic reasoning and education. They built novel curricula that meld asynchronous learning with online community-based learning.14 Gamified learning tools and quizzes have also been incorporated into these hybrid curricula to help ensure participation of learners within their virtual communities.16,17
VIRTUAL CONFERENCES
Perhaps the most notable advance in digital communities catalyzed by the COVID-19 pandemic has been the increasing reliance on and comfort with video-based software. While many of our clinical, administrative, and social activities have migrated toward these virtual environments, they have also been used for a variety of activities related to education and professional development.
As institutions struggled to adapt to physical distancing, many medical schools and residency programs have moved their regular meetings and conferences to virtual platforms. Similar free and open-access conferences have also emerged, including the “Virtual Morning Report” (VMR) series from The Clinical Problem Solvers podcast, wherein a few individuals are invited to discuss a case on the video conference, with the remainder of the audience contributing via the chat feature.
Beyond the growing popularity of video conferencing for education, these virtual sessions have become their own community. On The Clinical Problem Solvers VMR, many participants, ranging from preclinical students to seasoned attendings, show up on a daily basis and interact with each other as close friends, as do members of more insular institutional sessions (eg, residency run reports). In these strangely isolating times, many of us have experienced comfort in seeing the faces of our friends and colleagues joining us to listen and discuss cases.
Separately, many professional societies have struggled with how to replace their large yearly in-person conferences, which would pose substantial infectious risks were they to be held in person. While many of those scheduled to occur during the early days of the pandemic were canceled or held limited online sessions, the trend towards virtual conference platforms seems to be accelerating. Organizers of the 2020 Conference on Retroviruses and Opportunistic Infections (March 8-11, 2020) decided to convert from an in-person to entirely virtual conference 48 hours before it started. With the benefit of more forewarning, other conferences are planning and exploring best practices to promote networking and advancement of research goals at future academic meetings.18,19
BENEFITS OF VIRTUAL COMMUNITIES
The growing importance of these new digital communities could be viewed as a necessary evolution in the way that we gather and learn from each other. Traditional physician communities were inherently restricted by location, specialty, and hierarchy, thereby limiting the dissemination of knowledge and changes to professional norms. These restrictions could conceivably insulate and promote elite institutions in a fashion that perpetuates the inequalities within global medical systems. Unrestricted and open-access virtual communities, in contrast, have the potential to remove historical barriers and connect first-class mentors with trainees they would never have met otherwise.
Beyond promoting a more equitable distribution of knowledge and resources, these virtual communities are well suited to harness the benefits of group learning. The concept of communities of practice (CoP) refers to groupings of individuals involved in a personal or professional endeavor, with the community facilitating advancement of their own knowledge and skill set. Members of the CoP learn from each other, with more established members passing down essential knowledge and cultural norms. The three main components of CoP are maintaining a social network, a mutual enterprise (eg, a common goal), and a shared repertoire (eg, experiences, languages, etc).
Designing virtual learning spaces with these aspects in mind may allow these communities to function as CoPs. Some strategies include use of chat functions in videoconferences (to promote further dialogue) and development of dedicated sessions for specific subgroups or aims (eg, professional mentorship). The anticipated benefits of integrating virtual CoPs into medical education are notable, as a number of studies have already suggested that they are effective for disseminating knowledge, enhancing social learning, and aiding with professional development.7,20-23 These virtual CoPs continue to evolve, however, and further research is warranted to clarify how best to utilize them in medical education and professional societies.
CONCLUSION
Amidst the tragic loss of lives and financial calamity, the COVID-19 pandemic has also spurred innovation and change in the way health professionals learn and communicate. Going forward, the medical establishment should capitalize on these recent innovations and work to further build, recognize, and foster such digital gathering spaces in order to more equitably and effectively disseminate knowledge and educational resources.
Despite physical distancing, health professionals have grown closer during these past few months. Innovations spurred by the pandemic have made us stronger and more united. Our experience with social media, online learning communities, and virtual conferences suggests the opportunity to grow and evolve from this experience. As Anthony Fauci, MD, director of the National Institute of Allergy and Infectious Diseases, said in March 2020, “...life is not going to be how it used to be [after the pandemic]…” Let’s hope he’s right.
ACKNOWLEDGMENTS
We thank Reza Manesh, MD, Rabih Geha, MD, and Jack Penner, MD, for their careful review of the manuscript.
1. Markham MJ, Gentile D, Graham DL. Social media for networking, professional development, and patient engagement. Am Soc Clin Oncol Educ Book. 2017;37:782-787. https://doi.org/10.1200/EDBK_180077
2. Melvin L, Chan T. Using Twitter in clinical education and practice. J Grad Med Educ. 2014;6(3):581-582. https://doi.org/10.4300/JGME-D-14-00342.1
3. Breu AC. Why is a cow? Curiosity, Tweetorials, and the return to why. N Engl J Med. 2019;381(12):1097-1098. https://doi.org/10.1056/NEJMp1906790
4. Chan AKM, Nickson CP, Rudolph JW, Lee A, Joynt GM. Social media for rapid knowledge dissemination: early experience from the COVID-19 pandemic. Anaesthesia. 2020:10.1111/anae.15057. https://doi.org/10.1111/anae.15057
5. Pander T, Pinilla S, Dimitriadis K, Fischer MR. The use of Facebook in medical education--a literature review. GMS Z Med Ausbild. 2014;31(3):Doc33. https://doi.org/10.3205/zma000925
6. Cree-Green M, Carreau AM, Davis SM, et al. Peer mentoring for professional and personal growth in academic medicine. J Investig Med. 2020;68(6):1128-1134. https://doi.org/10.1136/jim-2020-001391
7. Yarris LM, Chan TM, Gottlieb M, Juve AM. Finding your people in the digital age: virtual communities of practice to promote education scholarship. J Grad Med Educ. 2019;11(1):1-5. https://doi.org/10.4300/JGME-D-18-01093.1
8. Sterling M, Leung P, Wright D, Bishop TF. The use of social media in graduate medical education: a systematic review. Acad Med. 2017;92(7):1043-1056. https://doi.org/10.1097/ACM.0000000000001617
9. Manesh R, Dhaliwal G. Digital tools to enhance clinical reasoning. Med Clin North Am. 2018;102(3):559-565. https://doi.org/10.1016/j.mcna.2017.12.015
10. Subramanian A, Connor DM, Berger G, et al. A curriculum for diagnostic reasoning: JGIM’s exercises in clinical reasoning. J Gen Intern Med. 2019;34(3):344-345. https://doi.org/10.1007/s11606-018-4689-y
11. Olson APJ, Singhal G, Dhaliwal G. Diagnosis education - an emerging field. Diagnosis (Berl). 2019;6(2):75-77. https://doi.org/10.1515/dx-2019-0029
12. Chatterjee S, Desai S, Manesh R, Sun J, Nundy S, Wright SM. Assessment of a simulated case-based measurement of physician diagnostic performance. JAMA Netw Open. 2019;2(1):e187006. https://doi.org/10.1001/jamanetworkopen.2018.7006
13. Russell SW, Desai SV, O’Rourke P, et al. The genealogy of teaching clinical reasoning and diagnostic skill: the GEL Study. Diagnosis (Berl). 2020;7(3):197-203. https://doi.org/10.1515/dx-2019-0107
14. Geha R, Dhaliwal G. Pilot virtual clerkship curriculum during the COVID-19 pandemic: podcasts, peers, and problem-solving. Med Educ. 2020;54(9):855-856. https://doi.org/10.1111/medu.14246
15. AlGaeed M, Grewal M, Richardson PK, Leon Guerrero CR. COVID-19: Neurology residents’ perspective. J Clin Neurosci. 2020;78:452-453. https://doi.org/10.1016/j.jocn.2020.05.032
16. Moro C, Stromberga Z. Enhancing variety through gamified, interactive learning experiences. Med Educ. 2020. Online ahead of print. https://doi.org/10.1111/medu.14251
17. Morawo A, Sun C, Lowden M. Enhancing engagement during live virtual learning using interactive quizzes. Med Educ. 2020. Online ahead of print. https://doi.org/10.1111/medu.14253
18. Rubinger L, Gazendam A, Ekhtiari S, et al. Maximizing virtual meetings and conferences: a review of best practices. Int Orthop. 2020;44(8):1461-1466. https://doi.org/10.1007/s00264-020-04615-9
19. Woolston C. Learning to love virtual conferences in the coronavirus era. Nature. 2020;582(7810):135-136. https://doi.org/10.1038/d41586-020-01489-0
20. Cruess RL, Cruess SR, Steinert Y. Medicine as a community of practice: implications for medical education. Acad Med. 2018;93(2):185-191. https://doi.org/10.1097/ACM.0000000000001826
21. McLoughlin C, Patel KD, O’Callaghan T, Reeves S. The use of virtual communities of practice to improve interprofessional collaboration and education: findings from an integrated review. J Interprof Care. 2018;32(2):136-142. https://doi.org/10.1080/13561820.2017.1377692
22. Barnett S, Jones SC, Caton T, Iverson D, Bennett S, Robinson L. Implementing a virtual community of practice for family physician training: a mixed-methods case study. J Med Internet Res. 2014;16(3):e83. https://doi.org/10.2196/jmir.3083
23. Healy MG, Traeger LN, Axelsson CGS, et al. NEJM Knowledge+ Question of the Week: a novel virtual learning community effectively utilizing an online discussion forum. Med Teach. 2019;41(11):1270-1276. https://doi.org/10.1080/0142159X.2019.1635685
© 2020 Society of Hospital Medicine
Hyperpigmented patch on the back

Large unilateral hyperpigmented patches on the trunk with onset around puberty are the hallmark of a Becker nevus, also more descriptively called pigmented hairy epidermal nevus.
Becker nevi are a form of epidermal nevus that usually occur on the upper back or chest. They most commonly develop during puberty when there are increasing circulating levels of androgens. (Becker nevus cells are androgen sensitive.) This is consistent with this patient’s history of the lesion developing in her teens when the lesions become hyperpigmented and noticeable. The localized androgen sensitivity also can lead to unilateral hypoplastic breast growth when it occurs on the chest in young women.
The lesions are more common in males than females and often have associated hypertrichosis. The etiology is not certain but is thought to be due to regional loss of heterozygosity during embryogenesis leading to the abnormally elevated levels of androgen receptors and increased androgen sensitivity in the basal keratinocytes and dermal fibroblasts.
Laser is the most effective therapy for the hyperpigmentation and for hypertrichosis when present. If a young woman with a Becker nevus has breast hypoplasia, spironolactone (an antiandrogen) has been helpful in restoring breast growth. For this patient, the hyperpigmented patch was asymptomatic and not troublesome, so she opted not to treat it.
Photo and text courtesy of Daniel Stulberg, MD, FAAFP, Department of Family and Community Medicine, University of New Mexico School of Medicine, Albuquerque.
Patel P, Malik K, Khachemoune A. Sebaceus and Becker’s nevus: overview of their presentation, pathogenesis, associations, and treatment. Am J Clin Dermatol. 2015;16:197-204.
Large unilateral hyperpigmented patches on the trunk with onset around puberty are the hallmark of a Becker nevus, also more descriptively called pigmented hairy epidermal nevus.
Becker nevi are a form of epidermal nevus that usually occur on the upper back or chest. They most commonly develop during puberty when there are increasing circulating levels of androgens. (Becker nevus cells are androgen sensitive.) This is consistent with this patient’s history of the lesion developing in her teens when the lesions become hyperpigmented and noticeable. The localized androgen sensitivity also can lead to unilateral hypoplastic breast growth when it occurs on the chest in young women.
The lesions are more common in males than females and often have associated hypertrichosis. The etiology is not certain but is thought to be due to regional loss of heterozygosity during embryogenesis leading to the abnormally elevated levels of androgen receptors and increased androgen sensitivity in the basal keratinocytes and dermal fibroblasts.
Laser is the most effective therapy for the hyperpigmentation and for hypertrichosis when present. If a young woman with a Becker nevus has breast hypoplasia, spironolactone (an antiandrogen) has been helpful in restoring breast growth. For this patient, the hyperpigmented patch was asymptomatic and not troublesome, so she opted not to treat it.
Photo and text courtesy of Daniel Stulberg, MD, FAAFP, Department of Family and Community Medicine, University of New Mexico School of Medicine, Albuquerque.
Patel P, Malik K, Khachemoune A. Sebaceus and Becker’s nevus: overview of their presentation, pathogenesis, associations, and treatment. Am J Clin Dermatol. 2015;16:197-204.
Patel P, Malik K, Khachemoune A. Sebaceus and Becker’s nevus: overview of their presentation, pathogenesis, associations, and treatment. Am J Clin Dermatol. 2015;16:197-204.

CMS gives hospitals 14 weeks to start daily COVID, flu reports
The federal government is giving hospitals 14 weeks to comply with daily reporting requirements for COVID-19.
The Centers for Medicare & Medicaid Services will send letters on October 7 to all 6,200 hospitals that receive reimbursement from the two federal health programs informing them of how well they are doing now, said CMS Administrator Seema Verma on a press call.
Verma would not give an estimate on how many hospitals are currently not compliant. But Deborah Birx, MD, a member of the White House Coronavirus Task Force, said on the call that 86% of hospitals are currently reporting daily.
Federal officials on the call also announced that hospitals would have the option to begin reporting certain data on influenza starting October 19, but that it would become mandatory a few weeks later.
The reporting is important “to really ensure that we’re triangulating all data to understand where this epidemic is, how it’s moving through different populations, and ensuring that we’re meeting the needs of specific hospitals and communities,” Birx said.
The federal government began a new hospital reporting system in April but did not require hospitals to participate until it quietly issued guidance in mid-July informing facilities that they should no longer report to the Centers for Disease Control and Prevention (CDC).
The move perplexed many public health experts and epidemiologists, who expressed concern that asking hospitals to use a new data system during a pandemic could result in delays and lost information. The new HHS data collection site, HHS Protect, is being managed by a private contractor, not the CDC, which also raised alarms.
The final CMS rule issued in August went into effect immediately, without any chance for comment or revision. CMS said at the time that the pandemic was reason enough to skip over the normal bureaucratic process.
Hospitals were not pleased. But Verma claimed that since then CMS had been working with hospital organizations on enforcement.
“We’re going to do everything we can to facilitate reporting, including an enforcement timeline that will provide hospitals ample opportunity to come into compliance,” she said.
Hospitals that do not comply will get a notice every 3 weeks. Three weeks after the second notice, they’ll get weekly notices for a month, and a final termination notice at 14 weeks.
The Federation of American Hospitals (FAH), however, said their members were still not happy. “It is both inappropriate and frankly overkill for CMS to tie compliance with reporting to Medicare conditions of participation,” said FAH President and CEO Chip Kahn in a statement. He called the CMS proposal “sledgehammer enforcement,” and said that the continuing data request might weaken hospitals’ response to the pandemic because it would divert time and money away from patient care.
Rick Pollack, president and CEO of the American Hospital Association called the CMS rule an “overly heavy-handed approach that could jeopardize access to hospital care for all Americans.” He noted in a statement that barring hospitals from Medicare and Medicaid could harm beneficiaries and the effort to provide COVID care.
Pollack also noted that AHA has “observed errors in data processing and confusion about exactly what was being requested at the hospital, state, contractor, and federal level, and has worked diligently with the federal agencies to identify and correct those problems.”
The document that lays out U.S. Department of Health and Human Services (HHS) Protect reporting requirements were updated again on October 6 to add influenza data. The hospitals must report on total patients with laboratory-confirmed flu; previous day’s flu admissions; total ICU patients with lab-confirmed flu; total inpatients with either flu or COVID-19; and the previous day’s deaths for flu and COVID.
CDC Director Robert Redfield, MD, said on the press call that the new data will give the agency crucial hospital-level information and perhaps better estimates of the flu burden. Flu trends have been tracked using the CDC’s Influenza Hospitalization Surveillance Network (FluSurv-NET), which will not be replaced, Redfield said. But that network only tracks hospitalizations in 14 states and does not provide information in “nearly real-time,” he said.
Having the new data “will give us a true situational awareness of severe respiratory illness, provide local hospitalization trends, and help direct resources such as antiretrovirals to address potential increased impact of flu and COVID cocirculation,” Redfield said.
This article first appeared on Medscape.com.
Work-life balance: How 5 surgeons manage life in and out of the operating room
Patrick J. Culligan, MD:
My impression of our younger colleagues, however, is that many of them are not attracted to the traditional ivory tower research model of academic advancement to which many in previous generations aspired. They seem more concerned with work-life balance as their measure of success rather than the classic metrics of money and prestige. Everyone still needs role models and mentors, though, and that’s where all of you come in. I asked each of you to be on this panel because I admire you for your varying approaches to work-life balance while achieving success as gynecologic surgeons. I thought others in the field might be inspired by hearing your stories.
Cultivating your passions
Kristie Greene, MD: What I have come to learn and appreciate is a really simple point: you do not have to do everything. Determining who you want to be both personally and professionally is step 1.
Granted, answering the question, “Who do I want to be?” is not as simple as it sounds. Many factors figure into the decisions we make in our personal and professional lives. Also, it is not a question we often stop and ask ourselves. From early on, we are placed on an escalator moving up through medical school, residency, fellowship, good job, better job, etc. We are so accustomed to being competitive, to winning, and to wanting to be the best that we sometimes forget to ask ourselves, “What is it exactly that I want, and why? What is my endpoint? And does it make me happy?”
Multitasking is regarded as a talent. As much as we would like to believe that we can do everything at the same time and do it all well, we actually can’t. A friend of mine made me read a book a couple of years ago, called Feeling Good, by David Burns. The book encourages you to consider the different tasks you do in a day and rate how good you are at each of them on a scale of 1 to 10. It then asks you to think about how much enjoyment you derive from each of the tasks and about why you are doing the ones that bring you little to no enjoyment.
I ultimately decided that, for me professionally, the most important thing was my interest in global health. So I decided to do whatever it took to make this happen. But you don’t get something for nothing, and everything comes with sacrifices.
Continue to: Charles Rardin, MD...
Charles Rardin, MD: How exactly did you decide that you were going to focus your career toward pursuing international health? How did you know it was more important? And how did you overcome some of those obstacles?
Dr. Greene: You have to ask the hard question again about what brings you the most joy professionally and personally. That was the easy part of it for me because global health has always been that source of happiness and fulfillment for me. The more challenging parts are the sacrifices and hard choices that come with it. With global health, it can be difficult to balance the demands of a clinical practice.
All of our jobs are a business. I am still struggling with the money part of it. For my husband and I, that meant we had to start small—do what we could afford. But then it blossomed into something that was involving residents, fellows, and med students, which requires far more funding than we had. So I reached out to family. Most of our families donate to different organizations or charities every year, so why not donate to a loved one for something they are passionate about?
At the University of South Florida (USF), we set up a fund, a foundation for global health, which helps support our work abroad as well as the costs associated with involvement of our trainees. Right now, what we have is still small potatoes to a country, but we are making it happen by starting at a small level and growing it.
Beyond the money aspect, traveling abroad means less involvement in meetings, missed opportunities to teach courses that might interest me, and time away from my family. I guess my advice on this whole thing is that you can make things happen if they are important enough to you, and if you are willing to make sacrifices in other areas because you can’t have it all.
Making time for you
Dr. Culligan: So you have found what is important to you, and you have found a way to make it happen. But you are faced with more work; you have given yourself additional work on top of your regular work. How do you make time for a personal life?
Catherine Matthews, MD: In preparing for this discussion, I decided to break down my advice into 3 buckets: The first bucket is discovering and knowing your authentic self. The second is building a community, which I’ll elaborate on. And the third, which we have discussed, is to let go of the money.
Dr. Culligan: I love the concept of the authentic self, but how does that jive with a tendency to strive for perfection? We all think we can do it all. How do we narrow down to what really matters?
Dr. Matthews: We often focus on the things that bring us happiness and what we are good at, but it’s the things that make us unhappy that tend to bring us down. It’s the presence of unhappiness, not the absence of happiness, that seems to be the undoing of many, including myself.
None of us are born with dramatic insight. It is experience that leads to insight. People who are actually present are able to gain insight through observation. A person becomes a better surgeon by observing the outcome of doing a stitch this way versus that; you learn how to do it by seeing what it looks like afterward.
Finding our authentic selves happens in much the same way. Having the presence of mind to ask the right questions, such as, “How am I feeling while I’m doing this?” leads to insights into the true self.
Continue to: It takes a village...
It takes a village
Dr. Greene: Catherine mentioned community earlier, and that is extremely important. The people who surround us can have a huge impact on the way we perceive things, including ourselves. Having a mix of people in our lives—some who practice medicine and others who don’t—helps us stay balanced and answer some of the tough questions. Catherine, for example, has helped me in various stages of my career to ask myself meaningful questions and get real answers.
Dr. Rardin: Part of finding balance is luck, and part of it is making a choice between money and everything else. In considering my first job out of training, I knew that money had the potential to distract me from what was important to me. So I chose a position that was almost entirely salaried so that the decisions I made clinically, surgically, and regarding work-life balance would be less likely to directly impact what was important to me.
Sally Huber, MD: I am still in the “getting there” phase of my life, but one thing I have found is that getting my family involved and excited about what I do has made them much more accepting of when I have longer work days or work to do on the weekend. My spouse has become quite involved with what I have been doing with transgender health in Atlanta. It has been a great bonding experience; she shares my passions, and together we are creating something about which we both can be proud.
When work invades home life
Dr. Culligan: That is great. Sally, I think when we talked, you were just learning about the necessity of mental separation and of not taking your work home with you, which is so hard for all of us with all of our devices.
Dr. Huber: Yes, this year has been about seeing what works best as far as being efficient at work and having quality time at home. At the end of every day I ask myself, “What worked well today? What didn’t work well? What else can I do to maximize time with my family?” I am slowly becoming more efficient, but it has been a challenge. During fellowship, your day is pretty set, but once you are practicing on your own, your hours and responsibilities are completely different, and you have to figure out what works best for you, your values, and your expectations of private life. It takes some time, and I am still figuring it out.
Dr. Culligan: How often would you say that you bring work home? I try hard once I am home to quit working, but sometimes on the weekends I break that rule.
Dr. Matthews: I must say that I do feel like there are certain times when I am better at that than others. Work comes in waves with pressing deadlines. If I averaged it out, probably a third of the time I have some email or some conference call or something that I have got to do at home. I do really try to limit the obligations that I have after 5:30 or 6:00 pm. I resent intrusions after that time. As far as weekends, I delegate about one weekend every 2 months to work, instead of doing a little bit every weekend.
Dr. Greene: I agree. I try hard to make 5:30 to 7:30 pm unequivocal time for a family dinner and time for my kids. During that time, I do not have my phone near me so I can’t look at email or texts. I try not to schedule conference calls. I try to be there to read books to my kids at night. Then if I need to do work, I do it later at night, which interferes with time with my spouse, and is not ideal, but that’s what happens.
Dr. Matthews: One of the things that I think is a huge part of work-life balance is work-related travel. When you are present at work on a consistent basis, the work does not pile up to the extent that it does when you are absent on a trip. When you come back, you invariably pay the price by seeing more patients and doing more surgery. Then it becomes a stressful event.
My advice to young people is to be very thoughtful about planning trips, especially distant ones. You do not want to sit on a plane all day when you could be doing something more productive. If I could have done something differently in my mid-career, I would have traveled less.
Continue to: Prioritizing “out of office” time...
Prioritizing “out of office” time
Dr. Greene: How do you all mentally separate yourself from work, so that when you are on vacation with your family you are not thinking about the office, the patients, and all of the things on your to-do list?
Dr. Rardin: I don’t have a great answer for that except that it is about being present. You have to decide that now is the time when I am home, now is the time when I am a parent, now is the time when I am a boy scout leader, etc. I guess maybe it’s a skill, or maybe it’s about making something a priority. Work will always be waiting for you when you turn your attention back to it.
Dr. Matthews: Kristie, the answer to your question goes back to community. Partners in a practice cover for each other. You have to trust them to take care of things so that you can relax during your time away.
Some people recommend not scheduling challenging cases right before going away because invariably something goes wrong, and then you are asking, “Why did I schedule 3 colpopexies before getting on a plane?”
Dr. Rardin: Yes, I completely agree with all of that. Personally, I feel fortunate that I can compartmentalize pretty well. When I am home with my kids, I allow myself to shed some of the doctor/surgeon/leadership persona; I am able to be goofy and completely non–doctor-like. It works to help me leave work behind.
Dr. Matthews: Other things you can do include setting up an out-of-office notice on your email that says when you will be back and what to do in case of urgent matters. This basically says to the world, “Don’t expect to hear from me until X date.” It removes the expectation that you will respond sooner. Otherwise, we would all be on our smartphones all the time and not enjoying our time away.
What I wish I knew then
Dr. Culligan: How would you complete the sentence, “I wish they had told me X when I was embarking on my career?”
Dr. Rardin: I keep coming back to the phrase, “Don’t do anything that you can reasonably pay someone else to do.” By that I mean, if you don’t get energy from housework, consider spending some of your money to get help with the housework. Resolve to make a relatively small expenditure to maximize the quality of the time that you give to yourself and your family. Those are the sorts of things that I think can go a long way.
Dr. Culligan: Charley, your wife is an ObGyn. How do you navigate a dual medical career household? What advice do you have for others?
Dr. Rardin: When I was going into fellowship, we had a conversation about how hard it is for both people in a relationship to have an academic fire in the belly and to be truly engaged in climbing the academic ladder. We made a decision that Jane would go into private practice. There has got to be some give and take in a dual medical relationship; a lot of sacrifices and compromises need to happen. We are fortunate in that there are complementary aspects to our jobs. We both spend about the same number of nights away from the house, but my travel is more in chunks and hers is overnight calls for labor and delivery. We have different ways of (briefly) single-parenting, and you have to come up with ways to handle the domestic chores.
Dr. Matthews: I wish someone had explained to me that the people you work with are much more important than the place. The human connection is what defines your experience, much more than any ego-driven outcome.
Dr. Greene: I wish someone had explained to me the competing aspects of academic medicine. The cards are stacked in a way that make it difficult for you to win. For example, you may love to teach and may be really good at it, but if you let your students handle too many cases, your relative value units plummet and then the hospital is on your back. There are the interests of people, and there are the interests of the business. Everything is a balance, and it’s really tricky.
Dr. Huber: Luckily, Pat counselled me as I was finishing my fellowship about the importance of negotiating a good contract, of being pushy and knowing what you want out of it and knowing what your limitations are. I joined a private practice that had 3 different physical locations. If I had to drive to all of them, as they wanted, it would have meant up to a one-and-a-half-hour commute. But I pushed to stay in one location and to put that extra hour to better use. I am glad I did, but it was terrifying at the time because I didn’t want to lose the offer. I know people that did not do that and took the first thing they got. Now, they are driving all over the place or they have these crazy hours or terrible call responsibilities that if they had just been a little firmer, they probably could have gotten out of. As they start trying to find work-life balance, they are already handicapped.
Continue to: Passions outside the office...
Passions outside the office
Dr. Culligan: One thing I would like to touch on is what is going on in each of your personal lives because all of you have interesting stories to tell outside of what you do professionally. What drives you other than medicine?
Dr. Rardin: I am the father of 3 boys. The oldest one just got his Eagle Scout rank yesterday in Boy Scouts. I would be a woodworker if I wasn’t in medicine. I am a Deacon at church. And I love to spend my downtime reading with my family in front of the fireplace.
Dr. Matthews: For me, it’s music. When my husband and I first met, he asked me if I played a musical instrument. I said I played the cello in primary school. He said, “Great, go rent a cello.” I was never at all interested in playing the cello by myself, but because he plays guitar and piano we became able to play a lot of music together. Our son, Alexander, plays drums. We now have a family band.
In addition, I do yoga. I would never have labeled myself an anxious person, but I learned through this process that I am and need to manage it. It took a lot of years to figure that out. If I don’t leave myself an hour each day to go to a yoga class, I am not a happy person and neither is anyone around me. Also, I get tremendous pleasure from reading books and magazines as opposed to watching a screen.
Dr. Greene: I have found that my passions outside of work often change depending on my stage of life. Right now, I have two young babies and so my life outside of work revolves around them. Before the babies, my dad, who lives in Buffalo, was ill. So for awhile, we were flying to Buffalo almost every weekend that I was not on call. I would say, in general what fuels me is connecting with the people I love as often as I can. A typical night involves me and my husband going for a walk with our kids and dog after dinner and talking to each other. We connect with neighbors and chat on the front porch. It doesn’t really matter what we are doing; it is about being surrounded by people who matter.
Dr. Huber: It’s similar for me. Having a child completely shifts your world view. My goal every day is to give my daughter her first feeding in the morning and to get home as soon as possible at the end of the day to do her last feeding and put her to sleep. She crawled for the first time yesterday, and I was so excited that I could be there for that.
Also, I love being outdoors. I love hiking and camping. Going on a hike and being outside with nature is my way of decompressing.
Continue to: Thinking about upcoming generations...
Thinking about upcoming generations
Dr. Matthews: One other thing I would like to propose is looking at what can we do to make the profession better for the next generation. As a group, our profession is somewhat inflexible. We tend to fall into the trap of, “since this is the way we have always done it this is how we should continue doing it.” The OR still starts at 7:00 or 7:30 am, ignoring the need for school drop-offs, etc. We are not innovative about flexibility in the work week. Honestly, it does not work well for many people, patients and physicians alike. Flexible scheduling should be something that is on the table for both men and women who are trying to balance being full-time parents and full-time surgeons. We need to create an environment in which it is okay for you to spend 10 years instead of 6 as an assistant professor because you are also a young parent, and it will not count against you when you come up for promotion.
Dr. Culligan: I agree with you, Catherine. Full “Professor” is a nice title, but it means time away from family and a lot of other things. Each of us has to decide whether it is worth it, especially since it often does not come with any extra money.
Dr. Huber: A question on a recent survey of residents asked, “Do you see yourself going into private practice or academic medicine when you’ve completed your residency?” When I was a resident, everyone wanted to go into academic medicine, but now it seems like more and more residents have their sights set on private practice because that is where they see the opportunities to create work-life balance.
In the academic world, you have to try to get a promotion in X number of years, and get X number of publications, and be a great teacher, doctor, and administrator all at the same time. I am wondering if we are going to start seeing more and more residents and fellows going into private or hospital-owned practice where there aren’t those added expectations.
Dr. Rardin: I agree, and we are back to what we said in the beginning about doing an honest assessment of what is meaningful and important. We are all trained to try to reach for that shiny brass ring, but do we really want that brass ring? Will it be an asset or a hindrance once we get it? It is okay to be honest and say, “I really don’t want that promotion. I would rather spend more time with my family.” ●