User login
Medical students gain momentum in effort to ban legacy admissions
, which they say offer preferential treatment to applicants based on their association with donors or alumni.
While an estimated 25% of public colleges and universities still use legacy admissions, a growing list of top medical schools have moved away from the practice over the last decade, including Johns Hopkins University, Baltimore, and Tufts University, Medford, Mass.
Legacy admissions contradict schools’ more inclusive policies, Senila Yasmin, MPH, a second-year medical student at Tufts University, said in an interview. While Tufts maintains legacy admissions for its undergraduate applicants, the medical school stopped the practice in 2021, said Ms. Yasmin, a member of a student group that lobbied against the school’s legacy preferences.
Describing herself as a low-income, first-generation Muslim-Pakistani American, Ms. Yasmin wants to use her experience at Tufts to improve accessibility for students like herself.
As a member of the American Medical Association (AMA) Medical Student Section, she coauthored a resolution stating that legacy admissions go against the AMA’s strategic plan to advance racial justice and health equity. The Student Section passed the resolution in November, and in June, the AMA House of Delegates will vote on whether to adopt the policy.
Along with a Supreme Court decision that could strike down race-conscious college admissions, an AMA policy could convince medical schools to rethink legacy admissions and how to maintain diverse student bodies. In June, the court is expected to issue a decision in the Students for Fair Admissions lawsuit against Harvard University, Cambridge, Mass., and the University of North Carolina, Chapel Hill, which alleges that considering race in holistic admissions constitutes racial discrimination and violates the Equal Protection Clause.
Opponents of legacy admissions, like Ms. Yasmin, say it penalizes students from racial minorities and lower socioeconomic backgrounds, hampering a fair and equitable admissions process that attracts diverse medical school admissions.
Diversity of medical applicants
Diversity in medical schools continued to increase last year with more Black, Hispanic, and female students applying and enrolling, according to a recent report by the Association of American Medical Colleges (AAMC). However, universities often include nonacademic criteria in their admission assessments to improve educational access for underrepresented minorities.
Medical schools carefully consider each applicant’s background “to yield a diverse class of students,” Geoffrey Young, PhD, AAMC’s senior director of transforming the health care workforce, told this news organization.
Some schools, such as Morehouse School of Medicine, Atlanta, the University of Virginia School of Medicine, Charlottesville, and the University of Arizona College of Medicine, Tucson, perform a thorough review of candidates while offering admissions practices designed specifically for legacy applicants. The schools assert that legacy designation doesn’t factor into the student’s likelihood of acceptance.
The arrangement may show that schools want to commit to equity and fairness but have trouble moving away from entrenched traditions, two professors from Penn State College of Medicine, Hershey, Pa., who sit on separate medical admissions subcommittees, wrote last year in Bioethics Today.
Legislation may hasten legacies’ end
In December, Ms. Yasmin and a group of Massachusetts Medical Society student-members presented another resolution to the state medical society, which adopted it.
The society’s new policy opposes the use of legacy status in medical school admissions and supports mechanisms to eliminate its inclusion from the application process, Theodore Calianos II, MD, FACS, president of the Massachusetts Medical Society, said in an interview.
“Legacy preferences limit racial and socioeconomic diversity on campuses, so we asked, ‘What can we do so that everyone has equal access to medical education?’ It is exciting to see the students and young physicians – the future of medicine – become involved in policymaking.”
Proposed laws may also hasten the end of legacy admissions. Last year, the U.S. Senate began considering a bill prohibiting colleges receiving federal financial aid from giving preferential treatment to students based on their relations to donors or alumni. However, the bill allows the Department of Education to make exceptions for institutions serving historically underrepresented groups.
The New York State Senate and the New York State Assembly also are reviewing bills that ban legacy and early admissions policies at public and private universities. Connecticut announced similar legislation last year. Massachusetts legislators are considering two bills: one that would ban the practice at the state’s public universities and another that would require all schools using legacy status to pay a “public service fee” equal to a percentage of its endowment. Colleges with endowment assets exceeding $2 billion must pay at least $2 million, according to the bill’s text.
At schools like Harvard, whose endowment surpasses $50 billion, the option to pay the penalty will make the law moot, Michael Walls, DO, MPH, president of the American Medical Student Association (AMSA), said in an interview. “Smaller schools wouldn’t be able to afford the fine and are less likely to be doing [legacy admissions] anyway,” he said. “The schools that want to continue doing it could just pay the fine.”
Dr. Walls said AMSA supports race-conscious admissions processes and anything that increases fairness for medical school applicants. “Whatever [fair] means is up for interpretation, but it would be great to eliminate legacy admissions,” he said.
A version of this article originally appeared on Medscape.com.
Picosecond laser applications continue to expand
PHOENIX – Ever since PicoSure became the first picosecond laser cleared by the Food and Drug Administration for the treatment of unwanted tattoos and pigmented lesions in 2012, new uses for this technology continue to expand.
Now, These include PicoWay, PicoSure, Enlighten, PicoPlus, PiQo4, and Quanta Pico, among others.
“PicoWay technology has integrated nicely into my practice in Houston, the most ethnically diverse city in the country, with its ability to safely treat a number of various benign, congenital, and acquired epidermal and dermal pigmented lesions with ultrashort pulse duration and low thermal impact, which greatly reduces the risk of postinflammatory hyperpigmentation even in darker skin types,” Paul M. Friedman, MD, director of the Dermatology and Laser Surgery Center, Houston, said at the annual conference of the American Society for Laser Medicine and Surgery.

He emphasized the importance of therapeutic clinical endpoints, noting that with q-switched lasers, “you’re looking for immediate whitening, whereas with picosecond lasers, your endpoint is slight whitening or slight darkening depending on wavelength, indication, and skin type. The ability to fractionate picosecond pulses has also allowed us to utilize this technology for photoaging as well as acne scarring.”
The PicoWay system includes a 730-nm picosecond titanium sapphire handpiece, which is FDA cleared for treatment of benign pigmented lesions and blue and green tattoo removal. Dr. Friedman said that he has seen good clinical results using the handpiece for café-au-lait macules, particularly in skin of color.
In an abstract presented at the ASLMS meeting, he and his colleagues presented a retrospective review of 12 patients with café-au-lait macules with Fitzpatrick skin types III-VI who were treated with the PicoWay 730 nm handpiece between April 2021 and January 2023. Patients received a mean of 3.1 treatments at intervals that ranged from 5 to 40 weeks. Clinical photographs were graded by three board-certified dermatologists using a 5-point visual analogue scale.
Overall, patients were rated to have a mean improvement of 26%-50%. Two patients achieved 100% clearance after four to five treatment sessions. “Café-au-lait macules with smooth borders responded less well to laser treatment, confirming prior studies at our center,” he said. “We often educate parents that café-au-lait macules may recur over time, especially with repeated sun exposure.”
Treating melasma
Dr. Friedman’s go-to devices for melasma include the low-density, low-energy 1,927-nm fractional diode laser; the 1,064 nm picosecond Nd:YAG, the low-fluence 1,064 nm Q-switched Nd:YAG with a nanosecond pulse duration, and the 595-nm pulsed dye laser for lesions exhibiting underlying vascularity. He said that combining therapies that target pigment and vasculature may be ideal to prevent relapses. “Melasma is a multifactorial condition so by improving patient education and expectation alongside advances in laser treatment of melasma, we have ultimately improved our ability to treat this condition,” he said.
“We’re approaching it from all angles, with ultraviolet photography and spectrocolorimetry, behavioral modifications, topical skin-lightening agents, broad spectrum sunscreens with protection against visible light, and oral tranexamic acid in advanced cases. Then, we intervene with these energy-based modalities, and the bottom line is, less energy and density is more, with lengthened treatment intervals. In 2023, we’re better than we’ve ever been in terms of our ability to safely and effectively improve melasma.”
Novel lasers
Dr. Friedman also described the UltraClear, a novel ablative fractional 2,910-nm erbium-doped glass fiber laser that delivers a customized blend of ablation and coagulation based on the patient’s condition, skin type, and tolerability for down time. He provided an overview of the versatility of what he described as highly customizable technology for conditions such as photoaging and dyschromia in patients of various skin types, making it a very versatile platform in his practice.
The AVAVA MIRIA system is a “next generation” laser “where you’re able to use a focal point. Basically, you’re treating the skin from the inside out in a 3D manner and you’re able to focus intradermally up to 1 mm with high energy 1,064 nm or 1,550 nm,” he said. “It’s a unique conical geometry that spares the epidermis, combined with sapphire tip cooling and images the skin at the same time with the potential for personalized treatments of dyschromia and photoaging in all skin types. It’s truly remarkable where the technology is heading.”
Dr. Friedman disclosed that he has received consulting fees from Allergan, Galderma, Acclaro, Merz Aesthetics, Solta Medical, and Cytrellis. He has conducted contracted research for Sofwave and is a member of the speakers bureau for Solta Medical and Candela.
PHOENIX – Ever since PicoSure became the first picosecond laser cleared by the Food and Drug Administration for the treatment of unwanted tattoos and pigmented lesions in 2012, new uses for this technology continue to expand.
Now, These include PicoWay, PicoSure, Enlighten, PicoPlus, PiQo4, and Quanta Pico, among others.
“PicoWay technology has integrated nicely into my practice in Houston, the most ethnically diverse city in the country, with its ability to safely treat a number of various benign, congenital, and acquired epidermal and dermal pigmented lesions with ultrashort pulse duration and low thermal impact, which greatly reduces the risk of postinflammatory hyperpigmentation even in darker skin types,” Paul M. Friedman, MD, director of the Dermatology and Laser Surgery Center, Houston, said at the annual conference of the American Society for Laser Medicine and Surgery.
He emphasized the importance of therapeutic clinical endpoints, noting that with q-switched lasers, “you’re looking for immediate whitening, whereas with picosecond lasers, your endpoint is slight whitening or slight darkening depending on wavelength, indication, and skin type. The ability to fractionate picosecond pulses has also allowed us to utilize this technology for photoaging as well as acne scarring.”
The PicoWay system includes a 730-nm picosecond titanium sapphire handpiece, which is FDA cleared for treatment of benign pigmented lesions and blue and green tattoo removal. Dr. Friedman said that he has seen good clinical results using the handpiece for café-au-lait macules, particularly in skin of color.
In an abstract presented at the ASLMS meeting, he and his colleagues presented a retrospective review of 12 patients with café-au-lait macules with Fitzpatrick skin types III-VI who were treated with the PicoWay 730 nm handpiece between April 2021 and January 2023. Patients received a mean of 3.1 treatments at intervals that ranged from 5 to 40 weeks. Clinical photographs were graded by three board-certified dermatologists using a 5-point visual analogue scale.
Overall, patients were rated to have a mean improvement of 26%-50%. Two patients achieved 100% clearance after four to five treatment sessions. “Café-au-lait macules with smooth borders responded less well to laser treatment, confirming prior studies at our center,” he said. “We often educate parents that café-au-lait macules may recur over time, especially with repeated sun exposure.”
Treating melasma
Dr. Friedman’s go-to devices for melasma include the low-density, low-energy 1,927-nm fractional diode laser; the 1,064 nm picosecond Nd:YAG, the low-fluence 1,064 nm Q-switched Nd:YAG with a nanosecond pulse duration, and the 595-nm pulsed dye laser for lesions exhibiting underlying vascularity. He said that combining therapies that target pigment and vasculature may be ideal to prevent relapses. “Melasma is a multifactorial condition so by improving patient education and expectation alongside advances in laser treatment of melasma, we have ultimately improved our ability to treat this condition,” he said.
“We’re approaching it from all angles, with ultraviolet photography and spectrocolorimetry, behavioral modifications, topical skin-lightening agents, broad spectrum sunscreens with protection against visible light, and oral tranexamic acid in advanced cases. Then, we intervene with these energy-based modalities, and the bottom line is, less energy and density is more, with lengthened treatment intervals. In 2023, we’re better than we’ve ever been in terms of our ability to safely and effectively improve melasma.”
Novel lasers
Dr. Friedman also described the UltraClear, a novel ablative fractional 2,910-nm erbium-doped glass fiber laser that delivers a customized blend of ablation and coagulation based on the patient’s condition, skin type, and tolerability for down time. He provided an overview of the versatility of what he described as highly customizable technology for conditions such as photoaging and dyschromia in patients of various skin types, making it a very versatile platform in his practice.
The AVAVA MIRIA system is a “next generation” laser “where you’re able to use a focal point. Basically, you’re treating the skin from the inside out in a 3D manner and you’re able to focus intradermally up to 1 mm with high energy 1,064 nm or 1,550 nm,” he said. “It’s a unique conical geometry that spares the epidermis, combined with sapphire tip cooling and images the skin at the same time with the potential for personalized treatments of dyschromia and photoaging in all skin types. It’s truly remarkable where the technology is heading.”
Dr. Friedman disclosed that he has received consulting fees from Allergan, Galderma, Acclaro, Merz Aesthetics, Solta Medical, and Cytrellis. He has conducted contracted research for Sofwave and is a member of the speakers bureau for Solta Medical and Candela.
FROM ASLMS 2023
Five ways docs may qualify for discounts on medical malpractice premiums
Getting a better deal might simply mean taking advantage of incentives and discounts your insurer may already offer. These include claims-free, new-to-practice, and working part-time discounts.
However, if you decide to shop around, keep in mind that discounts are just one factor that can affect your premium price – insurers look at your specialty, location, and claims history.
One of the most common ways physicians can earn discounts is by participating in risk management programs. With this type of program, physicians evaluate elements of their practice and documentation practices and identify areas that might leave them at risk for a lawsuit. While they save money, physician risk management programs also are designed to reduce malpractice claims, which ultimately minimizes the potential for bigger financial losses, insurance experts say.
“It’s a win-win situation when liability insurers and physicians work together to minimize risk, and it’s a win for patients,” said Gary Price, MD, president of The Physicians Foundation.
Doctors in private practice or employed by small hospitals that are not self-insured can qualify for these discounts, said David Zetter, president of Zetter HealthCare Management Consultants.
“I do a lot of work with medical malpractice companies trying to find clients policies. All the carriers are transparent about what physicians have to do to lower their premiums. Physicians can receive the discounts if they follow through and meet the insurer’s requirements,” said Mr. Zetter.
State insurance departments regulate medical malpractice insurance, including the premium credits insurers offer. Most states cap discounts at 25%, but some go as high as 70%, according to The Doctors Company, a national physician-owned medical malpractice insurer.
Insurers typically offer doctors several ways to earn discounts. The size of the discount also can depend on whether a doctor is new to a practice, remains claims free, or takes risk management courses.
In addition to the premium discount, some online risk management classes and webinars are eligible for CME credits.
“The credits can add up and they can be used for recertification or relicensure,” said Susan Boisvert, senior patient safety risk manager at The Doctors Company.
Here are five ways you may qualify for discounts with your insurer.
1. Make use of discounts available to new doctors
Doctors can earn hefty discounts on their premiums when they are no longer interns or residents and start practicing medicine. The Doctors Company usually gives a 50% discount on member premiums the first year they’re in practice and a 25% discount credit in their second year. The discounts end after that.
Other insurance carriers offer similar discounts to doctors starting to practice medicine. The deepest one is offered in the first year (at least 50%) and a smaller one (20%-25%) the second year, according to medical malpractice brokers.
“The new-to-practice discount is based solely on when the physician left their formal training to begin their practice for the first time; it is not based on claim-free history,” explained Mr. Zetter.
This is a very common discount used by different insurer carriers, said Dr. Price. “New physicians don’t have the same amount of risk of a lawsuit when they’re starting out. It’s unlikely they will have a claim and most liability actions have a 2-year time limit from the date of injury to be filed.”
2. Take advantage of being claims free
If you’ve been claims free for at least a few years, you may be eligible for a large discount.
“Doctors without claims are a better risk. Once a doctor has one claim, they’re likely to have a second, which the research shows,” said Mr. Zetter.
The most common credit The Doctors Company offers is 3 years of being claim free – this earns doctors up to 25%, he said. Mr. Zetter explained that the criteria and size of The Doctors Company credit may depend on the state where physicians practice.
“We allowed insurance carriers that we acquired to continue with their own claim-free discount program such as Florida’s First Professionals Insurance Company we acquired in 2011,” he said.
Doctors with other medical malpractice insurers may also be eligible for a credit up to 25%. In some instances, they may have to be claims free for 5 or 10 years, say insurance experts.
It pays to shop around before purchasing insurance.
3. If you work part time, make sure your premium reflects that
Physicians who see patients part time can receive up to a 75% discount on their medical liability insurance premiums.
The discounts are based on the hours the physician works per week. The fewer hours worked, the larger the discount. This type of discount does not vary by specialty.
According to The Doctors Company, working 10 hours or less per week may entitle doctors to a 75% discount; working 11-20 hours per week may entitle them to a 50% discount, and working 21-30 hours per week may entitle them to a 25% discount. If you are in this situation, it pays to ask your insurer if there is a discount available to you.
4. Look into your professional medical society insurance company
“I would look at your state medical association [or] state specialty society and talk to your colleagues to learn what premiums they’re paying and about any discounts they’re getting,” advised Mr. Zetter.
Some state medical societies have formed their own liability companies and offer lower premiums to their members because “they’re organized and managed by doctors, which makes their premiums more competitive,” Dr. Price said.
Other state medical societies endorse specific insurance carriers and offer their members a 5% discount for enrolling with them.
5. Enroll in a risk management program
Most insurers offer online educational activities designed to improve patient safety and reduce the risk of a lawsuit. Physicians may be eligible for both premium discounts and CME credits.
Medical Liability Mutual Insurance Company, owned by Berkshire Hathaway, operates in New York and offers physicians a premium discount of up to 5%, CME credit, and maintenance of certification credit for successfully completing its risk management program every other year.
ProAssurance members nationwide can earn 5% in premium discounts if they complete a 2-hour video series called “Back to Basics: Loss Prevention and Navigating Everyday Risks: Using Data to Drive Change.”
They can earn one credit for completing each webinar on topics such as “Medication Management: Minimizing Errors and Improving Safety” and “Opioid Prescribing: Keeping Patients Safe.”
MagMutual offers its insured physicians 1 CME credit for completing their specialty’s risk assessment and courses, which may be applied toward their premium discounts.
The Doctors Company offers its members a 5% premium discount if they complete 4 CME credits. One of its most popular courses is “How To Get Rid of a Difficult Patient.”
“Busy residents like the shorter case studies worth one-quarter credit that they can complete in 15 minutes,” said Ms. Boisvert.
“This is a good bargain from the physician’s standpoint and the fact that risk management education is offered online makes it a lot easier than going to a seminar in person,” said Dr. Price.
A version of this article first appeared on Medscape.com.
AGA clinical practice update: Extraesophageal gastroesophageal reflux disease
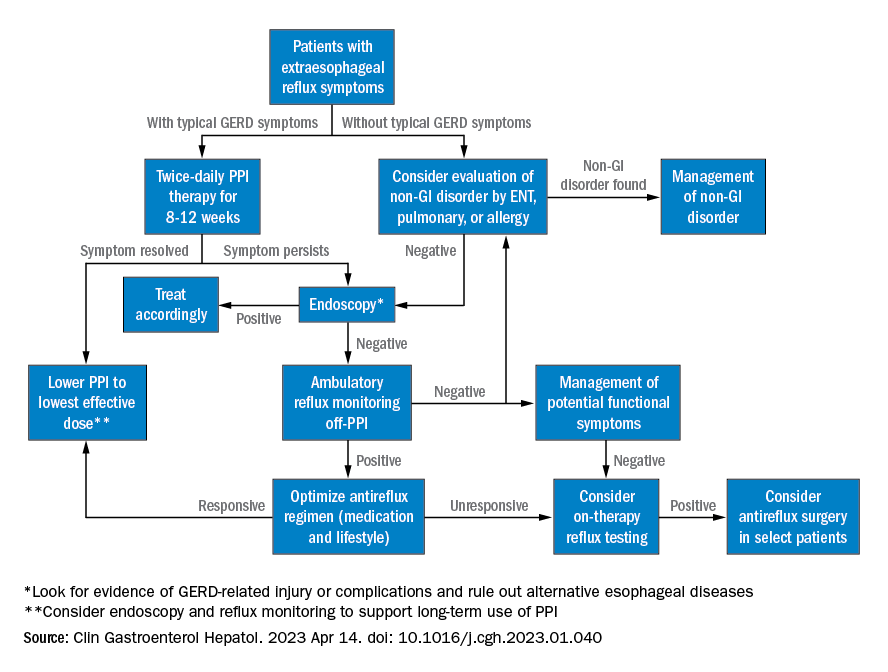
Extraesophageal reflux (EER) symptoms are a subset of gastroesophageal reflux disease (GERD) that can be difficult to diagnose because of its heterogeneous nature and symptoms that overlap with other conditions.
That puts the onus on physicians to take all symptoms into account and work across disciplines to diagnose, manage, and treat the condition, according to a new clinical practice update from the American Gastroenterological Association, which was published in Clinical Gastroenterology and Hepatology.

GERD is becoming increasingly common, which in turn has led to greater awareness and consideration of EER symptoms. EER symptoms can present a challenge because they may vary considerably and are not unique to GERD. The symptoms often do not respond well to proton pump inhibitor (PPI) therapy.
EER symptoms can include cough, laryngeal hoarseness, dysphonia, pulmonary fibrosis, asthma, dental erosions/caries, sinus disease, ear disease, postnasal drip, and throat clearing. Some patients with EER symptoms do not report heartburn or regurgitation, which leaves it up to the physician to determine if acid reflux is present and contributing to symptoms.
“The concept of extraesophageal symptoms secondary to GERD is complex and often controversial, leading to diagnostic and therapeutic challenges. Several extraesophageal symptoms have been associated with GERD, although the strength of evidence to support a causal relation varies,” wrote the authors, who were led by Joan W. Chen, MD, MS, a gastroenterologist with the University of Michigan, Ann Arbor.
There is also debate over whether fluid refluxate is the source of damage that causes EER symptoms, and if so, whether it is sufficient that the fluid be acidic or that pepsin be present, or if the cause is related to neurogenic signaling and resulting inflammation. Because of these questions, a PPI trial will not necessarily provide insight into the role of acid reflux in EER symptoms.
Best practice advice 1: The authors emphasized that gastroenterologists need to be aware of the potential extraesophageal symptoms of GERD. They should inquire with GERD patients to determine if laryngitis, chronic cough, asthma, and dental erosions are present.
Best practice advice 2: Consider a multidisciplinary approach to EER manifestations. Cases may require input from non-GI specialties. Tests performed by other specialists, such as bronchoscopy, thoracic imaging, or laryngoscopy, should be taken into account, since patients will also seek out multiple specialists to address their symptoms.
Best practice advice 3: There is no specific diagnostic test available to determine if GER is the cause of EER symptoms. Instead, physicians should interpret patient symptoms, response to GER therapy, and input from endoscopy and reflux tests.
Best practice advice 4: Rather than subject the patient to the cost and potential for even rare adverse events of a PPI trial, physicians should first consider conducting reflux testing. A PPI trial has clinical value but is insufficient on its own to help diagnose or manage EER. Initial single-dose PPI trial, titrating up to twice daily in those with typical GERD symptoms, is reasonable.
Best practice advice 5: The inconsistent therapeutic response to PPI therapy means that positive effects of PPI therapy on EER symptoms can’t confirm a GERD diagnosis because a placebo effect may be involved, and because symptom improvement can occur through mechanisms other than acid suppression. A meta-analysis found that a PPI trial has a sensitivity of 71%-78% and a specificity of 41%-54% with typical symptoms of heartburn and regurgitation. “Considering the greater variation expected with PPI response for extraesophageal symptoms, the diagnostic performance of empiric PPI trial for a diagnosis of EER would be anticipated to be substantially lower,” the authors wrote.
Best practice advice 6: When EER symptoms related to GERD are suspected and a PPI trial of up to 12 weeks does not lead to adequate improvement, the physician should consider testing for pathologic GER. Additional trials employing other PPIs are unlikely to succeed.
Best practice advice 7: Initial testing to evaluate for reflux should be tailored to patients’ clinical presentation. Potential methods to evaluate reflux include upper endoscopy and ambulatory reflux monitoring studies of acid suppressive therapy, which can assist with a GERD diagnosis, particularly when nonerosive reflux is present.
Best practice advice 8: About 50%-60% of patients with EER symptoms will not have GERD. Testing can be considered for those with an established objective diagnosis of GERD who do not respond well to high doses of acid suppression. Cost-effectiveness studies have confirmed the value of starting with ambulatory reflux monitoring, which can include a catheter-based pH sensor, pH impedance, or wireless pH capsule.
Ambulatory esophageal pH monitoring can also assist in making a GERD diagnosis, but it does not indicate whether GERD may be contributing to EER symptoms.
“Whichever the reflux testing modality, the strongest confidence for EER is achieved after ambulatory reflux testing showing pathologic acid exposure and a positive symptom-reflux association for EER symptoms,” the authors wrote. They also pointed out that ambulatory reflux monitoring in EER patients should be done in the absence of acid suppression unless there is already objective evidence for the presence of GERD.
Best practice advice 9: Aside from acid suppression, EER symptoms can also be managed through other means, including lifestyle modifications, such as eating avoidance prior to lying down, elevation of the head of the bed, sleeping on the left side, and weight loss. Or, alginate containing antacids, external upper esophageal sphincter compression device, cognitive behavioral therapy, and neuromodulators.
Best practice advice 10: In cases where the EER patient has objectively defined evidence of GERD, physicians should employ shared decision-making before considering anti-reflux surgery. If the patient did not respond to PPI therapy, this predicts a lack of response to antireflux surgery.
All four authors reported financial ties to multiple pharmaceutical companies.
Extraesophageal reflux (EER) symptoms are a subset of gastroesophageal reflux disease (GERD) that can be difficult to diagnose because of its heterogeneous nature and symptoms that overlap with other conditions.
That puts the onus on physicians to take all symptoms into account and work across disciplines to diagnose, manage, and treat the condition, according to a new clinical practice update from the American Gastroenterological Association, which was published in Clinical Gastroenterology and Hepatology.
GERD is becoming increasingly common, which in turn has led to greater awareness and consideration of EER symptoms. EER symptoms can present a challenge because they may vary considerably and are not unique to GERD. The symptoms often do not respond well to proton pump inhibitor (PPI) therapy.
EER symptoms can include cough, laryngeal hoarseness, dysphonia, pulmonary fibrosis, asthma, dental erosions/caries, sinus disease, ear disease, postnasal drip, and throat clearing. Some patients with EER symptoms do not report heartburn or regurgitation, which leaves it up to the physician to determine if acid reflux is present and contributing to symptoms.
“The concept of extraesophageal symptoms secondary to GERD is complex and often controversial, leading to diagnostic and therapeutic challenges. Several extraesophageal symptoms have been associated with GERD, although the strength of evidence to support a causal relation varies,” wrote the authors, who were led by Joan W. Chen, MD, MS, a gastroenterologist with the University of Michigan, Ann Arbor.
There is also debate over whether fluid refluxate is the source of damage that causes EER symptoms, and if so, whether it is sufficient that the fluid be acidic or that pepsin be present, or if the cause is related to neurogenic signaling and resulting inflammation. Because of these questions, a PPI trial will not necessarily provide insight into the role of acid reflux in EER symptoms.
Best practice advice 1: The authors emphasized that gastroenterologists need to be aware of the potential extraesophageal symptoms of GERD. They should inquire with GERD patients to determine if laryngitis, chronic cough, asthma, and dental erosions are present.
Best practice advice 2: Consider a multidisciplinary approach to EER manifestations. Cases may require input from non-GI specialties. Tests performed by other specialists, such as bronchoscopy, thoracic imaging, or laryngoscopy, should be taken into account, since patients will also seek out multiple specialists to address their symptoms.
Best practice advice 3: There is no specific diagnostic test available to determine if GER is the cause of EER symptoms. Instead, physicians should interpret patient symptoms, response to GER therapy, and input from endoscopy and reflux tests.
Best practice advice 4: Rather than subject the patient to the cost and potential for even rare adverse events of a PPI trial, physicians should first consider conducting reflux testing. A PPI trial has clinical value but is insufficient on its own to help diagnose or manage EER. Initial single-dose PPI trial, titrating up to twice daily in those with typical GERD symptoms, is reasonable.
Best practice advice 5: The inconsistent therapeutic response to PPI therapy means that positive effects of PPI therapy on EER symptoms can’t confirm a GERD diagnosis because a placebo effect may be involved, and because symptom improvement can occur through mechanisms other than acid suppression. A meta-analysis found that a PPI trial has a sensitivity of 71%-78% and a specificity of 41%-54% with typical symptoms of heartburn and regurgitation. “Considering the greater variation expected with PPI response for extraesophageal symptoms, the diagnostic performance of empiric PPI trial for a diagnosis of EER would be anticipated to be substantially lower,” the authors wrote.
Best practice advice 6: When EER symptoms related to GERD are suspected and a PPI trial of up to 12 weeks does not lead to adequate improvement, the physician should consider testing for pathologic GER. Additional trials employing other PPIs are unlikely to succeed.
Best practice advice 7: Initial testing to evaluate for reflux should be tailored to patients’ clinical presentation. Potential methods to evaluate reflux include upper endoscopy and ambulatory reflux monitoring studies of acid suppressive therapy, which can assist with a GERD diagnosis, particularly when nonerosive reflux is present.
Best practice advice 8: About 50%-60% of patients with EER symptoms will not have GERD. Testing can be considered for those with an established objective diagnosis of GERD who do not respond well to high doses of acid suppression. Cost-effectiveness studies have confirmed the value of starting with ambulatory reflux monitoring, which can include a catheter-based pH sensor, pH impedance, or wireless pH capsule.
Ambulatory esophageal pH monitoring can also assist in making a GERD diagnosis, but it does not indicate whether GERD may be contributing to EER symptoms.
“Whichever the reflux testing modality, the strongest confidence for EER is achieved after ambulatory reflux testing showing pathologic acid exposure and a positive symptom-reflux association for EER symptoms,” the authors wrote. They also pointed out that ambulatory reflux monitoring in EER patients should be done in the absence of acid suppression unless there is already objective evidence for the presence of GERD.
Best practice advice 9: Aside from acid suppression, EER symptoms can also be managed through other means, including lifestyle modifications, such as eating avoidance prior to lying down, elevation of the head of the bed, sleeping on the left side, and weight loss. Or, alginate containing antacids, external upper esophageal sphincter compression device, cognitive behavioral therapy, and neuromodulators.
Best practice advice 10: In cases where the EER patient has objectively defined evidence of GERD, physicians should employ shared decision-making before considering anti-reflux surgery. If the patient did not respond to PPI therapy, this predicts a lack of response to antireflux surgery.
All four authors reported financial ties to multiple pharmaceutical companies.
FROM CLINICAL GASTROENTEROLOGY AND HEPATOLOGY
Two phase 3 trials show benefits of dupilumab for prurigo nodularis
The results, which were published online in Nature Medicine, were the basis for the FDA approval of dupilumab (Dupixent) for adults with PN in September 2022, the first treatment approved for treating PN in the United States.
“These positive studies support the involvement of type 2 cytokines in driving PN disease pathogenesis and the targeting of the [interleukin]-4/IL-13 axis as a novel therapeutic paradigm for patients with PN,” wrote the researchers, who were led by principal investigator Gil Yosipovitch, MD, professor of dermatology at the University of Miami, Fla. Dupilumab, an IL-4 receptor alpha antagonist, blocks the shared receptor component (IL-4R alpha) for IL-4 and IL-13.
For the two phase 3 trials, which were called LIBERTY-PN PRIME and PRIME2 and were sponsored by Sanofi and Regeneron Pharmaceuticals, researchers randomized adults with PN with 20 or more nodules and severe itch uncontrolled with topical therapies 1:1 to 300 mg dupilumab or placebo subcutaneously every 2 weeks for 24 weeks. The primary endpoint was pruritus improvement, which was measured by the proportion of patients with a 4-point or greater reduction in Worst Itch Numeric Rating Scale (WI-NRS) from baseline at week 24 (PRIME) or week 12 (PRIME2). Key secondary endpoints included a reduction in the number of nodules to 5 or fewer at week 24.
PRIME and PRIME2 enrolled 151 and 160 patients, respectively. In PRIME, 60% of patients in the dupilumab arm achieved a 4-point or greater reduction in the WI-NRS at week 24, compared with 18.4% of patients in the placebo arm (P < .001). In PRIME2, 37.2% of patients in the dupilumab arm achieved a 4-point or greater reduction in the WI-NRS at week 12, compared with 22% of patients in the placebo arm (P = .022).
The researchers also reported that, from an initial baseline of 20 to greater than 100 nodules, 32.0% of dupilumab-treated patients in PRIME and 25.6% in PRIME2 showed a reduction to 5 nodules or fewer, which corresponded to a response of “clear” or “almost clear” skin at week 12, compared with 11.8% and 12.2% of placebo-treated patients, respectively. This treatment effect on skin lesions continued to improve after week 12, with 48% of dupilumab-treated patients in PRIME and 44.9% in PRIME2 having five nodules or fewer at week 24, compared with 18.4% and 15.9% of placebo-treated patients, respectively. Safety was consistent with the known dupilumab safety profile.
“Validation is the first success of this paper,” said Adam Friedman, MD, professor and chair of dermatology at George Washington University, Washington, who was asked to comment on the study. “While both the safety and efficacy of dupilumab in these two phase 3 programs is the meat of the matter, nuanced highlights for me include the rigid nature of the exclusion criteria to ensure a study population that truly has PN as a stand-alone disease, rather than a secondary finding as we once believed to be the entire story. I think it’s important for us to recognize that it’s not one or the other, rather there is both ‘primary’ prurigo nodularis, and then there is secondary prurigo nodularis associated with something else [a wide range of underlying medical conditions], just like we divide primary and secondary hyperhidrosis.”
Dr. Yosipovitch reported having competing interests with several pharmaceutical companies, including Regeneron and Sanofi. Dr. Friedman disclosed that he is a consultant to and a speaker for Regeneron.
FROM NATURE MEDICINE
Bundled strategy increased preteen lipid screening
WASHINGTON – A bundled intervention combining point-of-care testing, electronic medical record support, and provider education significantly improved lipid screening rates in children aged 9-11 years, according to data from approximately 100 monthly visits over a 3-year period.
Guidelines from the National Heart, Lung, and Blood Institute currently recommend universal lipid screening for children aged 9-11 years, but screening rates in clinical practice remain low, according to Ruth E. Gardner, MD, of Penn State University, Hershey, and colleagues.
In a poster presented at the Pediatric Academic Societies annual meeting, Dr. Gardner and colleagues shared results of the implementation of a bundled testing protocol designed to improve screening.
The researchers reviewed data on lipid testing within 30 days for all 9- to 11-year-old well child visits at a single center between May 2019 and February 2022. The bundled intervention was introduced in May 2021.
The bundled protocol included in-office capillary testing and provider education. In addition, electronic medical record templates were modified to include prompts for lipid screening at relevant ages, and EMR orders were adjusted to include lipid testing. The researchers also collected targeted provider feedback on individualized screening rates in February 2022.
Screening rates were plotted monthly. For the period from May 2019 through May 2021, the rates averaged 6.5%. However, after the introduction of the bundled intervention, the rate increased to 29.9%. Following targeted provider feedback in February 2022, the researchers found an additional shift to 52.1% through March and April 2022.
The findings were limited by the use of data from a single center, and the researchers used an extended study period to account for disruptions to well-child care in the spring of 2020 related to the COVID-19 pandemic.
However, the results support the effectiveness of a bundled intervention for improving lipid screening rates in children aged 9-11 years, the researchers said, and targeted provider feedback and education could yield additional improvements, they concluded.
Preteen years are an optimal time for screening
“The current study is important because atherosclerosis begins in childhood, and screening at ages 9-11 is an optimal time to begin lifestyle changes to improve overall health and reduce risks of heart disease,” said Margaret Thew, DNP, FNP-BC, of the Medical College of Wisconsin, Milwaukee, in an interview.
Ms. Thew, who was not involved in the study, said, “The number of recommended and required screening items needed in pediatrics is vast, so many providers have to select which items to focus on for their health screenings with these ages.”
Overall, “I was impressed with the improvements that were made in this quality improvement study,” said Ms. Thew.
Barriers to lipid screening in this population include the reduced number of health screenings and immunizations recommended for this age group; the consequence is that access is limited to discuss preventive care opportunities, said Ms. Thew in an interview. Steps to overcome these barriers could include the use of many of the screening tools introduced in the current study, such as point-of-care testing in the office, use of the EMR to remind providers of testing, which can be done during well visits or school physicals, and educating providers about the current guidelines, she noted.
Other strategies to increase screening include moving the immunization series to provide more frequent appointments to children aged 9-11 years to offer education and preventive care, Ms. Thew added.
The study received no outside funding. The researchers had no financial conflicts to disclose. Ms. Thew had no financial conflicts to disclose and serves on the Editorial Advisory Board of Pediatric News.
FROM PAS 2023
Boys may carry the weight, or overweight, of adults’ infertility
Overweight boy, infertile man?
When it comes to causes of infertility, history and science have generally focused on women. A lot of the research overlooks men, but some previous studies have suggested that male infertility contributes to about half of the cases of couple infertility. The reason for much of that male infertility, however, has been a mystery. Until now.

A group of Italian investigators looked at the declining trend in sperm counts over the past 40 years and the increase of childhood obesity. Is there a correlation? The researchers think so. Childhood obesity can be linked to multiple causes, but the researchers zeroed in on the effect that obesity has on metabolic rates and, therefore, testicular growth.
Collecting data on testicular volume, body mass index (BMI), and insulin resistance from 268 boys aged 2-18 years, the researchers discovered that those with normal weight and normal insulin levels had testicular volumes 1.5 times higher than their overweight counterparts and 1.5-2 times higher than those with hyperinsulinemia, building a case for obesity being a factor for infertility later in life.
Since low testicular volume is associated with lower sperm count and production as an adult, putting two and two together makes a compelling argument for childhood obesity being a major male infertility culprit. It also creates even more urgency for the health care industry and community decision makers to focus on childhood obesity.
It sure would be nice to be able to take one of the many risk factors for future human survival off the table. Maybe by taking something, like cake, off the table.
Fecal transplantation moves to the kitchen
Fecal microbiota transplantation is an effective way to treat Clostridioides difficile infection, but, in the end, it’s still a transplantation procedure involving a nasogastric or colorectal tube or rather large oral capsules with a demanding (30-40 capsules over 2 days) dosage. Please, Science, tell us there’s a better way.
Science, in the form of investigators at the University of Geneva and Lausanne University Hospital in Switzerland, has spoken, and there may be a better way. Presenting fecal beads: All the bacterial goodness of donor stool without the tubal insertions or massive quantities of giant capsules.
We know you’re scoffing out there, but it’s true. All you need is a little alginate, which is a “biocompatible polysaccharide isolated from brown algae” of the Phaeophyceae family. The donor feces is microencapsulated by mixing it with the alginate, dropping that mixture into water containing calcium chloride, turning it into a gel, and then freeze-drying the gel into small (just 2 mm), solid beads.
Sounds plausible enough, but what do you do with them? “These brownish beads can be easily dispersed in a liquid or food that is pleasant to eat. They also have no taste,” senior author Eric Allémann, PhD, said in a statement released by the University of Geneva.
Pleasant to eat? No taste? So which is it? If you really want to know, watch fecal beads week on the new season of “The Great British Baking Show,” when Paul and Prue judge poop baked into crumpets, crepes, and crostatas. Yum.
We’re on the low-oxygen diet
Nine out of ten doctors agree: Oxygen is more important to your continued well-being than food. After all, a human can go weeks without food, but just minutes without oxygen. However, ten out of ten doctors agree that the United States has an obesity problem. They all also agree that previous research has shown soldiers who train at high altitudes lose more weight than those training at lower altitudes.

So, on the one hand, we have a country full of overweight people, and on the other, we have low oxygen levels causing weight loss. The solution, then, is obvious: Stop breathing.
More specifically (and somewhat less facetiously), researchers from Louisiana have launched the Low Oxygen and Weight Status trial and are currently recruiting individuals with BMIs of 30-40 to, uh, suffocate themselves. No, no, it’s okay, it’s just when they’re sleeping.
Fine, straight face. Participants in the LOWS trial will undergo an 8-week period when they will consume a controlled weight-loss diet and spend their nights in a hypoxic sealed tent, where they will sleep in an environment with an oxygen level equivalent to 8,500 feet above sea level (roughly equivalent to Aspen, Colo.). They will be compared with people on the same diet who sleep in a normal, sea-level oxygen environment.
The study’s goal is to determine whether or not spending time in a low-oxygen environment will suppress appetite, increase energy expenditure, and improve weight loss and insulin sensitivity. Excessive weight loss in high-altitude environments isn’t a good thing for soldiers – they kind of need their muscles and body weight to do the whole soldiering thing – but it could be great for people struggling to lose those last few pounds. And it also may prove LOTME’s previous thesis: Air is not good.
Overweight boy, infertile man?
When it comes to causes of infertility, history and science have generally focused on women. A lot of the research overlooks men, but some previous studies have suggested that male infertility contributes to about half of the cases of couple infertility. The reason for much of that male infertility, however, has been a mystery. Until now.
A group of Italian investigators looked at the declining trend in sperm counts over the past 40 years and the increase of childhood obesity. Is there a correlation? The researchers think so. Childhood obesity can be linked to multiple causes, but the researchers zeroed in on the effect that obesity has on metabolic rates and, therefore, testicular growth.
Collecting data on testicular volume, body mass index (BMI), and insulin resistance from 268 boys aged 2-18 years, the researchers discovered that those with normal weight and normal insulin levels had testicular volumes 1.5 times higher than their overweight counterparts and 1.5-2 times higher than those with hyperinsulinemia, building a case for obesity being a factor for infertility later in life.
Since low testicular volume is associated with lower sperm count and production as an adult, putting two and two together makes a compelling argument for childhood obesity being a major male infertility culprit. It also creates even more urgency for the health care industry and community decision makers to focus on childhood obesity.
It sure would be nice to be able to take one of the many risk factors for future human survival off the table. Maybe by taking something, like cake, off the table.
Fecal transplantation moves to the kitchen
Fecal microbiota transplantation is an effective way to treat Clostridioides difficile infection, but, in the end, it’s still a transplantation procedure involving a nasogastric or colorectal tube or rather large oral capsules with a demanding (30-40 capsules over 2 days) dosage. Please, Science, tell us there’s a better way.
Science, in the form of investigators at the University of Geneva and Lausanne University Hospital in Switzerland, has spoken, and there may be a better way. Presenting fecal beads: All the bacterial goodness of donor stool without the tubal insertions or massive quantities of giant capsules.
We know you’re scoffing out there, but it’s true. All you need is a little alginate, which is a “biocompatible polysaccharide isolated from brown algae” of the Phaeophyceae family. The donor feces is microencapsulated by mixing it with the alginate, dropping that mixture into water containing calcium chloride, turning it into a gel, and then freeze-drying the gel into small (just 2 mm), solid beads.
Sounds plausible enough, but what do you do with them? “These brownish beads can be easily dispersed in a liquid or food that is pleasant to eat. They also have no taste,” senior author Eric Allémann, PhD, said in a statement released by the University of Geneva.
Pleasant to eat? No taste? So which is it? If you really want to know, watch fecal beads week on the new season of “The Great British Baking Show,” when Paul and Prue judge poop baked into crumpets, crepes, and crostatas. Yum.
We’re on the low-oxygen diet
Nine out of ten doctors agree: Oxygen is more important to your continued well-being than food. After all, a human can go weeks without food, but just minutes without oxygen. However, ten out of ten doctors agree that the United States has an obesity problem. They all also agree that previous research has shown soldiers who train at high altitudes lose more weight than those training at lower altitudes.
So, on the one hand, we have a country full of overweight people, and on the other, we have low oxygen levels causing weight loss. The solution, then, is obvious: Stop breathing.
More specifically (and somewhat less facetiously), researchers from Louisiana have launched the Low Oxygen and Weight Status trial and are currently recruiting individuals with BMIs of 30-40 to, uh, suffocate themselves. No, no, it’s okay, it’s just when they’re sleeping.
Fine, straight face. Participants in the LOWS trial will undergo an 8-week period when they will consume a controlled weight-loss diet and spend their nights in a hypoxic sealed tent, where they will sleep in an environment with an oxygen level equivalent to 8,500 feet above sea level (roughly equivalent to Aspen, Colo.). They will be compared with people on the same diet who sleep in a normal, sea-level oxygen environment.
The study’s goal is to determine whether or not spending time in a low-oxygen environment will suppress appetite, increase energy expenditure, and improve weight loss and insulin sensitivity. Excessive weight loss in high-altitude environments isn’t a good thing for soldiers – they kind of need their muscles and body weight to do the whole soldiering thing – but it could be great for people struggling to lose those last few pounds. And it also may prove LOTME’s previous thesis: Air is not good.
Itchy pustules over hair follicles

A potassium hydroxide (KOH) preparation of pus and dry superficial skin taken from 1 of the pustules revealed multiple hyphae and confirmed a diagnosis of nodular granulomatous perifolliculitis, also called Majocchi granuloma.
Majocchi granuloma is a reactive process of inflammation caused by infection of the follicular unit(s) by a dermatophyte—most often the same Trichophyton species responsible for more superficial tinea. On exam, there may be a solitary papule, pustule, or nodule. More often, there are multiple papules and pustules grouped within an annular plaque in hair-bearing areas on the head, trunk, or extremities. Majocchi granuloma can occur in patients who are healthy and those who are immunosuppressed.1 It can also occur when a topical steroid is applied to unsuspected tinea, as occurred here. In this case, the patient was accustomed to having multiple skin plaques of psoriasis and assumed this was a stubborn manifestation of that.
Because the infection penetrates deeper than most topical therapies can effectively reach at adequate concentrations, systemic medications are the treatments of choice. Terbinafine, itraconazole, and fluconazole are all effective options but need to be used for several weeks to be effective.
This patient received terbinafine 250 mg/d for 6 weeks and the pustules cleared completely. He continued with his other psoriasis medications throughout his treatment.
Photos and text for Photo Rounds Friday courtesy of Jonathan Karnes, MD (copyright retained). Dr. Karnes is the medical director of MDFMR Dermatology Services, Augusta, ME.
1. İlkit M, Durdu M, Karakaş M. Majocchi’s granuloma: a symptom complex caused by fungal pathogens. Med Mycol. 2012;50:449-457. doi: 10.3109/13693786.2012.669503
A potassium hydroxide (KOH) preparation of pus and dry superficial skin taken from 1 of the pustules revealed multiple hyphae and confirmed a diagnosis of nodular granulomatous perifolliculitis, also called Majocchi granuloma.
Majocchi granuloma is a reactive process of inflammation caused by infection of the follicular unit(s) by a dermatophyte—most often the same Trichophyton species responsible for more superficial tinea. On exam, there may be a solitary papule, pustule, or nodule. More often, there are multiple papules and pustules grouped within an annular plaque in hair-bearing areas on the head, trunk, or extremities. Majocchi granuloma can occur in patients who are healthy and those who are immunosuppressed.1 It can also occur when a topical steroid is applied to unsuspected tinea, as occurred here. In this case, the patient was accustomed to having multiple skin plaques of psoriasis and assumed this was a stubborn manifestation of that.
Because the infection penetrates deeper than most topical therapies can effectively reach at adequate concentrations, systemic medications are the treatments of choice. Terbinafine, itraconazole, and fluconazole are all effective options but need to be used for several weeks to be effective.
This patient received terbinafine 250 mg/d for 6 weeks and the pustules cleared completely. He continued with his other psoriasis medications throughout his treatment.
Photos and text for Photo Rounds Friday courtesy of Jonathan Karnes, MD (copyright retained). Dr. Karnes is the medical director of MDFMR Dermatology Services, Augusta, ME.
1. İlkit M, Durdu M, Karakaş M. Majocchi’s granuloma: a symptom complex caused by fungal pathogens. Med Mycol. 2012;50:449-457. doi: 10.3109/13693786.2012.669503
1. İlkit M, Durdu M, Karakaş M. Majocchi’s granuloma: a symptom complex caused by fungal pathogens. Med Mycol. 2012;50:449-457. doi: 10.3109/13693786.2012.669503

Mental health promotion
May is Mental Health Awareness Month, providing us a chance to go beyond discussing the screening, diagnosis, and evidence-based treatments for the mental illnesses of youth. The World Health Organization defines good mental health as “a state of well-being in which the individual realizes his or her own abilities, can cope with the normal stresses of life, can work productively and fruitfully, and is able to make a contribution to his or her own community.” While the science of mental health promotion and disease prevention in childhood and adolescence is relatively young, there are several discrete domains in which you can follow and support your patient’s developing mental health. This begins with the well-being of new parents, and then moves into how parents are helping their children to develop skills to manage their basic daily needs and impulses, their thoughts and feelings, their stresses and their relationships. With a little support from you, parents can confidently help their children develop the foundations for good mental health.
First year of life: Parental mental health

Perhaps the strongest risk factor for serious mental illness in childhood and adulthood is parental neglect during the first year of life, and neglect in the first several months of life is the most commonly reported form of child abuse. Infant neglect is associated with parental depression (and other mental illnesses), parental substance use, and a parent’s own experience of childhood abuse or neglect. Neglect is more common with teenaged parents and parents living in poverty. Pediatricians are uniquely connected to families during the first year of a child’s life. The American Academy of Pediatrics recommends screening new mothers for depression at 1-, 2-, 4-, and 6-month infant check-ups with the Edinburgh Postnatal Depression Screen. Even without a positive screen, new parents may need the fortifications of extra community support to adapt to the changes parenthood brings.
At checkups, ask (both) parents how they are managing the stresses of a new baby. Are they getting restful sleep? Do they have social supports? Are they connected to a community (friends, extended family, faith) or isolated? Are they developing confidence as parents or feeling overwhelmed? Simple guidance, such as “sleep when the baby sleeps” and reassurance that taking good care of themselves is taking good care of the baby is always helpful. Sometimes you will need to refer for treatment or to community supports. Have your list of online and in-person resources at the ready to provide parents with these prescriptions. Supporting parental mental health and adjustment in the first year of life is possibly the most important building block for their child’s future mental health.
Toddlers and up: Emotional literacy
Emotional literacy (sometimes called “emotional intelligence”) is the capacity to recognize, identify, and manage feelings in oneself and in others. This skill begins to develop in infancy when parents respond to their baby’s cries with attunement, feeding or changing them if needed, and at other times simply reflecting their feelings and soothing them with movement, singing, or quiet talking. As children grow, so does their range of feelings, and their (cognitive) capacity to identify and manage them. Parents support this development by being available whenever their young children experience strong emotions, calmly listening, and acknowledging their discomfort. Parents can offer words for describing those feelings, and even be curious with their young children where in their bodies they are feeling them, how they can stay patient while the feeling passes or things they might be able to do to feel better. Parents may want to remove their child’s distress, but staying calm, curious, and present while helping their child to manage it will build their child’s emotional health. Parents can nurture this development in a less intense way by reading books about feelings together and noticing and identifying feelings in other children or in cartoon characters.
School-age children: Adding mindfulness
While a child’s cognitive development unfolds naturally, school-age children can cultivate awareness of their thoughts. This becomes possible after awareness of feelings and parents can help their older children consider whether something they are experiencing is a thought, a feeling, or a fact. They do so in the same way they helped their child develop emotional literacy: By responding with calm, curiosity, and confidence every time their child comes to them in distress (especially mild distress, like boredom!) or with a challenge or a question. With a difficult situation, parents start by helping their child to identify thoughts and feelings before impulsively acting on them. Parents can help children identify what’s in their control, try different approaches, and be flexible if their first efforts don’t work. Children need to learn that failing at things is how we learn and grow. Just like learning to ride a bike, it builds their frustration tolerance, their knowledge that they can do difficult things, and that distress subsides. These are critical building blocks for adolescence, when the challenges become greater and they manage them more independently.

Learning “mindfulness” (a practice that cultivates nonjudgmental awareness of one’s own thoughts, feelings, and sensations) can help children (and parents) to cultivate quiet self-awareness outside of moments of difficulty. “Stop, Breathe, and Think” and “Mindful gNATs” are two free apps that are recommended by the American Academy of Child and Adolescent Psychiatry for children (and their parents) to use to practice this awareness of thoughts and feelings.
Early and later adolescence: Stress management skills
Building on this awareness of thoughts and emotions, adolescents develop adaptive coping skills by facing challenges with the support of their parents nearby. Parents should still be ready to respond to charged emotional moments with calm and curiosity, validating their child’s distress while helping them to consider healthy responses. Helping their teenager to describe their experience, differentiating feelings from thoughts (and facts), and considering different choices within their control is foundational to resilience in adulthood. Parents also help their teenagers by reminding them of the need for good self-care (sleep, exercise, nutrition), nourishing social relationships, and protecting time for rest and recharging activities. Sometimes, parents will think with their teenager about why they are engaged in an activity that is stressful, whether it is authentically important to them, and why. Adolescents should be deepening their sense of identity, interests, talents, and even values, and stressful moments are rich opportunities to do so, with the support of caring adults. Without intentionally building these skills, adolescents will be more prone to managing stress with avoidance or unhealthy coping, such as excessive eating, video gaming, drugs, or alcohol.
Infancy and up: Behavioral healthy habits (sleep, physical activity, nutrition, and screen time)
Healthy habits sound simple, but establishing them is not always easy. The idea of a habit is that it makes managing something challenging or important more automatic, and thus easier and more reliable. Many of the same habits that promote physical health in adulthood also promote mental health: adequate, restful sleep; daily physical activity; a nutritious diet and a healthy relationship with food; and managing screen time in a developmentally appropriate way. Infants depend entirely on their parents for regulation of these behaviors. As their children grow, parents will adapt these routines so that their children are gradually regulating these needs and activities more independently. In each of these areas, children need clear expectations and routines, consistent consequences and positive feedback, and the modeling and patient support of their parents. Educate parents about what good sleep hygiene looks like at each age. Discuss ways to support regular physical activity, especially as a family. Ask the parents about nutrition, including how they manage picky eating; how many family meals they enjoy together; and whether food is ever used to manage boredom or distress. Finally, talk with parents about a developmentally appropriate approach to rules and expectations around screen time and the importance of using family-based rules. Establishing expectations and routines during early childhood means children learn how good it feels to have restful sleep, regular exercise, and happy, healthy family meals. In adolescence, parents can then focus on helping their children to manage temptation, challenge, disappointment, and frustration more independently.
Infancy and up: Relational health
Children develop the skills needed for healthy relationships at home, and they are connected to all of the skills described above. Children need attuned, responsive, and reliable parenting to build a capacity for trust of others, to learn how to communicate honestly and effectively, to learn to expect and offer compassion and respect, and to learn how to handle disagreement and conflict. They learn these skills by watching their parents and by developing the emotional, cognitive, and behavioral healthy habits with their parents’ help. They need a consistently safe and responsive environment at home. They need parents who are attuned and flexible, while maintaining routines and high expectations. They need parents who make time for them when they are sad or struggling, and make time for joy, play, and mindless fun. While a detailed assessment of how the family is functioning may go beyond a check-up, you can ask about those routines that build healthy habits (family mealtime, sleep routines, screen time rules), communication style, and what the family enjoys doing together. Learning about how a family is building these healthy habits and how connected they are to one another can give you a clear snapshot of how well a child may be doing on their mental health growth curve, and what areas might benefit from more active guidance and support.
Dr. Swick is physician in chief at Ohana Center for Child and Adolescent Behavioral Health, Community Hospital of the Monterey (Calif.) Peninsula. Dr. Jellinek is professor emeritus of psychiatry and pediatrics, Harvard Medical School, Boston. Email them at [email protected].
May is Mental Health Awareness Month, providing us a chance to go beyond discussing the screening, diagnosis, and evidence-based treatments for the mental illnesses of youth. The World Health Organization defines good mental health as “a state of well-being in which the individual realizes his or her own abilities, can cope with the normal stresses of life, can work productively and fruitfully, and is able to make a contribution to his or her own community.” While the science of mental health promotion and disease prevention in childhood and adolescence is relatively young, there are several discrete domains in which you can follow and support your patient’s developing mental health. This begins with the well-being of new parents, and then moves into how parents are helping their children to develop skills to manage their basic daily needs and impulses, their thoughts and feelings, their stresses and their relationships. With a little support from you, parents can confidently help their children develop the foundations for good mental health.
First year of life: Parental mental health
Perhaps the strongest risk factor for serious mental illness in childhood and adulthood is parental neglect during the first year of life, and neglect in the first several months of life is the most commonly reported form of child abuse. Infant neglect is associated with parental depression (and other mental illnesses), parental substance use, and a parent’s own experience of childhood abuse or neglect. Neglect is more common with teenaged parents and parents living in poverty. Pediatricians are uniquely connected to families during the first year of a child’s life. The American Academy of Pediatrics recommends screening new mothers for depression at 1-, 2-, 4-, and 6-month infant check-ups with the Edinburgh Postnatal Depression Screen. Even without a positive screen, new parents may need the fortifications of extra community support to adapt to the changes parenthood brings.
At checkups, ask (both) parents how they are managing the stresses of a new baby. Are they getting restful sleep? Do they have social supports? Are they connected to a community (friends, extended family, faith) or isolated? Are they developing confidence as parents or feeling overwhelmed? Simple guidance, such as “sleep when the baby sleeps” and reassurance that taking good care of themselves is taking good care of the baby is always helpful. Sometimes you will need to refer for treatment or to community supports. Have your list of online and in-person resources at the ready to provide parents with these prescriptions. Supporting parental mental health and adjustment in the first year of life is possibly the most important building block for their child’s future mental health.
Toddlers and up: Emotional literacy
Emotional literacy (sometimes called “emotional intelligence”) is the capacity to recognize, identify, and manage feelings in oneself and in others. This skill begins to develop in infancy when parents respond to their baby’s cries with attunement, feeding or changing them if needed, and at other times simply reflecting their feelings and soothing them with movement, singing, or quiet talking. As children grow, so does their range of feelings, and their (cognitive) capacity to identify and manage them. Parents support this development by being available whenever their young children experience strong emotions, calmly listening, and acknowledging their discomfort. Parents can offer words for describing those feelings, and even be curious with their young children where in their bodies they are feeling them, how they can stay patient while the feeling passes or things they might be able to do to feel better. Parents may want to remove their child’s distress, but staying calm, curious, and present while helping their child to manage it will build their child’s emotional health. Parents can nurture this development in a less intense way by reading books about feelings together and noticing and identifying feelings in other children or in cartoon characters.
School-age children: Adding mindfulness
While a child’s cognitive development unfolds naturally, school-age children can cultivate awareness of their thoughts. This becomes possible after awareness of feelings and parents can help their older children consider whether something they are experiencing is a thought, a feeling, or a fact. They do so in the same way they helped their child develop emotional literacy: By responding with calm, curiosity, and confidence every time their child comes to them in distress (especially mild distress, like boredom!) or with a challenge or a question. With a difficult situation, parents start by helping their child to identify thoughts and feelings before impulsively acting on them. Parents can help children identify what’s in their control, try different approaches, and be flexible if their first efforts don’t work. Children need to learn that failing at things is how we learn and grow. Just like learning to ride a bike, it builds their frustration tolerance, their knowledge that they can do difficult things, and that distress subsides. These are critical building blocks for adolescence, when the challenges become greater and they manage them more independently.
Learning “mindfulness” (a practice that cultivates nonjudgmental awareness of one’s own thoughts, feelings, and sensations) can help children (and parents) to cultivate quiet self-awareness outside of moments of difficulty. “Stop, Breathe, and Think” and “Mindful gNATs” are two free apps that are recommended by the American Academy of Child and Adolescent Psychiatry for children (and their parents) to use to practice this awareness of thoughts and feelings.
Early and later adolescence: Stress management skills
Building on this awareness of thoughts and emotions, adolescents develop adaptive coping skills by facing challenges with the support of their parents nearby. Parents should still be ready to respond to charged emotional moments with calm and curiosity, validating their child’s distress while helping them to consider healthy responses. Helping their teenager to describe their experience, differentiating feelings from thoughts (and facts), and considering different choices within their control is foundational to resilience in adulthood. Parents also help their teenagers by reminding them of the need for good self-care (sleep, exercise, nutrition), nourishing social relationships, and protecting time for rest and recharging activities. Sometimes, parents will think with their teenager about why they are engaged in an activity that is stressful, whether it is authentically important to them, and why. Adolescents should be deepening their sense of identity, interests, talents, and even values, and stressful moments are rich opportunities to do so, with the support of caring adults. Without intentionally building these skills, adolescents will be more prone to managing stress with avoidance or unhealthy coping, such as excessive eating, video gaming, drugs, or alcohol.
Infancy and up: Behavioral healthy habits (sleep, physical activity, nutrition, and screen time)
Healthy habits sound simple, but establishing them is not always easy. The idea of a habit is that it makes managing something challenging or important more automatic, and thus easier and more reliable. Many of the same habits that promote physical health in adulthood also promote mental health: adequate, restful sleep; daily physical activity; a nutritious diet and a healthy relationship with food; and managing screen time in a developmentally appropriate way. Infants depend entirely on their parents for regulation of these behaviors. As their children grow, parents will adapt these routines so that their children are gradually regulating these needs and activities more independently. In each of these areas, children need clear expectations and routines, consistent consequences and positive feedback, and the modeling and patient support of their parents. Educate parents about what good sleep hygiene looks like at each age. Discuss ways to support regular physical activity, especially as a family. Ask the parents about nutrition, including how they manage picky eating; how many family meals they enjoy together; and whether food is ever used to manage boredom or distress. Finally, talk with parents about a developmentally appropriate approach to rules and expectations around screen time and the importance of using family-based rules. Establishing expectations and routines during early childhood means children learn how good it feels to have restful sleep, regular exercise, and happy, healthy family meals. In adolescence, parents can then focus on helping their children to manage temptation, challenge, disappointment, and frustration more independently.
Infancy and up: Relational health
Children develop the skills needed for healthy relationships at home, and they are connected to all of the skills described above. Children need attuned, responsive, and reliable parenting to build a capacity for trust of others, to learn how to communicate honestly and effectively, to learn to expect and offer compassion and respect, and to learn how to handle disagreement and conflict. They learn these skills by watching their parents and by developing the emotional, cognitive, and behavioral healthy habits with their parents’ help. They need a consistently safe and responsive environment at home. They need parents who are attuned and flexible, while maintaining routines and high expectations. They need parents who make time for them when they are sad or struggling, and make time for joy, play, and mindless fun. While a detailed assessment of how the family is functioning may go beyond a check-up, you can ask about those routines that build healthy habits (family mealtime, sleep routines, screen time rules), communication style, and what the family enjoys doing together. Learning about how a family is building these healthy habits and how connected they are to one another can give you a clear snapshot of how well a child may be doing on their mental health growth curve, and what areas might benefit from more active guidance and support.
Dr. Swick is physician in chief at Ohana Center for Child and Adolescent Behavioral Health, Community Hospital of the Monterey (Calif.) Peninsula. Dr. Jellinek is professor emeritus of psychiatry and pediatrics, Harvard Medical School, Boston. Email them at [email protected].
New protocol could cut fasting period to detect insulinomas
SEATTLE – , therefore yielding significant hospital cost savings, new data suggest.
Insulinomas are small, rare types of pancreatic tumors that are benign but secrete excess insulin, leading to hypoglycemia. More than 99% of people with insulinomas develop hypoglycemia within 72 hours, hence, the use of a 72-hour fast to detect these tumors.
But most people who are evaluated for hypoglycemia do not have an insulinoma and fasting in hospital for 3 days is burdensome and costly.
As part of a quality improvement project, Cleveland Clinic endocrinology fellow Michelle D. Lundholm, MD, and colleagues modified their hospital’s protocol to include measurement of beta-hydroxybutyrate (BHB), a marker of insulin suppression, every 12 hours with a cutoff of ≥ 2.7mmol/L for stopping the fast if hypoglycemia (venous glucose ≤ 45mg/dL) hasn’t occurred. This intervention cut in half the number of patients who needed to fast for the full 72 hours, without missing any insulinomas.
“We are excited to share how a relatively simple adjustment to our protocol allowed us to successfully reduce the burden of fasting on patients and more effectively utilize hospital resources. We hope that this encourages other centers to consider doing the same,” Dr. Lundholm said in an interview.
“These data support a 48-hour fast. The literature supports that’s sufficient to detect 95% of insulinomas. ... But, given our small insulinoma cohort, we are looking forward to learning from other studies,” she added.
Dr. Lundholm presented the late-breaking oral abstract at the annual scientific & clinical congress of the American Association of Clinical Endocrinology.
Asked to comment, session moderator Jenna Sarvaideo, MD, said: “We’re often steeped in tradition. That’s why this abstract and this quality improvement project is so exciting to me because it challenges the history. … and I think it’s ultimately helping patients.”
Dr. Sarvaideo, of Clement J. Zablocki VA Medical Center, Milwaukee, noted that, typically, although the fast will be stopped before 72 hours if the patient develops hypoglycemia, “often they don’t, so we keep going on and on. If we just paid more attention to the beta-hydroxybutyrate, I think that would be practice changing.”
She added that more data would be optimal, given that there were under 100 patients in the study, “but I do think that devising protocols is … very much still at the hands of the endocrinologists. I think that this work could make groups reevaluate their protocol and change it, maybe even with a small dataset and then move on from there and see what they see.”
Indeed, Dr. Lundholm pointed out that some institutions, such as the Mayo Clinic, already include 6-hour BHB measurements (along with glucose and insulin) in their protocols.
“For any institution that already draws regular BHB levels like this, it would be very easy to implement a new stopping criterion without adding any additional costs,” she said in an interview.
All insulinomas became apparent in less than 48 hours
The first report to look at the value of testing BHB at regular intervals was published by the Mayo Clinic in 2005 after they noticed patients without insulinoma were complaining of ketosis symptoms such as foul breath and digestive problems toward the end of the fast.
However, although BHB testing is used today as part of the evaluation, it’s typically only drawn at the start of the protocol and again at the time of hypoglycemia or at the end of 72 hours because more frequent values hadn’t been thought to be useful for guiding clinical management, Dr. Lundholm explained.
Between January 2018 and June 2020, Dr. Lundholm and colleagues followed 34 Cleveland Clinic patients who completed the usual 72-hour fast protocol. Overall, 71% were female, and 26% had undergone prior bariatric surgery procedures. Eleven (32%) developed hypoglycemia and stopped fasting. The other 23 (68%) fasted for the full 72 hours.
Dr. Lundholm and colleagues determined that the fast could have ended earlier in 35% of patients based on an elevated BHB without missing any insulinomas.
And so, in June 2020 the group revised their protocol to include the BHB ≥ 2.7mmol/L stopping criterion. Of the 30 patients evaluated from June 2020 to January 2023, 87% were female and 17% had undergone a bariatric procedure.
Here, 15 (50%) reached a BHB ≥ 2.7mmol/L and ended their fast at an average of 43.8 hours. Another seven (23%) ended the fast after developing hypoglycemia. Just eight patients (27%) fasted for the full 72 hours.
Overall, this resulted in approximately 376 fewer cumulative hours of inpatient admission than if patients had fasted for the full time.
Of the 64 patients who have completed the fasting protocol since 2018, seven (11%) who did have an insulinoma developed hypoglycemia within 48 hours and with a BHB < 2.7 mmol/L (median, 0.15).
Advantages: cost, adherence
A day in a general medicine bed at Cleveland Clinic was quoted as costing $2,420, based on publicly available information as of Jan. 1, 2023. “If half of patients leave 1 day earlier, this equates to about $1,210 per patient in savings from bed costs alone,” Dr. Lundholm told this news organization.
The revised protocol required an additional two to four blood draws, depending on the length of the fast. “The cost of these extra blood tests varies by lab and by count, but even at its highest does not exceed the amount of savings from bed costs,” she noted.
Patient adherence is another potential benefit of the revised protocol.
“Any study that requires 72 hours of patient cooperation is a challenge, particularly in an uncomfortable position like fasting. When we looked at these adherence numbers, we found that the percentage of patients who prematurely ended their fast decreased from 35% to 17% with the updated protocol,” Dr. Lundholm continued.
“This translates to fewer inconclusive results and fewer readmissions for repeat 72-hour fasting. While this was not our primary outcome, it was another noted benefit of our change,” she said.
Dr. Lundholm and Dr. Sarvaideo have reported no relevant financial relationships.
A version of this article originally appeared on Medscape.com.
AT AACE 2023