User login
Lack of paid sick leave is a barrier to cancer screening
“Our results provide evidence for policymakers considering legislative or regulatory solutions to address insufficient screening adherence and highlight an understudied benefit of expanding paid sick leave coverage,” wrote authors who were led by Kevin Callison, PhD, of the Tulane University School of Public Health and Tropical Medicine, New Orleans.
The findings were published earlier this year in the New England Journal of Medicine.
Despite an Affordable Care Act provision eliminating most cost-sharing for cancer screening, the rate for recommended breast and colorectal cancer screening among U.S. adults is lower than 70%. Work commitments, time constraints, and the prospect of lost wages are frequently cited as contributing factors to this underuse of preventive care. Researchers hypothesized that having paid sick leave coverage for the use of preventive services could improve adherence to cancer screening guidelines. With continued failure to pass a bill mandating federal paid sick leave legislation, nearly 30% of the nation’s workforce lacks this coverage. Rates are lower for low-income workers, women, and underserved racial and ethnic groups, the authors write.
Coverage mandates have become politically contentious, as evidenced by the fact that their passage by some states (n = 17), counties (n = 4) and cities (n = 18) has been met by many states (n = 18) passing preemption laws banning municipalities from adopting the laws.
In this study, researchers examined the rate of colorectal and breast cancer screening at 12- and 24-month intervals among people living in one of 61 cities. Before paid sick leave mandates were put in place, cancer screening rates were similar across the board. But once mandates were put in place, cancer screening rates were higher among workers affected by the mandate by 1.31% (95% confidence interval, 0.28-2.34) for 12-month colorectal cancer screening, 1.56% (95% CI, 0.33-2.79) for 24-month colorectal cancer screening, 1.22% (95% CI, −0.20 to 2.64) for 12-month mammography, and 2.07% (95% CI, 0.15-3.99) for 24-month mammography.
“Although these appear to be modest effects, spread across a large population, these indicate a fairly substantial gain in cancer screenings,” Dr. Callison said.
Prior studies showing positive associations between having paid sick leave coverage and whether someone receives cancer screenings are likely confounded by selection bias because they compare workers who have such coverage to those who do not, Dr. Callison and colleagues state in their paper.
“Although the lack of paid sick leave coverage may hinder access to preventive care, current evidence is insufficient to draw meaningful conclusions about its relationship to cancer screening,” the authors write, citing that particularly health conscious workers may take jobs offering sick leave coverage.
Through quasi-experimental design, the present study aimed to overcome such confounding issues. Its analytic sample, using administrative data from the Merative MarketScan Research Databases, encompassed approximately 2.5 million person-specific records per year for the colorectal cancer screening sample. The researchers’ mammography sample included 1.3 million person-specific records per year of the period examined.
The associations cited above translate into relative colorectal cancer screening increases of 8.1% in the 12-month adjusted model and a 5.9% relative increase from the premandate rate in the 24-month adjusted model. The rate was 1.56 percentage points (95% CI, 0.33-2.79) higher in the cities subject to the paid sick leave mandates (a 5.9% relative increase from the premandate rate). For screening mammography in the cities subject to the mandates, the 12-month adjusted 1.22% increase (95% CI, –0.20 to 2.64) represented a 2.5% relative increase from the premandate level. The adjusted 24-month rate increase of 2.07% (95% CI, 0.15-4.00) represented a 3.3% relative increase from premandate rates.
“However, these estimates are averages across all workers in our sample, many of whom likely already had paid sick leave coverage prior to the enactment of a mandate,” Dr. Callison said in the interview. “In fact, in other work related to this project, we estimated that about 28% of private sector workers gain paid sick leave when a mandate is enacted. So then, if we scale our findings by the share of workers actually gaining paid sick leave coverage, our estimates are much larger – a 9%-12% increase in screening mammography and a 21%-29% increase in colorectal cancer screening.”
Dr. Callison and his team are in the process of developing a follow-up proposal that would examine the effects of paid sick leave on downstream outcomes of the cancer care continuum, such as timing from diagnosis to treatment initiation. “We also hope to examine who benefits from these additional screens and what they mean for health equity. Data limitations prevented us from exploring that issue in the current study,” he said.
Dr. Callison had no conflicts associated with this study.
FROM THE NEW ENGLAND JOURNAL OF MEDICINE
Therapeutic Approaches in Advanced Breast Cancer
Troponin to ID diabetes patients with silent heart disease?
– based on data from a representative sample of more than 10,000 U.S. adults.
The finding suggests hs-cTnT maybe a useful marker for adults with diabetes who could benefit from more aggressive CVD risk reduction despite having no clinical indications of CVD.
The results “highlight the substantial burden of subclinical CVD in persons with diabetes and emphasize the importance of early detection and treatment of CVD for this high-risk population,” say the authors of the research, published in the Journal of the American Heart Association.

“This is the first study to examine subclinical CVD, defined by elevated cardiac biomarkers, in a nationally representative population of adults with or without diabetes. It provides novel information on the high burden of subclinical CVD [in American adults with diabetes] and the potential utility of hs-cTnT for monitoring this risk in people with diabetes,” said Elizabeth Selvin, PhD, senior author and a professor of epidemiology at Johns Hopkins University, Baltimore.
“What we are seeing is that many people with type 2 diabetes who have not had a heart attack or a history of cardiovascular disease are at high risk for cardiovascular complications,” added Dr. Selvin in an AHA press release. “When we look at the whole population of people diagnosed with type 2 diabetes, about 27 million adults in the U.S., according to the [Centers for Disease Control and Prevention], some are at low risk and some are at high risk for cardiovascular disease, so the open question is: ‘Who is most at risk?’ These cardiac biomarkers give us a window into cardiovascular risk in people who otherwise might not be recognized as highest risk.”
“Our results provide evidence to support use of cardiac biomarkers for routine risk monitoring in high-risk populations such as people with diabetes,” Dr. Selvin noted in an interview.
Need for aggressive CVD risk reduction
The findings also indicate that people with diabetes and an elevated hs-cTnT “should be targeted for aggressive cardiovascular risk reduction, including lifestyle interventions, weight loss, and treatment with statins, blood pressure medications, and cardioprotective therapies such as sodium-glucose cotransporter 2 (SGLT-2) inhibitors and glucagonlike peptide-1 (GLP-1) receptor agonists,” Dr. Selvin added.
“Cholesterol is often the factor that we target to reduce the risk of cardiovascular disease in people with type 2 diabetes,” she observed. “However, type 2 diabetes may have a direct effect on the heart not related to cholesterol levels. If type 2 diabetes is directly causing damage to the small vessels in the heart unrelated to cholesterol plaque buildup, then cholesterol-lowering medications are not going to prevent cardiac damage,” Dr. Selvin explained. “Our research suggests that additional non–statin-related therapies are needed to lower the cardiovascular disease risk in people with type 2 diabetes.”
However, she noted that a necessary step prior to formally recommending such a strategy is to run clinical trials to assess the efficacy of specific treatments, such as SGLT-2 inhibitors and GLP-1 agonists, in people with diabetes and elevated hs-cTnT.

“Randomized controlled trials would be best to test the relevance of measuring these biomarkers to assess risk in asymptomatic people with diabetes,” as well as prospective study of the value of hs-cTnT to guide treatment, commented Robert H. Eckel, MD, an endocrinologist affiliated with the University of Colorado at Denver, Aurora.
“I doubt measurements [of hs-cTnT] would be reimbursed [by third-party payers] if carried out without such outcome data,” he added.
Dr. Eckel also highlights the need to further validate in additional cohorts the link between elevations in hs-cTnT and CVD events in adults with diabetes, and to confirm that elevated levels of another cardiac biomarker – N-terminal of the prohormone brain natriuretic peptide (NT-proBNP) – do not work as well as troponin as a risk marker for people with diabetes, another finding of the study.
ADA report already recommends testing these biomarkers for HF
However, a consensus report published in 2022 by the American Diabetes Association laid out the case for routinely and regularly measuring levels of both high sensitivity cardiac troponin and natriuretic peptides in people with diabetes for early identification of incident heart failure.
“Among individuals with diabetes, measurement of a natriuretic peptide or high-sensitivity cardiac troponin is recommended on at least a yearly basis to identify the earliest heart failure stages and implement strategies to prevent transition to symptomatic heart failure,” noted the ADA consensus report on heart failure.
The new study run by Dr. Selvin and coauthors used data collected by the National Health and Nutrition Examination Survey (NHANES) between 1999 and 2004 from U.S. adults who were at least 20 years old and had no history of CVD: myocardial infarction, stroke, coronary heart disease, or heart failure. This included 9,273 people without diabetes and 1,031 with diabetes, defined as a prior diagnosis or hemoglobin A1c of at least 6.5%.
“Cardiovascular risk varies substantially in adults with type 2 diabetes, highlighting the need for accurate risk stratification,” the authors observed.
All study participants had recorded measures of hs-cTnT and NT-proBNP.
The researchers considered an hs-cTnT level of greater than 14 ng/L and an NT-proBNP level of greater than 125 pg/mL as indicators of subclinical CVD.
The crude prevalence of elevated NT-proBNP was 33.4% among those with diabetes and 16.1% in those without diabetes. Elevated hs-cTnT occurred in 19% of those with diabetes and in 5% of those without diabetes. Elevated levels of both markers existed in 9% of those with diabetes and in 3% of those without diabetes.
“Approximately one in three adults with diabetes had subclinical CVD, with 19% having elevated levels of hs-cTnT, 23% having elevated NT-proBNP, and 9% having elevations in both cardiac biomarkers,” the researchers noted.
Diabetes linked with a doubled prevalence of elevated hs-cTnT
After adjustment for several demographic variables as well as traditional CVD risk factors, people with diabetes had a significant 98% higher rate of elevated hs-cTnT, compared with those without diabetes. But after similar adjustments, the rate of elevated NT-proBNP was significantly lower among people with diabetes, compared with controls, by a relative reduction of 24%.
“Our findings suggest that, in people with diabetes, hs-cTnT may be more useful [than NT-proBNP] for general risk monitoring, as its interpretation is less complicated,” said Dr. Selvin, who explained that “NT-proBNP is affected by overweight and obesity.”
In people with diabetes, the age-adjusted prevalence of elevated hs-cTnT ran higher in those with longer duration diabetes, and in those with less well-controlled diabetes based on a higher level of A1c. Neither of these factors showed any significant relationship with measured levels of NT-proBNP.
Further analysis linked the NHANES findings during 1999-2004 with U.S. national death records through the end of 2019. This showed that elevated levels of both hs-cTnT and NT-proBNP significantly linked with subsequently higher rates of all-cause mortality among people with diabetes. Elevated hs-cTnT linked with a 77% increased mortality and NT-proBNP linked with a 78% increased rate, compared with people with diabetes and no elevations in these markers, after adjustment for demographic variables and CVD risk factors.
However, for the outcome of cardiovascular death, elevated hs-cTnT linked with a nonsignificant 54% relative increase, while elevated NT-proBNP linked with a significant 2.46-fold relative increase.
The study “adds new data on biomarkers that are not routinely measured in asymptomatic people with or without diabetes” and the relationships of these markers to CVD mortality and all-cause mortality, Dr. Eckel concluded.
The study received no commercial funding, but used reagents donated by Abbott Laboratories, Ortho Clinical Diagnostics, Roche Diagnostics, and Siemens Healthcare Diagnostics. Dr. Selvin and Dr. Eckel had no disclosures.
A version of this article first appeared on Medscape.com.
– based on data from a representative sample of more than 10,000 U.S. adults.
The finding suggests hs-cTnT maybe a useful marker for adults with diabetes who could benefit from more aggressive CVD risk reduction despite having no clinical indications of CVD.
The results “highlight the substantial burden of subclinical CVD in persons with diabetes and emphasize the importance of early detection and treatment of CVD for this high-risk population,” say the authors of the research, published in the Journal of the American Heart Association.
“This is the first study to examine subclinical CVD, defined by elevated cardiac biomarkers, in a nationally representative population of adults with or without diabetes. It provides novel information on the high burden of subclinical CVD [in American adults with diabetes] and the potential utility of hs-cTnT for monitoring this risk in people with diabetes,” said Elizabeth Selvin, PhD, senior author and a professor of epidemiology at Johns Hopkins University, Baltimore.
“What we are seeing is that many people with type 2 diabetes who have not had a heart attack or a history of cardiovascular disease are at high risk for cardiovascular complications,” added Dr. Selvin in an AHA press release. “When we look at the whole population of people diagnosed with type 2 diabetes, about 27 million adults in the U.S., according to the [Centers for Disease Control and Prevention], some are at low risk and some are at high risk for cardiovascular disease, so the open question is: ‘Who is most at risk?’ These cardiac biomarkers give us a window into cardiovascular risk in people who otherwise might not be recognized as highest risk.”
“Our results provide evidence to support use of cardiac biomarkers for routine risk monitoring in high-risk populations such as people with diabetes,” Dr. Selvin noted in an interview.
Need for aggressive CVD risk reduction
The findings also indicate that people with diabetes and an elevated hs-cTnT “should be targeted for aggressive cardiovascular risk reduction, including lifestyle interventions, weight loss, and treatment with statins, blood pressure medications, and cardioprotective therapies such as sodium-glucose cotransporter 2 (SGLT-2) inhibitors and glucagonlike peptide-1 (GLP-1) receptor agonists,” Dr. Selvin added.
“Cholesterol is often the factor that we target to reduce the risk of cardiovascular disease in people with type 2 diabetes,” she observed. “However, type 2 diabetes may have a direct effect on the heart not related to cholesterol levels. If type 2 diabetes is directly causing damage to the small vessels in the heart unrelated to cholesterol plaque buildup, then cholesterol-lowering medications are not going to prevent cardiac damage,” Dr. Selvin explained. “Our research suggests that additional non–statin-related therapies are needed to lower the cardiovascular disease risk in people with type 2 diabetes.”
However, she noted that a necessary step prior to formally recommending such a strategy is to run clinical trials to assess the efficacy of specific treatments, such as SGLT-2 inhibitors and GLP-1 agonists, in people with diabetes and elevated hs-cTnT.
“Randomized controlled trials would be best to test the relevance of measuring these biomarkers to assess risk in asymptomatic people with diabetes,” as well as prospective study of the value of hs-cTnT to guide treatment, commented Robert H. Eckel, MD, an endocrinologist affiliated with the University of Colorado at Denver, Aurora.
“I doubt measurements [of hs-cTnT] would be reimbursed [by third-party payers] if carried out without such outcome data,” he added.
Dr. Eckel also highlights the need to further validate in additional cohorts the link between elevations in hs-cTnT and CVD events in adults with diabetes, and to confirm that elevated levels of another cardiac biomarker – N-terminal of the prohormone brain natriuretic peptide (NT-proBNP) – do not work as well as troponin as a risk marker for people with diabetes, another finding of the study.
ADA report already recommends testing these biomarkers for HF
However, a consensus report published in 2022 by the American Diabetes Association laid out the case for routinely and regularly measuring levels of both high sensitivity cardiac troponin and natriuretic peptides in people with diabetes for early identification of incident heart failure.
“Among individuals with diabetes, measurement of a natriuretic peptide or high-sensitivity cardiac troponin is recommended on at least a yearly basis to identify the earliest heart failure stages and implement strategies to prevent transition to symptomatic heart failure,” noted the ADA consensus report on heart failure.
The new study run by Dr. Selvin and coauthors used data collected by the National Health and Nutrition Examination Survey (NHANES) between 1999 and 2004 from U.S. adults who were at least 20 years old and had no history of CVD: myocardial infarction, stroke, coronary heart disease, or heart failure. This included 9,273 people without diabetes and 1,031 with diabetes, defined as a prior diagnosis or hemoglobin A1c of at least 6.5%.
“Cardiovascular risk varies substantially in adults with type 2 diabetes, highlighting the need for accurate risk stratification,” the authors observed.
All study participants had recorded measures of hs-cTnT and NT-proBNP.
The researchers considered an hs-cTnT level of greater than 14 ng/L and an NT-proBNP level of greater than 125 pg/mL as indicators of subclinical CVD.
The crude prevalence of elevated NT-proBNP was 33.4% among those with diabetes and 16.1% in those without diabetes. Elevated hs-cTnT occurred in 19% of those with diabetes and in 5% of those without diabetes. Elevated levels of both markers existed in 9% of those with diabetes and in 3% of those without diabetes.
“Approximately one in three adults with diabetes had subclinical CVD, with 19% having elevated levels of hs-cTnT, 23% having elevated NT-proBNP, and 9% having elevations in both cardiac biomarkers,” the researchers noted.
Diabetes linked with a doubled prevalence of elevated hs-cTnT
After adjustment for several demographic variables as well as traditional CVD risk factors, people with diabetes had a significant 98% higher rate of elevated hs-cTnT, compared with those without diabetes. But after similar adjustments, the rate of elevated NT-proBNP was significantly lower among people with diabetes, compared with controls, by a relative reduction of 24%.
“Our findings suggest that, in people with diabetes, hs-cTnT may be more useful [than NT-proBNP] for general risk monitoring, as its interpretation is less complicated,” said Dr. Selvin, who explained that “NT-proBNP is affected by overweight and obesity.”
In people with diabetes, the age-adjusted prevalence of elevated hs-cTnT ran higher in those with longer duration diabetes, and in those with less well-controlled diabetes based on a higher level of A1c. Neither of these factors showed any significant relationship with measured levels of NT-proBNP.
Further analysis linked the NHANES findings during 1999-2004 with U.S. national death records through the end of 2019. This showed that elevated levels of both hs-cTnT and NT-proBNP significantly linked with subsequently higher rates of all-cause mortality among people with diabetes. Elevated hs-cTnT linked with a 77% increased mortality and NT-proBNP linked with a 78% increased rate, compared with people with diabetes and no elevations in these markers, after adjustment for demographic variables and CVD risk factors.
However, for the outcome of cardiovascular death, elevated hs-cTnT linked with a nonsignificant 54% relative increase, while elevated NT-proBNP linked with a significant 2.46-fold relative increase.
The study “adds new data on biomarkers that are not routinely measured in asymptomatic people with or without diabetes” and the relationships of these markers to CVD mortality and all-cause mortality, Dr. Eckel concluded.
The study received no commercial funding, but used reagents donated by Abbott Laboratories, Ortho Clinical Diagnostics, Roche Diagnostics, and Siemens Healthcare Diagnostics. Dr. Selvin and Dr. Eckel had no disclosures.
A version of this article first appeared on Medscape.com.
FROM THE JOURNAL OF THE AMERICAN HEART ASSOCIATION
Circadian curiosities
Summer is here. Well, technically not for 3 weeks, but in Phoenix summer as a weather condition generally runs from March to November.
The suprachiasmatic nucleus (yes, the one you learned in neuroanatomy) is pretty tiny, but still remarkable. Nothing brings that into focus like the changing of the seasons.
No matter where you live on Earth, you still have to deal with day and night, even if each is 6 months long. We all have to live with shifting schedules and lengths of night and day and weekdays and weekends.

But what fascinates me is how the internal clock reprograms itself, and then doesn’t change.
Case in point: Except for when I’ve had to catch a flight, I haven’t set an alarm in almost 10 years. Somewhere early in my career (back when I did a lot of hospital work) I began getting up between 4-5 a.m. to start rounds before going to the office.
Today the habit continues. It’s been 14 years since I last did weekday hospital call but I still automatically wake up, ready to go, between 4 a.m. and 5 a.m., Monday through Friday. Without me having to do anything this shuts off on vacations, holidays, and weekends, but is up and running as soon as I have to go back to the office.
It’s fascinating (at least to me) in that the suprachiasmatic nucleus didn’t evolve many millions of years ago so I could get to work without an alarm clock. Early animals needed to respond to changing conditions of night, day, and shifting seasons. Light and dark are universal for almost everything that walks, flies, and swims, so given enough time a way of internally keeping track of them developed. Bears use it to hibernate. Birds to migrate with the seasons.
Of course, it’s not all good. In some people it’s likely behind the bizarre predictability of their cluster headaches.
In the modern era we’ve also found ways to confuse it, with the invention of time zones and air travel. Anyone who’s made the leap across several time zones has had to adjust. It’s certainly not a major issue, but does take some getting used to.
But still, it’s pretty fascinating stuff. A reminder that,
Dr. Block has a solo neurology practice in Scottsdale, Ariz.
Summer is here. Well, technically not for 3 weeks, but in Phoenix summer as a weather condition generally runs from March to November.
The suprachiasmatic nucleus (yes, the one you learned in neuroanatomy) is pretty tiny, but still remarkable. Nothing brings that into focus like the changing of the seasons.
No matter where you live on Earth, you still have to deal with day and night, even if each is 6 months long. We all have to live with shifting schedules and lengths of night and day and weekdays and weekends.
But what fascinates me is how the internal clock reprograms itself, and then doesn’t change.
Case in point: Except for when I’ve had to catch a flight, I haven’t set an alarm in almost 10 years. Somewhere early in my career (back when I did a lot of hospital work) I began getting up between 4-5 a.m. to start rounds before going to the office.
Today the habit continues. It’s been 14 years since I last did weekday hospital call but I still automatically wake up, ready to go, between 4 a.m. and 5 a.m., Monday through Friday. Without me having to do anything this shuts off on vacations, holidays, and weekends, but is up and running as soon as I have to go back to the office.
It’s fascinating (at least to me) in that the suprachiasmatic nucleus didn’t evolve many millions of years ago so I could get to work without an alarm clock. Early animals needed to respond to changing conditions of night, day, and shifting seasons. Light and dark are universal for almost everything that walks, flies, and swims, so given enough time a way of internally keeping track of them developed. Bears use it to hibernate. Birds to migrate with the seasons.
Of course, it’s not all good. In some people it’s likely behind the bizarre predictability of their cluster headaches.
In the modern era we’ve also found ways to confuse it, with the invention of time zones and air travel. Anyone who’s made the leap across several time zones has had to adjust. It’s certainly not a major issue, but does take some getting used to.
But still, it’s pretty fascinating stuff. A reminder that,
Dr. Block has a solo neurology practice in Scottsdale, Ariz.
Abortion restrictions linked to less evidence-based care for miscarriages
BALTIMORE – , according to a cross-sectional study presented at the annual clinical and scientific meeting of the American College of Obstetricians and Gynecologists and published in Obstetrics & Gynecology.
The results revealed that “abortion restrictions have far-reaching effects on early pregnancy loss care and on resident education,” the researchers concluded.
“Abortion restrictions don’t just affect people seeking abortions; they affect people also suffering from early pregnancy loss,” Aurora Phillips, MD, an ob.gyn. resident at Albany (N.Y.) Medical Center, said in an interview. “It’s harder to make that diagnosis and to be able to offer interventions, and these institutions that had restrictions also were less likely to have mifepristone or office based human aspiration, which are the most efficient and cost-effective interventions that we have.”
For example, less than half the programs surveyed offered mifepristone to help manage a miscarriage, “with availability varying inversely with abortion restrictions,” they found. After considering all characteristics of residency programs, “institutional abortion restrictions and bans were more important than state policies or religious affiliation in determining whether evidence-based early pregnancy loss treatments were available,” the researchers found, though their findings predated the Supreme Court’s Dobbs ruling that overturned Roe v. Wade. “Training institutions with a commitment to evidence-based family planning care and education are able to ensure access to the most evidence-based, cost-effective, and timely treatments for pregnancy loss even in the face of state abortion restrictions, thereby preserving patient safety, physician competency, and health care system sustainability,” they wrote.
Reduced access leads to higher risk interventions
An estimated 10%-20% of pregnancies result in early miscarriage, totaling more than one million cases in the U.S. each year. But since treatments for miscarriage often overlap with those for abortion, the researchers wondered whether differences existed in how providers managed miscarriages in states or institutions with strict abortion restrictions versus management in hospitals without restrictions.
They also looked at how closely the management strategies adhered to ACOG’s recommendations, which advise that providers consider both ultrasound imaging and other factors, including clinical reasoning and patient preferences, before diagnosing early pregnancy loss and considering possible interventions.
For imaging guidelines, ACOG endorses the criteria established for ultrasound diagnosis of first trimester pregnancy loss from the Society of Radiologists in 2012. But, the authors note, these guidelines are very conservative, exceeding previous measurements that had a 99%-100% predictive value for pregnancy loss, in the interest of “[prioritizing preservation of] fetal potential over facilitating expeditious care.” Hence the reason ACOG advises providers to include clinical judgment and patient preferences in their approach to care.
”In places where abortion is heavily regulated, clinicians managing miscarriages may cautiously rely on the strictest criteria to differentiate early pregnancy loss from potentially viable pregnancy and may not offer certain treatments commonly associated with abortion,” the authors noted. ACOG recommends surgical aspiration and medical treatment with both mifepristone and misoprostol as the safest and most effective options in managing miscarriages.
“Treating early pregnancy loss without the use of mifepristone is more likely to fail, is more likely to require an unscheduled procedure, and people who choose medication management for their miscarriages are usually trying to avoid a procedure, so that is the downside of not using mifepristone,” coauthor Rachel M. Flink-Bochacki, MD, an associate professor at Albany (N.Y.) Medical Center, said in an interview.
“Office-based uterine aspiration has the same safety profile as uterine aspiration in the operating room minus the risks of anesthesia and also helps patients get in faster because they don’t need to wait for OR time,” Dr. Flink-Bochacki explained. “So again, for a patient who wants an aspiration and does not want to pass the pregnancy at home, not having access to office-based aspiration could lead them to miscarry at home, which has higher risks and is not what they wanted.”
Reduced access to miscarriage care options in ‘hostile’ states
Among all 296 U.S. ob.gyn. residency programs that were contacted between November 2021 and January 2022, half (50.3%) responded to the researchers’ survey about their institutional practices around miscarriage, including location of diagnosis, use of ultrasound diagnostic guidelines, treatment options offered by their institution, and institutional restrictions on abortions based on indication.
The survey also collected characteristics of each program, including its state, setting, religious affiliation, and affiliation with the Ryan Training Program in Abortion and Family Planning. The responding sample had similar geographic distribution and state abortion policies as those who did not respond, but the responding programs were slightly more likely to be academic programs and to be affiliated with the Ryan program.
At the time of the study, prior to the Dobbs ruling, more than half the U.S. states had legislation restricting abortion care, and 57% of national teaching hospitals had internal restrictions that limited care based on gestational age and indication, particularly if the indication was elective, the authors reported. The researchers relied on designations from the Guttmacher Institute in December 2020 to categorize states as “hostile” to abortion (very hostile, hostile, and leans hostile) or non-hostile (neutral, leans supportive, supportive, and very supportive).
Most of the programs (80%) had no religious affiliation, but 11% had a Catholic affiliation and 5% had a different Christian affiliation. Institutional policies either had no restrictions on abortion care (38%), had restrictions (39%) based on certain maternal or fetal indications, or completely banned abortion services unless the mother’s life was threatened (23%). Among the Christian-affiliated programs, 60% had bans and 40% had restrictions.
Half (49.7%) of the responding programs relied rigidly on ultrasound criteria before offering any intervention for suspected early pregnancy loss, regardless of patient preferences. The other half (50.3%) incorporated ultrasound criteria and other factors, including clinical judgment and patient preferences, into a holistic determination of what options to present to the patient.
Before accounting for other factors, the researchers found that only a third (33%) of programs in states with severe abortion restrictions considered additional factors besides imaging when offering patients options for miscarriage management. In states without such abortion restrictions, 79% of programs considered both imaging and other factors (P < .001).
In states with “hostile abortion legislation,” only 32% of the programs used mifepristone for miscarriage management, compared with 75% of the programs in states without onerous abortion restrictions (P < .001). The results were similar for use of office-based suction aspiration: Just under half the programs (48%) in states with severe abortion restrictions included this technique as part of standard miscarriage management, compared with 68% of programs in states without such restrictions (P = .014).
Those findings match up with the experience of Cara Heuser, MD, a maternal-fetal medicine specialist from Salt Lake City, who was not involved in this study.
“We had a lot of restrictions even before Roe fell,” including heavy regulation of mifepristone, Dr. Heuser said in an interview. “In non-restricted states, it’s pretty easy to get, but even before Roe in our state, it was very, very difficult to get institutions and individual doctor’s offices to carry mifepristone to treat miscarriages. They were still treating miscarriages in a way that was known to be less effective.” Adding mifepristone to misoprostol reduces the risk of needing an evacuation surgery procedure, she explained, “so adding the mifepristone makes it safer.”
Institutional policies had the strongest impact
Before accounting for the state a hospital was in, 27% of institutions with restrictive abortion policies looked at more than imaging in determining how to proceed, compared with 88% of institutions without abortion restrictions that included clinical judgment and patient preferences in their management.
After controlling for state policies and affiliation with a family planning training program or a religious entity, the odds of an institution relying solely on imaging guidelines were over 12 times greater for institutions with abortion restrictions or bans (odds ratio, 12.3; 95% confidence interval, 3.2-47.9). Specifically, the odds were 9 times greater for institutions with restrictions and 27 times greater for institutions with bans.
Only 12% of the institutions without restrictions relied solely on ultrasound criteria, compared with 67% of the institutions with restrictions and 82% of the institutions that banned all abortions except to save the life of the pregnant individual (P < .001).
Only one in four (25%) of the programs with institutional abortion restrictions used mifepristone, compared with 86% of unrestricted programs (P < .001), and 40% of programs with institutional abortion restrictions used office-based aspiration, compared with 81% of unrestricted programs (P < .001).
Without access to all evidence-based treatments, doctors are often forced to choose expectant management for miscarriages. “So you’re kind of forced to have them to pass the pregnancy at home, which can be traumatic for patients” if that’s not what they wanted, Dr. Phillips said.
Dr. Flink-Bochacki further noted that this patient population is already particularly vulnerable.
“Especially for patients with early pregnancy loss, it’s such a feeling of powerlessness already, so the mental state that many of these patients are in is already quite fraught,” Dr. Flink-Bochacki said. “Then to not even have power to choose the interventions that you want or to be able to access interventions in a timely fashion because you’re being held to some arbitrary guideline further takes away the power and further exacerbates the trauma of the experience.”
The biggest factor likely driving the reduced access to those interventions is the fear that the care could be confused with providing an abortion instead of simply managing a miscarriage, Dr. Flink-Bochacki said. “I think that’s why a lot of these programs don’t have mifepristone and don’t offer outpatient uterine aspiration,” she said. “Because those are so widely used in abortion and the connotation is with abortion, they’re just kind of steering clear of it, but meanwhile, patients with pregnancy loss are suffering because they’re being unnecessarily restrictive.”
The research did not use any external funding, and the authors and Dr. Heuser had no disclosures.
AT ACOG 2023
COVID boosters effective, but not for long
This transcript has been edited for clarity.
Welcome to Impact Factor, your weekly dose of commentary on a new medical study.
I am here today to talk about the effectiveness of COVID vaccine boosters in the midst of 2023. The reason I want to talk about this isn’t necessarily to dig into exactly how effective vaccines are. This is an area that’s been trod upon multiple times. But it does give me an opportunity to talk about a neat study design called the “test-negative case-control” design, which has some unique properties when you’re trying to evaluate the effect of something outside of the context of a randomized trial.
So, just a little bit of background to remind everyone where we are. These are the number of doses of COVID vaccines administered over time throughout the pandemic.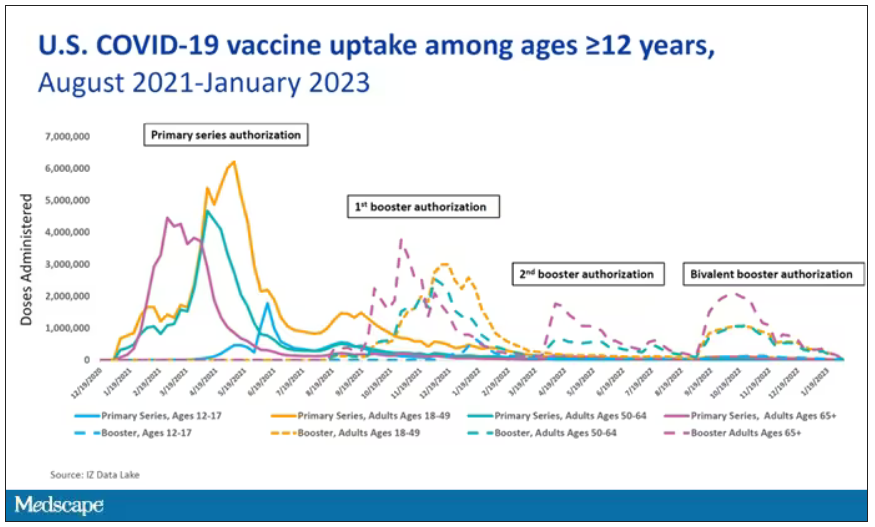
You can see that it’s stratified by age. The orange lines are adults ages 18-49, for example. You can see a big wave of vaccination when the vaccine first came out at the start of 2021. Then subsequently, you can see smaller waves after the first and second booster authorizations, and maybe a bit of a pickup, particularly among older adults, when the bivalent boosters were authorized. But still very little overall pickup of the bivalent booster, compared with the monovalent vaccines, which might suggest vaccine fatigue going on this far into the pandemic. But it’s important to try to understand exactly how effective those new boosters are, at least at this point in time.
I’m talking about Early Estimates of Bivalent mRNA Booster Dose Vaccine Effectiveness in Preventing Symptomatic SARS-CoV-2 Infection Attributable to Omicron BA.5– and XBB/XBB.1.5–Related Sublineages Among Immunocompetent Adults – Increasing Community Access to Testing Program, United States, December 2022–January 2023, which came out in the Morbidity and Mortality Weekly Report very recently, which uses this test-negative case-control design to evaluate the ability of bivalent mRNA vaccines to prevent hospitalization.
The question is: Does receipt of a bivalent COVID vaccine booster prevent hospitalizations, ICU stay, or death? That may not be the question that is of interest to everyone. I know people are interested in symptoms, missed work, and transmission, but this paper was looking at hospitalization, ICU stay, and death.
What’s kind of tricky here is that the data they’re using are in people who are hospitalized with various diseases. You might look at that on the surface and say: “Well, you can’t – that’s impossible.” But you can, actually, with this cool test-negative case-control design.
Here’s basically how it works. You take a population of people who are hospitalized and confirmed to have COVID. Some of them will be vaccinated and some of them will be unvaccinated. And the proportion of vaccinated and unvaccinated people doesn’t tell you very much because it depends on how that compares with the rates in the general population, for instance. Let me clarify this. If 100% of the population were vaccinated, then 100% of the people hospitalized with COVID would be vaccinated. That doesn’t mean vaccines are bad. Put another way, if 90% of the population were vaccinated and 60% of people hospitalized with COVID were vaccinated, that would actually show that the vaccines were working to some extent, all else being equal. So it’s not just the raw percentages that tell you anything. Some people are vaccinated, some people aren’t. You need to understand what the baseline rate is.
The test-negative case-control design looks at people who are hospitalized without COVID. Now who those people are (who the controls are, in this case) is something you really need to think about. In the case of this CDC study, they used people who were hospitalized with COVID-like illnesses – flu-like illnesses, respiratory illnesses, pneumonia, influenza, etc. This is a pretty good idea because it standardizes a little bit for people who have access to healthcare. They can get to a hospital and they’re the type of person who would go to a hospital when they’re feeling sick. That’s a better control than the general population overall, which is something I like about this design.
Some of those people who don’t have COVID (they’re in the hospital for flu or whatever) will have been vaccinated for COVID, and some will not have been vaccinated for COVID. And of course, we don’t expect COVID vaccines necessarily to protect against the flu or pneumonia, but that gives us a way to standardize.
If you look at these Venn diagrams, I’ve got vaccinated/unvaccinated being exactly the same proportion, which would suggest that you’re just as likely to be hospitalized with COVID if you’re vaccinated as you are to be hospitalized with some other respiratory illness, which suggests that the vaccine isn’t particularly effective.
However, if you saw something like this, looking at all those patients with flu and other non-COVID illnesses, a lot more of them had been vaccinated for COVID. What that tells you is that we’re seeing fewer vaccinated people hospitalized with COVID than we would expect because we have this standardization from other respiratory infections. We expect this many vaccinated people because that’s how many vaccinated people there are who show up with flu. But in the COVID population, there are fewer, and that would suggest that the vaccines are effective. So that is the test-negative case-control design. You can do the same thing with ICU stays and death.
There are some assumptions here which you might already be thinking about. The most important one is that vaccination status is not associated with the risk for the disease. I always think of older people in this context. During the pandemic, at least in the United States, older people were much more likely to be vaccinated but were also much more likely to contract COVID and be hospitalized with COVID. The test-negative design actually accounts for this in some sense, because older people are also more likely to be hospitalized for things like flu and pneumonia. So there’s some control there.
But to the extent that older people are uniquely susceptible to COVID compared with other respiratory illnesses, that would bias your results to make the vaccines look worse. So the standard approach here is to adjust for these things. I think the CDC adjusted for age, sex, race, ethnicity, and a few other things to settle down and see how effective the vaccines were.
Let’s get to a worked example.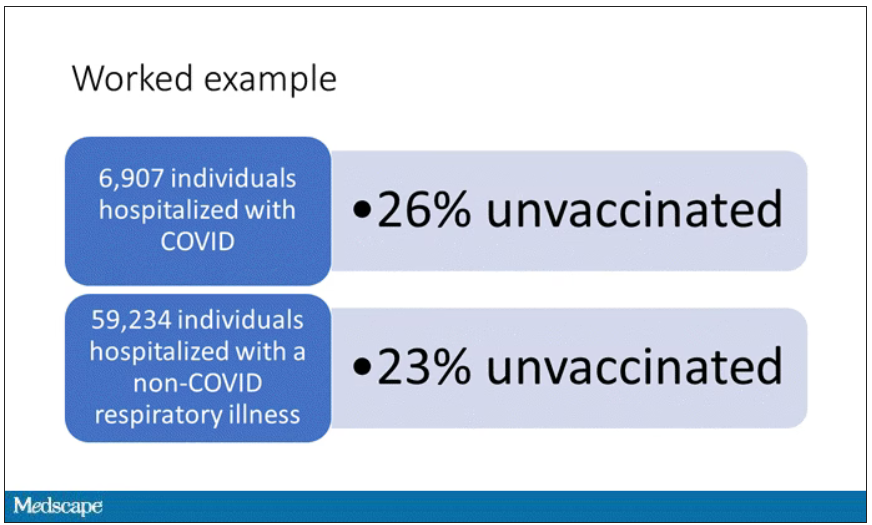
This is the actual data from the CDC paper. They had 6,907 individuals who were hospitalized with COVID, and 26% of them were unvaccinated. What’s the baseline rate that we would expect to be unvaccinated? A total of 59,234 individuals were hospitalized with a non-COVID respiratory illness, and 23% of them were unvaccinated. So you can see that there were more unvaccinated people than you would think in the COVID group. In other words, fewer vaccinated people, which suggests that the vaccine works to some degree because it’s keeping some people out of the hospital.
Now, 26% versus 23% is not a very impressive difference. But it gets more interesting when you break it down by the type of vaccine and how long ago the individual was vaccinated.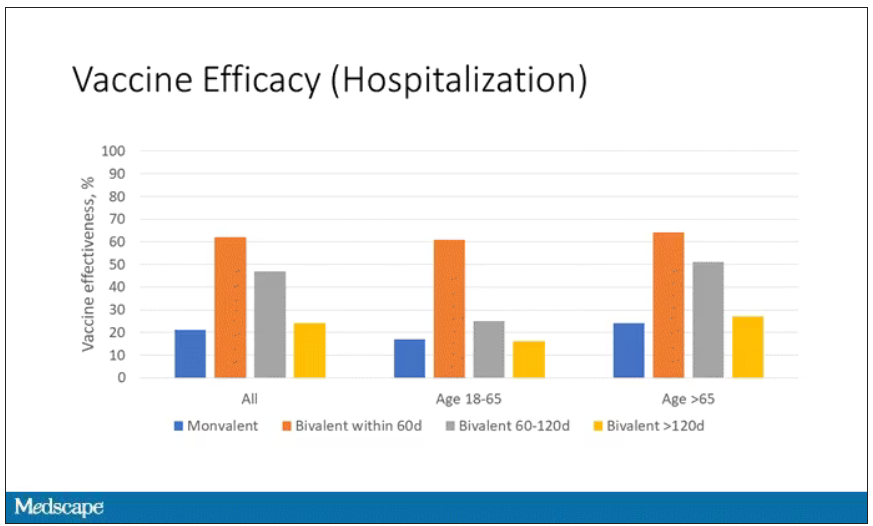
Let’s walk through the “all” group on this figure. What you can see is the calculated vaccine effectiveness. If you look at just the monovalent vaccine here, we see a 20% vaccine effectiveness. This means that you’re preventing 20% of hospitalizations basically due to COVID by people getting vaccinated. That’s okay but it’s certainly not anything to write home about. But we see much better vaccine effectiveness with the bivalent vaccine if it had been received within 60 days.
This compares people who received the bivalent vaccine within 60 days in the COVID group and the non-COVID group. The concern that the vaccine was given very recently affects both groups equally so it shouldn’t result in bias there. You see a step-off in vaccine effectiveness from 60 days, 60-120 days, and greater than 120 days. This is 4 months, and you’ve gone from 60% to 20%. When you break that down by age, you can see a similar pattern in the 18-to-65 group and potentially some more protection the greater than 65 age group.
Why is vaccine efficacy going down? The study doesn’t tell us, but we can hypothesize that this might be an immunologic effect – the antibodies or the protective T cells are waning over time. This could also reflect changes in the virus in the environment as the virus seeks to evade certain immune responses. But overall, this suggests that waiting a year between booster doses may leave you exposed for quite some time, although the take-home here is that bivalent vaccines in general are probably a good idea for the proportion of people who haven’t gotten them.
When we look at critical illness and death, the numbers look a little bit better.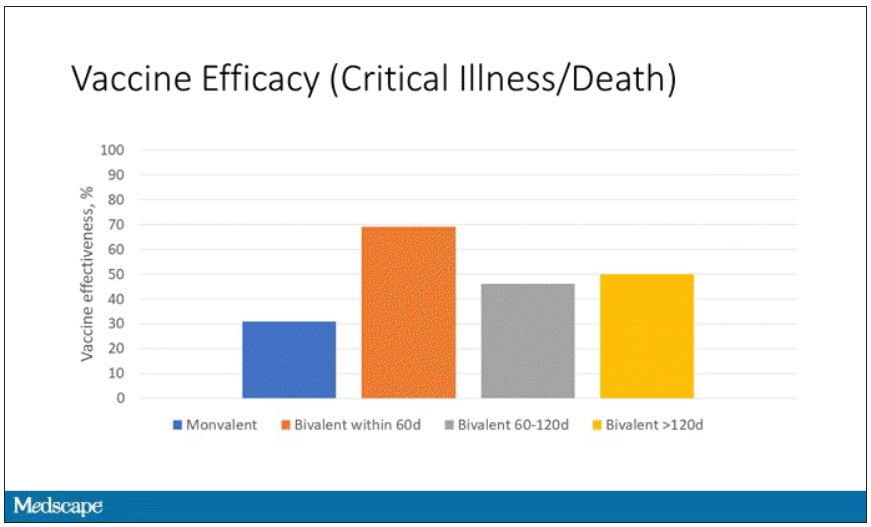
You can see that bivalent is better than monovalent – certainly pretty good if you’ve received it within 60 days. It does tend to wane a little bit, but not nearly as much. You’ve still got about 50% vaccine efficacy beyond 120 days when we’re looking at critical illness, which is stays in the ICU and death.
The overriding thing to think about when we think about vaccine policy is that the way you get immunized against COVID is either by vaccine or by getting infected with COVID, or both.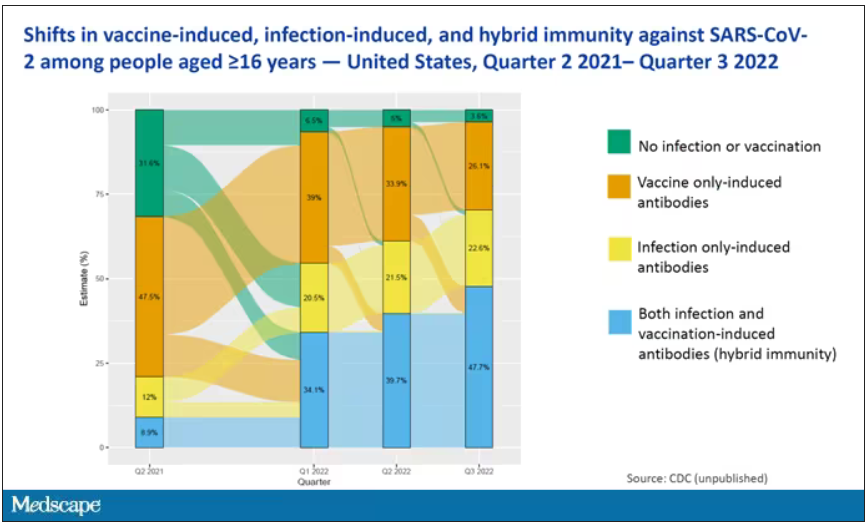
This really interesting graph from the CDC (although it’s updated only through quarter three of 2022) shows the proportion of Americans, based on routine lab tests, who have varying degrees of protection against COVID. What you can see is that, by quarter three of 2022, just 3.6% of people who had blood drawn at a commercial laboratory had no evidence of infection or vaccination. In other words, almost no one was totally naive. Then 26% of people had never been infected – they only have vaccine antibodies – plus 22% of people had only been infected but had never been vaccinated. And then 50% of people had both. So there’s a tremendous amount of existing immunity out there.
The really interesting question about future vaccination and future booster doses is, how does it work on the background of this pattern? The CDC study doesn’t tell us, and I don’t think they have the data to tell us the vaccine efficacy in these different groups. Is it more effective in people who have only had an infection, for example? Is it more effective in people who have only had vaccination versus people who had both, or people who have no protection whatsoever? Those are the really interesting questions that need to be answered going forward as vaccine policy gets developed in the future.
I hope this was a helpful primer on how the test-negative case-control design can answer questions that seem a little bit unanswerable.
F. Perry Wilson, MD, MSCE, is an associate professor of medicine and director of Yale’s Clinical and Translational Research Accelerator. He disclosed no relevant conflicts of interest.
A version of this article first appeared on Medscape.com.
Exercise and empathy can help back pain patients in primary care
Treatment of chronic back pain remains a challenge for primary care physicians, and a new Cochrane Review confirms previous studies suggesting that analgesics and antidepressants fall short in terms of relief.
Data from another Cochrane Review support the value of exercise for chronic low back pain, although it is often underused, and the Food and Drug Administration’s recent approval of a spinal cord stimulation device for chronic back pain opens the door for another alternative.
Regardless of treatment type, however, patients report that empathy and clear communication from their doctors go a long way in their satisfaction with pain management, according to another recent study.
Exercise helps when patients adhere
The objective of the Cochrane Review on “Exercise therapy for chronic low back pain” was to determine whether exercise improves pain and functioning for people with chronic low back pain, compared with no treatment, usual care, or other common treatments, corresponding author Jill Hayden, PhD, of Dalhousie University, Halifax, N.S., said in an interview.
When back pain is chronic, it is expensive in terms of health care costs and lost work hours, said Dr. Hayden. “Exercise is promoted in many guidelines and is often recommended for, and used by, people with chronic low back pain.” However, “systematic reviews have found only small treatment effects, with considerable variation across individual trials.”
The 2021 review is one of the largest in the Cochrane Library, and included 249 trials and 24,486 study participants. However, Dr. Hayden said she had been disappointed by the methodological limitations of many of the trials. “The field is saturated with small exercise trials, many of which suffer from poor planning, conduct, and reporting due to limited resources.”
In the current review, “we found that exercise is likely to be effective for chronic low back pain. Overall, 3 months after the start of treatment, people receiving exercise treatment rated their pain an average of 15 points better on a scale of 0-100, and functional limitations were 7 points better, compared to people who had no treatment or usual care,” said Dr. Hayden.
Barriers to the use of exercise to treat pain may include fear of movement on the part of patients, she noted.
“Although our related network meta-analysis found some differences between specific types of exercise, we found all exercise types are more effective than minimal treatment,” she said. “People with chronic low back pain should be encouraged to do exercises that they enjoy and will do consistently to promote adherence.”
Limitations of medications
Both the safety and effectiveness of analgesics and antidepressants for pain in general and back pain in particular have come under scrutiny in recent research. A study published online in the British Medical Journal of patients with acute low back pain found that, although some medications were associated with large reductions in pain intensity, compared with placebo, the quality of the studies was “low or very low confidence,” according to a Medscape report on the findings.
This conclusion was supported in a large-scale analysis of the safety and effectiveness of antidepressants in chronic pain conditions, including back pain.
A new Cochrane Review led by a team of researchers in the United Kingdom found inadequate evidence to support the effectiveness of most antidepressants used for chronic pain, including amitriptyline, fluoxetine, citalopram, paroxetine, sertraline, and duloxetine.
“While chronic pain remains one of the top causes of daily disability worldwide, clinicians’ choices at offering interventions are getting fewer, especially if they tend toward a medical model and want a pharmacological solution,” corresponding author Tamar Pincus, PhD, of the University of Southampton (England), said in an interview. “We now know that opioids harm patients, and the evidence for common analgesics such as paracetamol and ibuprofen, for some conditions such as back pain, suggest they are not effective and might cause harm. This leaves clinicians with few options, and the most common prescription, supported by guidelines, is antidepressants.”
The study found moderate evidence that duloxetine can reduce pain in the short term and improve physical activity and some evidence that milnacipran might also be effective, Dr. Pincus said. “For all other antidepressants, including the commonly prescribed amitriptyline, the evidence was poor. Of importance, the average length of trials was 10 weeks, so long-term effects for all antidepressants remain unknown, and side effects and adverse events were reported poorly, so we also don’t know if any antidepressants are harmful.”
The takeaway message for the management of back pain in particular? “If a clinician and a patient decide together that it would be a good idea to try an antidepressant to reduce pain, they should consider starting with duloxetine, the drug with supporting evidence,” she said.
Physician attitude matters
Antidepressants may not have much impact on chronic pain, but a physician’s empathy and support do, according to data from a registry study of more than 1,300 individuals.
Despite efforts and guidelines from multiple medical organizations to promote optimal pain management, “much remains unknown regarding how the patient-physician interaction affects the process of delivering medical care for chronic low back pain and, ultimately, patient satisfaction,” John C. Licciardone, DO, of the University of North Texas Health Science Center, Fort Worth, and colleagues wrote in Annals of Family Medicine.
Previous studies have examined the relationship between clinical outcomes and patient satisfaction, but data on patient satisfaction with medical care for chronic low back pain specifically are limited, they said.
The researchers reviewed data from a national pain registry of adults aged 21-79 years that included self-reported measures of physician communication and empathy, prescribing data for opioids, and outcomes data for pain intensity, physical function, and health-related quality of life.
In a multivariate analysis, physician empathy and physician communication showed the strongest associations with patient satisfaction (P < .001).
The researchers found a negligible correlation between opioid prescription and perceived physician empathy and communication, “although current physician prescribing of opioids was also associated with patient satisfaction,” they wrote.
“Our findings pertaining to physician empathy are intriguing because they do not necessarily involve a therapeutic alliance with the patient based on collaborative communication or the expectation of a therapeutic effect via pharmacotherapy,” the researchers wrote .
The findings were limited by several factors including the cross-sectional design that prevented conclusions about cause and effect, the researchers noted. “It is possible that prior improvements in pain intensity, physical function, or [health-related quality of life] might have prompted participants to report more favorable ratings for physician empathy, physician communication, or patient satisfaction at registry enrollment.” However, the study supports the view that patients with low back pain in particular value physicians who validate their concerns and symptoms, and who make an effort to communicate treatment plans clearly.
Back pain patients continue to challenge primary care
“Back pain is a major issue in U.S. health care, in part because too many people have tough physical jobs or longstanding injuries that become chronic,” William Golden, MD, professor of medicine and public health at the University of Arkansas for Medical Sciences, Little Rock, said in an interview.
“There are no magic bullets for a lot of back pain patients, so empathy and support are key drivers,” he noted. “Helping patients maximize functionality as opposed to seeking mythical cures is the stronger line of visit discussions, but that takes a bit of time and skill in interviewing.
“It is fairly well established that duloxetine is useful in pain management, especially when present with mood disorders, either primary or secondary to the back-related disability,” said Dr. Golden. “Greater dissemination of its utility is probably useful, as is the side effect profile of the drug as well,” given the “nasty discontinuation syndrome when the treatment is reduced or stopped.”
Looking ahead, “more research is needed about microsurgery, namely for whom and for what anatomic presentations,” said Dr. Golden. Other topics for further research include a better understanding about medical marijuana and pain management and its interactions and side effects with other opioids and muscle relaxants. “Polypharmacy is still an issue in this class of patient,” and many of these patients are frustrated and angry “so the psychosocial skills of the PCP can be greatly tested as well,” he said.
Empathy promotes patient adherence to treatment
The new opioid prescription guidelines have increased interest among clinicians in how to improve patient satisfaction with the care for back pain provided, Noel Deep, MD, said in an interview. “These studies address this concern and bring forth an important aspect of the physician-patient relationship, namely the human touch and empathy.”
“I have been a strong proponent of the trust and relationship between a physician and patient; displaying empathy and increased and transparent communication between the physician and the patient has always resulted in better relationships and better outcomes for patients, especially those dealing with chronic health concerns,” said Dr. Deep, who is a general internist in a multispecialty group practice with Aspirus Antigo (Wisc.) Clinic and the chief medical officer and a staff physician at Aspirus Langlade Hospital, also in Antigo.
Potential barriers to effective pain management include beliefs and attitudes on the part of patients, Dr. Deep noted. “Physicians lacking adequate time to communicate effectively with the patient and describe nonopioid and nonsurgical interventions would be another potential barrier.” Other issues include the time and effort, as well as cost, associated with interventions such as physical therapy and other nondrug and nonsurgical interventions. Issues with family and social support and health literacy are also potential barriers to pain management.
Clinical takeaways
Low back pain is one of the most common reasons for a visit in primary care and can be “chronic and debilitating,” Grace Lin, MD, an internal medicine physician and primary care provider at the University of California, San Francisco, said in an interview.
“One issue with the Cochrane Review on exercise is that the studies on exercise were heterogeneous, so it’s difficult to know whether there is a particular kind of exercise that would be most effective and should be recommended to patients,” she said.
Furthermore, she said, “there is a physical therapist shortage in the U.S. I practice in a major city with a large health care system, and it can still take months to get an appointment with a physical therapist.” Also, insurance coverage may limit which therapists a patient can see and how many visits they can have.
“On the clinician side, I think physicians need to be better informed about the evidence base for back pain treatment, namely that exercise is effective and that, long term, analgesics are not,” Dr. Lin said. “This might decrease overprescription of ineffective analgesics and encourage more education about and referrals to physical therapy.”
“Physicians should continue to educate patients that physical therapy is the first-line treatment for back pain and that pain medications are secondary,” she said. “I think that analgesics can be effective for the short term to get people to a point where they feel well enough to do physical therapy. Duloxetine also appears to be moderately effective for chronic low back pain, in part because it may also help address coexisting depression and anxiety,” but these options should be reserved for adjuncts to physical therapy for back pain.
The findings from the study on empathy and communication suggest that the main challenges to these behaviors are systemic, said Dr. Lin.
“Our health care system is not conducive to treating chronic back pain,” she said. Primary care visits that last for 15 or 20 minutes are not long enough to diagnose and counsel patients on such a complex problem as chronic low back pain. Since back pain is usually not the only issue the primary care physician is dealing with during that visit, this can lead to patients feeling like their doctor isn’t listening to them and doesn’t care about their pain.
“We need to better understand the mechanisms by which people develop chronic, debilitating back pain,” Dr. Lin said. “I think if we understood this better, more effective and targeted treatments, both pharmacological and nonpharmacological, could be developed.”
The Annals of Family Medicine study received no outside funding, and the researchers had no financial conflicts to disclose. The Cochrane Reviews was supported by the National Institute for Health and Care Research’s Health Technology Assessment program, and the authors had no financial conflicts to disclose. Dr. Golden and Dr. Deep had no financial conflicts to disclose and serve on the editorial advisory board of Internal Medicine News. Dr. Lin disclosed receiving research funding from the Institute for Clinical and Economic Review and the National Institutes of Health.
New treatments under study for celiac disease
CHICAGO –
There are a number of clinical trials underway, including one for the investigational drug TPM502, which carries three gluten-specific antigenic peptides with overlapping T-cell epitopes for the HLA-DQ2.5 gene. And, research is underway for the novel KAN-101, which aims to restore the immune tolerance of gluten by targeting receptors on the liver. It received Fast Track designation by the Food and Drug Administration in 2022.
During the annual Digestive Disease Week® (DDW), researchers shared the results from a new proof-of-concept study for DONQ52, a bispecific antibody that targets HLA-DQ2.5. DONQ52 was found to be highly effective in blocking gluten-specific T cells, said investigator Jason A. Tye-Din, PhD, a researcher with The Walter and Eliza Hall Institute of Medical Research, Melbourne, and an investigator with Chugai Pharmaceutical, which is funding the DONQ52 research which has since advanced to a phase 1 study of 56 patients.
There are no existing drug therapies for celiac disease, which leaves patients with a lifelong, and strict, gluten-free diet as treatment. This strategy, however, often fails to induce mucosal healing or symptom control, and has stimulated a search for novel therapies, said Melinda Y. Hardy, PhD, a postdoctoral researcher with the University of Melbourne, and the first author of the DONQ52 study. While targeting the gluten-specific immune response is highly attractive, it presents safety and pharmacokinetic challenges, so a better alternative would be to develop antibodies that selectively bind to HLA-DQ2.5, which is found in 80%-90% of celiac disease patients, she said. DONQ52 blocks at least 25 gluten peptides, and binds specifically to complexes of HLA-DQ2.5 and a range of immunogenic gluten peptides.
The study included 20 patients who consumed wheat bread for 3 days. Blood samples were taken 1 day before the start of the trial and 6 days after it concluded. Twenty patients were found to be wheat challenged, 10 were barley challenged, and 14 were rye challenged.
All were tested for gluten-specific T-cell responses in the presence or absence of DONQ52, which was designed to reduce the wheat-specific T-cell response because 90% of gluten intake is from wheat. “If you have celiac disease, you have a reservoir of these gluten-specific T cells. When you eat gluten, they’ll be activated and switched on and that’s what we want to block,” Dr. Tye-Din said.
The main assessment – a day 6 wheat challenge among 15 responders – revealed a more than 80% reduction in T-cell responses to a peptide cocktail. DONQ52 also reduced barley and rye T cell responses in a day 6 challenge, although to a lesser degree (40%/80%).
“DONQ52 is designed to target individual peptides that trigger the disease, and we showed that it did it very well to the wheat peptides, well over 80%. That’s a very impressive reduction in responses,” he said. A further test among 20 samples showed that DONQ52 did not activate T-cells nonspecifically. “You don’t want to trigger an unnecessary response,” Dr. Tye-Din added.
“DONQ52 effectively reduces activation of wheat gluten-specific T cells. It also has broad reactivity extending to barley and rye T-cell epitopes,” said Dr. Hardy.
The study was funded by Chugai Pharmaceutical. Dr. Hardy is a coinventor on a provisional patent describing oats peptides in celiac disease therapeutics and diagnostics. Dr. Tye-Din disclosed associations with Chugai, Genentech, Janssen, and Takeda, among others.
DDW is sponsored by the American Association for the Study of Liver Diseases, the American Gastroenterological Association, the American Society for Gastrointestinal Endoscopy, and The Society for Surgery of the Alimentary Tract.
AT DDW 2023
Practice-Changing Data in Crohn's Disease and Inflammatory Bowel Disease From DDW 2023
Upadacitinib in the management of Crohn's disease and novel data challenging standard clinical practice are some of the inflammatory bowel disease (IBD) highlights from Digestive Disease Week (DDW) 2023, as reported by Dr Joseph Feuerstein, from Harvard Medical School, Boston, Massachusetts.
Dr Feuerstein begins by discussing two studies of upadacitinib induction and maintenance in Crohn's disease. Both studies showed that the drug achieved higher fistula closure and remission rates than did placebo, regardless of prior biologic therapy exposure.
The third study chosen by Dr Feuerstein asks whether early resection of ileocecal Crohn's disease might achieve better outcomes than would standard anti–tumor necrosis factor therapy. The study results suggested that early resection could postpone the need for medication for longer than previously thought.
More potentially practice-changing data comes from the SuPREMe-CD study, which showed that using Kono-S anastomosis reduced endoscopic recurrence of Crohn's disease compared with traditional side-to-side anastomosis.
Dr Feuerstein next discusses an analysis of the SAPPHIRE Registry, which found that IBD treatments were not linked to cancer risk. In closing, he reports on a study that showed longer withdrawal time during colonoscopy, meaning longer time spent examining the colon, is associated with improved detection of polypoid dysplasia.
--
Joseph D. Feuerstein, MD, Associate Professor of Medicine, Department of Gastroenterology, Harvard Medical School; Attending in Gastroenterology, Center for Inflammatory Bowel Disease, Beth Israel Deaconess Medical Center, Boston, Massachusetts
Joseph D. Feuerstein, MD, has disclosed no relevant financial relationships.
Digestive Disease Week® was sponsored by the American Gastroenterological Association, the American Association for the Study of Liver Diseases, the American Society for Gastrointestinal Endoscopy, and the Society for Surgery of the Alimentary Tract.

Multiple successive biologic to biosimilar switches deemed safe and effective
CHICAGO – according to analysis of a real world IBD cohort presented at the annual Digestive Disease Week® (DDW).
“These findings are of major socioeconomic importance, especially in low- and middle-income countries where the access to health care may be limited,” said study author Beatriz Gros, MD, an advanced clinical fellow in gastroenterology at Western General Hospital of Edinburgh.

While switching from originator infliximab to biosimilar infliximab is known observationally to be safe and effective, data on single and double switches are scarce, and are lacking on triple switches. Infliximab, the first monoclonal antibody biologic inhibiting anti–tumor necrosis factor was approved by the Food and Drug Administration and by the European Medicines Agency in 1998 and 1999, respectively. Economic pressures led to the development of biosimilars, with the first EMA approval in 2013 and FDA approval in 2016. Uptake in Europe has been broad and expanding following evidence that early therapy is associated with better outcomes. In the United States, a recent RAND Corporation study estimated savings to be $38.4 billion or 5.9% of projected total spending on biologics from 2021 to 2025, Dr. Gros reported.
The Edinburgh IBD unit has undertaken three switch programs starting with originator to CT-P13 in 2016, CT-P13 to SB2 in 2020, and SB2 to CT-P13 in 2021. Their prospective, observational cohort study assessing safety and efficacy after switching from SB2 to CT-P13 has, as a primary endpoint, CT-P13 persistence following the switch from SB2. Stratification of persistence according to the number of switches, effectiveness, immunogenicity, and safety were secondary outcomes.
During routine virtual biologic clinic care, researchers collected clinical disease activity scores (Harvey-Bradshaw Index; partial Mayo score), laboratory parameters (including C-reactive protein [CRP], IFX trough, and antibody levels), and fecal calprotectin on 297 IBD patients (median age, 37 years; 61.6% male). Among them, 67 had three switches, 138 had two switches, and 92 had one switch. Median disease duration was longer (11.4 years) for those with three switches than for two switches (6.3 years) or one switch (2.3 years) (P < .0001)
Infliximab persistence
Out of 297 patients, 269 (90.6%) remained on infliximab at week 24. Reasons for discontinuing treatment were immunogenicity (15/297; 5.1%), secondary loss of response (7/297, 2.4%), adverse events (3/297, 1%), patient’s choice (2/297, 0.7%), and primary nonresponse (1/297, 0.3%).
While infliximab persistence was 82.6%, 92.8% and 97% in patients with one, two and three infliximab switches, respectively (P = .003), after confounder adjustment, the number of switches was not independently associated with infliximab persistence, Dr. Gros said.
What factors actually did predict infliximab persistence? Multivariable analysis identified absence of biochemical remission (CRP > 5 mg/L [hazard ratio, 3.21; 95% confidence interval, 1.43-7.24]); a diagnosis of ulcerative colitis/ inflammatory bowel disease unclassified (HR, 2.69; 95% CI, 1.19-6.06), detectable antibodies against infliximab at switch (HR, 5.81; 95% CI, 2.27-12.84) and time on infliximab (HR, 0.77; 95% CI, 0.62-0.95) as independent predictors for infliximab persistence rather than number of infliximab switches.
Clinical (P = .77), biochemical (P = .75), and fecal biomarker (P = .63) remission rates, Dr. Gros reported, were comparable at baseline, week 12 and week 24, with baseline rates for clinical, biochemical and fecal biomarker remission at 79.4%, 85.2%, and 85.3%, respectively, and at 81%, 86.5%, and 84.4% at week 24.
“Immunogenicity has been a major concern regarding multiple switches, although both our study and previous literature demonstrated that this seemed to be not happening more often to patients who had multiple switches compared to those who had fewer or none. Our study found that, of the 14 (7.1%) patients who developed de novo antibodies, none of them underwent three switches,” she said.
Dr. Gros disclosed relationships with Pfizer, AbbVie, and Jansen.
DDW is sponsored by the American Association for the Study of Liver Diseases, the American Gastroenterological Association, the American Society for Gastrointestinal Endoscopy, and The Society for Surgery of the Alimentary Tract.
CHICAGO – according to analysis of a real world IBD cohort presented at the annual Digestive Disease Week® (DDW).
“These findings are of major socioeconomic importance, especially in low- and middle-income countries where the access to health care may be limited,” said study author Beatriz Gros, MD, an advanced clinical fellow in gastroenterology at Western General Hospital of Edinburgh.
While switching from originator infliximab to biosimilar infliximab is known observationally to be safe and effective, data on single and double switches are scarce, and are lacking on triple switches. Infliximab, the first monoclonal antibody biologic inhibiting anti–tumor necrosis factor was approved by the Food and Drug Administration and by the European Medicines Agency in 1998 and 1999, respectively. Economic pressures led to the development of biosimilars, with the first EMA approval in 2013 and FDA approval in 2016. Uptake in Europe has been broad and expanding following evidence that early therapy is associated with better outcomes. In the United States, a recent RAND Corporation study estimated savings to be $38.4 billion or 5.9% of projected total spending on biologics from 2021 to 2025, Dr. Gros reported.
The Edinburgh IBD unit has undertaken three switch programs starting with originator to CT-P13 in 2016, CT-P13 to SB2 in 2020, and SB2 to CT-P13 in 2021. Their prospective, observational cohort study assessing safety and efficacy after switching from SB2 to CT-P13 has, as a primary endpoint, CT-P13 persistence following the switch from SB2. Stratification of persistence according to the number of switches, effectiveness, immunogenicity, and safety were secondary outcomes.
During routine virtual biologic clinic care, researchers collected clinical disease activity scores (Harvey-Bradshaw Index; partial Mayo score), laboratory parameters (including C-reactive protein [CRP], IFX trough, and antibody levels), and fecal calprotectin on 297 IBD patients (median age, 37 years; 61.6% male). Among them, 67 had three switches, 138 had two switches, and 92 had one switch. Median disease duration was longer (11.4 years) for those with three switches than for two switches (6.3 years) or one switch (2.3 years) (P < .0001)
Infliximab persistence
Out of 297 patients, 269 (90.6%) remained on infliximab at week 24. Reasons for discontinuing treatment were immunogenicity (15/297; 5.1%), secondary loss of response (7/297, 2.4%), adverse events (3/297, 1%), patient’s choice (2/297, 0.7%), and primary nonresponse (1/297, 0.3%).
While infliximab persistence was 82.6%, 92.8% and 97% in patients with one, two and three infliximab switches, respectively (P = .003), after confounder adjustment, the number of switches was not independently associated with infliximab persistence, Dr. Gros said.
What factors actually did predict infliximab persistence? Multivariable analysis identified absence of biochemical remission (CRP > 5 mg/L [hazard ratio, 3.21; 95% confidence interval, 1.43-7.24]); a diagnosis of ulcerative colitis/ inflammatory bowel disease unclassified (HR, 2.69; 95% CI, 1.19-6.06), detectable antibodies against infliximab at switch (HR, 5.81; 95% CI, 2.27-12.84) and time on infliximab (HR, 0.77; 95% CI, 0.62-0.95) as independent predictors for infliximab persistence rather than number of infliximab switches.
Clinical (P = .77), biochemical (P = .75), and fecal biomarker (P = .63) remission rates, Dr. Gros reported, were comparable at baseline, week 12 and week 24, with baseline rates for clinical, biochemical and fecal biomarker remission at 79.4%, 85.2%, and 85.3%, respectively, and at 81%, 86.5%, and 84.4% at week 24.
“Immunogenicity has been a major concern regarding multiple switches, although both our study and previous literature demonstrated that this seemed to be not happening more often to patients who had multiple switches compared to those who had fewer or none. Our study found that, of the 14 (7.1%) patients who developed de novo antibodies, none of them underwent three switches,” she said.
Dr. Gros disclosed relationships with Pfizer, AbbVie, and Jansen.
DDW is sponsored by the American Association for the Study of Liver Diseases, the American Gastroenterological Association, the American Society for Gastrointestinal Endoscopy, and The Society for Surgery of the Alimentary Tract.
AT DDW 2023