User login
Hospitalist Joins C-Suite Elite
Pediatric hospitalist Jeff Sperring, MD, didn't set out to be a hospital administrator. But earlier this month he became the president and CEO of Riley Hospital for Children at Indiana University Health in Indianapolis.
Dr. Sperring's path to the C-suite started in 2002, when he helped launch Riley's pediatric HM program following four years in community practice. The program eventually grew to a team of 22 physicians at four hospital sites. He was promoted to Riley's associate chief medical officer (CMO) in 2007, and in 2009 became the hospital's CMO.
"Being a hospitalist was critical to that progression," Dr. Sperring says. "You understand what needs to be changed. More than anything else it's just being available, willing, and able to help."
Dr. Sperring spearheaded a quality project to address the hospital's average length of stay (LOS), which was excessive by national benchmarks. The project helped reduce Riley's LOS by two full days.
He also helped develop a health-system-wide call center for patient referrals from physicians across the state. "Leading a project leads to additional roles, and that leads to this," he says.
Other keys to his advancement: drawing upon mentors and coaches, both within and outside of his health system; relying on his team in the HM department; and building effective partnerships with community physicians, he says. He has not pursued a formal business degree, focusing instead on leadership development training opportunities, including the multi-professional Hoosier Fellows Program at Indiana University. He plans to continue working as hospitalist at Riley, "a week here and there" when he can squeeze it into his expanded administrative responsibilities.
SHM President Joseph Ming Wah Li, MD, MBA, SFHM, says he is not aware of other examples of working hospitalists rising to the top of their hospital's organizational charts. "But I would expect we'd see more and more hospitalists becoming hospital CEOs—both pediatric and adult," he says.
She's Found Her Calling
Kate Goodrich, MD, MHS, was a medical resident at George Washington University (GW) Medical Center in Washington, D.C., in 1997 when a hospitalist service there was launched. A year later, as chief resident, she was able to work as a hospitalist. She enjoyed HM so much that she stayed on at GW in a faculty position and later directed its growing division of hospital medicine.
“I absolutely loved it,” she says.
But other career interests were calling her away from her patients and working the hospital floor. Eventually, she became a key player in the health reform debate and overhaul. “I became more aware of the issues that the country was grappling with because I was seeing them on the front lines—issues such as poor access to primary care,” she says. “I began to wonder: Why does a sector of my patient population keep getting readmitted to the hospital? Why is it so difficult for them to get medications, even when they have insurance? What happens to people who have poor family support or multiple comorbidities?”
Such questions eventually became more important to her than the clinical questions she encountered. And now she is in position to make even more of a difference to patients at GW and across the country. In March 2010, Dr. Goodrich became medical officer for the Office of the Assistant Secretary for Planning and Evaluation (ASPE) in the U.S. Department of Health and Human Services (HHS). And more recently, she became senior technical advisor in the Office of Clinical Standards and Quality at the Centers for Medicare & Medicaid Services (CMS), working closely with another hospitalist leader, Patrick Conway, MD, MSc, SFHM, who recently was appointed CMS’ chief medical officer (see “Hospitalist Takes Charge,” June 2011, p. 20).
“When I started this job, I was gratified to learn that my experience as a hospitalist had unbelievable relevance,” she says. “It surprised me how often I draw upon that experience. My clinical perspective on quality is really valued.”
She retains that connection by working as a hospitalist three or four weeks a year at GW. “I now view the hospitalist world from a different lens,” she says.
Winding Path to Washington
Dr. Goodrich’s path to a health policy career didn’t happen overnight. She originally enrolled in GW’s School of Public Health, taking classes at night, but soon realized that it would take too long to obtain a public health degree that way. In 2008, the Robert Wood Johnson Clinical Scholars Program, based at Yale University, offered her an opportunity to focus more intensively on research questions. “I discovered at Yale that what was more satisfying to me was application of research into action,” she says.
Sian Spurney, MD, director of GW’s hospital medicine division, once shared an office with Dr. Goodrich. She describes Dr. Goodrich as dedicated and committed. “Although I was admittedly very sad when she left GW to pursue her passion for health policy, I was hardly surprised to hear of her successes since completing the RWJ program,” Dr. Spurney says.
During a 2009 summer internship at HHS while she was doing her Yale coursework, Dr. Goodrich worked with Dr. Conway, who was working as the ASPE medical officer at HHS. Dr. Goodrich helped write a report to Congress on the Federal Coordinating Council for Cost-Effectiveness Research (CER), and became immersed in this area of research. She worked on an interagency work group to assemble a spending plan for $400 million in federal CER allocations.
“One of the premises of CER is that it will lead to improved quality of healthcare, which we all know isn’t where it should be—in part because of uncertainty regarding best care,” she says. “We think CER will help us define best treatment in the hospital, as well as outpatient settings.” Examples, she says, would be the treatment of delirium or care for patients with multiple comorbidities. “Hospitalists are well-positioned to disseminate CER within their hospitals and to train others, actively looking for the right evidence, and applying it in practice,” she adds.
Dr. Goodrich refers to Dr. Conway as a mentor and recalls days when they would “talk about the ways the issues we were working on affect hospitalists and how to make them aware of those issues,” she says. “I found myself drawn like a magnet to the policy stuff, especially during the 2008 election. It finally dawned on me that if I love this so much, why not see if I can make it a career?”
Exciting Times for Public Servants
Dr. Goodrich acknowledges the importance of care transitions and hospital readmissions for the national quality agenda. In fact, while at Yale, she researched care transitions for patients with low health literacy.
“I doubt that any hospitalist would disagree that readmissions are bad for patients, but sometimes they feel like everyone’s looking at them when readmissions happen. As a hospitalist, you know it’s a complex problem, by no means within the control of any single hospitalist,” she says. “But we also know that some hospitals have very low readmission rates. So it can be done, and we need to learn from the high performers.”
Given the current focus on healthcare reform, Dr. Goodrich believes now is an exciting time to be working for the government. She suggests ways that other hospitalists can learn about health policy and participate in its development:
- Get involved in local quality initiatives in the hospital and the community;
- Join SHM’s Public Policy Committee;
- Follow health policy blogs, websites, and other resources offered by HHS, SHM, and private groups such as the Commonwealth Fund; and
- Look into health policy fellowships or training opportunities.
Clinical experience is highly valued throughout CMS, Dr. Conway says, noting Dr. Goodrich’s background as a teaching hospitalist with more than a decade of patient care under her belt.
“In all of CMS, there are less than a hundred physicians in total, and not all of them are still in medical practice. So we have to leverage the clinical skills of that small group. As we develop health policies, that experience gives us a greater understanding of what the policies mean—their potential impact on patients,” he says.
Larry Beresford is a freelance writer based in Oakland, Calif.
Hospitalists on the Move

New Bedford, Mass.-based Southcoast Hospitals Group has announced the appointment of Paul B. Iannini, MD, as physician-in-chief for medicine. Dr. Iannini will directly oversee inpatient medical services, including the hospitalist, intensivist, infectious disease, gastroenterology, endocrinology, and neurology programs. He will work with the medical staff to establish measurements that will facilitate ongoing improvements in the quality of care, efficiency, and cost-effectiveness of care across all three Southcoast Hospitals sites—Charlton Memorial in Fall River, St. Luke’s in New Bedford, and Tobey in Wareham.
Dr. Iannini was formerly vice president for medical services at WellSpan Health in Pennsylvania, with responsibility for 17 hospital-based departments across two hospitals and nine specialty physician practices

David Handin, MD, has been named director of the HM program at Emerson Hospital in Concord, Mass.
Dr. Handin has been a full-time hospitalist at Emerson for the past seven years. He began his career in Arizona, where he served for two years in the Indian Health Service on the Navajo reservation and then worked for two more years in a medical practice in Bisbee, Ariz. He returned to Massachusetts in 2000 as an attending physician on the hospitalist service at Brigham and Women’s Hospital in Boston.

David Bowman, MD, executive director of IPC: The Hospitalist Company Inc.’s Tucson, Ariz., division, has received the Medical Group Management Association (MGMA) and American College of Medical Practice Executives (ACMPE) Physician Executive of the Year award for 2011. The award recognizes a physician executive in a medical group practice who has exhibited outstanding leadership to achieve exceptional performance in the delivery of healthcare in his or her practice and community through personal example and collaborative team management.

Mary Jo Gorman, MD, MBA, MHM, chief executive officer and founder of Advanced ICU Care and former president of SHM, has been named a winner of the 2011 Ernst & Young Entrepreneurial Winning Women competition. The annual competition and leadership program honors female founders or co-founders of businesses whose success demonstrates the creativity, tenacity, and conviction necessary to realize their companies’ full potential and the drive to achieve market leadership.
One of 10 honorees, Dr. Gorman practiced as both an intensivist and a hospitalist physician before founding Advanced ICU Care in 2004. The company combines the technology of telemedicine with the clinical expertise of experienced intensivists and critical-care nurses to provide around-the-clock intensivist coverage.
New Bedford, Mass.-based Southcoast Hospitals Group has announced the appointment of Paul B. Iannini, MD, as physician-in-chief for medicine. Dr. Iannini will directly oversee inpatient medical services, including the hospitalist, intensivist, infectious disease, gastroenterology, endocrinology, and neurology programs. He will work with the medical staff to establish measurements that will facilitate ongoing improvements in the quality of care, efficiency, and cost-effectiveness of care across all three Southcoast Hospitals sites—Charlton Memorial in Fall River, St. Luke’s in New Bedford, and Tobey in Wareham.
Dr. Iannini was formerly vice president for medical services at WellSpan Health in Pennsylvania, with responsibility for 17 hospital-based departments across two hospitals and nine specialty physician practices
David Handin, MD, has been named director of the HM program at Emerson Hospital in Concord, Mass.
Dr. Handin has been a full-time hospitalist at Emerson for the past seven years. He began his career in Arizona, where he served for two years in the Indian Health Service on the Navajo reservation and then worked for two more years in a medical practice in Bisbee, Ariz. He returned to Massachusetts in 2000 as an attending physician on the hospitalist service at Brigham and Women’s Hospital in Boston.
David Bowman, MD, executive director of IPC: The Hospitalist Company Inc.’s Tucson, Ariz., division, has received the Medical Group Management Association (MGMA) and American College of Medical Practice Executives (ACMPE) Physician Executive of the Year award for 2011. The award recognizes a physician executive in a medical group practice who has exhibited outstanding leadership to achieve exceptional performance in the delivery of healthcare in his or her practice and community through personal example and collaborative team management.
Mary Jo Gorman, MD, MBA, MHM, chief executive officer and founder of Advanced ICU Care and former president of SHM, has been named a winner of the 2011 Ernst & Young Entrepreneurial Winning Women competition. The annual competition and leadership program honors female founders or co-founders of businesses whose success demonstrates the creativity, tenacity, and conviction necessary to realize their companies’ full potential and the drive to achieve market leadership.
One of 10 honorees, Dr. Gorman practiced as both an intensivist and a hospitalist physician before founding Advanced ICU Care in 2004. The company combines the technology of telemedicine with the clinical expertise of experienced intensivists and critical-care nurses to provide around-the-clock intensivist coverage.
Business Spotlight
Knoxville, Tenn.-based TeamHealth Holdings Inc. has announced the acquisition of the operations of Integrity Hospitalists Group LLC (IHG). IHG has been providing hospital medicine services at University Medical Center in Lebanon, Tenn., for the past four years. Physicians affiliated with IHG provide the general medical care of hospitalized patients who do not have an assigned PCP, or whose PCP has chosen to transfer care during their patients’ inpatient stay. TeamHealth Hospital Medicine has begun providing services for this 24/7 HM program, which manages about 10,000 patient encounters a year. Alexander Badru, MD, and Anthony Efobi, MD, have been providing inpatient services for University Medical Center since April 2007, and will continue in their roles with TeamHealth.
IPC: The Hospitalist Company Inc. has acquired five small practices in several of the company’s existing markets. The practices include: Lake Hospitalists Inc. in Leesburg, Fla.; the practice of Babar Sanaullah, MD, PLC, in Grand Rapids, Mich.; Comprehensive Wound Care Inc. in Phoenix, Ariz.; the practice of Ed Soumi, MD, PC, in Las Vegas; and the practice of Elliott I. Greenspan, DO, PC, in Bloomfield Hills, Mich. The five practices have a combined total of about 43,000 encounters a year.
IPC: The Hospitalist Company Inc. also has announced a management transition as part of its chief financial officer succession plan. Richard H. Kline has joined IPC as CFO; the company’s longtime CFO, Devra G. Shapiro, will become its chief administrative officer.
Ready to Lead Hospital Medicine?

SHM’s committees shape the future of HM. And you can be a part of that future by nominating yourself or colleagues for one of SHM’s committees, which cover topics from information technology to early career hospitalists and patient safety.
“The vision and the commitment of SHM’s committees are really what keep SHM and hospitalists ahead of the pack,” says SHM president Joseph Ming-Wah Li, MD, MPH, SFHM. “Getting involved in a committee that is relevant to your practice is a great way to share your passion for your work and connect with some of the most influential leaders in our growing specialty.”
Most committees meet regularly via conference call and meet once a year in person at the SHM annual meeting.
The deadline for nominations is Dec. 5. Interested SHM members can learn more by visiting www.hospitalmedicine.org/committees.
Leadership Academy Adds ‘Women in HM Issues’ to Schedule
As with many specialties, female leaders in HM sometimes face different challenges than their male counterparts.
That’s why the next Leadership Academy, Feb. 13-16 in New Orleans, will include special programming specifically designed for women. Program elements include a networking session for female leaders in HM and educational sessions created for them.
“As hospital medicine continues to grow, so will the opportunities for women to become leaders within their hospitals and their hospitalist practices,” says Patience Reich, MD, SFHM. “The Leadership Academy in February will give women the chance to sharpen their leadership skills and share their own experiences with other women in the specialty.”
As part of the special programming for female leaders in healthcare, former healthcare executive and executive coach Kay Cannon will present a special seminar on women in HM. She will share her wisdom about career advancement essentials for the next generation of female leaders.
The academy features two four-day courses: “Foundations for Effective Leadership,” which is presented at every Leadership Academy, and “Advanced Leadership: Strengthening Your Organization,” which is presented once a year.
“Foundations for Effective Leadership” gives participants the primary tools necessary to become a successful HM leader and is the prerequisite for the other two courses in the series. “Advanced Leadership: Strengthening Your Organization” builds on the skills learned in “Foundations” and teaches hospitalists to better grow, manage, and motivate teams.
All SHM Leadership Academy courses are eligible for AMA PRA Category 1 credits.
The New Orleans academy also marks the second Leadership Academy opportunity for hospitalists to learn about SHM’s new Leadership Certification program. By guiding candidates through all three academy courses and a leadership project, Leadership Certification gives hospitalists a new way to tangibly demonstrate their leadership qualifications to their employers—and potential employers.
For more information, visit www.hospitalmedicine.org/leadership.
Simple Interventions Save Lives
A new Health Affairs study tested three relatively simple and inexpensive interventions on a hospital unit to prevent the kinds of hospital-acquired infections that cause the deaths of an estimated 99,000 patients each year. Principal investigator Bradford Harris, MD, and colleagues conducted the research on a pediatric ICU at the University of North Carolina at Chapel Hill School of Medicine, finding that patients admitted after these interventions were implemented left the hospital on average two days earlier, at lower cost, and with a 2.3% lower death rate. Study authors projected annual savings of $12 million for a single PICU.1
The simple measures include strict enforcement of standard hand hygiene policies; guideline-recommended measures for ventilator patients, such as elevating the head of the hospital bed; and compliance with guidelines for maintaining central line catheters, along with educational posters and the use of oral care kits.
A recent article in the “Cleveland Plain Dealer” describes efforts in that city’s hospitals to enforce proper hand hygiene.2 MetroHealth Medical Center hired four employees it calls “infection prevention observers,” whose entire job is to make sure that every caregiver who comes near a patient washes his or her hands. They openly appear on the units carrying clipboards and filling out sheets tracking non-compliance.
The hospital’s hand hygiene compliance rate has reached 98% on all medical units (nationwide, the rate is around 50%), while bloodstream infections have dropped to one-third of what they were in 2010. Cleveland Clinic and University Hospitals achieved similar compliance by employing secret observers of staff hand-washing.
CDC epidemiologist and hand hygiene expert Kate Ellingson, MD, told the newspaper that while awareness of the importance of hand hygiene has long been understood, it is difficult for healthcare workers to follow. But hospitals that use employee monitors, post data, and implement other hand hygiene initiatives tend to show strong compliance.
References
- Harris BD, Hanson H, Christy C, et al. Strict hand hygiene and other practices shortened stays and cut costs and mortality in a pediatric intensive care unit. Health Affairs. 2011;30(9):1751-1761.
- Tribble SJ. Cleveland MetroHealth Medical Center increases hand washing, reduces infections. “Cleveland Plain Dealer” website. Available at: http://www.cleveland.com/healthfit/index.ssf/2011/09/metrohealth_increases_hand_was.html. Accessed Oct. 15, 2011.
Release the Ritual

As bronchiolitis season approaches, my thoughts turn to the yearly struggle that is practicing medicine with others, to include residents, nurses, primary-care providers (PCPs), respiratory therapists, families, colleagues, and subspecialists. What seems to go reasonably well during other parts of the year or with other diagnoses seems to always fall apart at one point or another during “the season.” Inevitably, some manner of awkward conflict will arise with regard to what to do next. I already am filled with anticipation, much in the way that my mouth puckers at the thought of a tart lemon.
It shouldn’t be too much of a stretch for most practicing pediatric hospitalists to understand these feelings. While the care of children hospitalized for bronchiolitis can be remarkably straightforward—watch, wait, and repeat—we recognize that our entire winter existence is filled with machinations of what others seem to want to do to our vulnerable, wheezy infants. Some days I feel as if I am a lone villager defending my baby from possible iatrogenic injury of these marauding tribes.
Although the attackers might be imaginary, the harms are certainly real: irradiation, over-broncho-salinebulization, the antibiotic-probiotic cycle, rhinitis suctionitosa, exsanguination, and, of course, shaken infant “physiotherapy.” If I could grow a beard, I would take my hooded sweatshirt to Montana, because mid-season, that would be my coping mechanism of choice.
In clearer moments, I don’t really see any villains. I simply see human nature. Families come to us looking for a cure. Residents order labs and X-rays because they aren’t sure and they think fancy tests will help (who hasn’t ordered an ESR and CRP in analogous situations?). Nurses and respiratory therapists see improvement after patients visit the ICU pharmacy and wonder why we can’t try those magical drugs pre-decompensation.
As a general rule, the more uncertain and frightening the situation, the more we humans gravitate toward something (perceived to be) more powerful than ourselves for help.
We use the term mythology to describe how the ancient Greeks dealt with this. In medicine, interventions become our myths when we are faced with clinical uncertainty. Or, as I like to say, the less you know, the more you do. When we are dealing primarily with self-limited diseases, our interventional rituals result in overutilization and iatrogenesis.
Pediatric medicine is filled with classic examples of self-limited diseases. Bronchiolitis is the classic inpatient example. Gastroenteritis is another one. Viral pneumonia is a bit of chameleon, but it’s more common than most realize. And lest we forget our outpatient colleagues, we should keep in mind that every day the clinic is filled with visits for colds, viral pharyngitis, or harmless dermatoses.
The Myths of Healing
“Treatments” commonly are used in an attempt to ameliorate the acute course of all these diseases, but not without a healthy degree of safety and/or economic arguments against intervention. I was always taught that the best pediatricians treat only self-limited diseases because everything that they do works. I can pretty much guarantee that whether I give someone with a cold methotrexate or eye of newt, they eventually get better. With all of these diseases, less is more.
As a resident, I remember writing prescriptions for decongestants when my clinic attending told me to, or when I didn’t know how to handle the family. It took the FDA to make the world a safer place for children with colds. A child in Bangladesh with diarrhea and moderate dehydration given oral rehydration and early re-feeding is likely safer than the child receiving intravenous fluids and “clear liquids” in America. Did you know there are actually case reports of iatrogenic kwashiorkor after treatment for gastroenteritis in this country?
Moving beyond safety, the economic imperative for cost-effective care should not be a foreign concept by now. I shudder to think about how the child in Bangladesh might have gotten better for a few pennies, while the child in the U.S. was billed for an ED visit and overnight stay for “poor follow-up.” Waste also comes in forms other than direct costs: Think of how much drug companies spend on marketing drugs for cough and cold medicines instead of investing funds into more research for effective antimicrobials.
As physicians, we know we are doing too much. In a recent report in the Archives of Internal Medicine (2011;171:1582-1585), nearly half of the doctors surveyed felt that their patients received too much care, as opposed to only 6% that felt that they were receiving too little. Reasons for overtreatment included malpractice concerns, clinical performance measures, and inadequate time to spend with patients. The bottom line is that it is often easier to do more than to justify a safer, more cost-effective, and evidence-based course of less intense care. We know what we do.
Our Hospitals, Our Plight
Returning, then, to the wards in winter, how is a lone and oft-overworked hospitalist to solve these problems? Evidence helps, a little. Guidelines built into the flow of care help, a little. Agreement amongst your colleagues helps, a little. But ultimately, I see this as a communication issue.
And by communication, I do not mean beating people over the head with the AAP guidelines (believe me, I’ve tried it and the guidelines just aren’t thick enough).
If we are to enlist the support of families, nurses, learners, respiratory therapists, and other physicians in doing what’s best for the patient, then we must make this work much in the same way that we get others around us change behavior. Think about the PCP who must impact obesity in the family or vaccine distrust. We have to build relationships based on trust. We must elicit others’ goals and describe ours as a shared agenda. Similarly, we need input from everyone around us as to how to move forward. There are far too many humans involved for this to work without constant attention to creating a well-functioning team.
This will not be an easy task, which is perhaps why moving to Montana or a deserted island seems so much easier. But anytime medicine involves more than just one person, there will be a need to communicate effectively. This becomes critically important as the amount of gray regarding risks and benefits increases.
More is less. Less is more. Our patients deserve that we dedicate ourselves to providing them the best possible care.
Dr. Shen is The Hospitalist’s pediatric editor and medical director of hospital medicine at Dell Children’s Medical Center in Austin, Texas.
Dr. Hospitalist: Multiple Variables Factor into HM Compensation

I work with a number of health systems on determining full-market-value (FMV) compensation related to stipends paid to hospital-based specialists. What is your opinion on how compensation should be determined for the physicians to staff hospitals? Would you say that the busier the location, the higher the compensation? Would you say that the more hours the physician works (regardless of productivity), the more pay they receive? Would you say that the more years of experience that a physician has should result in higher compensation?
Curtis H. Bernstein, CPA/ABV, ASA, CVA, MBA,
director, valuation services,
Sinaiko Healthcare Consulting Inc.,
Los Angeles
Dr. Hospitalist responds:
The topic of physician compensation and workload comes up frequently, but this question frames it a bit differently. Namely, what are the external and internal factors at work in determining compensation? Let’s tackle the response in two parts: 1) How do you account for the variability across sites? and 2) How does physician pay vary within a single site? The crux of the first question comes down to trying to interpret physician workload across disparate locations. It’s not laden with quite the same complexity as Gordian’s knot, but it’s close. One could easily answer this question with a lot of “Yes, but ... ” in reference to the all the factors that go into determining compensation. Yes, a busier site would generate more encounters, thus more revenue, and thus more pay. However, that same site might also be so busy as to require more than one physician on at night. A higher-paid, but lower-volume, nocturnist would then skew the workload/pay scale. Same thing with the ICU; if it is fully staffed with intensivists (more likely in a higher-volume setting), then that would remove the single highest paying code for a hospitalist (the 99291: critical care time 35-74 minutes, 4.50 wRVU), and that has the potential to drop reimbursement. Practice management columnist John Nelson, MD, MHM, has written more than a few fantastic columns addressing just these sorts of issues, but let’s concentrate on just the key factors:
- Volume;
- Payor mix/collections;
- Ratio of day shifts to night shifts (optimal is 4:1), assuming that there are dedicated night shifts; and
- Value-added services.
Volume is fairly straightforward, with most hospitalists seeing around 15 patients per day. Now, an average is just that, and practices exist where the daily number is 10 and where the census is 25. Still, it’s an easy number to understand.
Payor mix is a little more complex but should not vary substantially quarter by quarter, though it could vary greatly year to year. (Note: This is independent of collection rate percentage, which is a completely artificial variable.) If Medicare pays $1 for a certain code and the charges are set at $1, then the collection rate is 100%. If the charges are set at $2, then the collection rate will be 50% but bring in the same amount of money. Arcane billing convention aside, from hospital to hospital and region to region, the payor mix and attendant collections will vary. Ratio of day shifts to night shifts posits that there is an optimal ratio of roughly four day shifts for every one night shift. Night shifts are more expensive, in general, so the more day shifts you have to cover your fixed cost of covering the nights, the better. The reason the ratio can’t be 10:1 is that 10 day-rounding hospitalists would generate a daily service of 150+ patients, and there is no way for one nocturnist to safely cross-cover all those folks, much less see new admissions.
Lastly, there are the value-added services that provide the raison d’être for hospitalists. We are fundamentally different from the procedure-based specialties in that our value comes not from increasing revenue (more procedures) but from decreasing costs. Initially, a lot of this focused on length of stay, and now it’s shifting to discussions of core measures, readmission rates, and other quality metrics. What a hospital is willing to pay for this service, which goes above and beyond taking call for unassigned patients, will go a long way toward determining the overall stipend and resultant physician compensation. (For more information on hospitalist compensation and productivity, check out the 2011 State of Hospital Medicine report, www.hospitalmedicine.org/survey)
Those are the basic underpinnings that will determine most of the variable compensation across disparate sites. Still, there can be other local factors (ancillary services, specialty support, EMRs, etc.) that come into play. Any practicing hospitalist can quickly discourse on what makes their job unique. And they are probably right—healthcare, like politics, is local.
I’ve run out of room to answer the second part of the question, which addresses the variable pay for physicians at the same site. Check back for that response next month.
A Distinguished Visitor
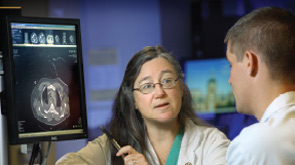
The role of visiting professor brings an additional level of credibility and academic rigor to SHM’s annual meeting. This year’s visiting professor’s interests and experience are perfect fits for hospital medicine.
Pamela A. Lipsett, MD, MHPE, FACS, FCCM, will serve as visiting professor at HM12, April 1-4 in San Diego. Dr. Lipsett is a professor in the department of surgery, anesthesiology, and critical-care medicine at the Johns Hopkins University Schools of Medicine and Nursing in Baltimore. In addition, she is the program director of general surgery and the surgical critical-care fellowship, and is co-director of the surgical ICUs at Johns Hopkins Hospital.
The roles that visiting professors play at SHM’s annual meeting vary, but more often than not, they preside over the popular Research, Innovation, and Clinical Vignettes (RIV) competition and provide guidance to hospitalist attendees.
Dr. Lipsett’s scholarly interests are especially suited to HM12, as much of her research has focused on the hospitalized patient. Among a host of topics, she has researched antibiotic management, hand hygiene, and the psychological issues of hospitalization and long-term follow-up of prolonged ICU stays.
For more information about Dr. Lipsett and HM12, visit www.hospitalmedicine2012.org.
Brendon Shank is SHM’s associate vice president of communications.