User login
Policy Corner: Are ACOs Back? Has CMS Listened to Provider Concerns?
The final rule on accountable-care organizations (ACOs) indicates that the government has taken comments from SHM and other organizations to heart.
ACOs are one of the central vehicles in the 2010 Affordable Care Act (ACA) touted as having the potential to achieve improved care delivery while reducing costs. The theory is that through shared savings, ACOs will provide the financial incentive for providers to develop high-quality, integrated models of care, which will result in the efficiencies needed to reduce overall costs to Medicare.
On March 31, the Centers for Medicare & Medicaid Services (CMS) released a proposed rule designed to turn the ACO theory into reality. In crafting their proposal, CMS had to walk a fine line between establishing sufficient patient protections while still making ACO participation appealing to providers. In the eyes of providers, that proposal flopped. Providers of all types were unified in opposition due to inflexible, overly burdensome requirements that allowed for very little return on an enormous upfront investment.
In commenting on the proposed rule, SHM challenged CMS by stating that limiting the provider incentive within ACOs also will limit the results. Thus, CMS was faced with a choice: Address concerns or risk implementing a program that would likely have very little participation.
Six months later, CMS released a response in the form of a final rule. At 696 pages, the details cannot be covered here, but it appears that CMS has listened. They have made many of the requested changes and it seems as if they have attempted to meet providers halfway in areas where they have not fully adopted suggestions.
For example, the initial proposal would have forced ACOs choosing the one-sided risk model to take downside risk during the third year of their three-year contract period. Providers opposed this proposal because they felt it would not be enough time for some ACOs to develop before taking on risk. The final rule allows ACOs choosing the one-sided model to remain free of risk for the duration of their first contract. Also notable is the elimination of a proposed 25% payment withholding on shared savings.
CMS also is showing some flexibility in areas where they might not have fully made desired changes. A key example can be found in the reduced number of quality measures for ACOs. Although fewer measures would certainly be welcome, it is hard to deny that cutting 65 proposed measures down to 33 is significant. Additionally, CMS has increased the cap on shared savings to 10% from 7.5% in the one-sided model, and to 15% from 10% in the two-sided model. This may seem like a small increase, but it should be remembered that the goal of the program is to save Medicare dollars, and any such increase ultimately reduces the savings that can be realized by Medicare. By making these and many other changes, it is clear that CMS has taken public comments seriously—and acted upon them. The final rule is a major improvement on what was originally proposed; it will breathe new life into the ACO concept.
It is too early to tell how much interest this rule will generate, but with the first round of applications due in early 2012 and the first ACOs slated to become operational April 1, 2012, hospitalists should not be surprised by renewed ACO discussions among colleagues and hospital administrators.
For more information on ACOs and other advocacy issues affecting hospitalists, visit www.hospitalmedicine.org/advocacy.
Survey Insights: It's All Written in Code
One of the questions I am often asked is “What is the typical distribution of CPT codes for hospitalists?” Prior to publication of the 2011 State of Hospital Medicine report, no one could answer that question with any authority. The Centers for Medicare & Medicaid Services (CMS) publishes some Healthcare Procedure Code (HCPC) distribution information by specialty, but because CMS does not recognize HM as a specialty, the closest proxies are the reported distributions for internal medicine (or pediatrics). And hospitalists argue that because their patient population and the work they do are different, typical distributions for those specialties might not be applicable to hospitalists.
“Coding for hospitalists has to be different from other internists,” says SHM Practice Analysis Committee (PAC) member Rachel Lovins, MD, SFHM. “Because we take responsibility for unfamiliar patients that we hand back to other providers, our level of admission and discharge documentation in particular needs to be higher, in order to ensure excellent communication between hospitalists and PCPs.”
We finally have information about hospitalist coding practices, because both the academic and non-academic Hospital Medicine Supplements captured information about the distribution of inpatient admissions (CPT codes 99221, 99222, and 99223), subsequent visits (99231, 99232, and 99233), and discharges (99238 and 99239). Figure 1 shows the average CPT code distribution for non-academic HM groups serving adults only.
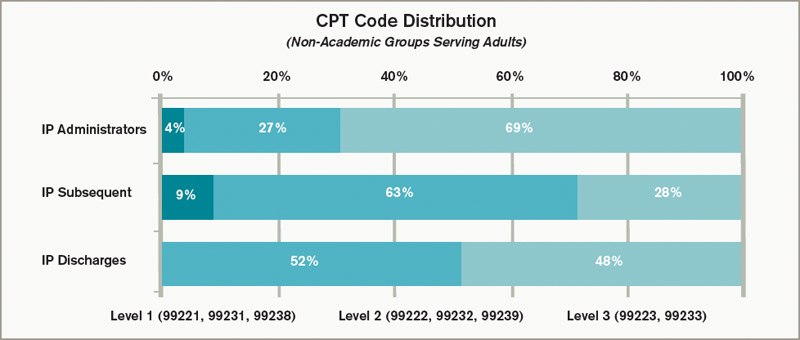
Figure 1. CPT code distribution for non-academic HM groups serving adults
The 2011 State of Hospital Medicine report also shows how CPT distribution varied based on some key practice characteristics. For example, HM practices that are not owned by hospitals/integrated delivery systems tend to code more of their services at higher service levels than do hospital-owned practices. And practices in the Western section of the country tend to code more services at higher levels than other parts of the country.
Other factors are certainly at play as well. “Whether a physician receives training in documentation and coding can have a tremendous impact on CPT distributions,” PAC member Beth Papetti says. “Historically, there has been a tendency for hospitalists to under-code, but through education and enhancements like electronic charge capture, hospitalists can more accurately substantiate the services they provided to the patient.”
Other committee members have speculated that a hospitalist’s compensation model might influence coding patterns, with those who receive less of their total compensation in the form of base salary (and more in the form of productivity and/or performance-based pay) tending to code more of their services at higher levels. But, in fact, the survey data don’t reveal any clear relationship between compensation structure and the average number of work RVUs (relative value units) per encounter.
Interestingly, coding patterns of academic HM practices were similar to those of non-academic practices for admissions and subsequent visits, but academic hospitalists tend to code a higher proportion of discharges at the <30-minute level (99238). PAC members speculate that residents and hospital support staff might perform a larger portion of the discharge coordination and paperwork in academic centers, and attendings can only bill based on their personal time, not time spent by others.
To contribute to a robust CPT distribution database, be sure to participate in the next State of Hospital Medicine survey, scheduled to launch in January 2012.
Leslie Flores, SHM senior advisor, practice management
One of the questions I am often asked is “What is the typical distribution of CPT codes for hospitalists?” Prior to publication of the 2011 State of Hospital Medicine report, no one could answer that question with any authority. The Centers for Medicare & Medicaid Services (CMS) publishes some Healthcare Procedure Code (HCPC) distribution information by specialty, but because CMS does not recognize HM as a specialty, the closest proxies are the reported distributions for internal medicine (or pediatrics). And hospitalists argue that because their patient population and the work they do are different, typical distributions for those specialties might not be applicable to hospitalists.
“Coding for hospitalists has to be different from other internists,” says SHM Practice Analysis Committee (PAC) member Rachel Lovins, MD, SFHM. “Because we take responsibility for unfamiliar patients that we hand back to other providers, our level of admission and discharge documentation in particular needs to be higher, in order to ensure excellent communication between hospitalists and PCPs.”
We finally have information about hospitalist coding practices, because both the academic and non-academic Hospital Medicine Supplements captured information about the distribution of inpatient admissions (CPT codes 99221, 99222, and 99223), subsequent visits (99231, 99232, and 99233), and discharges (99238 and 99239). Figure 1 shows the average CPT code distribution for non-academic HM groups serving adults only.
Figure 1. CPT code distribution for non-academic HM groups serving adults
The 2011 State of Hospital Medicine report also shows how CPT distribution varied based on some key practice characteristics. For example, HM practices that are not owned by hospitals/integrated delivery systems tend to code more of their services at higher service levels than do hospital-owned practices. And practices in the Western section of the country tend to code more services at higher levels than other parts of the country.
Other factors are certainly at play as well. “Whether a physician receives training in documentation and coding can have a tremendous impact on CPT distributions,” PAC member Beth Papetti says. “Historically, there has been a tendency for hospitalists to under-code, but through education and enhancements like electronic charge capture, hospitalists can more accurately substantiate the services they provided to the patient.”
Other committee members have speculated that a hospitalist’s compensation model might influence coding patterns, with those who receive less of their total compensation in the form of base salary (and more in the form of productivity and/or performance-based pay) tending to code more of their services at higher levels. But, in fact, the survey data don’t reveal any clear relationship between compensation structure and the average number of work RVUs (relative value units) per encounter.
Interestingly, coding patterns of academic HM practices were similar to those of non-academic practices for admissions and subsequent visits, but academic hospitalists tend to code a higher proportion of discharges at the <30-minute level (99238). PAC members speculate that residents and hospital support staff might perform a larger portion of the discharge coordination and paperwork in academic centers, and attendings can only bill based on their personal time, not time spent by others.
To contribute to a robust CPT distribution database, be sure to participate in the next State of Hospital Medicine survey, scheduled to launch in January 2012.
Leslie Flores, SHM senior advisor, practice management
In the Literature: The latest research you need to know
In This Edition
Literature At A Glance
A guide to this month’s studies
- Atelectasis and fever
- Heparin dosing frequency for VTE prophylaxis
- Perioperative cardiac risk calculator
- Diagnosing subarachnoid hemorrhage without an LP
- Model to predict risk of bleeding on warfarin
- Risk of death with tiotropium use in COPD
- BNP to predict perioperative mortality
- Beta-blockers and COPD
No Association Found between Atelectasis and Early Postopera-tive Fever
Clinical question: Is atelectasis really a major cause of early (up to 48 hours) postoperative fever (EPF)?
Background: Both fever and atelectasis are common findings in the postoperative period. EPF is believed to be noninfectious, and many textbooks consider atelectasis to be the most common cause. However, this association is controversial with no clear evidence.
Study design: Systematic review of prospective studies evaluating atelectasis and postoperative fever using PubMed and Scopus databases.
Setting: Postoperative patients (predominantly cardiac, maxillofacial, and abdominal surgeries). Lung surgery patients were excluded.
Synopsis: Eight prospective studies (four interventional and four observational) with 998 patients were included for review. All studies diagnosed atelectasis based on chest imaging but only three studies used the conventional definition of ≥38°C for fever. Seven studies individually reported no association between atelectasis and EPF.
Only five studies had eligible data for pooling and analysis. EPF was found to be a very weak indicator (diagnostic OR 1.4; 95% CI 0.92-2.12) of atelectasis. EPF also fared poorly for ruling out (sensitivity 13% to 47%) or ruling in (specificity 41% to 87%) the diagnosis of atelectasis with similarly poor positive and negative predictive values.
The results of this study, however, should be interpreted with caution. It was not a formal meta-analysis, due to the heterogeneity of the studies included with regard to the definition of fever, time points of imaging, and the variation of end points.
Bottom line: Since there is no clinical evidence to prove an association between atelectasis and fever, it is presumed that atelectasis may not be a cause of EPF.
Citation: Mavros MN, Velmahos GC, Falagas ME. Atelectasis as a cause of postoperative fever: where is the clinical evidence? Chest. 2011;140:418-424.
Unfractionated Heparin Can be Given Either BID or TID for Throm-boprophylaxis
Clinical question: Which is the best dosing frequency of unfractionated heparin (UFH) in preventing venous thromboembolism?
Background: Low-dose UFH is commonly used in hospitals for pharmacologic prophylaxis against venous thromboembolism. However, the risks and benefits of BID vs. TID dosing are not clear.
Study design: Mixed-treatment comparison (MTC) meta-analysis of RCTs.
Setting: RCTs on thromboprophylaxis regimens, selected from two previous systematic reviews and an updated literature search.
Synopsis: Included in the analysis were 27,667 patients from 16 RCTs comparing three prophylactic regimens (UFH BID, UFH TID, or low-molecular-weight heparin) with each other or with controls. Stroke and some myocardial infarction patients were excluded. The outcomes measured were DVT, pulmonary embolism (PE), major bleeding, and death. As compared with controls, all three regimens significantly reduced DVT (ranging from 58% to 72%), showed a nonsignificant trend toward reduction in PE (by 46% to 67%), and had no difference in risk of major bleeding or death.
UFH BID vs. TID were compared indirectly by using data from their trials against control patients or low-molecular-weight heparin. There was no significant difference between UFH TID and BID in reducing DVT (RR 1.56, CI 0.64-4.33), PE (RR 1.67, CI 0.49-208.9), mortality (RR 1.17, CI 0.72-1.95), or causing major bleeding (RR 0.89, CI 0.08-7.05). Additionally, both UFH dosing frequencies were similar to low-molecular-weight heparin in all four measured outcomes. This evidence is of moderate quality due to the lack of a direct comparison between UFH BID vs. TID.
Bottom line: Both BID and TID dosing of UFH are acceptable thromboprophylaxis regimens in hospitalized medical patients with no difference in effect on DVT, PE, major bleeding, or death.
Citation: Phung OJ, Kahn SR, Cook DJ, et al. Dosing frequency of unfractionated heparin thromboprophylaxis: a meta-analysis. Chest. 2011;140: 374-381.
New Cardiac-Risk Calculator Improves Prediction of Intra-/Postoperative Myocardial Infarction and Cardiac Arrest
Clinical question: Can a more accurate risk calculator than the Revised Cardiac Risk Index (RCRI) be developed and validated to predict postoperative cardiac events?
Background: The majority of perioperative deaths are secondary to cardiac-related events. The RCRI is the most commonly used preoperative risk stratification tool, but it has limitations and low discriminatory ability.
Study design: Multicenter prospective National Surgical Quality Improvement Program database study.
Setting: More than 250 academic and community U.S. hospitals.
Synopsis: Data were obtained from patients over a two-year period (2007 and 2008). From the 2007 data set (n=211,410), perioperative myocardial infarction or cardiac arrest (MICA) was seen in 1,371 patients (0.65%). After multivariate analysis on the 2007 data set, five risk predictors were obtained (increasing age, American anesthesiology class, dependent functional status, abnormal serum creatinine of >1.5 mg/dL, and type of surgery). This was validated utilizing the 2008 data set (n=257,385), where MICA was seen in 1,401 patients (0.54%).
The risk-predictive model showed excellent discrimination (distinguishing between events and nonevents) after application of C statistics to the dataset. The discriminatory ability was better when compared with the RCRI model. Limitations included nonavailability of information on preoperative stress test, arrhythmia, and aortic valve disease.
Bottom line: The new risk calculator model would help predict MICA more accurately, which in turn would help in preoperative optimization and patient counseling.
Citation: Gupta PK, Gupta H, Sundaram A, et al. Development and validation of a risk calculator for prediction of cardiac risk after surgery. Circ. 2011;124:381-387.
Third-Generation CT Scans are Very Sensitive in Detecting Subarachnoid Hemorrhage
Clinical question: Are modern third-generation CT scans good enough to exclude subarachnoid hemorrhage (SAH) without a lumbar puncture (LP)?
Background: SAH is a neurosurgical emergency identified in about 1% of patients with headache in the emergency department. As the standard of care, all patients with suspected SAH have to undergo LP if a CT scan of the brain is normal. However, LP causes pain and delays discharge from the emergency department.
Study design: Prospective multicenter cohort study.
Setting: Eleven tertiary-care Canadian emergency departments.
Synopsis: From November 2000 to December 2009, data on all alert patients (n=3,132) who presented with acute headache and underwent emergent head CT were collected. Of these, 240 had SAH (7.7%). The sensitivity of CT overall for detecting SAH was 92.9% and the specificity was 100%. For the 953 patients scanned within six hours of headache onset, all 121 patients with SAH were identified by CT, yielding a sensitivity of 100% and specificity of 100%.
The study was limited largely by the lack of a consensus definition on the diagnosis of SAH and by some patient enrollment issues in the emergency department. Overall, these findings should give clinicians more confidence in forgoing an LP in patients with a negative head CT if done within six hours of the onset of their headache.
Bottom line: Modern third-generation CT scans are extremely sensitive for SAH if performed within six hours of the headache onset and interpreted by a qualified radiologist, thus possibly excluding the need for an LP.
Citation: Perry JJ, Stiell IG, Sivilotti ML, et al. Sensitivity of computed tomography performed within six hours of onset of headache for diagnosis of subarachnoid haemorrhage: prospective cohort study. Br Med J. 2011;343:d4277.
Improved Model Stratifies Risk of Warfarin-Associated Bleeding in Patients with Atrial Fibrillation
Clinical question: Can a simple scoring model accurately assess the risk of warfarin-associated bleeding in a cohort of patients with atrial fibrillation?
Background: It is well known that anticoagulants, such as warfarin, dramatically reduce the risk of thromboembolic events in patients with atrial fibrillation. Despite this, clinicians often find themselves weighing the risks and benefits of anticoagulation in this cohort of patients, and improved models to assess those risks are needed.
Study design: Retrospective cohort study.
Setting: Kaiser Permanente of Northern California.
Synopsis: From a cohort of 13,559 adult patients with atrial fibrillation, the investigators used chart review to determine hemorrhagic events in this population and developed a model using Cox regression to assess hemorrhagic risk in certain patient populations. Final input variables for the model included anemia, severe renal disease, age ≥75, prior hemorrhage, and hypertension. When collapsed into three risk tiers (low, intermediate, and high), the scoring model nicely differentiated low (<1% annual) from high (5.8% annual) bleeding risk.
This study is limited by the lack of information on concomitant use of NSAIDs or aspirin in these patients and the lack of external validation of the model. Despite those limitations, it may serve as a valuable tool for clinicians. As the number of alternatives to warfarin rise and as those agents become more familiar, it will become increasingly important to accurately assess hemorrhage risk with various anticoagulants.
Bottom line: The Anticoagulation and Risk Factors in Atrial Fibrillation (ATRIA) risk scoring system is a reliable and easy way for clinicians to estimate the degree of bleeding risk in patients anticoagulated with warfarin for atrial fibrillation.
Citation: Fang MC, Go AS, Chang Y, et al. A new risk scheme to predict warfarin-associated hemorrhage: the ATRIA (anticoagulation and risk factors in atrial fibrillation) study. J Am Coll Cardiol. 2011;58:395-401.
Tiotropium Mist Inhaler Associated with Increased Mortality
Clinical question: Does the mist-inhaler formulation of tiotropium increase mortality in patients with chronic obstructive pulmonary disease (COPD) when compared with placebo?
Background: Tiotropium is used in patients with COPD to reduce both symptoms of dyspnea and exacerbations of COPD. Tiotropium comes in two formulations: a powder (approved in the U.S.) and the mist inhaler (not approved in the U.S. but approved in 55 other countries). There are concerns based on recent studies that tiotropium may increase cardiovascular events and death.
Study design: Meta-analysis of five randomized controlled trials (RCTs) comparing tiotropium mist inhaler with a placebo.
Setting: Multinational studies.
Synopsis: This study of 6,522 patients with COPD showed a 52% increased risk of all-cause mortality with the use of the tiotropium mist inhaler when compared with placebo. It is important to note that there are data showing higher plasma concentrations with the approved mist-inhaler doses when compared with the powder formulation doses. Further, a possible dose effect was seen in this study (though not statistically significant), with higher tiotropium doses associated with a high-risk ratio for the mortality endpoint.
Limitations of this study include the fact that the dosage of the tiotropium varied, as did the length of follow-up for patients. Given that death was a relatively rare event (<1%), estimates are imprecise. Even given these limitations, this study sheds light on the debate over the safety of tiotropium, specifically the mist-inhaler formulation. Caution should be used when prescribing the mist-inhaler formulation of tiotropium, and an understanding of the potential cardiovascular risks should be communicated to patients prior to initiating therapy.
Bottom line: This study shows that the mist-inhaler formulation of tiotropium is associated with an increased risk of cardiovascular mortality.
Citation: Singh S, Loke YK, Enright PL, Furnberg CD. Mortality associated with tiotropium mist inhaler in patients with chronic obstructive pulmonary disease: systematic review and meta-analysis of randomised controlled trials. Br Med J. 2011;342: d3215.
B-Type Natriuretic Peptide (BNP) Is an Independent Predictor of Cardiovascular Events in Patients Undergoing Vascular Surgery
Clinical question: Can preoperative natriuretic peptide levels be used to independently predict perioperative cardiovascular events in patients undergoing vascular surgery?
Background: Currently we use the type of surgery, exercise tolerance, and clinical risk factors to predict perioperative cardiovascular risk. Clinical risk factors, based on the Revised Cardiac Risk Index, or RCRI, include history of ischemic heart disease, heart failure, cerebrovascular events, diabetes mellitus, and renal insufficiency. Recent studies have shown that the pre-operative natriuretic peptides can independently predict perioperative cardiovascular events.
Study design: Individual patient meta-analysis.
Setting: Data sets obtained from six multinational studies.
Synopsis: This meta-analysis included datasets from five studies that used BNP (632 patients) and one study that used NT-proBNP (218 patients) to assess the postoperative cardiovascular events in patients undergoing vascular surgery. Patients with elevated BNP level are at a higher risk of cardiac death (OR 4.3, 95% CI: 1.7-11.3) and all-cause mortality (OR 3.1, 95% CI: 1.4-6.7) within 30 days of vascular surgery. When the RCRI-based groups were reclassified using natriuretic peptide level, the improvement in discrimination was statistically significant. Limitations of this study include: 1) Individual patient data was not obtained for all studies that met the search criteria; and 2) Different types of BNP assays were used in different studies included.
Bottom line: Preoperative BNP level is an independent predictor of cardiovascular events at 30 days after vascular surgery. The addition of preoperative BNP level improves the predictive performance of the RCRI score.
Citation: Rodseth RN, Lurati Buse GA, Bolliger D, et al. The predictive ability of pre-operative B-type natriuretic peptide in vascular patients for major adverse cardiac events: an individual patient data meta-analysis. J Am Coll Cardiol. 2011;58:522-529.
Beta-Blockers May be Beneficial in Patients with Chronic Obstructive Pulmonary Disease
Clinical question: Is it beneficial to use beta-blockers in patients with chronic obstructive pulmonary disease (COPD) if there is an indication?
Background: Patients with COPD may have concomitant cardiovascular disease, which may warrant use of beta-blockers. Many physicians are concerned about using beta-blockers in COPD patients due to the risk of bronchospasm. Evidence suggests that cardio-selective beta-blockers do not cause deterioration of pulmonary status in COPD patients. There is also growing evidence that beta-blockers may be beneficial in patients with COPD.
Study design: Retrospective cohort study.
Setting: Data obtained from a disease-specific (COPD) database in Scotland.
Synopsis: This study included 5,977 patients who were older than 50 and excluded patients with history of malignancy. Beta-blockers were associated with a 22% reduction in all-cause mortality. There was no significant difference between cardio-selective and nonselective beta-blockers. The benefits of beta-blockers in COPD patients were independent of history of cardiovascular disease. There was no significant decline in pulmonary function (FEV1) over time. Beta-blocker usage also reduced the number of hospital admissions for COPD exacerbation. These benefits were shown in patients using different type of inhalers.
Bottom line: In patients older than 50, beta-blockers may not only reduce COPD exacerbations and hospital admissions, but also reduce all-cause mortality without adversely affecting pulmonary function.
Citation: Short PM, Lipworth SI, Elder DH, Schembri S, Lipworth BJ. Effect of beta blockers in treatment of chronic obstructive pulmonary disease: a retrospective cohort study. Br Med J. 2011;342:d2549.
Fluid Boluses Might Not Benefit All Children in Shock

Clinical question: What is the effect of fluid resuscitation on mortality in children with shock in resource-limited settings?
Background: Rapid fluid resuscitation is typically recommended for children who present with shock. In resource-limited settings, particularly in Africa, this practice is not commonplace. The exact role of early fluid resuscitation, in addition to the optimal type of fluid (saline or albumin), is unknown.
Study design: Multicenter, randomized, controlled trial.
Setting: Six clinical centers in Africa.
Synopsis: This study was stopped after data for 3,141 of a projected 3,600 enrolled children demonstrated increased mortality in the bolus groups vs. control. Children aged 60 days to 12 years who presented with a severe febrile illness and impaired perfusion without severe hypotension were randomized openly to three groups: saline bolus, albumin bolus, or no bolus (control). Baseline characteristics of the groups were similar. After 48 hours, mortality in the albumin, saline, and control groups was 10.6%, 10.5%, and 7.3% respectively. The relative risk for any bolus vs. control was 1.45 (95% CI, 1.13-1.86; P=.003).
The results of this study are strengthened by the large number of children enrolled and the solid study design. However, it is difficult to immediately generalize the findings due to the unique nature of the study population and environment, which included a high proportion of patients with malaria and notable constraints on resources. Nonetheless, questions are raised regarding the routine practice of rapid and early fluid resuscitation in patients with shock and without clear hypovolemia.
Bottom line: Fluid resuscitation is not beneficial in resource-limited settings for children in shock who are not hypotensive.
Citation: Matiland K, Kiguli S, Opoka RO, et. al. Mortality after fluid bolus in African children with severe infection. N Engl J Med. 2011;364:2483-2495.
Reviewed by Pediatric Editor Mark Shen, MD, FHM, medical director of hospital medicine at Dell Children’s Medical Center, Austin, Texas.
Where’s the Stimulus?
With much of the national discussion on healthcare policy still dominated by the Affordable Care Act, which was signed into law March 23, 2010, it’s easy to forget that the healthcare industry received a big influx of money through 2009’s federal stimulus. In all, the American Recovery and Reinvestment Act gave the go-ahead for roughly $160 billion in new health-related spending. So where has that money gone, and did it achieve the Obama administration’s overall goal of stimulating the economy?
As with all economic matters, there’s no simple answer, and economists may never reach consensus. Nor has all the money yet been spent, although the vast majority is now spoken for. Nevertheless, several reports and policy experts have provided at least a glimpse of whether certain monies were indeed well spent. Here’s a look at some of the main areas of interest to HM, including funding meant to expand access to care, boost research funding, and increase medical infrastructure.
$98 Billion for Medicaid
—Maggie Mahar, healthcare fellow, Century Foundation, Washington, D.C.
By far the biggest chunk of healthcare money went to states to help shore up their Medicaid programs, in exchange for assurances that they would not tighten eligibility requirements. Another sizable fraction went to help unemployed people maintain their health insurance coverage through the government’s COBRA program by subsidizing 65% of their premiums. Those subsidies eventually increased to $34.3 billion through subsequent legislation, according to the U.S. Congress Joint Committee on Taxation.
Both types of spending provide assistance for lower-income people, and studies have broadly concluded that stimulus spending is more effective when directed at poorer people who are more likely to spend than save additional income. James Feyrer, PhD, associate professor of economics at Dartmouth College and a research associate at the National Bureau of Economic Research, says the stimulus’ support for low-income households yielded more than two dollars for every dollar spent.
The key question, Dr. Feyrer says, is whether government spending changes behavior. “Any money that you spend that doesn’t change anybody’s behavior isn’t going to have any stimulus effect,” he says. Because the extra Medicaid funds were contingent on states maintaining their eligibility rules, they had no choice but to spend the new money. That infusion theoretically put more cash into the pockets of the poor, increasing their own propensity to spend and delivering a boost to the economy.
But this funding model comes with a major caveat: Now that the stimulus money has run out, Dr. Feyrer says a reverse effect could take place. “The hope is that the economy will come roaring back in such a fashion that when you pull the stimulus away, it will be less painful,” he says.
That hasn’t happened, however, meaning that the loss of stimulus funds is proving particularly painful for cash-strapped states. Looming budget gaps in Medicaid and other programs for the poor could result in economic contraction. A similar effect could be in play now that COBRA subsidies have lapsed.
$22.6 Billion for Health IT
A meta-analysis by the Office of the National Coordinator for Health Information Technology concludes that HIT has had a predominantly positive effect on healthcare, mainly on quality and efficiency. In principle, most observers agree that electronic health records (EHRs) are good for medicine. In reality, however, critics say the stimulus’ huge cash incentive to get doctors and hospitals to demonstrate “meaningful use” of the technology has exposed a major weakness.
Maggie Mahar, a healthcare fellow at the Century Foundation in Washington, D.C., contends the funds should have been kept in reserve until experts could better advise doctors and hospitals about which systems would work best for their specific practices, with an eye toward ensuring that the records could be linked.
“Instead, you’ve got this sort of laissez-faire chaos of people out there selling stuff, some of which is good, some of which isn’t, to people who don’t know much about what they’re buying. And that has created real problems,” Mahar says. “Some places have very good EHR in place, up and running. Other places have bought stuff that they’d now like to throw out the window and have to replace.”
$2.8 Billion for Community Healthcare Services
SHM has long supported efforts to address the nation’s PCP shortage. In October, federal officials announced that they had made some headway on that front by nearly tripling the size of the National Health Service Corps. The loan-repayment and scholarship program grants $60,000 awards to providers in exchange for two-year commitments to medically underserved communities. In 2008, about 3,600 clinicians, mainly PCPs, were enrolled in the corps. This year, the number surpassed 10,000, boosted by $300 million in stimulus money and $1.5 billion from the ACA.
As a matter of healthcare policy, then, the program has arguably been a big success. From a purely economics angle, however, Dr. Feyrer suggests the program’s effect is likely to be more modest, because the award acts like a two-year salary boost for doctors who would likely still be employed, just somewhere else.
Conversely, infrastructure projects like the building of hospitals and community centers could have generated a fairly robust economic boost if they wouldn’t have been completed in the absence of stimulus money. A May 27 report by the Connecticut General Assembly’s Office of Legislature Research, “Health Care Centers and Providers as Economic Drivers,” attempted to quantify the return on stimulus-funded investments in the state.
Among its conclusions, the report found that roughly $11.4 million in improvement grants yielded an estimated economic impact of $18.6 million. Similarly, $16.2 million in funds to renovate existing health centers or increase space through construction of new or expanded services sites yielded an impact of $26.3 million.
$10 Billion to the NIH
A big chunk of the National Institutes of Health’s monies went toward highly rated research projects stuck in backlog. As Dr. Feyrer points out, such funding is less likely to have a short-term stimulus effect. For a quick economic shot in the arm, the main question is whether funds will help create jobs that otherwise would not have existed. Over the long haul, however, Feyrer agrees that increased medical research can yield economic rewards.
Similarly, Mahar says comparative effectiveness research (CER) could provide sizable long-term returns. “Every penny we’re spending on comparative effectiveness research should, down the road, pay off in a big way,” she says. Already, stimulus-funded studies are beginning to emerge from such efforts as a Seattle-based research consortium focused on objectively analyzing cancer diagnostic tools, screening tests, and treatments.
Such research is not without its detractors, who have criticized what they view as government intrusion into personal healthcare decisions. CER also produces winners and losers, making it more politically vulnerable. “No one wants to see their revenue stream cut, even if their overpriced device is no better than other devices,” Mahar says.
Bottom Line
So has healthcare-related stimulus spending really paid off? If early indicators seem mixed, future economic studies may provide more clarity—to a point. After all, Feyrer says, no economist can know what a world without a stimulus would have looked like, meaning the arguments won’t end anytime soon.
Bryn Nelson is a freelance medical writer based in Seattle.
Career Checkup
Hospitalists need only look at their inboxes to see the demand they command. Messages beckon from recruiters, professional acquaintances, even prospective employers, pitching job openings as the next big gig. The constant barrage of opportunities can leave hospitalists wondering if there really is something better out there, and if they’re getting the most out of their current jobs.
One way to answer these types of questions is to conduct a formal career assessment, which inventories what is working and what isn’t working in a career and examines how a career fits into a person’s overall life at that point in time, says Cezanne Allen, MD, a certified physician development coach based in Bainbridge Island, Wash.
“Any time a hospitalist finds themselves in a situation where they are dissatisfied or unhappy in their job, they’re not feeling that their current job is very rewarding, or maybe they have career goals they don’t feel they are achieving yet, that would be a good time to do a career assessment,” says Leslie Flores, MHA, a partner at Nelson Flores Hospital Medicine Consultants. “Sometimes you just have to step back and say, ‘What do I really want and is this going to get me there, and if not, what do I need to do about it?’”
—Thomas Frederickson, MD, MBA, FACP, FHM, medical director of hospital medicine service, Alegent Health, Omaha, Neb.
You’ve Got Personality
Career assessments are as unique as the person conducting them, but there are some elements that hospitalists should consider. A behavioral profile or personality test is extremely helpful for physicians in understanding what their natural “hard-wiring” is when it comes to learning, problem-solving, and communication, says Francine Gaillour, MD, FACPE, MBA, executive director of the Physician Coaching Institute in Bellevue, Wash., which links doctors and healthcare teams with certified career coaches.
A number of personality tests are available for physicians (see “What’s My Personality?,” at right), but a career expert can help interpret the results and best use the information. Along with behavioral style and personality traits, hospitalists should consider their strengths and weaknesses, skills, interests, and criteria for the right job, Flores says. This introspection falls within a career assessment’s self-awareness component, she explains.
Hospitalists can add a situation component, in which they examine their current job and what “can” and “can’t” be changed, or an options component, in which they evaluate staying in the same organization versus leaving, Flores says.
If a physician is dissatisfied with their job, they should seek out the source of their frustration, Dr. Allen says. For example, is it the quality of work, workload, types of patients, patient interaction, practice development, medical knowledge limitations, lack of enjoyment, staff support, reimbursement, or work environment?
“It’s asking myself where I see the problem and then following it up with, ‘What does that tell me about what I really want?’” Dr. Allen says.
A mentor, who can provide objective and critical insight, can help in the assessment process, says Thomas Frederickson, MD, MBA, FACP, FHM, medical director of hospital medicine service at Alegent Health in Omaha, Neb. “There are often mentors within your group who have developed skills and expertise, and have learned to do different things in their careers that you might find exciting,” he explains.
Hospitalists should consult at least one “blind-spot buddy”—be it a mentor, colleague, or some other person—who can pinpoint their weaknesses, Flores says. “It’s somebody who knows you in your work world, who is close enough to be able to observe how you’re functioning in your work world, who can give you good feedback, and who cares enough about you to give you honest feedback, even when it’s not something you want to hear,” she says.
SHM can be a resource for hospitalists to find ways and people to help them assess their careers, say Dr. Frederickson.
“The Society of Hospital Medicine and their annual meetings and chapter meetings are a great place to do networking and a good place to find out different ways and different people you can align yourself with to start looking at your career in an objective way and a critical way,” he says.
Career coaches can be a good option, particularly for hospitalists who are struggling with significant change. Coaches do more than assist with resumes and interview strategies, says Dr. Gaillour. They help people align their careers with their values, strengths, passions, and goals so that they reach their full potential as a professional and a person, she says.
Coaches also advise on how to strategically plan a career and help physicians build career resilience.
“By resilience, I mean that there is always going to be some relevance to what you’re doing and you’re going to be able to weather some of the [healthcare] changes,” Dr. Gaillour says. “With a lot of physician groups and hospitals coming together and the stress of new initiatives, mergers, integrations, electronic medical records, and accountable-care organizations, all of that has a direct impact on physicians.”
The Time Is Right
Recommendations vary on how often career assessments should be conducted. Flores suggests hospitalists conduct a career checkup every two to three years “to see if they’re still on track and if their interests and goals have changed.”
Two years ago, William Atchley Jr., MD, FACP, SFHM, assessed his career while chief of the division of hospital medicine for Sentara Healthcare, a nonprofit healthcare system based in Norfolk, Va. The assessment was illuminating, he says, because it helped him to crystallize his strengths and weaknesses and determine “what I wanted to be doing,” he says.
In July, Dr. Atchley joined Atlanta-based Eagle Hospital Physicians, a physician-led company that develops and manages hospitalist practices for client hospitals. He is now regional senior medical director and is overseeing clinical services and medical affairs in South Carolina, North Carolina, and Virginia.
The more often physicians examine their career, the better they become at understanding themselves and using that understanding to their advantage, Dr. Gaillour says, who advocates annual assessments. Others suggest a daily dose of assessment.
“Daily, a physician can create a ritual to just check in with themselves, have a space where they can ask themselves questions of what went well today, what do I want more of, if there are complaints that are arising,” Dr. Allen says. “It’s an important way of preventing ourselves from getting in a place where we are really dissatisfied.”
Lisa Ryan is a freelance writer based in New Jersey.
Dartmouth Atlas: Little Progress Reducing Readmissions
The newest Dartmouth Atlas report, released Sept. 28, documents striking variation in 30-day hospital readmission rates for Medicare patients across 308 hospital-referral regions.1 The authors found little progress in decreasing 30-day readmissions from 2004 to 2009, while for some conditions and many regions, rates actually went up.
National readmission rates following surgery were 12.7% in both 2004 and 2009; readmissions for medical conditions rose slightly, from 15.9% to 16.1%, over the same period. Only 42% of hospitalized Medicare patients discharged to home had a PCP contact within 14 days of discharge, according to the report.
The Dartmouth Atlas Project (www.dartmouthatlas.org) documents geographic variation in healthcare utilization unrelated to outcome. It offers an extensive database for comparison by state, county, region and facility.
The new report is the first to identify an association nationally between readmissions rates and “the overall intensity of inpatient care provided to patients within a region or hospital,” with patterns of relatively high hospital utilization often corresponding with areas of higher readmissions. “Other patients are readmitted simply because they live in a locale where the hospital is used more frequently as a site of care,” the authors note.
Without continuous, high-quality care coordination across sites, the authors write, discharged patients can repeatedly bounce back to emergency rooms and hospitals.
Reference
High-Tech Linens Could Reduce Bacteria in Hospital Settings
A company pitching a new bacteria-resistant line of hospital linens is studying just how effective their product can be in the hospital setting.
PurThread Technologies Inc. is working with the University of Iowa on a second privacy curtain study that the company expects will show that their line of curtains, scrubs, doctor’s coats, bed linens, and patient gowns will help hospitalists and other inpatient physicians reduce the amount of bacteria they come into contact with. The research is the next step following a study presented at the Interscience Conference on Antimicrobial Agents and Chemotherapy meeting in September, which showed 92% of hospital privacy curtains were contaminated with potentially pathogenic bacteria, such as MRSA and VRE (vancomyicn-resistant enterococcus), within a week of being laundered.
The study was funded by PurThread and performed at the University of Iowa Hospital in Iowa City.
PurThread president and CEO Kathryn Bowsher says the company aims to take its first orders this year, thanks to a novel alloy it has woven into the fabrics it uses. As hospitals struggle to reach full compliance with hand hygiene and other safety measures, Bowsher believes her textiles are an easy answer.
“It’s always easier to re-engineer the system than it is to modify human behavior,” she adds. “And this would essentially be a plug-and-play solution. You stick these on the shelves and in the inventory of the hospital, instead of the traditional ones, and nobody has to think of it after that.”
You've Got (Post-Discharge) Mail
An automated email system that notifies both hospitalists and PCPs about post-discharge test results can help ensure results don’t “fall through the cracks,” according to an abstract presented at HM11.
The report, “Design and Implementation of an Automated Email Notification System for Results of Tests Pending at Discharge,” suggests that by providing an automatic email when results are completed, inpatient physicians will be more responsible for the patient, and create a dialogue with primary-care physicians (PCPs) as well. The authors estimate that physicians are aware of 40% of the final results of tests pending at discharge.
“Things fall through the cracks,” says Anuj Dalal, MD, FHM, a hospitalist at Brigham and Women’s Hospital in Boston. “This is a method to make sure these test results don’t fall through the cracks.”
Dr. Dalal’s team created the automatic emails across five services—chemistry, hematology, microbiology, pathology, and radiology—in the past two years. Preliminary data show that the system helps ensure physicians are aware of more test results, but additional research is needed.
Still, Dr. Dalal believes creating an email system at a given institution helps if only by drawing attention to the issue of pending results once a patient has left the hospital. And even if the implementation of the system at a less-wired hospital is difficult, the omnipresence of email should help with adopting.
“Everyone has email today,” he adds.
Congrats to the Class of 2013
Clinical informatics, the principle of blending health information technology (HIT) with patient care, is going mainstream. The subspecialty, popular in hospitalist circles, is scheduled to offer board certification following its recent approval by the American Board of Medical Specialties. The first examination will be administered by the American Board of Preventative Medicine and could be held as early as fall 2012, with certificates awarded early in 2013.
AMIA, the informatics trade group, believes the recognition will help push more medical schools to integrate informatics into the curriculum, which will only further solidify the subspecialty place in modern medicine.