User login
Residents Improving Quality
To Err Is Human revealed the underappreciated tension between the enormous benefits of medical care and the potential for harm.1 Following this report, there has been an explosion of research and commentary detailing quality improvement (QI) opportunities. One area of growing emphasis has been resident physician training.2, 3 If medical care is dangerous, then a substantial contributor to the hazard must be the apprentice‐style process of physician training and the novice skill set of the trainees.4, 5 Many resident training programs have devised efforts to decrease the errors committed by physicians‐in‐training,6 change the culture of residency training,7 engage residents in quality improvement,8, 9 and improve resident training in quality improvement.10
Many of the programs devised to teach QI in the residency setting require substantial funding, a large pool of QI experts, or redesign of resident training programs.410 While effective, these programs are not feasible for many resource‐constrained residency programs. A less intense program, using resident‐led, hospitalist‐facilitated, limited root cause analysis (RCA), has been adopted at the Internal Medicine Residency Program at the Mount Sinai Hospital (MSH). We describe our 2‐year experience using this technique, including cases discussed, improvement strategies suggested, projects implemented, and resident perceptions.
METHODS
Setting
Departmental QI leaders developed this initiative in the Internal Medicine Residency Program at the MSH in New York City, New York. This residency program trains over 140 residents annually in categorical, preliminary, and research track positions, as well as an affiliated medicine/pediatrics program. The program's residents rotate at 3 clinic sites: a tertiary care hospital, a public safety‐net hospital, and a Veterans Affairs hospital. The QI program was only implemented at the MSH. Over 90% of the program's graduates go on to complete a subspecialty fellowship.
Intervention Description
The QI program was designed around a noon‐time quality improvement conference (QIC) occurring once every 4 weeks. In the weeks prior to the session, chief residents and a hospitalist mentor selected a case related to an inpatient care issue. Potential cases were solicited, and/or offered, from a range of sources including attending physicians, nurse managers, residents, and quality officers. Only cases from the teaching services were chosen. To ensure that participants on the case were able to recall relevant details, preference was given to more recent cases. A third‐year resident on an elective or outpatient block was chosen to investigate the case. To maximize the objectivity of the investigation, every effort was made to select a resident who was not involved in the care of the patient.
The resident was instructed to complete a limited RCA (fewer fact‐finding interviews and only 1 group meeting) and was directed to online resources.11 Each resident presenter worked closely with the chief residents and hospitalist mentor to identify appropriate strategies for collecting data and interviewing involved parties. If necessary, either due to volume of work or sensitivity of the case, the chief resident or hospitalist would assist with the data gathering. The resident contacted multiple parties involved in the patient care issue including, nurses, residents, attendings, pharmacists, social workers, and, if appropriate, the patient. The resident constructed a timeline for each case, and identified specific points in the patient care experience, where errors, near misses, or misunderstandings occurred. During the QIC, these findings were presented to Internal Medicine residents, chief residents, representatives from the Chief Medical Officer's office, attending physicians overseeing the residents on inpatient rotations, and representatives from any group (social work nursing, housekeeping, pharmacy, etc) that may have impacted patient care for the particular case being investigated. On average, 50 healthcare providers attended the QIC. Lunch was provided.
After the findings were presented, a chief resident and a lead hospitalist facilitated a group discussion on the circumstances surrounding the case. Discussions were focused on identifying system‐wide failures and proposing systems‐based solutions. Great efforts were made to remind all participants to refrain from individual blame. At the end of each QIC, participants summarized and prioritized suggestions to reduce the discussed error. Interested residents were invited to form improvement committees for cases with viable solutions. Each committee attempted to implement improvements discussed during the QIC. Committees, led by a representative from the Division of Hospital Medicine, included 2 to 4 residents as well as healthcare workers from other disciplines if appropriate. For all improvement efforts, the focus was on the interventions which appeared high yield with low cost.
Intervention Evaluation
The program was exempt from Institutional Review Board review as a part of the Department of Medicine's quality improvement and assurance portfolio.
The results of the QICs were tracked. After each case, a QI team consisting of chief residents and representatives from the Division of Hospital Medicine recorded the cases presented, and interventions suggested for each case, in an online database. After implementation, the success of each intervention was recorded. To evaluate the types of interventions suggested by residents, the 3 physician‐authors, who regularly attend these conferences and have a focused career interest in QI, grouped all suggestions into 4 broad categories: Educational, Reminder Systems, Design Changes (protocol‐based), and Design Changes (Information Technology [IT]‐based). Design change interventions (IT‐based) consisted of an adjustment to electronic systems, such as displaying specific lab results on a medication ordering system. Design changes (protocol‐based) consisted of changes made to standing protocols such as nursing protocols for reporting abnormal lab values. Reminder system interventions were endeavors such as a checklist for discharge planning. Educational interventions focused on providing additional training sessions or conferences.
The 3 physician‐authors independently reviewed each suggested intervention to determine its success. They first evaluated whether the change was attempted or not. For all attempted interventions, the reviewer then assessed if there was either objective permanent system‐wide change, subjective behavior change, or no change. To meet the objective change threshold, the intervention either had to have permanently changed provider workflow or have data demonstrating behavior change or improved outcome. Interventions with anecdotal evidence that behavior was improved or modified, but lacking systematic data, were qualified as subjective behavior change. For each assessment, 2 of the 3 reviewers needed to agree for an intervention to be recorded as a success.
Resident views on the monthly conferences were solicited via an anonymous and voluntary questionnaire. A first survey was designed to assess whether residents felt that the conferences provided them with the ability to recognize and improve systems errors which compromise patient care. This survey was administered at the conclusion of the first year of the program to residents who attended the final 2 QICs. A second survey assessed whether the tone of the conferences was constructive and blame‐free. This survey was administered at the conclusion of the second year of the program to residents who attended the year's final 2 QICs.
RESULTS
Over the first 22 months of the program, 20 conferences were held (Table 1). The topics covered ranged considerably and included: deficits in supervision, medication errors, patient satisfaction, staff safety, and 30‐day readmissions. Forty‐six distinct interventions were suggested during these conferences. Of those, an attempt was made to initiate 25 (54%) of these suggestions (Table 2). Of the 25 interventions that were initiated, 18 (72%) were determined to be successful. Eight resulted in objective permanent system‐wide change and 10 resulted in subjective behavior change among residents.
| QIC Topic | Interventions Suggested by Residents | Suggestion Results (Attempted/Not Attempted, Successful/Unsuccessful) |
|---|---|---|
| ||
| Central venous catheter guide wire lost during code placement | Improved supervision and training for line placement | Attempted, but unsuccessful |
| Avoid unnecessary line placement during codes | Attempted, but unsuccessful | |
| Inappropriate administration of warfarin | Decision support providing real‐time coagulation profile | Attempted and successful |
| Central line bloodstream infection | Clarified and encouraged use of line service | Attempted and successful |
| Daily documentation of catheter placement date | Not attempted | |
| Delayed administration of pain medication | Training nurses to use text paging communication system | Attempted and successful |
| Patient discharged on wrong medication dose | Do not use abbreviations | Not attempted |
| Electronic medication reconciliation | Attempted and successful | |
| Confusion over code status | Clarification of various forms used for DNR | Not attempted |
| Better communication of code status during signout | Not attempted | |
| Patient received hydromorphone IV instead of PO during verbal order at end‐of‐life | Verbal orders should have talk back verification | Attempted, but unsuccessful |
| Encourage informing patients of medical errors | Attempted, but unsuccessful | |
| Premature closure of diagnosis during transfer from MICU | Improve comfort level disagreeing with supervisors | Attempted, but unsuccessful |
| Reassessment of patient prior to late‐day MICU transfers | Not attempted | |
| Patient erroneously received clopidogrel bisulfate (Plavix) for years due to poor medication reconciliation | Improved discharge summary interface | Attempted and successful |
| Encourage physicians to call PCP on discharge | Attempted and successful | |
| Modified barium swallow ordered incorrectly, resulting in patient aspiration | Simplify electronic order entry system to clearly identify tests | Not attempted |
| Change radiology requisition form to facilitate communication | Not attempted | |
| Fingersticks leading to blood exposure | Train PGY1s on the needles used at all 3 hospitals | Not attempted |
| Improve mask with face shields and gown availability | Attempted and successful | |
| Patient discharged with central venous catheter still in place | Check list for lines and Foleys | Not attempted |
| Improved discharge documentation | Not attempted | |
| 30‐Day readmission | Mandatory discharge summary completion prior to discharge | Attempted and successful |
| Discharge summary training during intern year | Attempted and successful | |
| DKA developed in house when insulin not administered | Improve communication between floor and dialysis RNs | Not attempted |
| Better PA supervision by residents regarding order writing | Attempted and successful | |
| Compromised patient satisfaction | Patient handouts with name and role of each care team member | Attempted, but unsuccessful |
| Patient satisfaction coaching | Attempted and successful | |
| Elevated PTT and poor documentation | Improved feedback to residents regarding daily notes | Not attempted |
| Nurses must call physicians with alert values | Not attempted | |
| Hospital‐acquired MRSA | Improve availability of contact precaution gowns | Attempted, but unsuccessful |
| Direct observation of hand washing on morning rounds | Attempted and successful | |
| Staff safety with deranged family member | Education of staff regarding safety protocols | Attempted, but unsuccessful |
| Transfer of unstable patient from outside hospital ICU to general medicine floor | Standardization of OSH transfer guidelines | Not attempted |
| Improved documentation of transferring MD contract data | Attempted and successful | |
| Consult called, patient not seen by attending | Education of faculty on existing institutional consult policy | Attempted, but unsuccessful |
| Clarification of violations reporting process for hospital consults | Attempted, but unsuccessful | |
| Type of Intervention | No. of Interventions Suggested | No. of Interventions Implemented (%) | Of Implemented Interventions, No. Which Were Successful (%) | No. of Attempted Interventions With Objective Change (%) | No. of Attempted Interventions With Subjective Change (%) |
|---|---|---|---|---|---|
| Design changes: information technology‐based | 5 | 2 (40) | 2 (100%) | 2 (100) | 0 (0) |
| Design changes: protocol‐based | 17 | 10 (59) | 8 (80%) | 5 (50) | 3 (30) |
| Educational | 20 | 11 (55) | 7 (64) | 1 (9) | 6 (55) |
| Reminder systems | 4 | 2 (50) | 1 (50) | 0 (0) | 1 (50) |
| Total | 46 | 25 (54) | 18 (72) | 8 (32) | 10 (40) |
Two IT‐based system design changes were implemented; both resulted in objective system‐wide change. Eight protocol‐based design changes were implemented successfully, 5 objectively, and 3 subjectively. Seven educational interventions and 1 reminder system intervention were initiated.
The most successful intervention to come from these conferences was the implementation of an electronic medication reconciliation program. The reconciliation program was suggested following a conference on a patient who was discharged home on the wrong dose of a medication. The institution's paper‐based medication reconciliation process, particularly for heart‐failure patients, had long been known to be deficient. The QIC brought this issue to life by highlighting a cases that may have been ameliorated with a more robust medication reconciliation process. Enthusiastic residents were invited to build a case for medication reconciliation to the Chief Medical Officer, and this helped garner resources for the hospital‐wide project. Another successful IT‐based intervention was initiated after a case of inappropriate administration of warfarin to a patient with an already elevated international normalized ratio (INR). The computerized order entry system was changed so that, at the point of ordering warfarin, the most recent coagulation profile and platelet values appear before an order can be finalized.
An example of a protocol‐based intervention came from a conference that focused on poor communication at the time of discharge, which resulted in a 30‐day readmission. As a result, resident work flow was changed so that discharge summaries are expected to be completed at the time of discharge. Along with this protocol change was an educational initiative to improve the quality of discharge summaries by including essential data for the transition of care.
Overall, residents reviewed the conferences very positively (Table 3). The response rate for the first year survey was 40% (56/140) and the second year survey was 18% (26/143). The vast majority of participants felt that the conferences were of high quality (96%) and that the exercise could lead to improvement in quality (98%). Residents felt that the conference focused more on system issues than individual shortcomings (92%). A majority felt comfortable expressing their opinions during the conferences (77%).
| Overall Conference Quality | ||
|---|---|---|
| Question | Mean Score (n = 53) | Rating Question a 4 or 5 |
| Conference Tone | ||
| Question | Mean Score (n = 26) | Rating Question With a 4 or 5 |
| ||
| Please rate the overall quality of the QIC conferences. | 4.49* | 98% |
| The case highlighted an issue that is highly relevant to the quality of patient care. | 4.81 | 100% |
| Solutions discussed at this conference could lead to improved patient care and/or patient satisfaction. | 4.65 | 96% |
| My knowledge of issues related to hospital quality and patient safety has been enhanced by this conference. | 4.61 | 96% |
| The QIC focused on individuals, individual actions, or omissions, which compromised high quality care. | 3.35 | 50% |
| The QIC focused on system failures that compromised high quality care. | 4.35 | 92% |
| I felt comfortable sharing my honest opinions about the medical events presented during the conferences. | 4.15 | 77% |
| I avoided expressing my opinions about the medical events presented during the conferences because I did not want to criticize my peers. | 2.5 | 19% |
DISCUSSION
The first 20 sessions from this resident‐led, hospitalist‐facilitated QI program provided evidence that residents can contribute to patient safety within a large tertiary care center. The role of residents in actively addressing errors and unsatisfactory outcomes in the hospital has not been a traditional QI focus.12 Involvement has typically been a passive process for physician trainees, while more senior clinical staff members decide on and prioritize QI activities. We have observed that empowering residents to take a more active role in performance improvement yields significant change and does more than simply educate about basic QI methodology.
One reason for the success of these conferences was leveraging insights of residents as key front line providers. Residents spend more time than perhaps any other category of hospital employee working within clinical care systems. They are deeply aware of the quality struggles inherent to large healthcare organizations, and this insight can lead to high impact suggestions for improvement. Often, suggestions were simple proposals that were overlooked or unappreciated by other administrative leaders. An example of this type of contribution was when residents brought the lack of infection control equipment, on certain units, to the attention of the infection control staff and facility engineers. At a separate conference, residents informed the transfer office staff that valuable contact information for physicians accepting outside hospital transfers was not being collected. Both of these observations led to quick change, with better infection control gown availability and improved documentation by transfer office staff.
Our program also demonstrated that including residents in QI provides momentum for either a training program or an institution to pursue solutions that might have otherwise been resisted. The improvement suggestion to complete discharge summaries prior to the patient leaving the hospital had long been a goal for the residency program leadership, but there was hesitation to force this work flow change on the residents. After a QI conference, when a number of the residents themselves made the suggestion, implementing the change was much easier. Similarly, after several cases of clear errors relating to a suboptimal process of medication reconciliation, the institution dedicated scarce IT personnel to work with providers to develop a robust, user‐friendly medication reconciliation application to decrease transition of care errors.
Through this program, residents also demonstrated their ability to deconstruct patient care problems. For each case, resident session leaders interviewed physician providers, physician extenders, nurses, nurse managers, pharmacists, security staff, engineering staff, and administrative staff. They gathered crucial information regarding the patient care event and the gaps or errors that led to a poor outcome. After many of the conferences, the resident presenters commented on how the investigative exercise left them more appreciative of the complexity of the medical system and interested in fixing the problems uncovered.
The feedback from the resident surveys demonstrated that residents valued the QI program. The data collected also shows that such programs can be executed in a manner which highlights system flaws. Our data do, however, suggest that there is room to improve the tone of the conference to further decrease the sense from residents that quality discussions focus on individuals. Residents often struggle to master the myriad new expectations inherent in the transition from student to physician.13 A quality process which discourages already overworked and uncertain trainees, by creating a process which assigns blame for unintentional quality shortcomings, would be counterproductive.
Lessons Learned
While this QI program has had success uncovering clinical care issues, and creating a climate and process for resident participation in improvement, there has been a number of limitations and lessons learned. Most importantly, including busy residents in any process that requires regular participation and follow‐through is difficult. A number of suggested improvements which created substantial interest and early momentum were ultimately left unfinished, as residents and even faculty facilitators became overwhelmed by clinical responsibilities. In fact, the majority of suggestions have not been successfully implemented and even fewer have created lasting change. This must be carefully monitored, as experiencing multiple failures can undermine the empowerment that such QI programs are created to foster.
Regular reflection on the successful and unsuccessful projects yielded several important insights that resulted in changes over the course of the program. Suggestions were more likely to move from idea generation to execution if the QIC was attended by administrators with decision‐making authority. Several of the suggestionsimproved medication reconciliation, better transfer documentation, and improved availability of infection control productswere able to be acted upon because conference attendees were administrators with purview over these issues. Many times, these leaders were more than willing to implement helpful suggestions, but simply needed them to be brought to their attention. As a result, we have been more attentive to inviting as many stakeholders as possible to the QICs.
It was also clear that suggestions would not be realized without a physician leader and were more successful when resident interest was substantial. After each QIC, residents who had made promising suggestions were approached to continue to participate. If the residents agreed, the projects were pursued and a faculty or chief resident leader was assigned. Lastly, we have also made use of one of the department's QI data analysts to assist with project completion. This individual has been made available to provide administrative support (organizing meetings, paperwork, etc) but also to provide data for projects, should the need arise.
Another important finding is that the tone of the QI program must be constantly monitored. Despite reminding residents at each session that the exercise was for the purpose of identifying systems barriers to delivering high quality care, there were times when residents felt targeted or blamed. At one point, a number of residents voiced their concerns that the conferences had spent too much time highlighting quality failures without recognizing the many positive performances on the teaching service. As a result, subsequent conferences often began by highlighting quality improvements made. Additionally, a part of 1 session each year had been dedicated to reading letters and e‐mails sent by patients or families which highlight memorably positive performances by the residents. Finally, care was taken to make sure invited guests to the sessions were reminded of the session's blame‐free ground rules.
Care must be taken when investigating clinical cases. On several occasions, attending physicians expressed discomfort with having residents scrutinize a clinical event. Although this process was protected under the QI umbrella and faculty names were never shared at the conferences, some faculty believed that this process was the purview of departmental or hospital QI staff, not untrained residents. Given the support provided for this program by the department chair and program director, as well as the professional nature with which the residents conducted their inquiries, there was little difficulty rejecting this line of objection. This feedback did lead supervisors to be more involved with the resident presenters, coaching them regarding data gathering and interviewing. If a case appears that it will be particularly sensitive, the hospitalist mentor or chief resident will reach out to involved residents and faculty to notify them that the case will be reviewed.
A final development secured, in part, as a result of this quality program has been more protected faculty time. At the start of this program, all faculty time was donated time on top of other administrative and patient care responsibilities. After the first 18 months of the QIC program, the residency program named an assistant program director for quality. At the time of writing this manuscript, the program further invested in quality by naming both an assistant and associate program director for quality. These positions combined amount to at least 0.4 full‐time equivalents (FTE). Of that, roughly 0.1 FTE is spent working on the QICs and subsequent project implementation.
Limitations
The evaluation of the success of the interventions potentially biased our findings. The qualitative method of using multiple reviewers, all of whom were invested in the program's outcomes, to gauge the success of initiated interventions may have resulted in an overestimate of the project's effectiveness. Furthermore, the category of subjective change lacks measurable criteria, making replication of the findings difficult.
The results presented here are from a single institution, conceived of and executed by a group of dedicated faculty. Moreover, both the chair of the department and the program director were very supportive of this endeavor. Possibly, because of these aspects, the findings presented here would not be readily replicated at another institution.
The percentage of residents who completed the feedback surveys was low. This may result in an overestimate of quality, value, and tone of the conferences, as well as potentially missing an opportunity for improving the program. We will address this issue through more rigorous quantitative and qualitative feedback at the end of the third year of the program.
CONCLUSIONS
Residents are willing and effective participants in a QI program. As front line providers, their experiences are valuable and their willingness to share insights can be an impetus for change. Finally, a process which includes modest investigation by third year residents, has faculty support and oversight, and provides minimal administrative support can overcome the difficulty of involving overworked residents in quality efforts.
Acknowledgements
The authors acknowledge Michael Pourdehnad for his role in developing the quality program.
- ,,.To Err Is Human: Building a Safer Health System.Washington, DC:National Academy Press;1999.
- ,,,,.Redesigning residency education in internal medicine: a position paper from the Association of Program Directors in Internal Medicine.Ann Intern Med.2006;144:920–926.
- Accreditation Council for Graduate Medical Education. Program directors guide to the common program requirements. Available at: http://www.acgme.org/acWebsite/navPages/commonpr_documents/ CompleteGuide_v2%20.pdf. Accessed May 5,2010.
- ,,,.Medical errors involving trainees: a study of closed malpractice claims from 5 insurers.Arch Intern Med.2007;167:2030–2036.
- ,,,,,.Residents report on adverse events and their causes.Arch Intern Med.2005;165:2607–2613.
- ,.A system of analyzing medical errors to improve GMA curricula and programs.Acad Med.2001;76:125–133.
- ,,, et al.Changing conversations: teaching safety and quality in residency training.Acad Med.2008;83(11):1080–1087.
- ,,.Practice‐based learning and improvement: a curriculum in continuous quality improvement for surgery residents.Arch Surg.2007;142:479–483.
- .Involving residents in quality improvement: contrasting “top‐down” and “bottom‐up” approaches. Accreditation Council for Graduate Medical Education and Institute for Healthcare Improvement‐day project.ACGME Bulletin. August2008.
- ,,,,.Creating a quality improvement elective for medical house officers.Gen Intern Med.2004;19(8):861–867.
- National Center for Patient Safety. United States Department for Veteran Affairs. Root cause analysis tools. Available at: http://www.patientsafety.gov/CogAids/RCA/. Accessed August 17,2010.
- ,,, et al.Residents' engagement in quality improvement: a systematic review of the literature.Acad Med.2009;84:1757–1764.
- ,,.Graduates from a traditional medical curriculum evaluate the effectiveness of their medical curriculum through interviews.BMC Med Educ.2009;9:64.
To Err Is Human revealed the underappreciated tension between the enormous benefits of medical care and the potential for harm.1 Following this report, there has been an explosion of research and commentary detailing quality improvement (QI) opportunities. One area of growing emphasis has been resident physician training.2, 3 If medical care is dangerous, then a substantial contributor to the hazard must be the apprentice‐style process of physician training and the novice skill set of the trainees.4, 5 Many resident training programs have devised efforts to decrease the errors committed by physicians‐in‐training,6 change the culture of residency training,7 engage residents in quality improvement,8, 9 and improve resident training in quality improvement.10
Many of the programs devised to teach QI in the residency setting require substantial funding, a large pool of QI experts, or redesign of resident training programs.410 While effective, these programs are not feasible for many resource‐constrained residency programs. A less intense program, using resident‐led, hospitalist‐facilitated, limited root cause analysis (RCA), has been adopted at the Internal Medicine Residency Program at the Mount Sinai Hospital (MSH). We describe our 2‐year experience using this technique, including cases discussed, improvement strategies suggested, projects implemented, and resident perceptions.
METHODS
Setting
Departmental QI leaders developed this initiative in the Internal Medicine Residency Program at the MSH in New York City, New York. This residency program trains over 140 residents annually in categorical, preliminary, and research track positions, as well as an affiliated medicine/pediatrics program. The program's residents rotate at 3 clinic sites: a tertiary care hospital, a public safety‐net hospital, and a Veterans Affairs hospital. The QI program was only implemented at the MSH. Over 90% of the program's graduates go on to complete a subspecialty fellowship.
Intervention Description
The QI program was designed around a noon‐time quality improvement conference (QIC) occurring once every 4 weeks. In the weeks prior to the session, chief residents and a hospitalist mentor selected a case related to an inpatient care issue. Potential cases were solicited, and/or offered, from a range of sources including attending physicians, nurse managers, residents, and quality officers. Only cases from the teaching services were chosen. To ensure that participants on the case were able to recall relevant details, preference was given to more recent cases. A third‐year resident on an elective or outpatient block was chosen to investigate the case. To maximize the objectivity of the investigation, every effort was made to select a resident who was not involved in the care of the patient.
The resident was instructed to complete a limited RCA (fewer fact‐finding interviews and only 1 group meeting) and was directed to online resources.11 Each resident presenter worked closely with the chief residents and hospitalist mentor to identify appropriate strategies for collecting data and interviewing involved parties. If necessary, either due to volume of work or sensitivity of the case, the chief resident or hospitalist would assist with the data gathering. The resident contacted multiple parties involved in the patient care issue including, nurses, residents, attendings, pharmacists, social workers, and, if appropriate, the patient. The resident constructed a timeline for each case, and identified specific points in the patient care experience, where errors, near misses, or misunderstandings occurred. During the QIC, these findings were presented to Internal Medicine residents, chief residents, representatives from the Chief Medical Officer's office, attending physicians overseeing the residents on inpatient rotations, and representatives from any group (social work nursing, housekeeping, pharmacy, etc) that may have impacted patient care for the particular case being investigated. On average, 50 healthcare providers attended the QIC. Lunch was provided.
After the findings were presented, a chief resident and a lead hospitalist facilitated a group discussion on the circumstances surrounding the case. Discussions were focused on identifying system‐wide failures and proposing systems‐based solutions. Great efforts were made to remind all participants to refrain from individual blame. At the end of each QIC, participants summarized and prioritized suggestions to reduce the discussed error. Interested residents were invited to form improvement committees for cases with viable solutions. Each committee attempted to implement improvements discussed during the QIC. Committees, led by a representative from the Division of Hospital Medicine, included 2 to 4 residents as well as healthcare workers from other disciplines if appropriate. For all improvement efforts, the focus was on the interventions which appeared high yield with low cost.
Intervention Evaluation
The program was exempt from Institutional Review Board review as a part of the Department of Medicine's quality improvement and assurance portfolio.
The results of the QICs were tracked. After each case, a QI team consisting of chief residents and representatives from the Division of Hospital Medicine recorded the cases presented, and interventions suggested for each case, in an online database. After implementation, the success of each intervention was recorded. To evaluate the types of interventions suggested by residents, the 3 physician‐authors, who regularly attend these conferences and have a focused career interest in QI, grouped all suggestions into 4 broad categories: Educational, Reminder Systems, Design Changes (protocol‐based), and Design Changes (Information Technology [IT]‐based). Design change interventions (IT‐based) consisted of an adjustment to electronic systems, such as displaying specific lab results on a medication ordering system. Design changes (protocol‐based) consisted of changes made to standing protocols such as nursing protocols for reporting abnormal lab values. Reminder system interventions were endeavors such as a checklist for discharge planning. Educational interventions focused on providing additional training sessions or conferences.
The 3 physician‐authors independently reviewed each suggested intervention to determine its success. They first evaluated whether the change was attempted or not. For all attempted interventions, the reviewer then assessed if there was either objective permanent system‐wide change, subjective behavior change, or no change. To meet the objective change threshold, the intervention either had to have permanently changed provider workflow or have data demonstrating behavior change or improved outcome. Interventions with anecdotal evidence that behavior was improved or modified, but lacking systematic data, were qualified as subjective behavior change. For each assessment, 2 of the 3 reviewers needed to agree for an intervention to be recorded as a success.
Resident views on the monthly conferences were solicited via an anonymous and voluntary questionnaire. A first survey was designed to assess whether residents felt that the conferences provided them with the ability to recognize and improve systems errors which compromise patient care. This survey was administered at the conclusion of the first year of the program to residents who attended the final 2 QICs. A second survey assessed whether the tone of the conferences was constructive and blame‐free. This survey was administered at the conclusion of the second year of the program to residents who attended the year's final 2 QICs.
RESULTS
Over the first 22 months of the program, 20 conferences were held (Table 1). The topics covered ranged considerably and included: deficits in supervision, medication errors, patient satisfaction, staff safety, and 30‐day readmissions. Forty‐six distinct interventions were suggested during these conferences. Of those, an attempt was made to initiate 25 (54%) of these suggestions (Table 2). Of the 25 interventions that were initiated, 18 (72%) were determined to be successful. Eight resulted in objective permanent system‐wide change and 10 resulted in subjective behavior change among residents.
| QIC Topic | Interventions Suggested by Residents | Suggestion Results (Attempted/Not Attempted, Successful/Unsuccessful) |
|---|---|---|
| ||
| Central venous catheter guide wire lost during code placement | Improved supervision and training for line placement | Attempted, but unsuccessful |
| Avoid unnecessary line placement during codes | Attempted, but unsuccessful | |
| Inappropriate administration of warfarin | Decision support providing real‐time coagulation profile | Attempted and successful |
| Central line bloodstream infection | Clarified and encouraged use of line service | Attempted and successful |
| Daily documentation of catheter placement date | Not attempted | |
| Delayed administration of pain medication | Training nurses to use text paging communication system | Attempted and successful |
| Patient discharged on wrong medication dose | Do not use abbreviations | Not attempted |
| Electronic medication reconciliation | Attempted and successful | |
| Confusion over code status | Clarification of various forms used for DNR | Not attempted |
| Better communication of code status during signout | Not attempted | |
| Patient received hydromorphone IV instead of PO during verbal order at end‐of‐life | Verbal orders should have talk back verification | Attempted, but unsuccessful |
| Encourage informing patients of medical errors | Attempted, but unsuccessful | |
| Premature closure of diagnosis during transfer from MICU | Improve comfort level disagreeing with supervisors | Attempted, but unsuccessful |
| Reassessment of patient prior to late‐day MICU transfers | Not attempted | |
| Patient erroneously received clopidogrel bisulfate (Plavix) for years due to poor medication reconciliation | Improved discharge summary interface | Attempted and successful |
| Encourage physicians to call PCP on discharge | Attempted and successful | |
| Modified barium swallow ordered incorrectly, resulting in patient aspiration | Simplify electronic order entry system to clearly identify tests | Not attempted |
| Change radiology requisition form to facilitate communication | Not attempted | |
| Fingersticks leading to blood exposure | Train PGY1s on the needles used at all 3 hospitals | Not attempted |
| Improve mask with face shields and gown availability | Attempted and successful | |
| Patient discharged with central venous catheter still in place | Check list for lines and Foleys | Not attempted |
| Improved discharge documentation | Not attempted | |
| 30‐Day readmission | Mandatory discharge summary completion prior to discharge | Attempted and successful |
| Discharge summary training during intern year | Attempted and successful | |
| DKA developed in house when insulin not administered | Improve communication between floor and dialysis RNs | Not attempted |
| Better PA supervision by residents regarding order writing | Attempted and successful | |
| Compromised patient satisfaction | Patient handouts with name and role of each care team member | Attempted, but unsuccessful |
| Patient satisfaction coaching | Attempted and successful | |
| Elevated PTT and poor documentation | Improved feedback to residents regarding daily notes | Not attempted |
| Nurses must call physicians with alert values | Not attempted | |
| Hospital‐acquired MRSA | Improve availability of contact precaution gowns | Attempted, but unsuccessful |
| Direct observation of hand washing on morning rounds | Attempted and successful | |
| Staff safety with deranged family member | Education of staff regarding safety protocols | Attempted, but unsuccessful |
| Transfer of unstable patient from outside hospital ICU to general medicine floor | Standardization of OSH transfer guidelines | Not attempted |
| Improved documentation of transferring MD contract data | Attempted and successful | |
| Consult called, patient not seen by attending | Education of faculty on existing institutional consult policy | Attempted, but unsuccessful |
| Clarification of violations reporting process for hospital consults | Attempted, but unsuccessful | |
| Type of Intervention | No. of Interventions Suggested | No. of Interventions Implemented (%) | Of Implemented Interventions, No. Which Were Successful (%) | No. of Attempted Interventions With Objective Change (%) | No. of Attempted Interventions With Subjective Change (%) |
|---|---|---|---|---|---|
| Design changes: information technology‐based | 5 | 2 (40) | 2 (100%) | 2 (100) | 0 (0) |
| Design changes: protocol‐based | 17 | 10 (59) | 8 (80%) | 5 (50) | 3 (30) |
| Educational | 20 | 11 (55) | 7 (64) | 1 (9) | 6 (55) |
| Reminder systems | 4 | 2 (50) | 1 (50) | 0 (0) | 1 (50) |
| Total | 46 | 25 (54) | 18 (72) | 8 (32) | 10 (40) |
Two IT‐based system design changes were implemented; both resulted in objective system‐wide change. Eight protocol‐based design changes were implemented successfully, 5 objectively, and 3 subjectively. Seven educational interventions and 1 reminder system intervention were initiated.
The most successful intervention to come from these conferences was the implementation of an electronic medication reconciliation program. The reconciliation program was suggested following a conference on a patient who was discharged home on the wrong dose of a medication. The institution's paper‐based medication reconciliation process, particularly for heart‐failure patients, had long been known to be deficient. The QIC brought this issue to life by highlighting a cases that may have been ameliorated with a more robust medication reconciliation process. Enthusiastic residents were invited to build a case for medication reconciliation to the Chief Medical Officer, and this helped garner resources for the hospital‐wide project. Another successful IT‐based intervention was initiated after a case of inappropriate administration of warfarin to a patient with an already elevated international normalized ratio (INR). The computerized order entry system was changed so that, at the point of ordering warfarin, the most recent coagulation profile and platelet values appear before an order can be finalized.
An example of a protocol‐based intervention came from a conference that focused on poor communication at the time of discharge, which resulted in a 30‐day readmission. As a result, resident work flow was changed so that discharge summaries are expected to be completed at the time of discharge. Along with this protocol change was an educational initiative to improve the quality of discharge summaries by including essential data for the transition of care.
Overall, residents reviewed the conferences very positively (Table 3). The response rate for the first year survey was 40% (56/140) and the second year survey was 18% (26/143). The vast majority of participants felt that the conferences were of high quality (96%) and that the exercise could lead to improvement in quality (98%). Residents felt that the conference focused more on system issues than individual shortcomings (92%). A majority felt comfortable expressing their opinions during the conferences (77%).
| Overall Conference Quality | ||
|---|---|---|
| Question | Mean Score (n = 53) | Rating Question a 4 or 5 |
| Conference Tone | ||
| Question | Mean Score (n = 26) | Rating Question With a 4 or 5 |
| ||
| Please rate the overall quality of the QIC conferences. | 4.49* | 98% |
| The case highlighted an issue that is highly relevant to the quality of patient care. | 4.81 | 100% |
| Solutions discussed at this conference could lead to improved patient care and/or patient satisfaction. | 4.65 | 96% |
| My knowledge of issues related to hospital quality and patient safety has been enhanced by this conference. | 4.61 | 96% |
| The QIC focused on individuals, individual actions, or omissions, which compromised high quality care. | 3.35 | 50% |
| The QIC focused on system failures that compromised high quality care. | 4.35 | 92% |
| I felt comfortable sharing my honest opinions about the medical events presented during the conferences. | 4.15 | 77% |
| I avoided expressing my opinions about the medical events presented during the conferences because I did not want to criticize my peers. | 2.5 | 19% |
DISCUSSION
The first 20 sessions from this resident‐led, hospitalist‐facilitated QI program provided evidence that residents can contribute to patient safety within a large tertiary care center. The role of residents in actively addressing errors and unsatisfactory outcomes in the hospital has not been a traditional QI focus.12 Involvement has typically been a passive process for physician trainees, while more senior clinical staff members decide on and prioritize QI activities. We have observed that empowering residents to take a more active role in performance improvement yields significant change and does more than simply educate about basic QI methodology.
One reason for the success of these conferences was leveraging insights of residents as key front line providers. Residents spend more time than perhaps any other category of hospital employee working within clinical care systems. They are deeply aware of the quality struggles inherent to large healthcare organizations, and this insight can lead to high impact suggestions for improvement. Often, suggestions were simple proposals that were overlooked or unappreciated by other administrative leaders. An example of this type of contribution was when residents brought the lack of infection control equipment, on certain units, to the attention of the infection control staff and facility engineers. At a separate conference, residents informed the transfer office staff that valuable contact information for physicians accepting outside hospital transfers was not being collected. Both of these observations led to quick change, with better infection control gown availability and improved documentation by transfer office staff.
Our program also demonstrated that including residents in QI provides momentum for either a training program or an institution to pursue solutions that might have otherwise been resisted. The improvement suggestion to complete discharge summaries prior to the patient leaving the hospital had long been a goal for the residency program leadership, but there was hesitation to force this work flow change on the residents. After a QI conference, when a number of the residents themselves made the suggestion, implementing the change was much easier. Similarly, after several cases of clear errors relating to a suboptimal process of medication reconciliation, the institution dedicated scarce IT personnel to work with providers to develop a robust, user‐friendly medication reconciliation application to decrease transition of care errors.
Through this program, residents also demonstrated their ability to deconstruct patient care problems. For each case, resident session leaders interviewed physician providers, physician extenders, nurses, nurse managers, pharmacists, security staff, engineering staff, and administrative staff. They gathered crucial information regarding the patient care event and the gaps or errors that led to a poor outcome. After many of the conferences, the resident presenters commented on how the investigative exercise left them more appreciative of the complexity of the medical system and interested in fixing the problems uncovered.
The feedback from the resident surveys demonstrated that residents valued the QI program. The data collected also shows that such programs can be executed in a manner which highlights system flaws. Our data do, however, suggest that there is room to improve the tone of the conference to further decrease the sense from residents that quality discussions focus on individuals. Residents often struggle to master the myriad new expectations inherent in the transition from student to physician.13 A quality process which discourages already overworked and uncertain trainees, by creating a process which assigns blame for unintentional quality shortcomings, would be counterproductive.
Lessons Learned
While this QI program has had success uncovering clinical care issues, and creating a climate and process for resident participation in improvement, there has been a number of limitations and lessons learned. Most importantly, including busy residents in any process that requires regular participation and follow‐through is difficult. A number of suggested improvements which created substantial interest and early momentum were ultimately left unfinished, as residents and even faculty facilitators became overwhelmed by clinical responsibilities. In fact, the majority of suggestions have not been successfully implemented and even fewer have created lasting change. This must be carefully monitored, as experiencing multiple failures can undermine the empowerment that such QI programs are created to foster.
Regular reflection on the successful and unsuccessful projects yielded several important insights that resulted in changes over the course of the program. Suggestions were more likely to move from idea generation to execution if the QIC was attended by administrators with decision‐making authority. Several of the suggestionsimproved medication reconciliation, better transfer documentation, and improved availability of infection control productswere able to be acted upon because conference attendees were administrators with purview over these issues. Many times, these leaders were more than willing to implement helpful suggestions, but simply needed them to be brought to their attention. As a result, we have been more attentive to inviting as many stakeholders as possible to the QICs.
It was also clear that suggestions would not be realized without a physician leader and were more successful when resident interest was substantial. After each QIC, residents who had made promising suggestions were approached to continue to participate. If the residents agreed, the projects were pursued and a faculty or chief resident leader was assigned. Lastly, we have also made use of one of the department's QI data analysts to assist with project completion. This individual has been made available to provide administrative support (organizing meetings, paperwork, etc) but also to provide data for projects, should the need arise.
Another important finding is that the tone of the QI program must be constantly monitored. Despite reminding residents at each session that the exercise was for the purpose of identifying systems barriers to delivering high quality care, there were times when residents felt targeted or blamed. At one point, a number of residents voiced their concerns that the conferences had spent too much time highlighting quality failures without recognizing the many positive performances on the teaching service. As a result, subsequent conferences often began by highlighting quality improvements made. Additionally, a part of 1 session each year had been dedicated to reading letters and e‐mails sent by patients or families which highlight memorably positive performances by the residents. Finally, care was taken to make sure invited guests to the sessions were reminded of the session's blame‐free ground rules.
Care must be taken when investigating clinical cases. On several occasions, attending physicians expressed discomfort with having residents scrutinize a clinical event. Although this process was protected under the QI umbrella and faculty names were never shared at the conferences, some faculty believed that this process was the purview of departmental or hospital QI staff, not untrained residents. Given the support provided for this program by the department chair and program director, as well as the professional nature with which the residents conducted their inquiries, there was little difficulty rejecting this line of objection. This feedback did lead supervisors to be more involved with the resident presenters, coaching them regarding data gathering and interviewing. If a case appears that it will be particularly sensitive, the hospitalist mentor or chief resident will reach out to involved residents and faculty to notify them that the case will be reviewed.
A final development secured, in part, as a result of this quality program has been more protected faculty time. At the start of this program, all faculty time was donated time on top of other administrative and patient care responsibilities. After the first 18 months of the QIC program, the residency program named an assistant program director for quality. At the time of writing this manuscript, the program further invested in quality by naming both an assistant and associate program director for quality. These positions combined amount to at least 0.4 full‐time equivalents (FTE). Of that, roughly 0.1 FTE is spent working on the QICs and subsequent project implementation.
Limitations
The evaluation of the success of the interventions potentially biased our findings. The qualitative method of using multiple reviewers, all of whom were invested in the program's outcomes, to gauge the success of initiated interventions may have resulted in an overestimate of the project's effectiveness. Furthermore, the category of subjective change lacks measurable criteria, making replication of the findings difficult.
The results presented here are from a single institution, conceived of and executed by a group of dedicated faculty. Moreover, both the chair of the department and the program director were very supportive of this endeavor. Possibly, because of these aspects, the findings presented here would not be readily replicated at another institution.
The percentage of residents who completed the feedback surveys was low. This may result in an overestimate of quality, value, and tone of the conferences, as well as potentially missing an opportunity for improving the program. We will address this issue through more rigorous quantitative and qualitative feedback at the end of the third year of the program.
CONCLUSIONS
Residents are willing and effective participants in a QI program. As front line providers, their experiences are valuable and their willingness to share insights can be an impetus for change. Finally, a process which includes modest investigation by third year residents, has faculty support and oversight, and provides minimal administrative support can overcome the difficulty of involving overworked residents in quality efforts.
Acknowledgements
The authors acknowledge Michael Pourdehnad for his role in developing the quality program.
- ,,.To Err Is Human: Building a Safer Health System.Washington, DC:National Academy Press;1999.
- ,,,,.Redesigning residency education in internal medicine: a position paper from the Association of Program Directors in Internal Medicine.Ann Intern Med.2006;144:920–926.
- Accreditation Council for Graduate Medical Education. Program directors guide to the common program requirements. Available at: http://www.acgme.org/acWebsite/navPages/commonpr_documents/ CompleteGuide_v2%20.pdf. Accessed May 5,2010.
- ,,,.Medical errors involving trainees: a study of closed malpractice claims from 5 insurers.Arch Intern Med.2007;167:2030–2036.
- ,,,,,.Residents report on adverse events and their causes.Arch Intern Med.2005;165:2607–2613.
- ,.A system of analyzing medical errors to improve GMA curricula and programs.Acad Med.2001;76:125–133.
- ,,, et al.Changing conversations: teaching safety and quality in residency training.Acad Med.2008;83(11):1080–1087.
- ,,.Practice‐based learning and improvement: a curriculum in continuous quality improvement for surgery residents.Arch Surg.2007;142:479–483.
- .Involving residents in quality improvement: contrasting “top‐down” and “bottom‐up” approaches. Accreditation Council for Graduate Medical Education and Institute for Healthcare Improvement‐day project.ACGME Bulletin. August2008.
- ,,,,.Creating a quality improvement elective for medical house officers.Gen Intern Med.2004;19(8):861–867.
- National Center for Patient Safety. United States Department for Veteran Affairs. Root cause analysis tools. Available at: http://www.patientsafety.gov/CogAids/RCA/. Accessed August 17,2010.
- ,,, et al.Residents' engagement in quality improvement: a systematic review of the literature.Acad Med.2009;84:1757–1764.
- ,,.Graduates from a traditional medical curriculum evaluate the effectiveness of their medical curriculum through interviews.BMC Med Educ.2009;9:64.
Complications of Bariatric Surgery
Obesity is a growing epidemic in the United States and worldwide. Over one‐third of Americans (33.8%) are considered obese (body mass index [BMI] 30).1 Nonsurgical interventions have failed to achieve the long‐lasting effects of weight loss surgery and the associated reduction in obesity‐related comorbidities such as type 2 diabetes mellitus, hyperlipidemia, hypertension, obstructive sleep apnea, cancer, coronary artery disease, osteoarthritis, and gastroesophageal reflux disease (GERD).27 The American Society for Metabolic and Bariatric Surgery estimates that 220,000 people underwent bariatric surgery in 2009 with over 1.5 million procedures performed since 1992.
Centers of excellence criteria include follow‐up with the bariatric surgeon for 5 years; however, the patient may be admitted to a hospital without immediate availability of the bariatric surgeon. Since hospitalists are often first responders to the majority of newly hospitalized patients, this growing number of post‐bariatric surgery patients necessitates hospitalists have a full understanding of their unique postoperative anatomical and physiological consequences. During the first hours of an acute inpatient presentation, post‐bariatric surgical patients can be divided into the following categories: surgical complications, surgical complications masquerading as acute medical conditions, and medical complications. Additionally, hospitalists should be aware of the nuances of radiographic imaging and appropriate endoscopic procedures in these patients. This article will discuss the common current bariatric surgical procedures; post‐bariatric surgery radiographic imaging pearls; and a review of the signs, symptoms, and treatment of common medical and surgical complications.
Descriptions of Contemporary Procedures
Contemporary weight loss procedures can be divided into 2 categories based on how they produce weight loss: restrictive only or combination malabsorptive with restriction. Most are performed laparoscopically to reduce postoperative pain, speed recovery, and decrease wound complications.
Restrictive Procedures (Laparoscopic Adjustable Gastric Band and Sleeve Gastrectomy)
These procedures produce weight loss by reducing the size of the stomach or creating an obstruction in the proximal stomach, limiting the consumption of large quantities at one time. They produce early satiety, but patients may still consume a large volume of calorie‐dense liquids compromising weight loss.
Laparoscopic Adjustable Gastric Band
Laparoscopic adjustable gastric band (LAGB; Figure 1A) is the primary form of restrictive procedures with 2 Food and Drug Administration‐approved bands (Lap Band [Allergan, Inc; Irvine, CA] and REALIZE band [Ethicon Endo‐Surgery, Inc; Cincinnati, OH]). A cuff is inflated around the proximal stomach creating a gastric pouch approximately 15‐30 mL in size. A subcutaneous reservoir is attached to the cuff allowing adjustment to the degree of restriction.8 LAGB has replaced the vertical banded gastroplasty (VBG). It is less invasive, adjustable, and reversible (0.1% operative mortality rate). Weight loss is maintained with this procedure but is generally less, with a higher failure rate compared to the more common gastric bypass procedure (Table 1).3, 9 Complications may include band dysfunction (ie, slippage, erosion, infections), esophageal dilatation, balloon failure, and port malposition, with rates approaching 3%‐5% per year requiring removal or repair.10 Patients may also experience GERD symptoms, especially if the condition was present preoperatively. Progressive GERD symptoms should be investigated with an upper gastrointestinal (GI) series to ensure there is no band slippage, esophageal dilation, or dysfunction.

| LAGB | Roux‐en‐Y Gastric Bypass | Biliopancreatic Diversion With and Without Duodenal Switch | |
|---|---|---|---|
| Excess weight loss | 48% | 62% | 70% |
| Resolution of diabetes | 48% | 84% | 98% |
Sleeve Gastrectomy
With the sleeve gastrectomy (Figure 1B) procedure, a small gastric tube is created by resecting the majority of the stomach. Early postoperative complications are comparable to those after Roux‐en‐Y gastric bypass (RYGB) operations. Leaks from the long gastric staple line are the most concerning. Recent report of a leak rate of 4.9% is much higher than contemporary reports of leaks after laparoscopic RYGB operations.11 Gastric tube stenosis is unique to the operation but comparable to gastrojejunal anastomotic stricture rates after RYGB. Weight loss is less than RYGB. Long‐term results from larger cohorts are needed to determine if the high incidence of esophageal complaints (GERD 26%, vomiting 21%), and weight regain issues are consistently experienced.
Combination Procedures (Roux‐en‐Y Gastric Bypass and Biliopancreatic Diversion With and Without Duodenal Switch)
These procedures produce weight loss by decreasing caloric intake and altering digestion and absorption.
Roux‐en‐Y Gastric Bypass
Roux‐en‐Y Gastric Bypass (RYGB) (Figure 1C) is the most common bariatric procedure performed in the United States. As the gold standard, it provides long‐term successful weight loss and a defined risk profile.9 This procedure involves the creation of a small (15‐30 mL) gastric pouch by transecting the stomach and then draining the pouch via a Roux limb. The Roux (aka alimentary) limb is the segment of bowel between the small gastric pouch and the jejunojejunostomy. Variations on this procedure include different length Roux limbs (75‐150 cm) and the use of a silastic ring at the gastrojejunal anastomosis. The latter is not commonly used because of the high incidence of band erosion. Weight loss seems to be independent of these variations. Postoperatively, food bypasses the biliopancreatic limb (ie, the stomach, duodenum, and part of the jejunum) resulting in selective malabsorption in the common channel (the segment distal to the jejunojejunostomy). Hormone secretions are altered, affecting satiety signaling and glucose metabolism.10, 12
Biliopancreatic Diversion With Duodenal Switch
In biliopancreatic diversion (BPD) with duodenal switch (DS) (Figure 1D), a sleeve gastrectomy is performed. The ileum is transected about 250 cm proximal to the ileocecal valve and is then attached to the transected duodenum just distal to the pylorus, forming the path for the food. The excluded duodenum, jejunum, and proximal ileum drain the biliary and pancreatic secretions and are reconnected to the distal ileum about 50‐100 cm proximal to the ileocecal valve. Food and digestive juices mix, allowing for absorption of nutrients over this short common channel. Greater malabsorption of calories, vitamins, and trace elements occurs, providing more reliable weight loss and significantly more nutritional problems.8, 9
Radiographic and Endoscopic Considerations
When evaluating abdominal complaints with radiographic imaging, the postoperative anatomic variations can challenge routine interpretation. An experienced radiologist and involvement of a bariatric surgeon, who is familiar with the post‐gastric bypass anatomical changes, are essential for accurate interpretation.
Computed tomography (CT) scans with oral contrast are the imaging modality of choice, particularly in the acute setting, to rule out small bowel obstruction. CT scans are helpful in delineating postoperative anatomy, detecting anastomotic leaks, obstructions and other intra‐abdominal problems.1315 Routine upper GI series (UGI) after gastric bypass is controversial, with some performing it routinely and others only for cause. Regardless, when UGI is performed, likewise for CT, small volumes of water‐soluble contrast should be used, followed by small volumes of dilute barium solution. A UGI may be complementary and more sensitive in the case of a small leak when done under fluoroscopy, but CT and UGI may not show the leak in as many as 30% of patients; CT scans may provide additional information to help guide the clinical decision making. A negative study should not preclude surgical exploration if a high suspicion for leak exists.16 Internal hernias (loop of bowel passing through a mesenteric defect created by the original surgery), a common cause of bowel obstructions, are frequently missed, therefore a high level of suspicion is necessary.1719 Several studies have identified 8 radiographic CT findings in bowel obstructions caused by internal hernias including swirl sign, mushroom sign, hurricane eye, small bowel obstruction, clustered loops, small bowel behind superior mesenteric artery, right‐side anastomosis, and engorged nodes.18, 19 The clinical picture should guide medical versus surgical management in those exceeding CT scanner weight limits (commonly 350 lb).
Imaging modalities such as UGI, endoscopy, or double balloon enteroscopy (DBE) should be used for patients with more chronic abdominal complaints. UGI may miss leaks and obstructions in the remnant stomach and bypassed intestine. If pathology, such as ulcers, retained sutures, and strictures are suspected in the bypassed stomach/emntestine, DBE can be used to diagnose and therapeutically intervene, but may not be available at all centers and referral may be considered. Endoscopy allows for direct visualization of subtle or mucosal pathology in the small bowel, but is unable to visualize the excluded stomach and duodenum.20
Early Medical and Surgical Complications
Early postoperative complications (within 30 days) occur in the minority of patients after weight loss operations. Clinical findings, even in life‐threatening conditions, may be subtle. Readmissions most often occur for dehydration secondary to inadequate oral intake. Pneumonias, and wound and urinary tract infections are not unique to the bariatric surgery patient, but there is a higher than average risk of pulmonary embolism and bleeding. Bleeding most frequently occurs into the GI tract from staple lines resulting in rapid catharsis or emesis, but can also be intraperitoneal and elusive. Most GI bleeding stops spontaneously, but some require transfusion and re‐exploration in extreme cases.21 Leaks may occur at any of the staple lines or anastomoses. The most common sites of leak are the g‐j anastomosis, gastric pouch, and remnant stomach. Again, remnant stomach and j‐j anastomosis leaks may escape detection by UGI and CT. Re‐exploration of a sick patient in the early postoperative period may be required despite normal imaging studies. Early consultation with, or transfer to, a bariatric surgery center should always be considered for patients readmitted after bariatric surgery.
Late Medical Complications
Gastrointestinal complaints, excessive weight loss, and vitamin/mineral deficiencies resulting in neurological problems and metabolic bone disease are post‐bariatric medical complications that may prompt hospital admission. If not the primary reason for admission, special attention to these issues may prevent readmission, another focus of hospital care.
Gastrointestinal Complaints
One of the most common causes of hospital admission any time postoperatively is abdominal pain. A differential diagnosis of abdominal pain, nausea, and/or vomiting in the post‐bariatric surgery patient should include small bowel obstruction, hernias (internal or incisional), band complications, food intolerance, dietary noncompliance, ileus, mesenteric venous thrombosis, strictures (such as outlet obstruction or anastomotic stenosis), ulcers, esophagitis, cholelithiasis, dumping syndrome, and Roux stasis syndrome.20
A thorough history targeted at the relationship between symptoms and food intake, attention to the character and location of the pain, and a thorough physical exam (specifically the presence or absence of palpable tenderness, guarding, or rebound) is essential. The physical exam may be misleading in obese patients and, if radiographic studies cannot be performed secondary to patient size, surgical exploration may be needed soon after presentation. Therefore, even lacking an obvious surgical need, the bariatric surgeon should be notified of admission.
Improper food choice, and failure to slowly and adequately chew food, can result in emesis and digestive difficulty. Physical incompatibility with the small gastric pouch and gastric outlet obstructions can be caused by nondigestible foods (ie, breads, steak, raw vegetables). This highlights the importance of ordering the appropriate hospital diet.8 Specific gastric bypass hospital diets for all consistencies should reflect the mechanical limitations and carbohydrate/protein requirements of these patients.
Increased gallstone formation is observed in patients with rapid weight loss (1.5 kg/wk), especially following RYGB and less often after LAGB procedures (40% vs 20% over 3 years). Routine use of ursodiol during rapid weight loss (6 months after RYGB) reduces this complication to 5%.8
Stenosis or ulceration at the anastomotic site for RYGB can cause abdominal pain and vomiting. The incidence of stomal stenosis has been reported at 5%‐19% and typically occurs within the first 3 postoperative months.22 This problem is often amenable to endoscopic dilatation, unless a ring was used to reinforce the anastomosis. Ulceration has been reported in 1%‐16% of patients and is usually secondary to tobacco or non‐steroidal anti‐inflammatory drug (NSAID) use, H. pylori, fistula‐induced acid exposure, reaction to foreign material, or ischemia from tension and poor tissue perfusion.23, 24 Endoscopy can diagnose the presence of ulcers, with biopsies to rule out H. pylori infection. Cessation of NSAIDs and tobacco are critical. Medical management including proton pump inhibitors and/or sucralfate is sufficient for up to 95% of patients. Surgical revision is reserved for persistent ulcers associated with obstruction, pain, and/or bleeding.25
Dumping syndrome is a complex of post‐prandial symptoms occurring most commonly in the RYGB patients. As many as 44% of RYGB patients may experience this syndrome characterized by flushing, dizziness, abdominal distension, pain, nausea, vomiting, and/or diarrhea.26 Symptoms may result from the ingestion of large amounts of sugars which empty from the altered gastric pouch at an unregulated rate. This large osmotic load causes fluid shifts and surges in peptide hormone levels, resulting in symptoms which may reinforce adherence to the prescribed postoperative diet. It occurs shortly after a meal and resolves over hours. Dietary modifications, such as increased protein and fiber intake with decreased consumption of simple sugars, will ameliorate symptoms in many patients, with most seeing resolution after the first year.8, 27 Some patients experience hyperglycemia secondary to ingestion of simple carbohydrates, with hypoglycemia approximately 2 hours later (late dumping). In our experience, limiting carbohydrate intake to 30 grams at any meal usually alleviates post‐prandial hypoglycemia.
If the patient reports an absence of bowel movements and flatus, an ileus from chronic narcotic use or a mechanical small bowel obstruction secondary to internal hernias or adhesions (see Late Surgical Complications) must be investigated. Severe or prolonged pain, lasting longer than a few hours, is cause for alarm and should prompt aggressive evaluation and possibly exploratory surgery.
Excessive Weight Loss
In diagnosing postoperative excessive weight loss, it is important to understand average anticipated weight loss parameters. Compared to the values expected for RYGB, LAGB produces less weight loss and BPD with and without DS produces more (Table 227). Patients experiencing more rapid or prolonged weight loss should be investigated for bacterial overgrowth syndrome, short bowel syndrome, or other anatomic abnormalities.
| Postoperative Time Period | Average Weight Loss (RYGB) | |
|---|---|---|
| Daily | By Time Period | |
| ||
| 0‐3 mo | 0.22‐0.45 kg/day | 15‐20 kg by 3 mo |
| 3‐9 mo | 0.11‐0.22 kg/day | 25‐35 kg by 6 mo |
| 9‐12 mo | 0.11 kg/day | 40‐60 kg in first year |
Known risk factors for bacterial overgrowth, which are prominent in this population, include decreased gastric acidity and slowed intestinal transit time (ie, narcotic use). Patients may be asymptomatic or experience weight loss, abdominal bloating and/or pain, nausea, vomiting, and diarrhea. The diagnosis can be made with a hydrogen breath test or by obtaining quantitative cultures of jejunal secretions during endoscopy. Questions remain on how the normalized values of these tests are affected by the postoperative environment, and on how this syndrome may present or be treated if it affects the excluded intestine. Bacterial overgrowth may be an incidental finding and not the cause of the gastrointestinal complaints. Although data is limited, treatment typically consists of a 7‐10 day course of rifaximin 1200 mg/day (divided doses) and/or a trial of dietary modifications.20, 2831 These may include avoiding lactose and eating a high fat, low carbohydrate, low fiber diet, so nutrients are readily absorbed and not left for bacterial consumption.32
Short bowel syndrome (100‐200 cm of intestinal tissue remaining and subsequent malabsorption) can occur after any extensive colonic resection or bypass of the intestine.33 This condition rarely results after an initial bariatric procedure; however, subsequent procedures for small bowel obstructions or intestinal ischemia may result in short bowel syndrome. Typical presentations include diarrhea, weight loss, and symptoms of vitamin and mineral deficiencies. Short bowel can also predispose patients to the development of bacterial overgrowth, further complicating weight loss. Management consists of nutritional supplementation, occasionally parenteral nutrition, and rarely reoperation to increase the length of the common channel.34 Avoidance of further bowel resection is crucial in preventing short bowel syndrome.33, 34 In the setting of carbohydrate malabsorption with concomitant bacterial overgrowth syndrome, production of d‐lactic acid causing a metabolic acidosis with encephalopathy has been reported.35
Once medical complications have been ruled out, it is prudent to evaluate for a psychological component such as anorexia nervosa. It is helpful to involve a qualified psychologist who is familiar with this population. Addictions to alcohol, gambling, and pain medications have been reported in the post‐bariatric surgery population as a substitute for food addiction.
Neurological Complications and Vitamin Deficiencies
Neurological complications develop months to years postoperatively, secondary to vitamin, mineral, and nutrient deficiencies that result from malabsorption or inadequate intake. An inpatient provider should be aware of the potential role these conditions may play in a hospitalized patient.
Peripheral neuropathy can develop secondary to several deficiencies, including vitamin B12, thiamine, vitamin E, and copper. Their sources, deficiencies, and replacement regimens are presented in Table 3.3642 Thiamine deficiency, manifesting as Wernicke's encephalopathy, is particularly important in the postoperative patient with excessive vomiting. For prevention, we recommend all patients readmitted with vomiting and dehydration receive a banana bag or rally pack (thiamine 100 mg, folic acid 1 mg, multivitamin with iron and magnesium 3 g in one liter of D5 normal saline) over 4‐8 hours. Additional deficiencies after gastric bypass include folate, selenium, zinc, vitamin B6, and riboflavin. A multivitamin with minerals will meet the needs of most patients. Multiple fat‐soluble vitamin deficiencies can occur with small bowel bacterial overgrowth or BPD.
| B12 | B1 (Thiamine) | Vitamin E | Copper | |
|---|---|---|---|---|
| Dietary sources | Meat and dairy | Fortified grains, cereals, nuts, and pork | Vegetable oil, nuts, leafy vegetables39 | Shellfish, organ meats (liver, kidney), chocolate, nuts, dried legumes/fruits41 |
| Location of absorption | Terminal ileum after combining with intrinsic factor | Proximal small intestine | Upper small intestine41 | Stomach and duodenum38 |
| Mechanism of deficiency | Inadequate intake intrinsic factor deficiency37, 39 | Bypass of primary absorption site Inadequate intake Excessive emesis | Fat malabsorption39 Inadequate intake | Defective intestinal mucosal transport40 Decreased absorptive surface area40 Inadequate intake Coadministered zinc which competes with copper for absorption38 |
| Time to develop deficiency | Years | 18 days37, 39 | 6‐12 mo39 | 3‐12 mo42 |
| Postoperative supplementation recommendation | Optimal prophylactic dose unknown Minimum 1‐2 mg/day | 1‐1.5 mg/day37 | Males: 10 mg/day Females: 8 mg/day | Multivitamin (900 g/day) |
| Pathology of deficiency | Macrocytic anemia Paresthesias Ataxia Subacute combined degeneration of the spinal cord | Dry beriberi Wernicke's encephalopathy Korsakoff's syndrome | Myopathy/neuropathy Ataxia | Demyelinating neuropathy with ataxia Anemia |
| Labs to document deficiency | Serum B12 | Erythrocyte transketolase activity Thiamine diphosphate effect37 | Serum alphatocopherol37, 39 Check for deficiencies of other fat soluble vitamins (A, D, K) | Serum copper level40 |
| Correcting deficiency | Intramuscular B12 (1000 mcg) Sublingual supplementation36 | 50‐100 mg/day (parenteral or oral)37 | 400 mg PO BID37 | 2‐4 mg/day38 |
Anemia
Iron deficiency affects 6%‐33% of patients after 1 year.43 Iron is preferentially absorbed in the duodenum and proximal jejunum which are bypassed postoperatively. The absence of gastric acid prevents conversion of ferric (Fe2+) to the absorbable ferrous (Fe3+) iron, further decreasing absorption.44 Ferritin reflects iron stores but is also an acute phase reactant and, therefore, may mask an underlying deficiency in an acutely ill hospitalized patient. A multivitamin with iron is recommended for all patients, but additional supplementation may be required for menstruating women.43 Parenteral administration may be necessary if oral supplements are not tolerated or are inadequately absorbed.44
Fractures and Osteomalacia
Calcium and vitamin D deficiencies are a significant problem in the bariatric surgery population, with resultant osteoporosis or osteomalacia and associated fractures.38, 43 Calcium is preferentially absorbed in the duodenum and proximal jejunum. Vitamin D is absorbed in the ileum or produced in the skin in response to ultraviolet B (UVB) radiation.45 Deficiency of vitamin D exacerbates calcium malabsorption, thereby causing secondary hyperparathyroidism, increased bone turnover, and osteomalacia. Dramatic weight loss can lead to bone loss, increasing the risk for osteoporosis and fractures.38 Hypocalcemia or osteomalacia may cause generalized bone pain, muscular weakness, tetany, and chronic musculoskeletal pain.45
Fat‐soluble vitamin deficiencies are more common in those undergoing malabsorptive versus restrictive procedures and, in the case of BPD, may be related to the length of the common channel.43 It is important to ensure that calcium and vitamin D levels are sufficient prior to surgery, and prior to starting any osteoporotic treatment such as bisphosphonates.45 We recommend at least 1200 mg of calcium citrate and 1000‐2000 IU of Vitamin D daily. Up to 50,000 IU weekly or daily may be required to correct deficiency and maintain sufficiency in this population.46, 47 Vitamin D2 (ergocalciferol) or D3 (cholecalciferol) can be used for supplementation. Cholecalciferol is preferred if given through a feeding tube because it is less prone to clogging the tube.46 With severe malabsorption, phototherapy may be necessary, as intravenous doses are often inadequate and intramuscular preparations require special compounding.46 Calcium carbonate requires acid for proper absorption, therefore calcium citrate may be preferred due to achlorhydria from gastric exclusion.
Late Surgical Complications
Hospitalists are increasingly responsible for managing and comanaging surgical patients. The post‐bariatric surgery patient may present with unique signs and symptoms of surgical conditions masquerading as medical conditions. Common conditions that present in uncommon ways include strictures (ie, outlet obstruction and stomal stenosis), hernias with strangulation (incisional and internal), and small bowel obstructions.
Small bowel obstruction (SBO) occurs in 0%‐5% of RYGB patients (less with LAGB, similar with BPD), which is similar to other abdominal surgery rates, and may occur months to years after the original surgery. The differential diagnosis of an SBO includes internal hernias, adhesions, ventral hernia (incisional and umbilical), postoperative ileus, and jejunojejunal anastomotic stricture. Typical symptoms are often present, but may be less obvious than with a non‐gastric bypass patient. Pain can range from acute to a chronic or intermittent pattern. Pain is the most common presenting symptom of obstruction. Pain relieved by emesis may indicate an obstruction in the Roux limb. Nausea, bloating, tachycardia, and hiccups with shoulder/back pain can occur when obstruction in the biliopancreatic limb causes gastric distension.48
Vomiting is seen in fewer than half of patients with SBOs due to the altered anatomy.49 Any post‐RYGB patient that vomits bile needs emergent surgical evaluation for a common channel obstruction. Radiographic imaging may be misleading as to the cause of the obstruction. SBO is crucial to consider since delayed diagnosis can result in bowel ischemia and death.18 For the hospitalist who is caring for a post‐bariatric patient with a bowel obstruction, early surgical consultation is mandatory, preferably with a bariatric surgeon. Traditional medical management such as nasogastric (NG) tube placement will not decompress the excluded stomach, therefore patients rarely benefit from nasogastric decompression. If necessary, an NG tube should only be placed by experienced hands or fluoroscopic guidance, due to the altered anatomy.
Conclusion
Weight loss surgery, developed to address the growing obesity problem, has been beneficial to hundreds of thousands of people by decreasing their excess weight and comorbidities. For some, the postoperative course is complicated by medical and surgical problems requiring hospitalization. It is critically important that, as this relatively new field of postoperative medicine evolves, the hospitalist stay informed on relevant presentations, complications, and treatment to better address this growing population. Early consultation with, and transfer to, a bariatric surgery center should be encouraged. The importance of arranging proper hospital follow‐up, including community‐based support groups, nutritional consults, psychological support, and close follow‐up with the bariatric surgeon, bariatrician, and/or primary care physician, should not be underestimated.
- ,,,.Prevalence and trends in obesity among US adults, 1999‐2008.JAMA.2010;303(3):235–241.
- ,,, et al.Long‐term mortality after gastric bypass surgery.N Engl J Med.2007;357(8):753–761.
- ,,, et al.Bariatric surgery: a systematic review and meta‐analysis.JAMA.2004;292(14):1724–1737.
- ,,.Results of laparoscopic sleeve gastrectomy (LSG) at 1 year in morbidly obese Korean patients.Obes Surg.2005;15(10):1469–1475.
- ,,, et al.Lifestyle, diabetes, and cardiovascular risk factors 10 years after bariatric surgery.N Engl J Med.2004;351(26):2683–2693.
- ,,, et al.Long‐term weight loss and changes in blood pressure: results of the Trials of Hypertension Prevention, phase II.Ann Intern Med.2001;134(1):1–11.
- ,,,.Narrative review: effect of bariatric surgery on type 2 diabetes mellitus.Ann Intern Med.2009;150(2):94–103.
- ,,.Metabolic consequences of bariatric surgery.J Clin Gastroenterol.2006;40(8):659–668.
- ,.Surgical approaches to obesity.Mayo Clin Proc.2006;81(10 suppl):S18–S24.
- ,,, et al.American Association of Clinical Endocrinologists, The Obesity Society, and American Society for Metabolic 4(5 suppl):S109–S184.
- ,,.Long‐term results of laparoscopic sleeve gastrectomy for obesity.Ann Surg.2010;252(2):319–324.
- ,,,,.Gastric banding or bypass? A systematic review comparing the two most popular bariatric procedures.Am J Med.2008;121(10):885–893.
- ,.Gastrointestinal complications of laparoscopic Roux‐en‐Y gastric bypass surgery in patients who are morbidly obese: findings on radiography and CT.AJR Am J Roentgenol.2002;179(6):1437–1442.
- ,,,,.Gastrointestinal complications of laparoscopic Roux‐en‐Y gastric bypass surgery: clinical and imaging findings.Radiology.2002;223(3):625–632.
- ,,.Use of computed tomography in diagnosis of major postoperative gastrointestinal complications of laparoscopic Roux‐en‐Y gastric bypass surgery.Am Surg.2004;70(11):964–966.
- ,,, et al.Diagnosis and contemporary management of anastomotic leaks after gastric bypass for obesity.J Am Coll Surg.2007;204(1):47–55.
- ,,,,.Small‐bowel obstruction after laparoscopic Roux‐en‐Y gastric bypass surgery.J Comput Assist Tomogr.2009;33(3):369–375.
- ,,,,,.Sensitivity and specificity of eight CT signs in the preoperative diagnosis of internal mesenteric hernia following Roux‐en‐Y gastric bypass surgery.Clin Radiol.2009;64(4):373–380.
- ,,, et al.Internal hernia after gastric bypass: sensitivity and specificity of seven CT signs with surgical correlation and controls.AJR Am J Roentgenol.2007;188(3):745–750.
- ,,,,.Nausea, bloating and abdominal pain in the Roux‐en‐Y gastric bypass patient: more questions than answers.Obes Surg.2007;17(11):1529–1533.
- ,,, et al.Management of acute bleeding after laparoscopic Roux‐en‐Y gastric bypass.Obes Surg.2003;13(6):842–847.
- ,,,,.Endoscopic balloon dilation of gastroenteric anastomotic stricture after laparoscopic gastric bypass.Endoscopy.2003;35(9):725–728.
- ,.Ulcer disease after gastric bypass surgery.Surg Obes Relat Dis.2006;2(4):455–459.
- ,,,.Marginal ulcer after gastric bypass: a prospective 3‐year study of 173 patients.Obes Surg.1998;8(5):505–516.
- ,,,,.Stomal complications of gastric bypass: incidence and outcome of therapy.Am J Gastroenterol.1992;87(9):1165–1169.
- ,,,,.[Analysis of the dumping syndrome on morbid obese patients submitted to Roux en Y gastric bypass].Rev Col Bras Cir.2009;36(5):413–419.
- ,,, et al.Clinical management after bariatric surgery: value of a multidisciplinary approach.Mayo Clin Proc.2006;81(10 suppl):S34–S45.
- ,,,,,.Antibiotic efficacy in small intestinal bacterial overgrowth‐related chronic diarrhea: a crossover, randomized trial.Gastroenterology.1999;117(4):794–797.
- ,,,,.Absorbable vs. non‐absorbable antibiotics in the treatment of small intestine bacterial overgrowth in patients with blind‐loop syndrome.Aliment Pharmacol Ther.2005;21(8):985–992.
- ,,, et al.Small intestinal bacterial overgrowth: diagnosis and treatment.Dig Dis.2007;25(3):237–240.
- ,,, et al.Antibiotic therapy in small intestinal bacterial overgrowth: rifaximin versus metronidazole.Eur Rev Med Pharmacol Sci.2009;13(2):111–116.
- ,,,.Treatment strategies for small bowel bacterial overgrowth in short bowel syndrome.J Pediatr Gastroenterol Nutr.1998;27(2):155–160.
- ,,,.Short bowel syndrome following bariatric surgical procedures.Am J Surg.2006;192(6):828–832.
- ,,,,.Postoperative short bowel syndrome.J Am Coll Surg.2005;201(1):85–89.
- ,,.D‐lactic acidosis. A review of clinical presentation, biochemical features, and pathophysiologic mechanisms.Medicine.1998;77(2):73–82.
- ,,, et al.Oral vitamin B12 versus intramuscular vitamin B12 for vitamin B12 deficiency: a systematic review of randomized controlled trials.Fam Pract.2006;23(3):279–285.
- ,,.Neuromuscular diseases and disorders of the alimentary system.Muscle Nerve.2002;25(6):768–784.
- .Nutritional deficiencies following bariatric surgery.General Surgery News: Obesity Care Special Edition.2007;65–72. Available at: http://www.generalsurgerynews.com/download/gsnse07issueWM.pdf.
- ,,,.Neurologic complications after surgery for obesity.Muscle Nerve.2006;33(2):166–176.
- ,,.Acquired hypocupremia after gastric surgery.Clin Gastroenterol Hepatol.2004;2(12):1074–1079.
- ,.Krause's Food 2008.
- ,.Nutritional consequences of bariatric surgery.Curr Opin Clin Nutr Metab Care.2006;9(4):489–496.
- ,,,,.Nutritional deficiencies following bariatric surgery: what have we learned?Obes Surg.2005;15(2):145–154.
- .Managing micronutrient deficiencies in the bariatric surgical patient.Obesity Management.2005;1(5):203–206. Available at: http://www.liebertonline.com/doi/pdf/10.1089/obe.2005.1.203.
- ,,, et al.Abnormalities of vitamin D and calcium metabolism after surgical treatment of morbid obesity: a study of 136 patients.Endocr Pract.2007;13(2):131–136.
- ,,.Vitamin D deficiency in adults: when to test and how to treat.Mayo Clinic Proc.85(8):752–757; quiz757–758.
- ,,, et al.Endocrine and nutritional management of the post‐bariatric surgery patient: an Endocrine Society Clinical Practice Guideline.J Clin Endocrinol Metab.2010;95(11):4823–4843.
- ,,.Small bowel obstruction after laparoscopic Roux‐en‐Y gastric bypass: a review of 9,527 patients.J Am Coll Surg.2008;206(3):571–584.
- ,,,,.Small‐bowel obstruction after laparoscopic Roux‐en‐Y gastric bypass: etiology, diagnosis, and management.Arch Surg.2007;142(10):988–993.
Obesity is a growing epidemic in the United States and worldwide. Over one‐third of Americans (33.8%) are considered obese (body mass index [BMI] 30).1 Nonsurgical interventions have failed to achieve the long‐lasting effects of weight loss surgery and the associated reduction in obesity‐related comorbidities such as type 2 diabetes mellitus, hyperlipidemia, hypertension, obstructive sleep apnea, cancer, coronary artery disease, osteoarthritis, and gastroesophageal reflux disease (GERD).27 The American Society for Metabolic and Bariatric Surgery estimates that 220,000 people underwent bariatric surgery in 2009 with over 1.5 million procedures performed since 1992.
Centers of excellence criteria include follow‐up with the bariatric surgeon for 5 years; however, the patient may be admitted to a hospital without immediate availability of the bariatric surgeon. Since hospitalists are often first responders to the majority of newly hospitalized patients, this growing number of post‐bariatric surgery patients necessitates hospitalists have a full understanding of their unique postoperative anatomical and physiological consequences. During the first hours of an acute inpatient presentation, post‐bariatric surgical patients can be divided into the following categories: surgical complications, surgical complications masquerading as acute medical conditions, and medical complications. Additionally, hospitalists should be aware of the nuances of radiographic imaging and appropriate endoscopic procedures in these patients. This article will discuss the common current bariatric surgical procedures; post‐bariatric surgery radiographic imaging pearls; and a review of the signs, symptoms, and treatment of common medical and surgical complications.
Descriptions of Contemporary Procedures
Contemporary weight loss procedures can be divided into 2 categories based on how they produce weight loss: restrictive only or combination malabsorptive with restriction. Most are performed laparoscopically to reduce postoperative pain, speed recovery, and decrease wound complications.
Restrictive Procedures (Laparoscopic Adjustable Gastric Band and Sleeve Gastrectomy)
These procedures produce weight loss by reducing the size of the stomach or creating an obstruction in the proximal stomach, limiting the consumption of large quantities at one time. They produce early satiety, but patients may still consume a large volume of calorie‐dense liquids compromising weight loss.
Laparoscopic Adjustable Gastric Band
Laparoscopic adjustable gastric band (LAGB; Figure 1A) is the primary form of restrictive procedures with 2 Food and Drug Administration‐approved bands (Lap Band [Allergan, Inc; Irvine, CA] and REALIZE band [Ethicon Endo‐Surgery, Inc; Cincinnati, OH]). A cuff is inflated around the proximal stomach creating a gastric pouch approximately 15‐30 mL in size. A subcutaneous reservoir is attached to the cuff allowing adjustment to the degree of restriction.8 LAGB has replaced the vertical banded gastroplasty (VBG). It is less invasive, adjustable, and reversible (0.1% operative mortality rate). Weight loss is maintained with this procedure but is generally less, with a higher failure rate compared to the more common gastric bypass procedure (Table 1).3, 9 Complications may include band dysfunction (ie, slippage, erosion, infections), esophageal dilatation, balloon failure, and port malposition, with rates approaching 3%‐5% per year requiring removal or repair.10 Patients may also experience GERD symptoms, especially if the condition was present preoperatively. Progressive GERD symptoms should be investigated with an upper gastrointestinal (GI) series to ensure there is no band slippage, esophageal dilation, or dysfunction.
| LAGB | Roux‐en‐Y Gastric Bypass | Biliopancreatic Diversion With and Without Duodenal Switch | |
|---|---|---|---|
| Excess weight loss | 48% | 62% | 70% |
| Resolution of diabetes | 48% | 84% | 98% |
Sleeve Gastrectomy
With the sleeve gastrectomy (Figure 1B) procedure, a small gastric tube is created by resecting the majority of the stomach. Early postoperative complications are comparable to those after Roux‐en‐Y gastric bypass (RYGB) operations. Leaks from the long gastric staple line are the most concerning. Recent report of a leak rate of 4.9% is much higher than contemporary reports of leaks after laparoscopic RYGB operations.11 Gastric tube stenosis is unique to the operation but comparable to gastrojejunal anastomotic stricture rates after RYGB. Weight loss is less than RYGB. Long‐term results from larger cohorts are needed to determine if the high incidence of esophageal complaints (GERD 26%, vomiting 21%), and weight regain issues are consistently experienced.
Combination Procedures (Roux‐en‐Y Gastric Bypass and Biliopancreatic Diversion With and Without Duodenal Switch)
These procedures produce weight loss by decreasing caloric intake and altering digestion and absorption.
Roux‐en‐Y Gastric Bypass
Roux‐en‐Y Gastric Bypass (RYGB) (Figure 1C) is the most common bariatric procedure performed in the United States. As the gold standard, it provides long‐term successful weight loss and a defined risk profile.9 This procedure involves the creation of a small (15‐30 mL) gastric pouch by transecting the stomach and then draining the pouch via a Roux limb. The Roux (aka alimentary) limb is the segment of bowel between the small gastric pouch and the jejunojejunostomy. Variations on this procedure include different length Roux limbs (75‐150 cm) and the use of a silastic ring at the gastrojejunal anastomosis. The latter is not commonly used because of the high incidence of band erosion. Weight loss seems to be independent of these variations. Postoperatively, food bypasses the biliopancreatic limb (ie, the stomach, duodenum, and part of the jejunum) resulting in selective malabsorption in the common channel (the segment distal to the jejunojejunostomy). Hormone secretions are altered, affecting satiety signaling and glucose metabolism.10, 12
Biliopancreatic Diversion With Duodenal Switch
In biliopancreatic diversion (BPD) with duodenal switch (DS) (Figure 1D), a sleeve gastrectomy is performed. The ileum is transected about 250 cm proximal to the ileocecal valve and is then attached to the transected duodenum just distal to the pylorus, forming the path for the food. The excluded duodenum, jejunum, and proximal ileum drain the biliary and pancreatic secretions and are reconnected to the distal ileum about 50‐100 cm proximal to the ileocecal valve. Food and digestive juices mix, allowing for absorption of nutrients over this short common channel. Greater malabsorption of calories, vitamins, and trace elements occurs, providing more reliable weight loss and significantly more nutritional problems.8, 9
Radiographic and Endoscopic Considerations
When evaluating abdominal complaints with radiographic imaging, the postoperative anatomic variations can challenge routine interpretation. An experienced radiologist and involvement of a bariatric surgeon, who is familiar with the post‐gastric bypass anatomical changes, are essential for accurate interpretation.
Computed tomography (CT) scans with oral contrast are the imaging modality of choice, particularly in the acute setting, to rule out small bowel obstruction. CT scans are helpful in delineating postoperative anatomy, detecting anastomotic leaks, obstructions and other intra‐abdominal problems.1315 Routine upper GI series (UGI) after gastric bypass is controversial, with some performing it routinely and others only for cause. Regardless, when UGI is performed, likewise for CT, small volumes of water‐soluble contrast should be used, followed by small volumes of dilute barium solution. A UGI may be complementary and more sensitive in the case of a small leak when done under fluoroscopy, but CT and UGI may not show the leak in as many as 30% of patients; CT scans may provide additional information to help guide the clinical decision making. A negative study should not preclude surgical exploration if a high suspicion for leak exists.16 Internal hernias (loop of bowel passing through a mesenteric defect created by the original surgery), a common cause of bowel obstructions, are frequently missed, therefore a high level of suspicion is necessary.1719 Several studies have identified 8 radiographic CT findings in bowel obstructions caused by internal hernias including swirl sign, mushroom sign, hurricane eye, small bowel obstruction, clustered loops, small bowel behind superior mesenteric artery, right‐side anastomosis, and engorged nodes.18, 19 The clinical picture should guide medical versus surgical management in those exceeding CT scanner weight limits (commonly 350 lb).
Imaging modalities such as UGI, endoscopy, or double balloon enteroscopy (DBE) should be used for patients with more chronic abdominal complaints. UGI may miss leaks and obstructions in the remnant stomach and bypassed intestine. If pathology, such as ulcers, retained sutures, and strictures are suspected in the bypassed stomach/emntestine, DBE can be used to diagnose and therapeutically intervene, but may not be available at all centers and referral may be considered. Endoscopy allows for direct visualization of subtle or mucosal pathology in the small bowel, but is unable to visualize the excluded stomach and duodenum.20
Early Medical and Surgical Complications
Early postoperative complications (within 30 days) occur in the minority of patients after weight loss operations. Clinical findings, even in life‐threatening conditions, may be subtle. Readmissions most often occur for dehydration secondary to inadequate oral intake. Pneumonias, and wound and urinary tract infections are not unique to the bariatric surgery patient, but there is a higher than average risk of pulmonary embolism and bleeding. Bleeding most frequently occurs into the GI tract from staple lines resulting in rapid catharsis or emesis, but can also be intraperitoneal and elusive. Most GI bleeding stops spontaneously, but some require transfusion and re‐exploration in extreme cases.21 Leaks may occur at any of the staple lines or anastomoses. The most common sites of leak are the g‐j anastomosis, gastric pouch, and remnant stomach. Again, remnant stomach and j‐j anastomosis leaks may escape detection by UGI and CT. Re‐exploration of a sick patient in the early postoperative period may be required despite normal imaging studies. Early consultation with, or transfer to, a bariatric surgery center should always be considered for patients readmitted after bariatric surgery.
Late Medical Complications
Gastrointestinal complaints, excessive weight loss, and vitamin/mineral deficiencies resulting in neurological problems and metabolic bone disease are post‐bariatric medical complications that may prompt hospital admission. If not the primary reason for admission, special attention to these issues may prevent readmission, another focus of hospital care.
Gastrointestinal Complaints
One of the most common causes of hospital admission any time postoperatively is abdominal pain. A differential diagnosis of abdominal pain, nausea, and/or vomiting in the post‐bariatric surgery patient should include small bowel obstruction, hernias (internal or incisional), band complications, food intolerance, dietary noncompliance, ileus, mesenteric venous thrombosis, strictures (such as outlet obstruction or anastomotic stenosis), ulcers, esophagitis, cholelithiasis, dumping syndrome, and Roux stasis syndrome.20
A thorough history targeted at the relationship between symptoms and food intake, attention to the character and location of the pain, and a thorough physical exam (specifically the presence or absence of palpable tenderness, guarding, or rebound) is essential. The physical exam may be misleading in obese patients and, if radiographic studies cannot be performed secondary to patient size, surgical exploration may be needed soon after presentation. Therefore, even lacking an obvious surgical need, the bariatric surgeon should be notified of admission.
Improper food choice, and failure to slowly and adequately chew food, can result in emesis and digestive difficulty. Physical incompatibility with the small gastric pouch and gastric outlet obstructions can be caused by nondigestible foods (ie, breads, steak, raw vegetables). This highlights the importance of ordering the appropriate hospital diet.8 Specific gastric bypass hospital diets for all consistencies should reflect the mechanical limitations and carbohydrate/protein requirements of these patients.
Increased gallstone formation is observed in patients with rapid weight loss (1.5 kg/wk), especially following RYGB and less often after LAGB procedures (40% vs 20% over 3 years). Routine use of ursodiol during rapid weight loss (6 months after RYGB) reduces this complication to 5%.8
Stenosis or ulceration at the anastomotic site for RYGB can cause abdominal pain and vomiting. The incidence of stomal stenosis has been reported at 5%‐19% and typically occurs within the first 3 postoperative months.22 This problem is often amenable to endoscopic dilatation, unless a ring was used to reinforce the anastomosis. Ulceration has been reported in 1%‐16% of patients and is usually secondary to tobacco or non‐steroidal anti‐inflammatory drug (NSAID) use, H. pylori, fistula‐induced acid exposure, reaction to foreign material, or ischemia from tension and poor tissue perfusion.23, 24 Endoscopy can diagnose the presence of ulcers, with biopsies to rule out H. pylori infection. Cessation of NSAIDs and tobacco are critical. Medical management including proton pump inhibitors and/or sucralfate is sufficient for up to 95% of patients. Surgical revision is reserved for persistent ulcers associated with obstruction, pain, and/or bleeding.25
Dumping syndrome is a complex of post‐prandial symptoms occurring most commonly in the RYGB patients. As many as 44% of RYGB patients may experience this syndrome characterized by flushing, dizziness, abdominal distension, pain, nausea, vomiting, and/or diarrhea.26 Symptoms may result from the ingestion of large amounts of sugars which empty from the altered gastric pouch at an unregulated rate. This large osmotic load causes fluid shifts and surges in peptide hormone levels, resulting in symptoms which may reinforce adherence to the prescribed postoperative diet. It occurs shortly after a meal and resolves over hours. Dietary modifications, such as increased protein and fiber intake with decreased consumption of simple sugars, will ameliorate symptoms in many patients, with most seeing resolution after the first year.8, 27 Some patients experience hyperglycemia secondary to ingestion of simple carbohydrates, with hypoglycemia approximately 2 hours later (late dumping). In our experience, limiting carbohydrate intake to 30 grams at any meal usually alleviates post‐prandial hypoglycemia.
If the patient reports an absence of bowel movements and flatus, an ileus from chronic narcotic use or a mechanical small bowel obstruction secondary to internal hernias or adhesions (see Late Surgical Complications) must be investigated. Severe or prolonged pain, lasting longer than a few hours, is cause for alarm and should prompt aggressive evaluation and possibly exploratory surgery.
Excessive Weight Loss
In diagnosing postoperative excessive weight loss, it is important to understand average anticipated weight loss parameters. Compared to the values expected for RYGB, LAGB produces less weight loss and BPD with and without DS produces more (Table 227). Patients experiencing more rapid or prolonged weight loss should be investigated for bacterial overgrowth syndrome, short bowel syndrome, or other anatomic abnormalities.
| Postoperative Time Period | Average Weight Loss (RYGB) | |
|---|---|---|
| Daily | By Time Period | |
| ||
| 0‐3 mo | 0.22‐0.45 kg/day | 15‐20 kg by 3 mo |
| 3‐9 mo | 0.11‐0.22 kg/day | 25‐35 kg by 6 mo |
| 9‐12 mo | 0.11 kg/day | 40‐60 kg in first year |
Known risk factors for bacterial overgrowth, which are prominent in this population, include decreased gastric acidity and slowed intestinal transit time (ie, narcotic use). Patients may be asymptomatic or experience weight loss, abdominal bloating and/or pain, nausea, vomiting, and diarrhea. The diagnosis can be made with a hydrogen breath test or by obtaining quantitative cultures of jejunal secretions during endoscopy. Questions remain on how the normalized values of these tests are affected by the postoperative environment, and on how this syndrome may present or be treated if it affects the excluded intestine. Bacterial overgrowth may be an incidental finding and not the cause of the gastrointestinal complaints. Although data is limited, treatment typically consists of a 7‐10 day course of rifaximin 1200 mg/day (divided doses) and/or a trial of dietary modifications.20, 2831 These may include avoiding lactose and eating a high fat, low carbohydrate, low fiber diet, so nutrients are readily absorbed and not left for bacterial consumption.32
Short bowel syndrome (100‐200 cm of intestinal tissue remaining and subsequent malabsorption) can occur after any extensive colonic resection or bypass of the intestine.33 This condition rarely results after an initial bariatric procedure; however, subsequent procedures for small bowel obstructions or intestinal ischemia may result in short bowel syndrome. Typical presentations include diarrhea, weight loss, and symptoms of vitamin and mineral deficiencies. Short bowel can also predispose patients to the development of bacterial overgrowth, further complicating weight loss. Management consists of nutritional supplementation, occasionally parenteral nutrition, and rarely reoperation to increase the length of the common channel.34 Avoidance of further bowel resection is crucial in preventing short bowel syndrome.33, 34 In the setting of carbohydrate malabsorption with concomitant bacterial overgrowth syndrome, production of d‐lactic acid causing a metabolic acidosis with encephalopathy has been reported.35
Once medical complications have been ruled out, it is prudent to evaluate for a psychological component such as anorexia nervosa. It is helpful to involve a qualified psychologist who is familiar with this population. Addictions to alcohol, gambling, and pain medications have been reported in the post‐bariatric surgery population as a substitute for food addiction.
Neurological Complications and Vitamin Deficiencies
Neurological complications develop months to years postoperatively, secondary to vitamin, mineral, and nutrient deficiencies that result from malabsorption or inadequate intake. An inpatient provider should be aware of the potential role these conditions may play in a hospitalized patient.
Peripheral neuropathy can develop secondary to several deficiencies, including vitamin B12, thiamine, vitamin E, and copper. Their sources, deficiencies, and replacement regimens are presented in Table 3.3642 Thiamine deficiency, manifesting as Wernicke's encephalopathy, is particularly important in the postoperative patient with excessive vomiting. For prevention, we recommend all patients readmitted with vomiting and dehydration receive a banana bag or rally pack (thiamine 100 mg, folic acid 1 mg, multivitamin with iron and magnesium 3 g in one liter of D5 normal saline) over 4‐8 hours. Additional deficiencies after gastric bypass include folate, selenium, zinc, vitamin B6, and riboflavin. A multivitamin with minerals will meet the needs of most patients. Multiple fat‐soluble vitamin deficiencies can occur with small bowel bacterial overgrowth or BPD.
| B12 | B1 (Thiamine) | Vitamin E | Copper | |
|---|---|---|---|---|
| Dietary sources | Meat and dairy | Fortified grains, cereals, nuts, and pork | Vegetable oil, nuts, leafy vegetables39 | Shellfish, organ meats (liver, kidney), chocolate, nuts, dried legumes/fruits41 |
| Location of absorption | Terminal ileum after combining with intrinsic factor | Proximal small intestine | Upper small intestine41 | Stomach and duodenum38 |
| Mechanism of deficiency | Inadequate intake intrinsic factor deficiency37, 39 | Bypass of primary absorption site Inadequate intake Excessive emesis | Fat malabsorption39 Inadequate intake | Defective intestinal mucosal transport40 Decreased absorptive surface area40 Inadequate intake Coadministered zinc which competes with copper for absorption38 |
| Time to develop deficiency | Years | 18 days37, 39 | 6‐12 mo39 | 3‐12 mo42 |
| Postoperative supplementation recommendation | Optimal prophylactic dose unknown Minimum 1‐2 mg/day | 1‐1.5 mg/day37 | Males: 10 mg/day Females: 8 mg/day | Multivitamin (900 g/day) |
| Pathology of deficiency | Macrocytic anemia Paresthesias Ataxia Subacute combined degeneration of the spinal cord | Dry beriberi Wernicke's encephalopathy Korsakoff's syndrome | Myopathy/neuropathy Ataxia | Demyelinating neuropathy with ataxia Anemia |
| Labs to document deficiency | Serum B12 | Erythrocyte transketolase activity Thiamine diphosphate effect37 | Serum alphatocopherol37, 39 Check for deficiencies of other fat soluble vitamins (A, D, K) | Serum copper level40 |
| Correcting deficiency | Intramuscular B12 (1000 mcg) Sublingual supplementation36 | 50‐100 mg/day (parenteral or oral)37 | 400 mg PO BID37 | 2‐4 mg/day38 |
Anemia
Iron deficiency affects 6%‐33% of patients after 1 year.43 Iron is preferentially absorbed in the duodenum and proximal jejunum which are bypassed postoperatively. The absence of gastric acid prevents conversion of ferric (Fe2+) to the absorbable ferrous (Fe3+) iron, further decreasing absorption.44 Ferritin reflects iron stores but is also an acute phase reactant and, therefore, may mask an underlying deficiency in an acutely ill hospitalized patient. A multivitamin with iron is recommended for all patients, but additional supplementation may be required for menstruating women.43 Parenteral administration may be necessary if oral supplements are not tolerated or are inadequately absorbed.44
Fractures and Osteomalacia
Calcium and vitamin D deficiencies are a significant problem in the bariatric surgery population, with resultant osteoporosis or osteomalacia and associated fractures.38, 43 Calcium is preferentially absorbed in the duodenum and proximal jejunum. Vitamin D is absorbed in the ileum or produced in the skin in response to ultraviolet B (UVB) radiation.45 Deficiency of vitamin D exacerbates calcium malabsorption, thereby causing secondary hyperparathyroidism, increased bone turnover, and osteomalacia. Dramatic weight loss can lead to bone loss, increasing the risk for osteoporosis and fractures.38 Hypocalcemia or osteomalacia may cause generalized bone pain, muscular weakness, tetany, and chronic musculoskeletal pain.45
Fat‐soluble vitamin deficiencies are more common in those undergoing malabsorptive versus restrictive procedures and, in the case of BPD, may be related to the length of the common channel.43 It is important to ensure that calcium and vitamin D levels are sufficient prior to surgery, and prior to starting any osteoporotic treatment such as bisphosphonates.45 We recommend at least 1200 mg of calcium citrate and 1000‐2000 IU of Vitamin D daily. Up to 50,000 IU weekly or daily may be required to correct deficiency and maintain sufficiency in this population.46, 47 Vitamin D2 (ergocalciferol) or D3 (cholecalciferol) can be used for supplementation. Cholecalciferol is preferred if given through a feeding tube because it is less prone to clogging the tube.46 With severe malabsorption, phototherapy may be necessary, as intravenous doses are often inadequate and intramuscular preparations require special compounding.46 Calcium carbonate requires acid for proper absorption, therefore calcium citrate may be preferred due to achlorhydria from gastric exclusion.
Late Surgical Complications
Hospitalists are increasingly responsible for managing and comanaging surgical patients. The post‐bariatric surgery patient may present with unique signs and symptoms of surgical conditions masquerading as medical conditions. Common conditions that present in uncommon ways include strictures (ie, outlet obstruction and stomal stenosis), hernias with strangulation (incisional and internal), and small bowel obstructions.
Small bowel obstruction (SBO) occurs in 0%‐5% of RYGB patients (less with LAGB, similar with BPD), which is similar to other abdominal surgery rates, and may occur months to years after the original surgery. The differential diagnosis of an SBO includes internal hernias, adhesions, ventral hernia (incisional and umbilical), postoperative ileus, and jejunojejunal anastomotic stricture. Typical symptoms are often present, but may be less obvious than with a non‐gastric bypass patient. Pain can range from acute to a chronic or intermittent pattern. Pain is the most common presenting symptom of obstruction. Pain relieved by emesis may indicate an obstruction in the Roux limb. Nausea, bloating, tachycardia, and hiccups with shoulder/back pain can occur when obstruction in the biliopancreatic limb causes gastric distension.48
Vomiting is seen in fewer than half of patients with SBOs due to the altered anatomy.49 Any post‐RYGB patient that vomits bile needs emergent surgical evaluation for a common channel obstruction. Radiographic imaging may be misleading as to the cause of the obstruction. SBO is crucial to consider since delayed diagnosis can result in bowel ischemia and death.18 For the hospitalist who is caring for a post‐bariatric patient with a bowel obstruction, early surgical consultation is mandatory, preferably with a bariatric surgeon. Traditional medical management such as nasogastric (NG) tube placement will not decompress the excluded stomach, therefore patients rarely benefit from nasogastric decompression. If necessary, an NG tube should only be placed by experienced hands or fluoroscopic guidance, due to the altered anatomy.
Conclusion
Weight loss surgery, developed to address the growing obesity problem, has been beneficial to hundreds of thousands of people by decreasing their excess weight and comorbidities. For some, the postoperative course is complicated by medical and surgical problems requiring hospitalization. It is critically important that, as this relatively new field of postoperative medicine evolves, the hospitalist stay informed on relevant presentations, complications, and treatment to better address this growing population. Early consultation with, and transfer to, a bariatric surgery center should be encouraged. The importance of arranging proper hospital follow‐up, including community‐based support groups, nutritional consults, psychological support, and close follow‐up with the bariatric surgeon, bariatrician, and/or primary care physician, should not be underestimated.
- ,,,.Prevalence and trends in obesity among US adults, 1999‐2008.JAMA.2010;303(3):235–241.
- ,,, et al.Long‐term mortality after gastric bypass surgery.N Engl J Med.2007;357(8):753–761.
- ,,, et al.Bariatric surgery: a systematic review and meta‐analysis.JAMA.2004;292(14):1724–1737.
- ,,.Results of laparoscopic sleeve gastrectomy (LSG) at 1 year in morbidly obese Korean patients.Obes Surg.2005;15(10):1469–1475.
- ,,, et al.Lifestyle, diabetes, and cardiovascular risk factors 10 years after bariatric surgery.N Engl J Med.2004;351(26):2683–2693.
- ,,, et al.Long‐term weight loss and changes in blood pressure: results of the Trials of Hypertension Prevention, phase II.Ann Intern Med.2001;134(1):1–11.
- ,,,.Narrative review: effect of bariatric surgery on type 2 diabetes mellitus.Ann Intern Med.2009;150(2):94–103.
- ,,.Metabolic consequences of bariatric surgery.J Clin Gastroenterol.2006;40(8):659–668.
- ,.Surgical approaches to obesity.Mayo Clin Proc.2006;81(10 suppl):S18–S24.
- ,,, et al.American Association of Clinical Endocrinologists, The Obesity Society, and American Society for Metabolic 4(5 suppl):S109–S184.
- ,,.Long‐term results of laparoscopic sleeve gastrectomy for obesity.Ann Surg.2010;252(2):319–324.
- ,,,,.Gastric banding or bypass? A systematic review comparing the two most popular bariatric procedures.Am J Med.2008;121(10):885–893.
- ,.Gastrointestinal complications of laparoscopic Roux‐en‐Y gastric bypass surgery in patients who are morbidly obese: findings on radiography and CT.AJR Am J Roentgenol.2002;179(6):1437–1442.
- ,,,,.Gastrointestinal complications of laparoscopic Roux‐en‐Y gastric bypass surgery: clinical and imaging findings.Radiology.2002;223(3):625–632.
- ,,.Use of computed tomography in diagnosis of major postoperative gastrointestinal complications of laparoscopic Roux‐en‐Y gastric bypass surgery.Am Surg.2004;70(11):964–966.
- ,,, et al.Diagnosis and contemporary management of anastomotic leaks after gastric bypass for obesity.J Am Coll Surg.2007;204(1):47–55.
- ,,,,.Small‐bowel obstruction after laparoscopic Roux‐en‐Y gastric bypass surgery.J Comput Assist Tomogr.2009;33(3):369–375.
- ,,,,,.Sensitivity and specificity of eight CT signs in the preoperative diagnosis of internal mesenteric hernia following Roux‐en‐Y gastric bypass surgery.Clin Radiol.2009;64(4):373–380.
- ,,, et al.Internal hernia after gastric bypass: sensitivity and specificity of seven CT signs with surgical correlation and controls.AJR Am J Roentgenol.2007;188(3):745–750.
- ,,,,.Nausea, bloating and abdominal pain in the Roux‐en‐Y gastric bypass patient: more questions than answers.Obes Surg.2007;17(11):1529–1533.
- ,,, et al.Management of acute bleeding after laparoscopic Roux‐en‐Y gastric bypass.Obes Surg.2003;13(6):842–847.
- ,,,,.Endoscopic balloon dilation of gastroenteric anastomotic stricture after laparoscopic gastric bypass.Endoscopy.2003;35(9):725–728.
- ,.Ulcer disease after gastric bypass surgery.Surg Obes Relat Dis.2006;2(4):455–459.
- ,,,.Marginal ulcer after gastric bypass: a prospective 3‐year study of 173 patients.Obes Surg.1998;8(5):505–516.
- ,,,,.Stomal complications of gastric bypass: incidence and outcome of therapy.Am J Gastroenterol.1992;87(9):1165–1169.
- ,,,,.[Analysis of the dumping syndrome on morbid obese patients submitted to Roux en Y gastric bypass].Rev Col Bras Cir.2009;36(5):413–419.
- ,,, et al.Clinical management after bariatric surgery: value of a multidisciplinary approach.Mayo Clin Proc.2006;81(10 suppl):S34–S45.
- ,,,,,.Antibiotic efficacy in small intestinal bacterial overgrowth‐related chronic diarrhea: a crossover, randomized trial.Gastroenterology.1999;117(4):794–797.
- ,,,,.Absorbable vs. non‐absorbable antibiotics in the treatment of small intestine bacterial overgrowth in patients with blind‐loop syndrome.Aliment Pharmacol Ther.2005;21(8):985–992.
- ,,, et al.Small intestinal bacterial overgrowth: diagnosis and treatment.Dig Dis.2007;25(3):237–240.
- ,,, et al.Antibiotic therapy in small intestinal bacterial overgrowth: rifaximin versus metronidazole.Eur Rev Med Pharmacol Sci.2009;13(2):111–116.
- ,,,.Treatment strategies for small bowel bacterial overgrowth in short bowel syndrome.J Pediatr Gastroenterol Nutr.1998;27(2):155–160.
- ,,,.Short bowel syndrome following bariatric surgical procedures.Am J Surg.2006;192(6):828–832.
- ,,,,.Postoperative short bowel syndrome.J Am Coll Surg.2005;201(1):85–89.
- ,,.D‐lactic acidosis. A review of clinical presentation, biochemical features, and pathophysiologic mechanisms.Medicine.1998;77(2):73–82.
- ,,, et al.Oral vitamin B12 versus intramuscular vitamin B12 for vitamin B12 deficiency: a systematic review of randomized controlled trials.Fam Pract.2006;23(3):279–285.
- ,,.Neuromuscular diseases and disorders of the alimentary system.Muscle Nerve.2002;25(6):768–784.
- .Nutritional deficiencies following bariatric surgery.General Surgery News: Obesity Care Special Edition.2007;65–72. Available at: http://www.generalsurgerynews.com/download/gsnse07issueWM.pdf.
- ,,,.Neurologic complications after surgery for obesity.Muscle Nerve.2006;33(2):166–176.
- ,,.Acquired hypocupremia after gastric surgery.Clin Gastroenterol Hepatol.2004;2(12):1074–1079.
- ,.Krause's Food 2008.
- ,.Nutritional consequences of bariatric surgery.Curr Opin Clin Nutr Metab Care.2006;9(4):489–496.
- ,,,,.Nutritional deficiencies following bariatric surgery: what have we learned?Obes Surg.2005;15(2):145–154.
- .Managing micronutrient deficiencies in the bariatric surgical patient.Obesity Management.2005;1(5):203–206. Available at: http://www.liebertonline.com/doi/pdf/10.1089/obe.2005.1.203.
- ,,, et al.Abnormalities of vitamin D and calcium metabolism after surgical treatment of morbid obesity: a study of 136 patients.Endocr Pract.2007;13(2):131–136.
- ,,.Vitamin D deficiency in adults: when to test and how to treat.Mayo Clinic Proc.85(8):752–757; quiz757–758.
- ,,, et al.Endocrine and nutritional management of the post‐bariatric surgery patient: an Endocrine Society Clinical Practice Guideline.J Clin Endocrinol Metab.2010;95(11):4823–4843.
- ,,.Small bowel obstruction after laparoscopic Roux‐en‐Y gastric bypass: a review of 9,527 patients.J Am Coll Surg.2008;206(3):571–584.
- ,,,,.Small‐bowel obstruction after laparoscopic Roux‐en‐Y gastric bypass: etiology, diagnosis, and management.Arch Surg.2007;142(10):988–993.
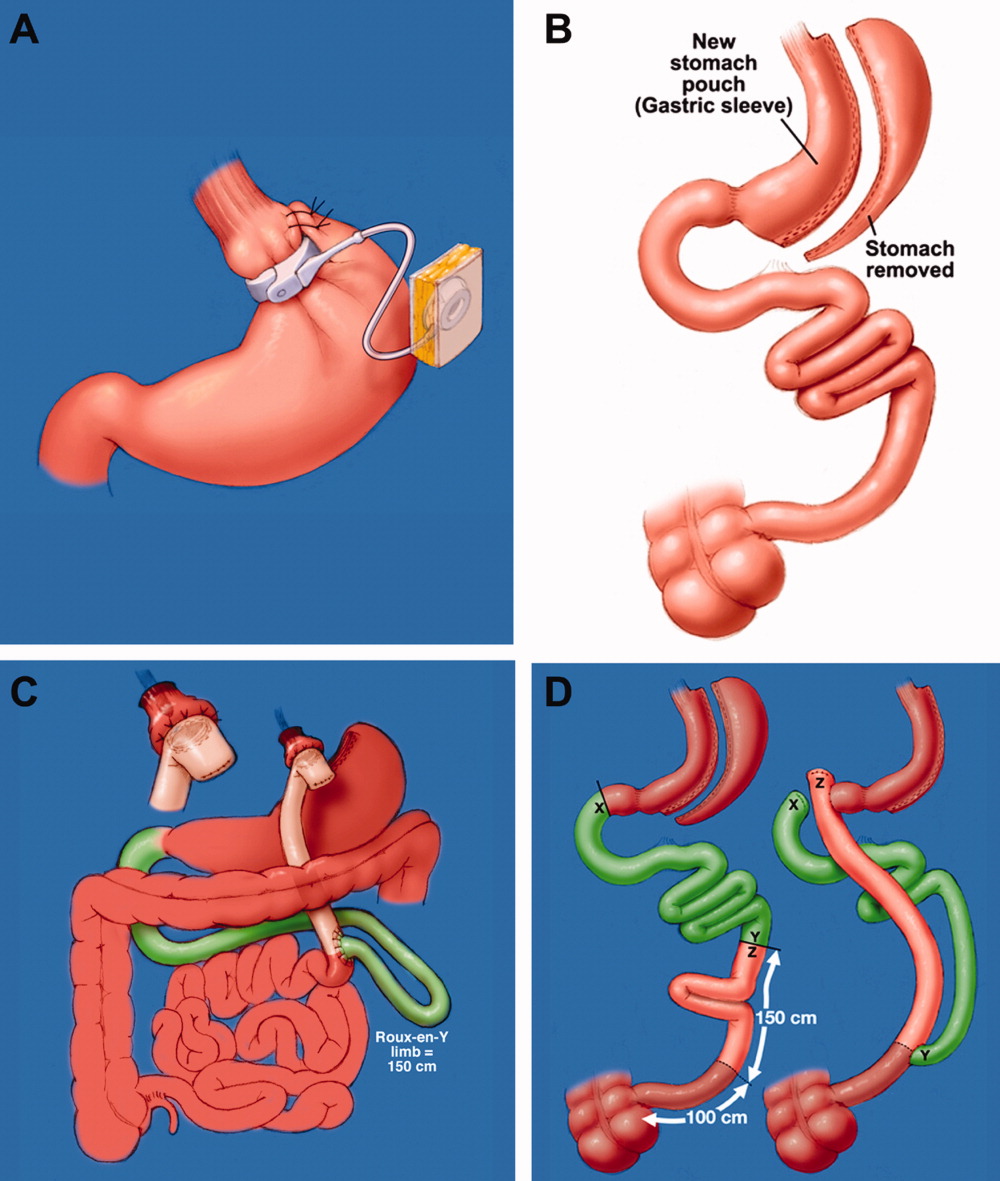
Vancomycin Troughs and Nephrotoxicity
Methicillin‐resistant Staphylococcus aureus (MRSA) is responsible for an increasing number of invasive infections and, in the United States, may now be responsible for more deaths than disease associated with human immunodeficiency virus (HIV).1, 2 Vancomycin remains the drug of choice for invasive MRSA disease; from 1984 to 1996, its use in the United States escalated 6‐fold.3 With increased use of vancomycin, MRSA strains with partial and full resistance to vancomycin have emerged. Since 1997, S. aureus with intermediate susceptibility to vancomycin (VISA) as well as heteroresistance to vancomycin (hVISA) have been described.46 Several centers have also noted a slow rise in minimum inhibitory concentration (MIC) among clinical MRSA isolates (MIC creep).7 Low vancomycin trough levels have been implicated in the emergence of hVISA, and several studies have demonstrated a higher rate of vancomycin treatment failure, longer duration of fever, and prolonged hospitalization with hVISA and strains with elevated MIC compared to vancomycin‐susceptible MRSA.812 Until recently, vancomycin was frequently dosed to target trough levels <10 mg/L. The above concerns, combined with pharmacodynamic data suggesting that maintaining a ratio of vancomycin area under the curve to minimum inhibitory concentration (AUC/MIC) 400 may be associated with improved clinical outcome,13 have prompted an expert consensus to recommend targeting higher vancomycin trough levels (typically 15‐20 mg/L) for invasive MRSA infections and general avoidance of trough levels <10 mg/L.14
The effect of higher trough levels on kidney function remains poorly understood, as does the mechanism of vancomycin‐induced renal injury itself, though animal studies demonstrate oxidative damage to renal tubules with high doses of vancomycin.15, 16 In previous studies, the incidence of vancomycin nephrotoxicity with lower troughs has been reported to range from 0% to 19% with vancomycin alone, increasing up to 35% with concomitant aminoglycoside therapy.1724 Limited studies have been done to assess the risk of nephrotoxicity at higher trough levels. Lodise and colleagues identified high‐dose vancomycin (>4 gm per day) as an independent risk factor for nephrotoxicity, when compared to administration of <4 gm of vancomycin per day or use of linezolid, and showed greater risk of nephrotoxicity with increasing vancomycin trough levels within the first 96 hours of vancomycin administration.25, 26 Hidayat et al. demonstrated, in a prospective cohort analysis, that patients with mean trough levels 15 mg/L had a significantly increased incidence of nephrotoxicity. In that study, patients who developed nephrotoxicity were more likely to receive other nephrotoxic agents, and troughs collected before or after nephrotoxicity onset were not distinguished.9 This is an important distinction, as vancomycin is frequently continued with dose adjustment even after nephrotoxicity occurs, with the nephrotoxicity resulting in subsequent higher troughs. Jeffres et al. demonstrated that maximum vancomycin trough 15 mg/L was associated with nephrotoxicity in patients with healthcare‐associated MRSA pneumonia; this study was retrospective and focused on a particularly ill patient population.27 Pritchard et al. also retrospectively reviewed 2493 courses of vancomycin at their institution, from 2003 to 2007, and found a significant relationship between vancomycin trough 14 mg/L and nephrotoxicity. The presence of comorbid disease states and concomitant nephrotoxins was determined in a subset of 130 courses in 2007; increasing vancomycin trough was associated with nephrotoxicity in multivariable analysis.28 However, it is not clear whether troughs collected before or after nephrotoxicity onset were distinguished in this study. At least 6 other retrospective studies involving small sample size or published in abstract form have widely different results in relating high vancomycin trough or aggressive vancomycin dosing strategies to nephrotoxicity.2934
The purpose of our study was to evaluate the association between development of nephrotoxicity and trough levels obtained during vancomycin therapy at a large veterans' hospital, while accounting for other potential nephrotoxins, and to evaluate the temporal association between elevated vancomycin troughs and nephrotoxicity. We chose to focus on nephrotoxicity that occurred on, or after, 5 days of vancomycin therapy in order to reduce other confounding factors of nephrotoxicity, since short durations of vancomycin frequently represent use in surgical prophylaxis or empirical therapy for hemodynamically unstable patients at high risk for renal injury.
Patients and Methods
Inclusion and Exclusion Criteria
We performed a retrospective cohort study of patients at the Veterans Affairs (VA) Greater Los Angeles Healthcare System during 2 time periods (May 1, 2005‐April 30, 2006 and Jan 1, 2007‐Dec 31, 2007) when hospital guidelines recommended different vancomycin dosing regimens based on indication. During the first time period, the recommended target trough level was 10 mg/L, regardless of indication. In May 2006, target troughs were changed according to the following institutional guidelines: 8‐12 mg/L for cellulitis, urinary tract infection (UTI), and uncomplicated bacteremia; 10‐15 mg/L for endocarditis, osteomyelitis, and visceral abscesses; and 15‐20 mg/L for bacterial meningitis and pneumonia. The vancomycin manufacturers (American Pharmaceutical Partners (Schaumburg, IL) and Baxter (Deerfield, IL)) were the same during both time periods. Patient data was collected from the VA Computerized Patient Records System (CPRS) by 2 trained reviewers (K.K.P. and T.P.). All inpatients who received 5 days of intravenous vancomycin therapy during these time periods were identified via electronic pharmacy records. We then excluded all patients with serum creatinine >2.0 mg/L prior to starting vancomycin, no serum creatinine collected before or during receipt of vancomycin, no trough levels drawn while on vancomycin (or for patients experiencing nephrotoxicity, no trough levels drawn prior to nephrotoxicity onset), nephrotoxicity occurring before day 5 of vancomycin therapy, and receipt of concomitant amphotericin B.
Data Collection and Study Definitions
In patients who received multiple courses of vancomycin during the specified time period, only the first course starting on, or after, May 1, 2005 and lasting 5 days was analyzed. Data collected for each patient included age, sex, race, and comorbidities (diabetes mellitus, liver dysfunction, and active malignancy). Diabetes mellitus was defined as 2 fasting blood glucose levels >125, or receipt of insulin or other hypoglycemic medications during vancomycin treatment. Patients were considered to have liver disease if they had a prior diagnosis of cirrhosis, hepatic encephalopathy, or hepatic insufficiency, or if 2 of the following criteria were met: total bilirubin >2 mg/L, aspartate aminotransferase (AST) or alanine aminotransferase (ALT) >2 the upper limit of normal, or serum albumin <3 g/dL. Receipt of 1 dose of potentially nephrotoxic agents, including aminoglycosides, intravenous furosemide, intravenous trimethoprim‐sulfamethoxazole, intravenous contrast dye, potentially nephrotoxic chemotherapy, and vasopressors, were recorded beginning 72 hours prior to vancomycin therapy until onset of nephrotoxicity, or, if nephrotoxicity did not occur, the final vancomycin dose. Angiotensin‐converting enzyme inhibitors (ACE‐I) and non‐steroidal anti‐inflammatory drugs (NSAIDs) or aspirin were considered potentially nephrotoxic if they were newly started within 72 hours of vancomycin.
For each patient, the serum creatinine was recorded upon admission, within 24 hours of starting vancomycin, during vancomycin treatment, and at 24 hours and 72 hours following the final vancomycin dose. Serum creatinine was typically measured daily. Per institutional protocol, vancomycin trough levels were drawn 30‐60 minutes prior to the fourth dose, and again in 5‐7 days or with any large change in renal function. Extrapolated troughs were calculated by a pharmacist if levels were drawn outside of the 60‐minute time period. The highest trough and duration of therapy was documented for each patient. The mean trough was equal to the arithmetic mean of all troughs obtained during vancomycin administration until 72 hours following the final dose.
Outcome Analysis
The primary end point was the development of nephrotoxicity, which was defined as an increase in serum creatinine by either 0.5 mg/dL or 50% for at least 2 consecutive days after receipt of vancomycin, up to 72 hours after the final dose, compared to the last creatinine measured prior to vancomycin initiation. Patients who had a documented isolated increase in serum creatinine that resolved upon recheck within 24 hours were not classified as experiencing nephrotoxicity. In patients who developed nephrotoxicity, mean troughs, maximum troughs, duration of vancomycin treatment, and receipt of concomitant nephrotoxins were ascertained using data collected only before nephrotoxicity onset. Bivariate and multivariate models were subsequently constructed in order to determine risk factors for nephrotoxicity, using either mean or maximum trough achieved prior to nephrotoxicity for each patient.
Statistical Methods
Comparisons between the 2005‐2006 and 2007 groups were made using Student t test for continuous variables, Wilcoxon rank‐sum test for ordinal variables, and Fisher's exact test for nominal variables. Association of clinical variables with nephrotoxicity was assessed using bivariate logistic regression with subsequent multivariable logistic regression. We initially decided to use maximum vancomycin trough 15 mg/L as the vancomycin exposure variable of interest to include in multivariable models, as we felt that (1) trough 15 mg/L is clinically relevant given current guidelines that recommend aiming for trough 15 mg/L for treatment of most invasive staphylococcal disease,31 and (2) prior studies identified a single trough 15 mg/L as a possible risk factor for nephrotoxicity.9, 27, 29, 31 However, we also generated other multivariable models that included either maximum vancomycin trough 20 mg/L, mean vancomycin trough 15 mg/L, or mean vancomycin trough 20 mg/L, and models in which maximum and mean vancomycin troughs were treated as continuous variables. All variables were initially included in multivariable models; nonsignificant variables were removed from the models in a backwards stepwise fashion until likelihood ratio testing determined that removal of any variable was associated with likelihood ratio test P value <0.20 in comparing the full to reduced model. All calculated P values are two‐sided. All calculations were performed with STATA, version 10 (StataCorp, College Station, TX). This study was approved via expedited review by the Institutional Review Board of the VA Greater Los Angeles Healthcare System.
Results
Comparison of 2005‐2006 Versus 2007 Cohorts
Of the 705 patients who were identified by pharmacy records to have received intravenous vancomycin, 348 patients remained after exclusion criteria were applied; the vast majority of patients were excluded because they received <5 days of vancomycin therapy. Of the 348 patients included in the study, 201 received vancomycin in 2005‐2006, and 147 received vancomycin in 2007 (Table 1). Mean vancomycin trough was significantly higher in 2007 than 2005‐2006 (average mean trough 13.2 mg/L 4.3 vs 9.7 mg/L 3.6; P < 0.0001), although median (8 vs 9 days) and mean (11.2 vs 12.2 days) duration of therapy was 1 day shorter in 2007 versus 2005‐2006. Age, sex, race, comorbidities, and indication for vancomycin use were similar between the 2 groups. The receipt of concomitant nephrotoxins was largely similar between the 2 time periods, with the primary exception being that a higher proportion of patients received intravenous contrast dye in 2007 (19%) than in 2005‐2006 (8.0%) (P = 0.003), and a lower proportion of patients received amikacin in 2007 (7.5%) than in 2005‐2006 (15%) (P = 0.043), though overall receipt of aminoglycosides was similar. Overall, nephrotoxicity was noted in 31 patients (8.9%), with similar incidence in 2005‐2006 (8.0%) and 2007 (10.2%) (P = 0.57). The median time to onset of nephrotoxicity was 7 days, with a median peak serum creatinine of 1.8 mg/dL.
| 2005‐2006 (n = 201) | 2007 (n = 147) | P Value* | Combined (n = 348) | |
|---|---|---|---|---|
| ||||
| Patient characteristics | ||||
| Age (median years) | 59 | 61 | 0.18 | 60 |
| Male gender (no. of patients) | 198 (99%) | 141 (96%) | 0.18 | 339 (97.4%) |
| Race (no. of patients): | ||||
| White | 128 (63.7%) | 95 (64.6%) | 0.91 | 223 (64.1%) |
| Black | 57 (28.4%) | 40 (27.2%) | 0.90 | 97 (27.9%) |
| Other race | 16 (8%) | 12 (8.2%) | 1.00 | 28 (8%) |
| Comorbidities (no. of patients): | ||||
| Diabetes | 75 (37.3%) | 50 (34%) | 0.57 | 125 (35.9%) |
| Liver disease | 29 (14.4%) | 14 (9.5%) | 0.19 | 43 (12.4%) |
| Malignancy | 33 (16.4%) | 21 (14.3%) | 0.65 | 54 (15.5%) |
| Concomitant nephrotoxins (no. of patients): | ||||
| Aminoglycosides (any): | 41 (20.4%) | 25 (17.0%) | 0.49 | 66 (19.0%) |
| Gentamicin | 11 (5.5%) | 14 (9.5%) | 0.21 | 25 (7.2%) |
| Amikacin | 30 (14.9%) | 11 (7.5%) | 0.043 | 41 (11.8%) |
| IV Furosemide | 53 (26.4%) | 34 (23.1%) | 0.53 | 87 (25.0%) |
| ACE‐inhibitor (newly started) | 20 (10%) | 10 (6.8%) | 0.34 | 30 (8.6%) |
| NSAID (newly started) | 26 (12.9%) | 11 (7.5%) | 0.12 | 37 (10.6%) |
| IV Trimethoprim‐sulfamethoxazole | 3 (1.5%) | 2 (1.4%) | 1.00 | 5 (1.4%) |
| Contrast dye | 16 (8%) | 28 (19.0%) | 0.003 | 44 (12.6%) |
| Chemotherapy | 3 (1.5%) | 4 (2.7%) | 0.42 | 7 (2%) |
| Vasopressors (any): | 13 (6.5%) | 7 (4.8%) | 0.64 | 20 (5.7%) |
| Dopamine | 4 (2%) | 1 (0.7%) | 0.40 | 5 (1.4%) |
| Epinephrine | 5 (2.5%) | 1 (0.7%) | 0.41 | 6 (1.7%) |
| Norepinephrine | 9 (4.5%) | 5 (3.4%) | 0.78 | 14 (4.0%) |
| Phenylephrine | 2 (1.0%) | 1 (0.7%) | 1.00 | 3 (0.9%) |
| Vasopressin | 0 (0%) | 1 (0.7%) | 0.42 | 1 (0.3%) |
| Indication for vancomycin: | ||||
| Skin/soft tissue/bone infection | 112 (55.7%) | 77 (52.4%) | 0.59 | 189 (54.3%) |
| Pneumonia | 26 (12.9%) | 26 (17.7%) | 0.23 | 52 (14.9%) |
| Bacteremia | 26 (12.9%) | 14 (9.5%) | 0.40 | 40 (11.5%) |
| Other | 37 (18.4%) | 30 (20.4%) | 0.68 | 67 (19.3%) |
| Clinical outcomes | ||||
| Nephrotoxicity (no. of patients) | 16 (8%) | 15 (10.2%) | 0.57 | 31 (8.9%) |
| Mean admission creatinine (mg/L) | 1.10 | 1.16 | 0.25 | 1.13 |
| Mean vancomycin trough (mg/L) | 9.71 | 13.2 | <0.0001 | 11.2 |
| Mean highest vancomycin trough (mg/L) | 11.8 | 15.7 | <0.0001 | 13.5 |
| Vancomycin duration (median days) | 9 | 8 | 0.014 | 8 |
Determination of Clinical Factors for Nephrotoxicity
Results of bivariate and multivariate analysis of clinical factors potentially associated with nephrotoxicity are displayed in Table 2. Among the 31 patients experiencing nephrotoxicity, the mean maximum vancomycin trough prior to nephrotoxicity onset was 14.9 mg/L, compared to 13.3 mg/L among those not experiencing nephrotoxicity (OR 1.03 for each 1 mg/L increment in mean trough, 95% confidence interval [CI] 0.98‐1.09; P = 0.21). While there was a trend toward patients with nephrotoxicity having a maximum trough 15 mg/L, it was not significant in either bivariate (OR 2.18, 95% CI 0.85‐5.63; P = 0.11) or multivariate (OR 2.05, 95% CI 0.91‐4.61; P = 0.082) analysis. The duration of vancomycin therapy was also not significantly associated with nephrotoxicity, both when evaluated as a continuous variable and when prolonged courses (14 days) were compared to short courses (between 5 and 14 days) of therapy. Other multivariable models were constructed that included maximum trough 20 mg/L, mean trough 15 mg/L, mean trough 20 mg/L, and maximum and mean trough as continuous variables; in all of these models, the vancomycin exposure variable of interest was not significant enough to remain in the final model after backwards elimination. The only factor significantly associated with nephrotoxicity in either bivariate or multivariate analysis was receipt of intravenous contrast dye (OR 3.64, 95% CI 1.52‐8.68; P = 0.004 in multivariate analysis).
| Clinical Factor | NT (n = 31) | No NT (n = 317) | Bivariate Analysis | Multivariate Analysis | ||
|---|---|---|---|---|---|---|
| Odds Ratio | P Value | Odds Ratio | P Value | |||
| ||||||
| Patient demographics | ||||||
| Age (median) | 64 yr | 60 yr | 1.01 | 0.48 | ||
| Male sex | 31 | 308 | N/A | 1.00 | ||
| Race: | ||||||
| White | 17 | 206 | 1.0 (reference) | |||
| Black | 10 | 87 | 1.39 | 0.43 | ||
| Other | 4 | 24 | 2.02 | 0.24 | ||
| Vancomycin characteristics | ||||||
| Mean trough (mg/L), mean per group: | 12.1 | 11.1 | 1.05* | 0.19 | ||
| Patients with mean trough <10 mg/L | 9 | 140 | 1.0 (reference) | |||
| Patients with mean trough 10‐15 mg/L | 15 | 130 | 1.79 | 0.18 | ||
| Patients with mean trough 15 mg/L | 7 | 47 | 2.32 | 0.11 | ||
| Highest trough (mg/L), mean per group | 14.9 | 13.3 | 1.03* | 0.21 | ||
| Patients with highest trough <10 mg/L | 7 | 107 | 1.0 (reference) | |||
| Patients with highest trough 10‐15 mg/L | 10 | 112 | 1.36 | 0.54 | ||
| Patients with highest trough 15 mg/L | 14 | 98 | 2.18 | 0.11 | 2.05 | 0.082 |
| Days of vancomycin therapy (median) | 7 | 8 | 0.97 | 0.40 | 0.96 | 0.17 |
| 14 days of vancomycin therapy | 7 | 71 | 1.01 | 0.98 | ||
| Clinical characteristics | ||||||
| SCr >1 mg/L prior to vancomycin | 11 | 136 | 0.73 | 0.43 | ||
| Diabetes | 10 | 115 | 0.84 | 0.66 | ||
| Liver disease | 3 | 40 | 0.74 | 0.64 | ||
| Malignancy | 5 | 49 | 1.05 | 0.92 | ||
| Concomitant nephrotoxins (any): | 21 | 174 | 1.73 | 0.17 | ||
| Aminoglycosides (any): | 7 | 59 | 1.28 | 0.59 | ||
| Amikacin | 3 | 38 | 0.79 | 0.70 | ||
| Gentamicin | 4 | 21 | 2.09 | 0.21 | ||
| Furosemide (intravenous) | 10 | 77 | 1.48 | 0.33 | ||
| ACE‐inhibitor (newly started) | 1 | 29 | 0.33 | 0.29 | 0.31 | 0.27 |
| NSAIDs (newly started) | 2 | 35 | 0.56 | 0.44 | ||
| TMP‐SMX (intravenous) | 2 | 3 | 7.22 | 0.034 | ||
| Contrast dye (intravenous) | 10 | 34 | 3.96 | 0.001 | 4.01 | 0.001 |
| Chemotherapy | 1 | 6 | 1.73 | 0.62 | ||
| Vasopressors (any): | 1 | 19 | 0.52 | 0.53 | ||
| Dopamine | 0 | 5 | 0 | 1.0 | ||
| Epinephrine | 0 | 6 | 0 | 1.0 | ||
| Norepinephrine | 1 | 13 | 0.78 | 0.81 | ||
| Phenylephrine | 0 | 3 | 0 | 1.0 | ||
| Vasopressin | 0 | 1 | 0 | 1.0 | ||
Reversibility of Nephrotoxicity
Of the 31 patients with nephrotoxicity, 20 (64.5%) patients still met criteria for nephrotoxicity at the time of vancomycin discontinuation. Nephrotoxicity subsequently resolved in 10 of the 16 patients that were still nephrotoxic at the time of vancomycin discontinuation (4 patients did not have follow‐up creatinine checked within 72 hours of vancomycin discontinuation). Thus, overall reversibility of nephrotoxicity either prior to, or within, 72 hours of vancomycin discontinuation was 77.8% (21/27 patients). Of the 6 patients who remained persistently nephrotoxic at 72 hours, all had received concomitant nephrotoxins prior to the onset of nephrotoxicity, as compared to 15/21 (71.4%) patients whose nephrotoxicity resolved (P = 0.28 by Fisher's exact test). Only 1 persistently nephrotoxic patient required dialysis: a critically ill patient with multiorgan failure for whom care was withdrawn within 4 days of vancomycin discontinuation.
DISCUSSION
Over the past 5 years, many institutions have adopted higher dosing guidelines for vancomycin, based on pharmacokinetic concerns related to its performance in the treatment of invasive staphylococcal disease. The data on nephrotoxicity at these higher troughs are limited. Previous studies that address the relationship between higher vancomycin troughs and nephrotoxicity suffer from small sample size29, 33; do not address reversibility of nephrotoxicity9, 26, 2931, 33; may not account for the temporal relationship between the development of nephrotoxicity and high trough levels,9, 2831 or examine patient populations at relatively high27 or low30 risk for renal injury apart from receipt of vancomycin. A recent expert consensus statement identified these factors as limiting the strength of evidence for a direct causal relationship between elevated vancomycin troughs and nephrotoxicity.14 A recent review by Hazlewood et al. concluded that the incidence of nephrotoxicity remains low in patients without preexisting renal disease and those not receiving concomitant nephrotoxins.35 The aim of our study was to identify whether or not there was a correlation between high‐dose vancomycin and nephrotoxicity, while accounting for their temporal relationship, concomitant nephrotoxin use, and reversibility. In particular, we chose to focus on nephrotoxicity occurring after at least 5 days of vancomycin therapy in order to reduce confounding by other possible sources of renal injury that may have affected the decision to initially prescribe vancomycin, an approach advocated by a recent review.36 While we noted that mean and maximum vancomycin troughs were significantly higher in 2007 than 2005‐2006, incidence of nephrotoxicity was stable between the 2 time periods, with the higher rate of intravenous contrast dye in 2007 balanced in part by less aminoglycoside use. Overall, higher trough levels were not necessarily accompanied by a significant increase in nephrotoxicity, though there was a nonsignificant trend toward more nephrotoxic patients having maximum trough 15 mg/L.
The only clinical factor that was significantly associated with nephrotoxicity in multivariate analysis was receipt of intravenous contrast dye. Of the 44 patients who received intravenous contrast dye, 10 (22.7%) experienced nephrotoxicity. Interestingly, in animal studies, both intravenous contrast dye37, 38 and high‐dose vancomycin15, 16 have been demonstrated to promote free radical formation within renal tissue, which is hypothesized to cause tubular damage primarily through vascular endothelial dysfunction, vasoconstriction, and subsequent reperfusion injury. N‐acetylcysteine is frequently administered to patients about to receive intravenous contrast dye (although its benefit remains controversial37, 39); N‐acetylcysteine has also been shown in an animal model to attenuate vancomycin‐induced renal injury.40
Receipt of concomitant aminoglycosides was not significantly associated with nephrotoxicity, in contrast with previous studies. One meta‐analysis of 8 studies revealed found that the incidence of nephrotoxicity associated with combination vancomycin and aminoglycosides was 13.3% greater than with vancomycin alone (P < 0.01) and 4.3% greater than therapy with an aminoglycoside alone (P < 0.05)20; another analysis of safety data of the clinical trial comparing daptomycin to comparator therapy including initial low‐dose gentamicin therapy in the treatment of S. aureus bacteremia found renal adverse events in 10 of 53 (19%) patients receiving vancomycin and gentamicin, compared to 8 of 120 (7%) patients receiving daptomycin.41 While our findings that show no clear relationship between concomitant vancomycin and aminoglycoside use and nephrotoxicity may have been due to the relatively small number of patients in our study who received aminoglycosides, it is worth noting that more patients in our study received aminoglycosides than intravenous contrast dye (66 vs 44 patients). The 77.8% overall resolution of nephrotoxicity observed in our study is similar to that reported by Farber and Moellering in 198319 and to that reported more recently with high‐dose vancomycin by Jeffres et al. and Teng et al.27, 34
Although we attempted to account for as many confounders as possible, the retrospective nature of our study prevents us from making definitive statements regarding the role of vancomycin trough levels and nephrotoxicity. In particular, we are unable to comment on any potential role vancomycin may have on nephrotoxicity within 5 days of its start or on patients with a baseline serum creatinine >2. Other significant limitations include our small proportion of female patients, and that we were not able to calculate severity of illness or determine the presence of congestive heart failure. Also, we may be dosing vancomycin less aggressively than other centers, and thus may have reduced power in determining whether higher troughs, particularly those 20 mg/L, are associated with nephrotoxicity; identification of more patients with higher troughs and a larger overall sample size may have yielded different results. Even in the 2007 group, a significant number of patients with cellulitis, UTI, and uncomplicated bacteremia had target troughs of 8‐12 mg/L. However, taken together, our findings do not support a definite relationship between vancomycin troughs and development of nephrotoxicity, and that when it does occur, it is largely reversible. Further prospective research is needed to evaluate the effects of aggressive vancomycin dosing regimens on nephrotoxicity, particularly those regimens that include large loading doses. Trials of antioxidative agents in patients receiving aggressive dosing regimens of vancomycin who require radiology studies involving intravenous contrast dye may be indicated as well.
- .Antimicrobial resistance: it's not just for hospitals.JAMA.2007;298:1803–1804.
- ,,, et al.Invasive methicillin‐resistant Staphylococcus aureus infections in the United States.JAMA.2007;298:1763–1771.
- ,,.Historical yearly usage of vancomycin.Antimicrob Agents Chemother.1998;42:1303–1304.
- ,,, et al.Dissemination in Japanese hospitals of strains of Staphylococcus aureus heterogeneously resistant to vancomycin.Lancet.1997;350:1670–1673.
- ,,,,,.Methicillin‐resistant Staphylococcus aureus clinical strain with reduced vancomycin susceptibility.J Antimicrob Chemother.1997;40:135–136.
- ,.Staphylococcus aureus with heterogeneous resistance to vancomycin: epidemiology, clinical significance, and critical assessment of diagnostic methods.Antimicrob Agents Chemother.2003;47:3040–3045.
- ,,.Vancomycin MIC creep in non‐vancomycin‐intermediate Staphylococcus aureus (VISA), vancomycin‐susceptible clinical methicillin‐resistant S. aureus (MRSA) blood isolates from 2001–05.J Antimicrob Chemother.2007;60:788–794.
- ,,,,.Clinical features associated with bacteremia due to heterogeneous vancomycin‐ intermediate Staphylococcus aureus.Clin Infect Dis.2004;38:448–451.
- ,,,,.High‐dose vancomycin therapy for methicillin‐resistant Staphylococcus aureus infections: efficacy and toxicity.Arch Intern Med.2006;166:2138–2144.
- ,,,,,.Accessory gene regulator group II polymorphism in methicillin‐resistant Staphylococcus aureus is predictive of failure of vancomycin therapy.Clin Infect Dis.2004;38:1700–1705.
- ,,,,,.Relationship of MIC and bactericidal activity to efficacy of vancomycin for treatment of methicillin‐resistant Staphylococcus aureus bacteremia.J Clin Microbiol.2004;42:2398–2402.
- ,.The rationale for revising the Clinical and Laboratory Standards Institute vancomycin minimal inhibitory concentration interpretive criteria for Staphylococcus aureus.Clin Infect Dis.2007;44:1208–1215.
- ,,,.Pharmacodynamics of vancomycin and other antimicrobials in patients with Staphylococcus aureus lower respiratory tract infections.Clin Pharmacokinet.2004;43:925–942.
- ,,, et al.Therapeutic monitoring of vancomycin in adult patients: a consensus review of the American Society of Health‐System Pharmacists, the Infectious Diseases Society of America, and the Society of Infectious Diseases Pharmacists.Am J Health Syst Pharm.2009;66:82–98.
- ,,, et al.Gene expression analysis reveals new possible mechanisms of vancomycin‐induced nephrotoxicity and identifies gene markers candidates.Toxicol Sci.2009;107:258–269.
- ,,, et al.In vivo evidences suggesting the role of oxidative stress in pathogenesis of vancomycin‐induced nephrotoxicity: protection by erdosteine.Toxicology.2005;215:227–233.
- ,,,.Relationship of serum antibiotic concentrations to nephrotoxicity in cancer patients receiving concurrent aminoglycoside and vancomycin therapy.Am J Med.1987;83:1091–1097.
- ,,,.Mild nephrotoxicity associated with vancomycin use.Arch Intern Med.1989;149:1777–1781.
- ,.Retrospective study of the toxicity of preparations of vancomycin from 1974 to 1981.Antimicrob Agents Chemother.1983;23:138–141.
- ,.Nephrotoxicity of vancomycin and aminoglycoside therapy separately and in combination.J Antimicrob Chemother.1993;32:325–334.
- ,,,.Vancomycin toxicity: a prospective study.J Antimicrob Chemother.1985;15:773–780.
- ,,,,.Risk of nephrotoxicity with combination vancomycin‐aminoglycoside antibiotic therapy.Pharmacotherapy.1990;10:378–382.
- ,,,.Nephrotoxicity of vancomycin, alone and with an aminoglycoside.J Antimicrob Chemother.1990;25:679–687.
- ,.A prospective study of adverse reactions associated with vancomycin therapy.J Antimicrob Chemother.1985;16:235–241.
- ,,,.Larger vancomycin doses (at least four grams per day) are associated with an increased incidence of nephrotoxicity.Antimicrob Agents Chemother.2008;52:1330–1336.
- ,,,,.Relationship between initial vancomycin concentration‐time profile and nephrotoxicity among hospitalized patients.Clin Infect Dis.2009;49:507–514.
- ,,,,.A retrospective analysis of possible renal toxicity associated with vancomycin in patients with health care‐associated methicillin‐resistant Staphylococcus aureus pneumonia.Clin Ther.2007;29:1107–1115.
- ,,,,,.Increasing vancomycin serum trough concentrations and incidence of nephrotoxicity.Am J Med.2010;123:1143–1149.
- ,,. Nephrotoxicity associated with aggressive vancomycin therapy [abstract L‐1298]. In:Program and Abstracts of the 46th Interscience Conference on Antimicrobial Agents and Chemotherapy, San Francisco, CA, 2006. Washington, DC: American Society for Microbiology.
- ,,,,. Incidence of vancomycin nephrotoxicity in the absence of concomitant nephrotoxins or confounders [abstract A1–1294b]. In:Program and Abstracts of the 49th Interscience Conference on Antimicrobial Agents and Chemotherapy, San Francisco, CA, 2009. Washington, DC: American Society for Microbiology.
- ,,, et al. Nephrotoxicity associated with high‐dose versus standard‐dose vancomycin therapy [abstract K‐1096]. In:Program and Abstracts of the 47th Interscience Conference on Antimicrobial Agents and Chemotherapy, Chicago, IL, 2007. Washington, DC: American Society for Microbiology.
- ,,. Evaluation of vancomycin nephrotoxicity in patients with methicillin‐resistant Staphylococcus aureus bacteremia [abstract A1–1294a]. In:Program and Abstracts of the 49th Interscience Conference on Antimicrobial Agents and Chemotherapy, San Francisco, CA, 2009. Washington, DC: American Society for Microbiology.
- ,,.Association of vancomycin serum concentrations with outcomes in patients with gram‐positive bacteremia.Pharmacotherapy.1995;15:85–91.
- ,,, et al. Continuation of high dose vancomycin despite nephrotoxicity [abstract K‐3486]. In:Abstracts of the 48th Interscience Conference on Antimicrobial Agents and Chemotherapy/46th Infectious Diseases Society of America Annual Meeting, Washington, DC, 2008. Washington, DC: American Society for Microbiology.
- ,,,.Vancomycin‐associated nephrotoxicity: grave concern or death by character assassination?Am J Med.2010;123:182–187.
- ,,,.Vancomycin‐associated nephrotoxicity: a critical appraisal of risk with high‐dose therapy.Int J Antimicrob Agents.2011;37:95–101.
- ,,,.Lights and shadows on the pathogenesis of contrast‐induced nephropathy: state of the art.Nephrol Dial Transplant.2005;20:1542–1550.
- ,,.Pathophysiology of contrast medium‐induced nephropathy.Kidney Int.2005;68:14–22.
- ,,, et al.N‐acetylcysteine for the prevention of radiocontrast induced nephropathy: a meta‐analysis of prospective controlled trials.J Am Soc Nephrol.2004;15:761–769.
- ,,,,.Protective effects of caffeic acid phenethyl ester, vitamin C, vitamin E and N‐acetylcysteine on vancomycin‐induced nephrotoxicity in rats.Basic Clin Pharmacol Toxicol.2007;100:328–333.
- ,,, et al.Initial low‐dose gentamicin for Staphylococcus aureus bacteremia and endocarditis is nephrotoxic.Clin Infect Dis.2009;48:713–721.
Methicillin‐resistant Staphylococcus aureus (MRSA) is responsible for an increasing number of invasive infections and, in the United States, may now be responsible for more deaths than disease associated with human immunodeficiency virus (HIV).1, 2 Vancomycin remains the drug of choice for invasive MRSA disease; from 1984 to 1996, its use in the United States escalated 6‐fold.3 With increased use of vancomycin, MRSA strains with partial and full resistance to vancomycin have emerged. Since 1997, S. aureus with intermediate susceptibility to vancomycin (VISA) as well as heteroresistance to vancomycin (hVISA) have been described.46 Several centers have also noted a slow rise in minimum inhibitory concentration (MIC) among clinical MRSA isolates (MIC creep).7 Low vancomycin trough levels have been implicated in the emergence of hVISA, and several studies have demonstrated a higher rate of vancomycin treatment failure, longer duration of fever, and prolonged hospitalization with hVISA and strains with elevated MIC compared to vancomycin‐susceptible MRSA.812 Until recently, vancomycin was frequently dosed to target trough levels <10 mg/L. The above concerns, combined with pharmacodynamic data suggesting that maintaining a ratio of vancomycin area under the curve to minimum inhibitory concentration (AUC/MIC) 400 may be associated with improved clinical outcome,13 have prompted an expert consensus to recommend targeting higher vancomycin trough levels (typically 15‐20 mg/L) for invasive MRSA infections and general avoidance of trough levels <10 mg/L.14
The effect of higher trough levels on kidney function remains poorly understood, as does the mechanism of vancomycin‐induced renal injury itself, though animal studies demonstrate oxidative damage to renal tubules with high doses of vancomycin.15, 16 In previous studies, the incidence of vancomycin nephrotoxicity with lower troughs has been reported to range from 0% to 19% with vancomycin alone, increasing up to 35% with concomitant aminoglycoside therapy.1724 Limited studies have been done to assess the risk of nephrotoxicity at higher trough levels. Lodise and colleagues identified high‐dose vancomycin (>4 gm per day) as an independent risk factor for nephrotoxicity, when compared to administration of <4 gm of vancomycin per day or use of linezolid, and showed greater risk of nephrotoxicity with increasing vancomycin trough levels within the first 96 hours of vancomycin administration.25, 26 Hidayat et al. demonstrated, in a prospective cohort analysis, that patients with mean trough levels 15 mg/L had a significantly increased incidence of nephrotoxicity. In that study, patients who developed nephrotoxicity were more likely to receive other nephrotoxic agents, and troughs collected before or after nephrotoxicity onset were not distinguished.9 This is an important distinction, as vancomycin is frequently continued with dose adjustment even after nephrotoxicity occurs, with the nephrotoxicity resulting in subsequent higher troughs. Jeffres et al. demonstrated that maximum vancomycin trough 15 mg/L was associated with nephrotoxicity in patients with healthcare‐associated MRSA pneumonia; this study was retrospective and focused on a particularly ill patient population.27 Pritchard et al. also retrospectively reviewed 2493 courses of vancomycin at their institution, from 2003 to 2007, and found a significant relationship between vancomycin trough 14 mg/L and nephrotoxicity. The presence of comorbid disease states and concomitant nephrotoxins was determined in a subset of 130 courses in 2007; increasing vancomycin trough was associated with nephrotoxicity in multivariable analysis.28 However, it is not clear whether troughs collected before or after nephrotoxicity onset were distinguished in this study. At least 6 other retrospective studies involving small sample size or published in abstract form have widely different results in relating high vancomycin trough or aggressive vancomycin dosing strategies to nephrotoxicity.2934
The purpose of our study was to evaluate the association between development of nephrotoxicity and trough levels obtained during vancomycin therapy at a large veterans' hospital, while accounting for other potential nephrotoxins, and to evaluate the temporal association between elevated vancomycin troughs and nephrotoxicity. We chose to focus on nephrotoxicity that occurred on, or after, 5 days of vancomycin therapy in order to reduce other confounding factors of nephrotoxicity, since short durations of vancomycin frequently represent use in surgical prophylaxis or empirical therapy for hemodynamically unstable patients at high risk for renal injury.
Patients and Methods
Inclusion and Exclusion Criteria
We performed a retrospective cohort study of patients at the Veterans Affairs (VA) Greater Los Angeles Healthcare System during 2 time periods (May 1, 2005‐April 30, 2006 and Jan 1, 2007‐Dec 31, 2007) when hospital guidelines recommended different vancomycin dosing regimens based on indication. During the first time period, the recommended target trough level was 10 mg/L, regardless of indication. In May 2006, target troughs were changed according to the following institutional guidelines: 8‐12 mg/L for cellulitis, urinary tract infection (UTI), and uncomplicated bacteremia; 10‐15 mg/L for endocarditis, osteomyelitis, and visceral abscesses; and 15‐20 mg/L for bacterial meningitis and pneumonia. The vancomycin manufacturers (American Pharmaceutical Partners (Schaumburg, IL) and Baxter (Deerfield, IL)) were the same during both time periods. Patient data was collected from the VA Computerized Patient Records System (CPRS) by 2 trained reviewers (K.K.P. and T.P.). All inpatients who received 5 days of intravenous vancomycin therapy during these time periods were identified via electronic pharmacy records. We then excluded all patients with serum creatinine >2.0 mg/L prior to starting vancomycin, no serum creatinine collected before or during receipt of vancomycin, no trough levels drawn while on vancomycin (or for patients experiencing nephrotoxicity, no trough levels drawn prior to nephrotoxicity onset), nephrotoxicity occurring before day 5 of vancomycin therapy, and receipt of concomitant amphotericin B.
Data Collection and Study Definitions
In patients who received multiple courses of vancomycin during the specified time period, only the first course starting on, or after, May 1, 2005 and lasting 5 days was analyzed. Data collected for each patient included age, sex, race, and comorbidities (diabetes mellitus, liver dysfunction, and active malignancy). Diabetes mellitus was defined as 2 fasting blood glucose levels >125, or receipt of insulin or other hypoglycemic medications during vancomycin treatment. Patients were considered to have liver disease if they had a prior diagnosis of cirrhosis, hepatic encephalopathy, or hepatic insufficiency, or if 2 of the following criteria were met: total bilirubin >2 mg/L, aspartate aminotransferase (AST) or alanine aminotransferase (ALT) >2 the upper limit of normal, or serum albumin <3 g/dL. Receipt of 1 dose of potentially nephrotoxic agents, including aminoglycosides, intravenous furosemide, intravenous trimethoprim‐sulfamethoxazole, intravenous contrast dye, potentially nephrotoxic chemotherapy, and vasopressors, were recorded beginning 72 hours prior to vancomycin therapy until onset of nephrotoxicity, or, if nephrotoxicity did not occur, the final vancomycin dose. Angiotensin‐converting enzyme inhibitors (ACE‐I) and non‐steroidal anti‐inflammatory drugs (NSAIDs) or aspirin were considered potentially nephrotoxic if they were newly started within 72 hours of vancomycin.
For each patient, the serum creatinine was recorded upon admission, within 24 hours of starting vancomycin, during vancomycin treatment, and at 24 hours and 72 hours following the final vancomycin dose. Serum creatinine was typically measured daily. Per institutional protocol, vancomycin trough levels were drawn 30‐60 minutes prior to the fourth dose, and again in 5‐7 days or with any large change in renal function. Extrapolated troughs were calculated by a pharmacist if levels were drawn outside of the 60‐minute time period. The highest trough and duration of therapy was documented for each patient. The mean trough was equal to the arithmetic mean of all troughs obtained during vancomycin administration until 72 hours following the final dose.
Outcome Analysis
The primary end point was the development of nephrotoxicity, which was defined as an increase in serum creatinine by either 0.5 mg/dL or 50% for at least 2 consecutive days after receipt of vancomycin, up to 72 hours after the final dose, compared to the last creatinine measured prior to vancomycin initiation. Patients who had a documented isolated increase in serum creatinine that resolved upon recheck within 24 hours were not classified as experiencing nephrotoxicity. In patients who developed nephrotoxicity, mean troughs, maximum troughs, duration of vancomycin treatment, and receipt of concomitant nephrotoxins were ascertained using data collected only before nephrotoxicity onset. Bivariate and multivariate models were subsequently constructed in order to determine risk factors for nephrotoxicity, using either mean or maximum trough achieved prior to nephrotoxicity for each patient.
Statistical Methods
Comparisons between the 2005‐2006 and 2007 groups were made using Student t test for continuous variables, Wilcoxon rank‐sum test for ordinal variables, and Fisher's exact test for nominal variables. Association of clinical variables with nephrotoxicity was assessed using bivariate logistic regression with subsequent multivariable logistic regression. We initially decided to use maximum vancomycin trough 15 mg/L as the vancomycin exposure variable of interest to include in multivariable models, as we felt that (1) trough 15 mg/L is clinically relevant given current guidelines that recommend aiming for trough 15 mg/L for treatment of most invasive staphylococcal disease,31 and (2) prior studies identified a single trough 15 mg/L as a possible risk factor for nephrotoxicity.9, 27, 29, 31 However, we also generated other multivariable models that included either maximum vancomycin trough 20 mg/L, mean vancomycin trough 15 mg/L, or mean vancomycin trough 20 mg/L, and models in which maximum and mean vancomycin troughs were treated as continuous variables. All variables were initially included in multivariable models; nonsignificant variables were removed from the models in a backwards stepwise fashion until likelihood ratio testing determined that removal of any variable was associated with likelihood ratio test P value <0.20 in comparing the full to reduced model. All calculated P values are two‐sided. All calculations were performed with STATA, version 10 (StataCorp, College Station, TX). This study was approved via expedited review by the Institutional Review Board of the VA Greater Los Angeles Healthcare System.
Results
Comparison of 2005‐2006 Versus 2007 Cohorts
Of the 705 patients who were identified by pharmacy records to have received intravenous vancomycin, 348 patients remained after exclusion criteria were applied; the vast majority of patients were excluded because they received <5 days of vancomycin therapy. Of the 348 patients included in the study, 201 received vancomycin in 2005‐2006, and 147 received vancomycin in 2007 (Table 1). Mean vancomycin trough was significantly higher in 2007 than 2005‐2006 (average mean trough 13.2 mg/L 4.3 vs 9.7 mg/L 3.6; P < 0.0001), although median (8 vs 9 days) and mean (11.2 vs 12.2 days) duration of therapy was 1 day shorter in 2007 versus 2005‐2006. Age, sex, race, comorbidities, and indication for vancomycin use were similar between the 2 groups. The receipt of concomitant nephrotoxins was largely similar between the 2 time periods, with the primary exception being that a higher proportion of patients received intravenous contrast dye in 2007 (19%) than in 2005‐2006 (8.0%) (P = 0.003), and a lower proportion of patients received amikacin in 2007 (7.5%) than in 2005‐2006 (15%) (P = 0.043), though overall receipt of aminoglycosides was similar. Overall, nephrotoxicity was noted in 31 patients (8.9%), with similar incidence in 2005‐2006 (8.0%) and 2007 (10.2%) (P = 0.57). The median time to onset of nephrotoxicity was 7 days, with a median peak serum creatinine of 1.8 mg/dL.
| 2005‐2006 (n = 201) | 2007 (n = 147) | P Value* | Combined (n = 348) | |
|---|---|---|---|---|
| ||||
| Patient characteristics | ||||
| Age (median years) | 59 | 61 | 0.18 | 60 |
| Male gender (no. of patients) | 198 (99%) | 141 (96%) | 0.18 | 339 (97.4%) |
| Race (no. of patients): | ||||
| White | 128 (63.7%) | 95 (64.6%) | 0.91 | 223 (64.1%) |
| Black | 57 (28.4%) | 40 (27.2%) | 0.90 | 97 (27.9%) |
| Other race | 16 (8%) | 12 (8.2%) | 1.00 | 28 (8%) |
| Comorbidities (no. of patients): | ||||
| Diabetes | 75 (37.3%) | 50 (34%) | 0.57 | 125 (35.9%) |
| Liver disease | 29 (14.4%) | 14 (9.5%) | 0.19 | 43 (12.4%) |
| Malignancy | 33 (16.4%) | 21 (14.3%) | 0.65 | 54 (15.5%) |
| Concomitant nephrotoxins (no. of patients): | ||||
| Aminoglycosides (any): | 41 (20.4%) | 25 (17.0%) | 0.49 | 66 (19.0%) |
| Gentamicin | 11 (5.5%) | 14 (9.5%) | 0.21 | 25 (7.2%) |
| Amikacin | 30 (14.9%) | 11 (7.5%) | 0.043 | 41 (11.8%) |
| IV Furosemide | 53 (26.4%) | 34 (23.1%) | 0.53 | 87 (25.0%) |
| ACE‐inhibitor (newly started) | 20 (10%) | 10 (6.8%) | 0.34 | 30 (8.6%) |
| NSAID (newly started) | 26 (12.9%) | 11 (7.5%) | 0.12 | 37 (10.6%) |
| IV Trimethoprim‐sulfamethoxazole | 3 (1.5%) | 2 (1.4%) | 1.00 | 5 (1.4%) |
| Contrast dye | 16 (8%) | 28 (19.0%) | 0.003 | 44 (12.6%) |
| Chemotherapy | 3 (1.5%) | 4 (2.7%) | 0.42 | 7 (2%) |
| Vasopressors (any): | 13 (6.5%) | 7 (4.8%) | 0.64 | 20 (5.7%) |
| Dopamine | 4 (2%) | 1 (0.7%) | 0.40 | 5 (1.4%) |
| Epinephrine | 5 (2.5%) | 1 (0.7%) | 0.41 | 6 (1.7%) |
| Norepinephrine | 9 (4.5%) | 5 (3.4%) | 0.78 | 14 (4.0%) |
| Phenylephrine | 2 (1.0%) | 1 (0.7%) | 1.00 | 3 (0.9%) |
| Vasopressin | 0 (0%) | 1 (0.7%) | 0.42 | 1 (0.3%) |
| Indication for vancomycin: | ||||
| Skin/soft tissue/bone infection | 112 (55.7%) | 77 (52.4%) | 0.59 | 189 (54.3%) |
| Pneumonia | 26 (12.9%) | 26 (17.7%) | 0.23 | 52 (14.9%) |
| Bacteremia | 26 (12.9%) | 14 (9.5%) | 0.40 | 40 (11.5%) |
| Other | 37 (18.4%) | 30 (20.4%) | 0.68 | 67 (19.3%) |
| Clinical outcomes | ||||
| Nephrotoxicity (no. of patients) | 16 (8%) | 15 (10.2%) | 0.57 | 31 (8.9%) |
| Mean admission creatinine (mg/L) | 1.10 | 1.16 | 0.25 | 1.13 |
| Mean vancomycin trough (mg/L) | 9.71 | 13.2 | <0.0001 | 11.2 |
| Mean highest vancomycin trough (mg/L) | 11.8 | 15.7 | <0.0001 | 13.5 |
| Vancomycin duration (median days) | 9 | 8 | 0.014 | 8 |
Determination of Clinical Factors for Nephrotoxicity
Results of bivariate and multivariate analysis of clinical factors potentially associated with nephrotoxicity are displayed in Table 2. Among the 31 patients experiencing nephrotoxicity, the mean maximum vancomycin trough prior to nephrotoxicity onset was 14.9 mg/L, compared to 13.3 mg/L among those not experiencing nephrotoxicity (OR 1.03 for each 1 mg/L increment in mean trough, 95% confidence interval [CI] 0.98‐1.09; P = 0.21). While there was a trend toward patients with nephrotoxicity having a maximum trough 15 mg/L, it was not significant in either bivariate (OR 2.18, 95% CI 0.85‐5.63; P = 0.11) or multivariate (OR 2.05, 95% CI 0.91‐4.61; P = 0.082) analysis. The duration of vancomycin therapy was also not significantly associated with nephrotoxicity, both when evaluated as a continuous variable and when prolonged courses (14 days) were compared to short courses (between 5 and 14 days) of therapy. Other multivariable models were constructed that included maximum trough 20 mg/L, mean trough 15 mg/L, mean trough 20 mg/L, and maximum and mean trough as continuous variables; in all of these models, the vancomycin exposure variable of interest was not significant enough to remain in the final model after backwards elimination. The only factor significantly associated with nephrotoxicity in either bivariate or multivariate analysis was receipt of intravenous contrast dye (OR 3.64, 95% CI 1.52‐8.68; P = 0.004 in multivariate analysis).
| Clinical Factor | NT (n = 31) | No NT (n = 317) | Bivariate Analysis | Multivariate Analysis | ||
|---|---|---|---|---|---|---|
| Odds Ratio | P Value | Odds Ratio | P Value | |||
| ||||||
| Patient demographics | ||||||
| Age (median) | 64 yr | 60 yr | 1.01 | 0.48 | ||
| Male sex | 31 | 308 | N/A | 1.00 | ||
| Race: | ||||||
| White | 17 | 206 | 1.0 (reference) | |||
| Black | 10 | 87 | 1.39 | 0.43 | ||
| Other | 4 | 24 | 2.02 | 0.24 | ||
| Vancomycin characteristics | ||||||
| Mean trough (mg/L), mean per group: | 12.1 | 11.1 | 1.05* | 0.19 | ||
| Patients with mean trough <10 mg/L | 9 | 140 | 1.0 (reference) | |||
| Patients with mean trough 10‐15 mg/L | 15 | 130 | 1.79 | 0.18 | ||
| Patients with mean trough 15 mg/L | 7 | 47 | 2.32 | 0.11 | ||
| Highest trough (mg/L), mean per group | 14.9 | 13.3 | 1.03* | 0.21 | ||
| Patients with highest trough <10 mg/L | 7 | 107 | 1.0 (reference) | |||
| Patients with highest trough 10‐15 mg/L | 10 | 112 | 1.36 | 0.54 | ||
| Patients with highest trough 15 mg/L | 14 | 98 | 2.18 | 0.11 | 2.05 | 0.082 |
| Days of vancomycin therapy (median) | 7 | 8 | 0.97 | 0.40 | 0.96 | 0.17 |
| 14 days of vancomycin therapy | 7 | 71 | 1.01 | 0.98 | ||
| Clinical characteristics | ||||||
| SCr >1 mg/L prior to vancomycin | 11 | 136 | 0.73 | 0.43 | ||
| Diabetes | 10 | 115 | 0.84 | 0.66 | ||
| Liver disease | 3 | 40 | 0.74 | 0.64 | ||
| Malignancy | 5 | 49 | 1.05 | 0.92 | ||
| Concomitant nephrotoxins (any): | 21 | 174 | 1.73 | 0.17 | ||
| Aminoglycosides (any): | 7 | 59 | 1.28 | 0.59 | ||
| Amikacin | 3 | 38 | 0.79 | 0.70 | ||
| Gentamicin | 4 | 21 | 2.09 | 0.21 | ||
| Furosemide (intravenous) | 10 | 77 | 1.48 | 0.33 | ||
| ACE‐inhibitor (newly started) | 1 | 29 | 0.33 | 0.29 | 0.31 | 0.27 |
| NSAIDs (newly started) | 2 | 35 | 0.56 | 0.44 | ||
| TMP‐SMX (intravenous) | 2 | 3 | 7.22 | 0.034 | ||
| Contrast dye (intravenous) | 10 | 34 | 3.96 | 0.001 | 4.01 | 0.001 |
| Chemotherapy | 1 | 6 | 1.73 | 0.62 | ||
| Vasopressors (any): | 1 | 19 | 0.52 | 0.53 | ||
| Dopamine | 0 | 5 | 0 | 1.0 | ||
| Epinephrine | 0 | 6 | 0 | 1.0 | ||
| Norepinephrine | 1 | 13 | 0.78 | 0.81 | ||
| Phenylephrine | 0 | 3 | 0 | 1.0 | ||
| Vasopressin | 0 | 1 | 0 | 1.0 | ||
Reversibility of Nephrotoxicity
Of the 31 patients with nephrotoxicity, 20 (64.5%) patients still met criteria for nephrotoxicity at the time of vancomycin discontinuation. Nephrotoxicity subsequently resolved in 10 of the 16 patients that were still nephrotoxic at the time of vancomycin discontinuation (4 patients did not have follow‐up creatinine checked within 72 hours of vancomycin discontinuation). Thus, overall reversibility of nephrotoxicity either prior to, or within, 72 hours of vancomycin discontinuation was 77.8% (21/27 patients). Of the 6 patients who remained persistently nephrotoxic at 72 hours, all had received concomitant nephrotoxins prior to the onset of nephrotoxicity, as compared to 15/21 (71.4%) patients whose nephrotoxicity resolved (P = 0.28 by Fisher's exact test). Only 1 persistently nephrotoxic patient required dialysis: a critically ill patient with multiorgan failure for whom care was withdrawn within 4 days of vancomycin discontinuation.
DISCUSSION
Over the past 5 years, many institutions have adopted higher dosing guidelines for vancomycin, based on pharmacokinetic concerns related to its performance in the treatment of invasive staphylococcal disease. The data on nephrotoxicity at these higher troughs are limited. Previous studies that address the relationship between higher vancomycin troughs and nephrotoxicity suffer from small sample size29, 33; do not address reversibility of nephrotoxicity9, 26, 2931, 33; may not account for the temporal relationship between the development of nephrotoxicity and high trough levels,9, 2831 or examine patient populations at relatively high27 or low30 risk for renal injury apart from receipt of vancomycin. A recent expert consensus statement identified these factors as limiting the strength of evidence for a direct causal relationship between elevated vancomycin troughs and nephrotoxicity.14 A recent review by Hazlewood et al. concluded that the incidence of nephrotoxicity remains low in patients without preexisting renal disease and those not receiving concomitant nephrotoxins.35 The aim of our study was to identify whether or not there was a correlation between high‐dose vancomycin and nephrotoxicity, while accounting for their temporal relationship, concomitant nephrotoxin use, and reversibility. In particular, we chose to focus on nephrotoxicity occurring after at least 5 days of vancomycin therapy in order to reduce confounding by other possible sources of renal injury that may have affected the decision to initially prescribe vancomycin, an approach advocated by a recent review.36 While we noted that mean and maximum vancomycin troughs were significantly higher in 2007 than 2005‐2006, incidence of nephrotoxicity was stable between the 2 time periods, with the higher rate of intravenous contrast dye in 2007 balanced in part by less aminoglycoside use. Overall, higher trough levels were not necessarily accompanied by a significant increase in nephrotoxicity, though there was a nonsignificant trend toward more nephrotoxic patients having maximum trough 15 mg/L.
The only clinical factor that was significantly associated with nephrotoxicity in multivariate analysis was receipt of intravenous contrast dye. Of the 44 patients who received intravenous contrast dye, 10 (22.7%) experienced nephrotoxicity. Interestingly, in animal studies, both intravenous contrast dye37, 38 and high‐dose vancomycin15, 16 have been demonstrated to promote free radical formation within renal tissue, which is hypothesized to cause tubular damage primarily through vascular endothelial dysfunction, vasoconstriction, and subsequent reperfusion injury. N‐acetylcysteine is frequently administered to patients about to receive intravenous contrast dye (although its benefit remains controversial37, 39); N‐acetylcysteine has also been shown in an animal model to attenuate vancomycin‐induced renal injury.40
Receipt of concomitant aminoglycosides was not significantly associated with nephrotoxicity, in contrast with previous studies. One meta‐analysis of 8 studies revealed found that the incidence of nephrotoxicity associated with combination vancomycin and aminoglycosides was 13.3% greater than with vancomycin alone (P < 0.01) and 4.3% greater than therapy with an aminoglycoside alone (P < 0.05)20; another analysis of safety data of the clinical trial comparing daptomycin to comparator therapy including initial low‐dose gentamicin therapy in the treatment of S. aureus bacteremia found renal adverse events in 10 of 53 (19%) patients receiving vancomycin and gentamicin, compared to 8 of 120 (7%) patients receiving daptomycin.41 While our findings that show no clear relationship between concomitant vancomycin and aminoglycoside use and nephrotoxicity may have been due to the relatively small number of patients in our study who received aminoglycosides, it is worth noting that more patients in our study received aminoglycosides than intravenous contrast dye (66 vs 44 patients). The 77.8% overall resolution of nephrotoxicity observed in our study is similar to that reported by Farber and Moellering in 198319 and to that reported more recently with high‐dose vancomycin by Jeffres et al. and Teng et al.27, 34
Although we attempted to account for as many confounders as possible, the retrospective nature of our study prevents us from making definitive statements regarding the role of vancomycin trough levels and nephrotoxicity. In particular, we are unable to comment on any potential role vancomycin may have on nephrotoxicity within 5 days of its start or on patients with a baseline serum creatinine >2. Other significant limitations include our small proportion of female patients, and that we were not able to calculate severity of illness or determine the presence of congestive heart failure. Also, we may be dosing vancomycin less aggressively than other centers, and thus may have reduced power in determining whether higher troughs, particularly those 20 mg/L, are associated with nephrotoxicity; identification of more patients with higher troughs and a larger overall sample size may have yielded different results. Even in the 2007 group, a significant number of patients with cellulitis, UTI, and uncomplicated bacteremia had target troughs of 8‐12 mg/L. However, taken together, our findings do not support a definite relationship between vancomycin troughs and development of nephrotoxicity, and that when it does occur, it is largely reversible. Further prospective research is needed to evaluate the effects of aggressive vancomycin dosing regimens on nephrotoxicity, particularly those regimens that include large loading doses. Trials of antioxidative agents in patients receiving aggressive dosing regimens of vancomycin who require radiology studies involving intravenous contrast dye may be indicated as well.
- .Antimicrobial resistance: it's not just for hospitals.JAMA.2007;298:1803–1804.
- ,,, et al.Invasive methicillin‐resistant Staphylococcus aureus infections in the United States.JAMA.2007;298:1763–1771.
- ,,.Historical yearly usage of vancomycin.Antimicrob Agents Chemother.1998;42:1303–1304.
- ,,, et al.Dissemination in Japanese hospitals of strains of Staphylococcus aureus heterogeneously resistant to vancomycin.Lancet.1997;350:1670–1673.
- ,,,,,.Methicillin‐resistant Staphylococcus aureus clinical strain with reduced vancomycin susceptibility.J Antimicrob Chemother.1997;40:135–136.
- ,.Staphylococcus aureus with heterogeneous resistance to vancomycin: epidemiology, clinical significance, and critical assessment of diagnostic methods.Antimicrob Agents Chemother.2003;47:3040–3045.
- ,,.Vancomycin MIC creep in non‐vancomycin‐intermediate Staphylococcus aureus (VISA), vancomycin‐susceptible clinical methicillin‐resistant S. aureus (MRSA) blood isolates from 2001–05.J Antimicrob Chemother.2007;60:788–794.
- ,,,,.Clinical features associated with bacteremia due to heterogeneous vancomycin‐ intermediate Staphylococcus aureus.Clin Infect Dis.2004;38:448–451.
- ,,,,.High‐dose vancomycin therapy for methicillin‐resistant Staphylococcus aureus infections: efficacy and toxicity.Arch Intern Med.2006;166:2138–2144.
- ,,,,,.Accessory gene regulator group II polymorphism in methicillin‐resistant Staphylococcus aureus is predictive of failure of vancomycin therapy.Clin Infect Dis.2004;38:1700–1705.
- ,,,,,.Relationship of MIC and bactericidal activity to efficacy of vancomycin for treatment of methicillin‐resistant Staphylococcus aureus bacteremia.J Clin Microbiol.2004;42:2398–2402.
- ,.The rationale for revising the Clinical and Laboratory Standards Institute vancomycin minimal inhibitory concentration interpretive criteria for Staphylococcus aureus.Clin Infect Dis.2007;44:1208–1215.
- ,,,.Pharmacodynamics of vancomycin and other antimicrobials in patients with Staphylococcus aureus lower respiratory tract infections.Clin Pharmacokinet.2004;43:925–942.
- ,,, et al.Therapeutic monitoring of vancomycin in adult patients: a consensus review of the American Society of Health‐System Pharmacists, the Infectious Diseases Society of America, and the Society of Infectious Diseases Pharmacists.Am J Health Syst Pharm.2009;66:82–98.
- ,,, et al.Gene expression analysis reveals new possible mechanisms of vancomycin‐induced nephrotoxicity and identifies gene markers candidates.Toxicol Sci.2009;107:258–269.
- ,,, et al.In vivo evidences suggesting the role of oxidative stress in pathogenesis of vancomycin‐induced nephrotoxicity: protection by erdosteine.Toxicology.2005;215:227–233.
- ,,,.Relationship of serum antibiotic concentrations to nephrotoxicity in cancer patients receiving concurrent aminoglycoside and vancomycin therapy.Am J Med.1987;83:1091–1097.
- ,,,.Mild nephrotoxicity associated with vancomycin use.Arch Intern Med.1989;149:1777–1781.
- ,.Retrospective study of the toxicity of preparations of vancomycin from 1974 to 1981.Antimicrob Agents Chemother.1983;23:138–141.
- ,.Nephrotoxicity of vancomycin and aminoglycoside therapy separately and in combination.J Antimicrob Chemother.1993;32:325–334.
- ,,,.Vancomycin toxicity: a prospective study.J Antimicrob Chemother.1985;15:773–780.
- ,,,,.Risk of nephrotoxicity with combination vancomycin‐aminoglycoside antibiotic therapy.Pharmacotherapy.1990;10:378–382.
- ,,,.Nephrotoxicity of vancomycin, alone and with an aminoglycoside.J Antimicrob Chemother.1990;25:679–687.
- ,.A prospective study of adverse reactions associated with vancomycin therapy.J Antimicrob Chemother.1985;16:235–241.
- ,,,.Larger vancomycin doses (at least four grams per day) are associated with an increased incidence of nephrotoxicity.Antimicrob Agents Chemother.2008;52:1330–1336.
- ,,,,.Relationship between initial vancomycin concentration‐time profile and nephrotoxicity among hospitalized patients.Clin Infect Dis.2009;49:507–514.
- ,,,,.A retrospective analysis of possible renal toxicity associated with vancomycin in patients with health care‐associated methicillin‐resistant Staphylococcus aureus pneumonia.Clin Ther.2007;29:1107–1115.
- ,,,,,.Increasing vancomycin serum trough concentrations and incidence of nephrotoxicity.Am J Med.2010;123:1143–1149.
- ,,. Nephrotoxicity associated with aggressive vancomycin therapy [abstract L‐1298]. In:Program and Abstracts of the 46th Interscience Conference on Antimicrobial Agents and Chemotherapy, San Francisco, CA, 2006. Washington, DC: American Society for Microbiology.
- ,,,,. Incidence of vancomycin nephrotoxicity in the absence of concomitant nephrotoxins or confounders [abstract A1–1294b]. In:Program and Abstracts of the 49th Interscience Conference on Antimicrobial Agents and Chemotherapy, San Francisco, CA, 2009. Washington, DC: American Society for Microbiology.
- ,,, et al. Nephrotoxicity associated with high‐dose versus standard‐dose vancomycin therapy [abstract K‐1096]. In:Program and Abstracts of the 47th Interscience Conference on Antimicrobial Agents and Chemotherapy, Chicago, IL, 2007. Washington, DC: American Society for Microbiology.
- ,,. Evaluation of vancomycin nephrotoxicity in patients with methicillin‐resistant Staphylococcus aureus bacteremia [abstract A1–1294a]. In:Program and Abstracts of the 49th Interscience Conference on Antimicrobial Agents and Chemotherapy, San Francisco, CA, 2009. Washington, DC: American Society for Microbiology.
- ,,.Association of vancomycin serum concentrations with outcomes in patients with gram‐positive bacteremia.Pharmacotherapy.1995;15:85–91.
- ,,, et al. Continuation of high dose vancomycin despite nephrotoxicity [abstract K‐3486]. In:Abstracts of the 48th Interscience Conference on Antimicrobial Agents and Chemotherapy/46th Infectious Diseases Society of America Annual Meeting, Washington, DC, 2008. Washington, DC: American Society for Microbiology.
- ,,,.Vancomycin‐associated nephrotoxicity: grave concern or death by character assassination?Am J Med.2010;123:182–187.
- ,,,.Vancomycin‐associated nephrotoxicity: a critical appraisal of risk with high‐dose therapy.Int J Antimicrob Agents.2011;37:95–101.
- ,,,.Lights and shadows on the pathogenesis of contrast‐induced nephropathy: state of the art.Nephrol Dial Transplant.2005;20:1542–1550.
- ,,.Pathophysiology of contrast medium‐induced nephropathy.Kidney Int.2005;68:14–22.
- ,,, et al.N‐acetylcysteine for the prevention of radiocontrast induced nephropathy: a meta‐analysis of prospective controlled trials.J Am Soc Nephrol.2004;15:761–769.
- ,,,,.Protective effects of caffeic acid phenethyl ester, vitamin C, vitamin E and N‐acetylcysteine on vancomycin‐induced nephrotoxicity in rats.Basic Clin Pharmacol Toxicol.2007;100:328–333.
- ,,, et al.Initial low‐dose gentamicin for Staphylococcus aureus bacteremia and endocarditis is nephrotoxic.Clin Infect Dis.2009;48:713–721.
Copyright © 2011 Society of Hospital Medicine
Post‐Discharge Intervention
The inpatient to outpatient transition marks an abrupt paradigm shift from intensive, provider‐initiated care to self‐managed care, in which patients are primarily responsible for maintaining day‐to‐day health behaviors, following through with outpatient appointments, and negotiating medications, transport, and equipment needs. Studies indicate that medication nonadherence and medication‐related adverse events are common during the post‐discharge period, and may be related to the discontinuities associated with transitions of care.110
Given the complexity and uncertainty inherent in care transitions for patients with chronic illness, it is not surprising that poorly executed care transitions have been associated with increased risk of rehospitalizations and emergency department (ED) use.11 Patients with chronic illness are at particularly high risk for recurrent hospitalization.1114 System‐wide improvements in chronic illness care have been successful in triaging longitudinally followed, high‐risk outpatients to appropriate higher‐intensity care management interventions.1519 But the post‐discharge setting presents unique challenges for patients with chronic illness, especially those that are socioeconomically disadvantaged. External barriers, such as lack of transportation, lack of monitoring equipment, confusion about arranging follow‐up care, uncertainty about medication regimen changes, and financial constraints, represent important targets for improving care in the transition from inpatient to outpatient settings.
Transitional care has been defined as a set of actions designed to ensure the coordination and continuity of healthcare as members transfer between different locations or different levels of care.20 Most successful transitional care interventions have focused on geriatric populations or patients with congestive heart failure enrolled in health maintenance organizations, and have involved intensive nurse case management from the hospital setting through the post‐discharge period.2125 In these studies, trained nurse case managers provided critical support and patient education to improve patients' ability to self‐manage chronic illness.2629
In a resource‐poor Medicaid payment structure, the implementation of intensive care management across a broad population of patients may not be practical; alternative options for intervention dosing and implementation may be needed. Few studies have examined care needs and the impact of transitional care interventions in socioeconomically disadvantaged patients with chronic illness, though a recent study including such a population did find benefit from a pharmacist‐based intervention.30 The purpose of our study was to examine the impact of a low‐cost, post‐discharge needs assessment, as an adjunct to an existing care management program, on the risk of recurrent hospitalization in a clinically diverse cohort of chronically ill Medicaid managed care enrollees.
METHODS
Setting
CareOregon is an Oregon‐based, not‐for‐profit, Medicaid managed care organization that administers outpatient and inpatient health benefits for nearly 110,000 members, 5% of whom are dually eligible for Medicaid and Medicare benefits. The CareOregon network includes 950 primary‐care providers, 3000 specialists, 33 hospitals contracted statewide, and 14 public health departments. Approximately 85% of CareOregon's membership lives in the Portland metropolitan area. The remaining 15% are dispersed across mostly rural Oregon counties. CareOregon's membership is both culturally and medically diverse: 55% are female, 21% below age 5 (63% below age 20), and 43% self‐identify as persons of color. Hospitalized patients are generally cared for by inpatient‐based physicians, and an array of primary care and specialty providers based in safety‐net clinics, private practices, and university‐based clinics cares for patients out of the hospital setting. In 2004, CareOregon began CareSupport, a care management program designed to incorporate the principles of the Chronic Care Model31 in which a team‐structured approach is used to improve patient self‐management and coordination of care.
Patients
As part of the authorization and concurrent review activity of CareOregon's Utilization Management unit, hospitalized CareOregon members are identified and a discharge date is entered in the system. CareOregon programmers develop a daily hospital discharge report, which is reviewed each day by medical assistants. Between January and July 2007, this process was used to prospectively identify all CareOregon members over age 35 discharged from 1 of 10 area hospitals. Seven hospitals served as intervention sites, the other 3 as control sites. Patients discharged from intervention hospitals were called at home after discharge and screened for eligibility. Those with one or more chronic illnesses (congestive heart failure, ischemic heart disease, diabetes mellitus, arthritis, depression, chronic obstructive pulmonary disease, and asthma), who consented to participate, were included in the study. The presence of a chronic illness was determined by patient self‐report, and subsequently corroborated by inpatient and outpatient International Classification of Diseases, Ninth Revision (ICD‐9) codes in CareOregon's claims dataset. Patients with one or more of the following were excluded: 1) language other than English; 2) no telephone access; 3) direct, elective hospital admission; 4) admission for <24 hours; 5) primary residence in an extended care facility.
Patients discharged from control hospitals during the study period were included in the control group if they were over age 35, were hospitalized for more than 24 hours, and had one or more chronic illnesses (listed above) as determined by ICD‐9 codes. These patients were identified exclusively through the CareOregon claims database, which includes both inpatient and outpatient diagnostic coding and basic sociodemographic information.
Six of the 10 hospitals from which patients were discharged are large (>300 beds), located in an urban district, and have a robust hospital medicine service. Three of these large, urban hospitals were intervention sites (hospitals 1, 3, and 6), and 3 were control sites (hospitals 2, 4, and 5). All except one of these hospitals (hospital 1) has its own internal medicine residency program. Of the 4 remaining hospitals, all of which were intervention sites, 2 are small (<300 beds) and in an urban district (hospitals 7 and 9), and 2 are small and in rural districts (hospitals 8 and 10).
Intervention
Trained medical assistants conducted a scripted post‐discharge telephone‐based needs assessment and attended to simple interventions. Training included lectures on basic chronic condition management and several months in a peer‐to‐peer learning environment with more experienced medical assistants. Medical assistants were also paired with nurse care managers who provided ongoing training and clinical mentorship. The trained medical assistants called intervention patients within 2‐7 days of hospital discharge. If a patient was not available, a contact number was given and up to 2 additional attempts were made to reach the patient. Medical assistants administered a 35‐item needs assessment survey, which typically took 10‐15 minutes to complete (see Supporting Appendix A in the online version of this article). The survey is based on an existing theoretical framework of healthcare utilization which considers predisposing sociodemographic and healthcare belief variables, enabling resources, and illness level variables.32 Our survey (see Supporting Appendix A in the online version of this article) includes 4 related subdomains: 1) enabling resources (medical home, transportation, housing); 2) psychosocial comorbidities; 3) patient activation33; and 4) past utilization.
The needs assessment was designed to identify issues requiring near‐term resolution, such as the need for follow‐up care, pharmacy access, transportation needs, and medical equipment needs. These identified needs prompted appropriate, immediate, brief‐touch interventions by the medical assistants (eg, arrange transportation, schedule a follow‐up appointment, or provide access telephone numbers).
The needs assessment was also designed to identify members for referral to intensive care management (CareSupport), based on responses to questions about their medical home relationship, prior utilization, self‐management ability, and presence of competing needs. Medical assistants referred patients for intensive care management if they had high‐intensity needs in any one of these domains, or any need in two or more domains. For example, a patient with a history of frequent emergency room visits would be referred for more intensive care management. The CareSupport teama registered nurse specially trained in case management, a behavioral health specialist, and a medical assistantreviewed each referred case. For patients qualifying based on an anticipated ongoing need identified in one or more of the above domains, the CareSupport team constructed an individualized, multifaceted care plan based on disease‐specific guidelines and results of the needs assessment.
The study was approved by the institutional review board of the Oregon Health and Sciences University.
Comparator
Patients in the control cohort received usual care as recommended by discharging and outpatient providers. Patients in the control cohort were not given brief‐touch interventions or referred to CareSupport by study personnel. They could be referred to CareSupport by their outpatient providers.
Analysis
The primary outcome variable was recurrent hospitalization within 60 days to any hospital after index hospitalization discharge. The CareOregon dataset includes inpatient and outpatient claims at any site. Because there may be up to a 3‐month delay in posting claims, we examined the claims dataset 6 months from index hospital discharge for all patients. Sociodemographic, chronic illness comorbidity, and prior utilization data were collected from the CareOregon claims dataset. We used the adjusted clinical group (ACG) score for case‐mix adjustment. The ACG predictive model is an automated risk assessment tool that uses ambulatory diagnoses to identify patients at risk for high inpatient and outpatient utilization in the following year.34, 35 ACG scores range from 0 to 1, with a score of 0.5 corresponding to a 50% chance of high utilization (ie, of being in the top 3% of utilizers) over the following year.
Data for all patients enrolled in the CareSupport care management program are entered and tracked through a separate database, which we accessed to determine whether patients were enrolled in this program during the study period. Information about specific brief‐touch interventions performed was entered narratively by medical assistants.
Baseline characteristics of the 2 groups were compared using t tests or 2 tests, as appropriate. All patients were analyzed according to the group to which they were originally assigned, regardless of subsequent enrollment in CareSupport. We used bivariate analyses to identify covariates associated with the primary outcome. These and other clinically important variables were used to develop a generalized estimated equation model of the impact of the transitional care intervention on risk of rehospitalization within 60 days of discharge, accounting for clustering of patients within hospitals. We included age, hospitalization within the past year, and ACG score as covariates in the final model.
In secondary analyses, we sought to determine whether any association between our transitional care intervention and rehospitalization was mediated by greater use of primary care or care management services. To do this, we used the CareOregon claims dataset to determine primary care utilization for the year following hospital discharge, and we used the CareSupport database to determine whether patients were enrolled in care management. We then repeated our original multivariate model, adding primary care utilization as a covariate, and considered mediation to be present if the addition of primary care utilization substantively attenuated the association between intervention and rehospitalization. We then conducted the same mediation analysis using CareSupport enrollment as a covariate. All analyses were conducted using Stata/SE 9.0 (College Station, TX).
RESULTS
We enrolled 97 intervention and 130 control patients. Follow‐up utilization data were available for all patients. Table 1 compares sociodemographic, utilization, and comorbidity characteristics of the 2 groups, and Table 2 summarizes patient distribution and characteristics of the hospitals from which they were discharged. The control group was significantly older and more racially diverse than the intervention group. On the other hand, the intervention group had a higher burden of illness as suggested by higher ACG scores and a higher rate of hospitalization within the previous year. Most patients had been hospitalized at large, urban hospitals.
| Variable | Intervention (n = 97) | Control (n = 130) |
|---|---|---|
| ||
| Mean age (SE) | 56.3 (1.1) | 60.1 (1.2)* |
| Caucasian race, n (%) | 81 (83.5) | 70 (53.8)* |
| Female, n (%) | 56 (57.7) | 83 (63.8) |
| Mean ACG score (SE) | 0.49 (0.03) | 0.39 (0.03)* |
| Mean hospitalizations in prior year (SE) | 1.97 (0.26) | 1.18 (0.13)* |
| No primary care visit in prior year, n (%) | 8 (8.2) | 19 (14.6) |
| Medicare + Medicaid, n (%) | 40 (41.2) | 47 (36.2) |
| Chronic illness, n (%) | ||
| Diabetes mellitus | 48 (49.5) | 67 (51.5) |
| Depression | 17 (17.7) | 23 (17.9) |
| Congestive heart failure | 29 (29.5) | 45 (34.6) |
| Chronic obstructive pulmonary disease or asthma | 51 (52.6) | 57 (43.8) |
| Hospital No., Intervention or Control | No. of Patients | Hospital Characteristics |
|---|---|---|
| ||
| 1, I | 13 | Large, urban |
| 2, C | 89 | Large, urban |
| 3, I | 26 | Large, urban |
| 4, C | 35 | Large, urban |
| 5, C | 6 | Large, urban |
| 6, I | 30 | Large, urban |
| 7, I | 4 | Small, urban |
| 8, I | 5 | Small, rural |
| 9, I | 7 | Small, urban |
| 10, I | 12 | Small, rural |
Patients in the intervention group had a slightly lower 60‐day rehospitalization rate compared to the control group, but this difference was not statistically significant in unadjusted analyses (Table 3; 23.7% vs 29.2%, P = 0.35). This difference became significant after controlling for ACG score, prior inpatient utilization, and age: adjusted odds ratio (OR) [95% confidence interval (CI)] 0.49 [0.24‐1.00].
| Intervention (n = 97) | Control (n = 130) | Adjusted OR (95% CI) | |
|---|---|---|---|
| |||
| Unadjusted | 23 (23.7%) | 38 (29.2%) | 0.75 (0.41‐1.37) |
| Adjusted, model 1* | 0.49 (0.24‐1.00) | ||
| Model 1 + primary care utilization | 0.49 (0.24‐1.00) | ||
| Model 1 + care management | 0.41 (0.19‐0.88) | ||
Nearly half the intervention patients received one or more brief‐touch interventions (48.5%), and the majority of patients (61.7%) receiving a brief‐touch intervention did not require referral to care management. Table 4 lists examples of brief‐touch interventions received by patients. More patients in the intervention group than in the control group were enrolled in the CareSupport care management program (40.2% vs 14.6%, P < 0.001), and about half (53.8%) of the intervention patients referred for care management did not receive a brief‐touch intervention. Patients enrolled in care management were slightly younger (mean age 56.7 vs 59.1 years, P = 0.16), but had a higher burden of illness (mean ACG score 0.53 vs 0.40, P = 0.006) than those not enrolled in care management.
| Type of Assistance* | n (%) |
|---|---|
| |
| Access information | 13 (13.4) |
| Clinic visit/PCP change | 13 (13.4) |
| Simple self‐management advice | 10 (10.3) |
| Health promotions packet | 6 (6.2) |
| Transportation | 4 (4.1) |
| Tobacco cessation guidance | 4 (4.1) |
| Prescription/pharmacy | 4 (4.1) |
| Flu vaccine promotion | 2 (2.1) |
| Housing/home support | 1 (1.0) |
| Any type of assistance | 47 (48.5) |
More patients in the intervention group compared to control patients had one or more primary care visits within the year after hospital discharge (86.6% vs 72.3%, P = 0.01), and within 60 days after hospital discharge (68.0% vs 58.5%, P = 0.14), though the latter difference did not reach statistical significance. Interestingly, in an exploratory analysis, we found that hospitalization was more likely to introduce discontinuities in longitudinal primary care in control patients than in intervention patients: among patients who had had 3 or more primary care visits in the year prior to hospitalization, control patients were more likely than intervention patients to have 2 or fewer primary care visits during the year following hospitalization (33.8% vs 20.6%, P = 0.03).
Our mediation analyses suggested that neither post‐hospitalization primary care utilization within 60 days nor care management services accounted for the lower rate of recurrent hospitalization in the intervention group (Table 3). The addition of post‐hospitalization primary care utilization to the original model did not change the primary effect estimate, while controlling for care management enrollment actually increased the effect size. Finally, there was no difference in readmission rates between those receiving and not receiving brief‐touch interventions (31.8 vs 25.7%, P = 0.92).
DISCUSSION
We found that a simple, telephone‐based, transitional care intervention may be associated with lower 60‐day rehospitalization rates in a cohort of Medicaid managed care patients. We observed a reduced rate of readmissions in the intervention, a difference that became significant after adjustment for important confounders. Implicit in the design of the intervention was a recognition that patients' transitional care needs may vary, from help negotiating the post‐discharge follow‐up care process to more substantial and complex care management support needs. Our study adds to the current body of literature by examining an understudied, socioeconomically disadvantaged population in a resource‐poor health system. Importantly, our study targeted the most intensive intervention to those with the highest anticipated needs based on a simple triage scheme. Such targeted approaches may be especially important in resource‐poor settings.
Although our study was too small to characterize in detail the relative importance of specific elements of our intervention responsible for lower short‐term rehospitalization rates, the study does highlight the diversity of transitional care needs. Patients received logistic support negotiating the health system, preventive health promotion, and patient empowerment through self‐management and information access training. Nearly half the patients received a documented simple telephone‐based intervention, and many of these patients did not require referral for intensive nurse care management. On the other hand, our needs assessment did identify over one‐third of recently discharged patients as having more complex chronic disease management needs requiring assessment for ongoing nurse care management.
We were not able to identify the specific aspects of the intervention responsible for the observed reduction in recurrent hospitalization. Our mediation analysis suggests that triaging patients to a nurse care management program was not responsible for the observed reduction in recurrent hospitalizations. In fact, the analysis suggests these patients may have been more likely to require hospitalization, though our study was too small to allow strong conclusions to be drawn from a subgroup analysis. Past studies have similarly suggested that patients enrolled in care management may simply have a higher burden of disease or may have the need for hospitalization recognized more frequently.36 Readmission rates were also similar between patients who did and did not receive a brief‐touch intervention, possibly suggesting that patients with a higher level of need were appropriately selected to receive assistance.
Although our intervention appeared to increase post‐discharge follow‐up in primary care, this also did not explain the observed reduction in 60‐day rehospitalization rates. Despite differences in post‐discharge outpatient utilization patterns, there were relatively few patients in either group that had no follow‐up, and the lack of effect may simply reflect inadequate power given our small sample size. On the other hand, the lack of association between outpatient utilization and 60‐day rehospitalization rates may reflect a true lack of association between primary care follow‐up and rehospitalization as seen in some studies, though a larger Medicare study did find an association.3638
Improvements in outpatient utilization patterns, as we saw in this study, may be a laudable intermediate outcome benefit despite the lack of association with 60‐day rehospitalization rates in our study. Short‐term rehospitalization rates represent only one outcome and do not capture the expected slow, iterative benefits from chronic illness risk reduction, which may accrue over time, with stable longitudinal primary care and associated outpatient chronic illness care systems' innovations.15, 31, 39, 40
Recent studies of transitional care interventions in publicly insured adults have produced mixed results. An evaluation of Medicare demonstration projects found largely negative results, but did find 2 successful programs in which the highest‐risk patients seemed to benefit most, a finding that supports the importance of assessing risk and appropriately dosing interventions.41 Another recent study in a socioeconomically disadvantaged population suggests the utility of an alternate transitional care approach centered on a pharmacy‐based intervention.30
Ours is essentially a test‐of‐concept study, with several important limitations, which should temper widespread application of these results and suggest the need for further study. The sample size of our study was limited, and this, coupled with a slightly lower‐than‐expected event rate, limits our ability to detect potentially important effects. Our study was not a randomized trial, and we cannot discount the possibility that our results reflect the effect of residual or unmeasured confounders, especially those factors such as patient volume and care quality related to the discharging hospitals themselves. We attempted to minimize the effects of such confounders by balancing the types of hospitals included in each group, and by accounting for clustering by hospital in our statistical analysis. Important differences in baseline characteristics between the 2 groups also raise the possibility of residual confounding despite multivariate adjustment. However, the intervention group generally carried a higher burden of illness which would, if anything, have biased results towards the null. The pragmatic study design necessitated an intervention that was defined broadly and left much to the discretion of the staff delivering the intervention, rather than adherence to a strictly defined protocol. We believe this approach allows evaluation of systems innovations within limited‐resource settings, but we acknowledge the challenges this presents in applying study results to other settings. Finally, only approximately 1 in 4 intervention patients were successfully contacted and completed the post‐discharge survey within 1 week. The relatively low rate of successful telephone contact underscores the difficulty of implementing transitional care interventions dependent on post‐discharge contact in a socioeconomically disadvantaged population with unstable telephone access. Because only successfully contacted patients were included in the intervention group, selection bias is a potential issue, though again, most baseline discrepancies between the 2 groups suggest that intervention patients were more complex.
Transitions of care in uninsured and publicly insured nonelderly adults should be studied in greater depth. Outpatient access to care deficiencies may be compounded in these groups, especially as states face widespread budget crises. Future studies should examine the effects of inpatient to outpatient linkages for such patients. Also, studies should assess the impact of transitional care interventions on self‐management, quality of care, and intermediate health outcomes in the outpatient setting after hospital discharge. Future research should taxonomize the range of transitional care needs by qualitatively evaluating subgroups of patients and delineating challenges faced by each group. For example, the post‐discharge needs of marginally housed patients may be unique and could inform the development of interventions specifically targeted to this group.
In summary, we found that a simple, brief‐touch intervention and needs assessment in the post‐discharge period may be associated with reduced recurrent hospitalization rates in a cohort of chronically ill Medicaid managed care patients with diverse post‐discharge care needs, though the exact mechanisms responsible for the observed improvements are unclear. Future studies should evaluate transitional care interventions targeted to needs in a larger group of chronically ill patients.
Acknowledgements
The authors thank Drs Jennifer Malcom and Lauren Robertson for their help in collecting the data for this project.
- ,,.The role of medication noncompliance and adverse drug reactions in hospitalizations of the elderly.Arch Intern Med.1990;150(4):841–845.
- ,,,,.Drug‐associated hospital admissions in older medical patients.J Am Geriatr Soc.1988;36(12):1092–1098.
- ,,.Medication adherence in elderly patients receiving home health services following hospital discharge.Ann Pharmacother.2001;35(5):539–545.
- ,,,.Corticosteroid use after hospital discharge among high‐risk adults with asthma.Am J Respir Crit Care Med.2004;170(12):1281–1285.
- ,,,.Outpatient adherence to beta‐blocker therapy after acute myocardial infarction.J Am Coll Cardiol.2002;40(9):1589–1595.
- ,,,,.The incidence and severity of adverse events affecting patients after discharge from the hospital [see comment].Ann Intern Med.2003;138(3):161–167.
- ,,,,,.Adverse events due to discontinuations in drug use and dose changes in patients transferred between acute and long‐term care facilities.Arch Intern Med.2004;164(5):545–550.
- ,,.The adverse effects of hospitalization on drug regimens.Arch Intern Med.1991;151(8):1562–1564.
- ,,,.Posthospital medication discrepancies: prevalence and contributing factors.Arch Intern Med.2005;165(16):1842–1847.
- ,,,.Medical errors related to discontinuity of care from an inpatient to an outpatient setting [see comment].J Gen Intern Med.2003;18(8):646–651.
- ,,,.Posthospital care transitions: patterns, complications, and risk identification.Health Serv Res.2004;39(5):1449–1465.
- ,.Diagnosing diabetes and preventing rehospitalizations: the urban diabetes study.Med Care.2006;44(3):292–296.
- ,,,,,.Predictors of rehospitalization and death after a severe exacerbation of COPD [see comment].Chest.2007;132(6):1748–1755.
- ,,,.Multiple hospitalizations for patients with diabetes.Diabetes Care.2003;26(5):1421–1426.
- ,,,,,.Interventions to improve the management of diabetes in primary care, outpatient, and community settings: a systematic review.Diabetes Care.2001;24(10):1821–1833.
- ,,,,,.Closing the Quality Gap: A Critical Analysis of Quality Improvement Strategies.Rockville, MD:Agency for Healthcare Research and Quality, US Department of Health and Human Services;2004.
- ,,,.Clinical service organisation for heart failure [systematic review].Cochrane Database Syst Rev.2005;2:CD002752.
- ,,,.Group based training for self‐management strategies in people with type 2 diabetes mellitus [systematic review].Cochrane Database Syst Rev.2005;2:CD003417.
- ,,,,,.Proactive case management of high‐risk patients with type 2 diabetes mellitus by a clinical pharmacist: a randomized controlled trial.Am J Manag Care.2005;11(4):253–260.
- ,;for the American Geriatrics Society Health Care Systems. Improving the quality of transitional care for persons with complex care needs.J Am Geriatr Soc.2003;51(4):556–557.
- ,,,,,.A multidisciplinary intervention to prevent the readmission of elderly patients with congestive heart failure.N Engl J Med.1995;333(18):1190–1195.
- ,,.Effects of a home‐based intervention among patients with congestive heart failure discharged from acute hospital care.Arch Intern Med.1998;158(10):1067–1072.
- ,,,.Prolonged beneficial effects of a home‐based intervention on unplanned readmissions and mortality among patients with congestive heart failure.Arch Intern Med.1999;159(3):257–261.
- ,,, et al.Comprehensive discharge planning and home follow‐up of hospitalized elders: a randomized clinical trial.JAMA.1999;281(7):613–620.
- ,,,,,.Preparing patients and caregivers to participate in care delivered across settings: the Care Transitions Intervention.J Am Geriatr Soc.2004;52(11):1817–1825.
- ,,.Self‐management interventions for chronic illness.Lancet.2004;364(9444):1523–1537.
- ,,.Effectiveness of self‐management training in type 2 diabetes: a systematic review of randomized controlled trials.Diabetes Care.2001;24(3):561–587.
- ,,,.Patient self‐management of chronic disease in primary care.JAMA.2002;288(19):2469–2475.
- ,,,,.Collaborative management of chronic illness.Ann Intern Med.1997;127(12):1097–1102.
- ,,,.A reengineered hospital discharge program to decrease rehospitalization: a randomized trial.Ann Intern Med.2009;150:178–187.
- ,,.Improving primary care for patients with chronic illness.JAMA.2002;288(14):1775–1779.
- ,.Societal and individual determinants of medical care utilization in the United States.Milbank Q.2005;83(4):1–28.
- ,,,.Development of the Patient Activation Measure (PAM): conceptualizing and measuring activation in patients and consumers.Health Serv Res.2004;39(4 pt 1):1005–1026.
- ,,.Adjusted clinical groups: predictive accuracy for Medicaid enrollees in three states.Health Care Financ Rev.2002;24(1):43–61.
- ,,,.Ambulatory care groups: a categorization of diagnoses for research and management.Health Serv Res.1991;26(1):53–74.
- ,,.Does increased access to primary care reduce hospital readmissions? Veterans Affairs Cooperative Study Group on Primary Care and Hospital Readmission.N Engl J Med.1996;334(22):1441–1447.
- ,,,.Randomized controlled trial of emergency department interventions to improve primary care follow‐up for patients with acute asthma.Chest.2006;129(2):257–265.
- ,,,.Relationship between early physician follow‐up and 30‐day readmission among Medicare beneficiaries hospitalized for heart failure.JAMA.2010;303(17):1716–1722.
- Effect of intensive blood‐glucose control with metformin on complications in overweight patients with type 2 diabetes (UKPDS 34).UK Prospective Diabetes Study (UKPDS) Group.Lancet.1998;352(9131):854–865.
- ,,,,,.Effect of improved glycemic control on health care costs and utilization.JAMA.2001;285(2):182–189.
- ,,,.Effects of care coordination on hospitalization, quality of care, and health care expenditures among Medicare beneficiaries: 15 randomized trials.JAMA.2009;301(6):603–618.
The inpatient to outpatient transition marks an abrupt paradigm shift from intensive, provider‐initiated care to self‐managed care, in which patients are primarily responsible for maintaining day‐to‐day health behaviors, following through with outpatient appointments, and negotiating medications, transport, and equipment needs. Studies indicate that medication nonadherence and medication‐related adverse events are common during the post‐discharge period, and may be related to the discontinuities associated with transitions of care.110
Given the complexity and uncertainty inherent in care transitions for patients with chronic illness, it is not surprising that poorly executed care transitions have been associated with increased risk of rehospitalizations and emergency department (ED) use.11 Patients with chronic illness are at particularly high risk for recurrent hospitalization.1114 System‐wide improvements in chronic illness care have been successful in triaging longitudinally followed, high‐risk outpatients to appropriate higher‐intensity care management interventions.1519 But the post‐discharge setting presents unique challenges for patients with chronic illness, especially those that are socioeconomically disadvantaged. External barriers, such as lack of transportation, lack of monitoring equipment, confusion about arranging follow‐up care, uncertainty about medication regimen changes, and financial constraints, represent important targets for improving care in the transition from inpatient to outpatient settings.
Transitional care has been defined as a set of actions designed to ensure the coordination and continuity of healthcare as members transfer between different locations or different levels of care.20 Most successful transitional care interventions have focused on geriatric populations or patients with congestive heart failure enrolled in health maintenance organizations, and have involved intensive nurse case management from the hospital setting through the post‐discharge period.2125 In these studies, trained nurse case managers provided critical support and patient education to improve patients' ability to self‐manage chronic illness.2629
In a resource‐poor Medicaid payment structure, the implementation of intensive care management across a broad population of patients may not be practical; alternative options for intervention dosing and implementation may be needed. Few studies have examined care needs and the impact of transitional care interventions in socioeconomically disadvantaged patients with chronic illness, though a recent study including such a population did find benefit from a pharmacist‐based intervention.30 The purpose of our study was to examine the impact of a low‐cost, post‐discharge needs assessment, as an adjunct to an existing care management program, on the risk of recurrent hospitalization in a clinically diverse cohort of chronically ill Medicaid managed care enrollees.
METHODS
Setting
CareOregon is an Oregon‐based, not‐for‐profit, Medicaid managed care organization that administers outpatient and inpatient health benefits for nearly 110,000 members, 5% of whom are dually eligible for Medicaid and Medicare benefits. The CareOregon network includes 950 primary‐care providers, 3000 specialists, 33 hospitals contracted statewide, and 14 public health departments. Approximately 85% of CareOregon's membership lives in the Portland metropolitan area. The remaining 15% are dispersed across mostly rural Oregon counties. CareOregon's membership is both culturally and medically diverse: 55% are female, 21% below age 5 (63% below age 20), and 43% self‐identify as persons of color. Hospitalized patients are generally cared for by inpatient‐based physicians, and an array of primary care and specialty providers based in safety‐net clinics, private practices, and university‐based clinics cares for patients out of the hospital setting. In 2004, CareOregon began CareSupport, a care management program designed to incorporate the principles of the Chronic Care Model31 in which a team‐structured approach is used to improve patient self‐management and coordination of care.
Patients
As part of the authorization and concurrent review activity of CareOregon's Utilization Management unit, hospitalized CareOregon members are identified and a discharge date is entered in the system. CareOregon programmers develop a daily hospital discharge report, which is reviewed each day by medical assistants. Between January and July 2007, this process was used to prospectively identify all CareOregon members over age 35 discharged from 1 of 10 area hospitals. Seven hospitals served as intervention sites, the other 3 as control sites. Patients discharged from intervention hospitals were called at home after discharge and screened for eligibility. Those with one or more chronic illnesses (congestive heart failure, ischemic heart disease, diabetes mellitus, arthritis, depression, chronic obstructive pulmonary disease, and asthma), who consented to participate, were included in the study. The presence of a chronic illness was determined by patient self‐report, and subsequently corroborated by inpatient and outpatient International Classification of Diseases, Ninth Revision (ICD‐9) codes in CareOregon's claims dataset. Patients with one or more of the following were excluded: 1) language other than English; 2) no telephone access; 3) direct, elective hospital admission; 4) admission for <24 hours; 5) primary residence in an extended care facility.
Patients discharged from control hospitals during the study period were included in the control group if they were over age 35, were hospitalized for more than 24 hours, and had one or more chronic illnesses (listed above) as determined by ICD‐9 codes. These patients were identified exclusively through the CareOregon claims database, which includes both inpatient and outpatient diagnostic coding and basic sociodemographic information.
Six of the 10 hospitals from which patients were discharged are large (>300 beds), located in an urban district, and have a robust hospital medicine service. Three of these large, urban hospitals were intervention sites (hospitals 1, 3, and 6), and 3 were control sites (hospitals 2, 4, and 5). All except one of these hospitals (hospital 1) has its own internal medicine residency program. Of the 4 remaining hospitals, all of which were intervention sites, 2 are small (<300 beds) and in an urban district (hospitals 7 and 9), and 2 are small and in rural districts (hospitals 8 and 10).
Intervention
Trained medical assistants conducted a scripted post‐discharge telephone‐based needs assessment and attended to simple interventions. Training included lectures on basic chronic condition management and several months in a peer‐to‐peer learning environment with more experienced medical assistants. Medical assistants were also paired with nurse care managers who provided ongoing training and clinical mentorship. The trained medical assistants called intervention patients within 2‐7 days of hospital discharge. If a patient was not available, a contact number was given and up to 2 additional attempts were made to reach the patient. Medical assistants administered a 35‐item needs assessment survey, which typically took 10‐15 minutes to complete (see Supporting Appendix A in the online version of this article). The survey is based on an existing theoretical framework of healthcare utilization which considers predisposing sociodemographic and healthcare belief variables, enabling resources, and illness level variables.32 Our survey (see Supporting Appendix A in the online version of this article) includes 4 related subdomains: 1) enabling resources (medical home, transportation, housing); 2) psychosocial comorbidities; 3) patient activation33; and 4) past utilization.
The needs assessment was designed to identify issues requiring near‐term resolution, such as the need for follow‐up care, pharmacy access, transportation needs, and medical equipment needs. These identified needs prompted appropriate, immediate, brief‐touch interventions by the medical assistants (eg, arrange transportation, schedule a follow‐up appointment, or provide access telephone numbers).
The needs assessment was also designed to identify members for referral to intensive care management (CareSupport), based on responses to questions about their medical home relationship, prior utilization, self‐management ability, and presence of competing needs. Medical assistants referred patients for intensive care management if they had high‐intensity needs in any one of these domains, or any need in two or more domains. For example, a patient with a history of frequent emergency room visits would be referred for more intensive care management. The CareSupport teama registered nurse specially trained in case management, a behavioral health specialist, and a medical assistantreviewed each referred case. For patients qualifying based on an anticipated ongoing need identified in one or more of the above domains, the CareSupport team constructed an individualized, multifaceted care plan based on disease‐specific guidelines and results of the needs assessment.
The study was approved by the institutional review board of the Oregon Health and Sciences University.
Comparator
Patients in the control cohort received usual care as recommended by discharging and outpatient providers. Patients in the control cohort were not given brief‐touch interventions or referred to CareSupport by study personnel. They could be referred to CareSupport by their outpatient providers.
Analysis
The primary outcome variable was recurrent hospitalization within 60 days to any hospital after index hospitalization discharge. The CareOregon dataset includes inpatient and outpatient claims at any site. Because there may be up to a 3‐month delay in posting claims, we examined the claims dataset 6 months from index hospital discharge for all patients. Sociodemographic, chronic illness comorbidity, and prior utilization data were collected from the CareOregon claims dataset. We used the adjusted clinical group (ACG) score for case‐mix adjustment. The ACG predictive model is an automated risk assessment tool that uses ambulatory diagnoses to identify patients at risk for high inpatient and outpatient utilization in the following year.34, 35 ACG scores range from 0 to 1, with a score of 0.5 corresponding to a 50% chance of high utilization (ie, of being in the top 3% of utilizers) over the following year.
Data for all patients enrolled in the CareSupport care management program are entered and tracked through a separate database, which we accessed to determine whether patients were enrolled in this program during the study period. Information about specific brief‐touch interventions performed was entered narratively by medical assistants.
Baseline characteristics of the 2 groups were compared using t tests or 2 tests, as appropriate. All patients were analyzed according to the group to which they were originally assigned, regardless of subsequent enrollment in CareSupport. We used bivariate analyses to identify covariates associated with the primary outcome. These and other clinically important variables were used to develop a generalized estimated equation model of the impact of the transitional care intervention on risk of rehospitalization within 60 days of discharge, accounting for clustering of patients within hospitals. We included age, hospitalization within the past year, and ACG score as covariates in the final model.
In secondary analyses, we sought to determine whether any association between our transitional care intervention and rehospitalization was mediated by greater use of primary care or care management services. To do this, we used the CareOregon claims dataset to determine primary care utilization for the year following hospital discharge, and we used the CareSupport database to determine whether patients were enrolled in care management. We then repeated our original multivariate model, adding primary care utilization as a covariate, and considered mediation to be present if the addition of primary care utilization substantively attenuated the association between intervention and rehospitalization. We then conducted the same mediation analysis using CareSupport enrollment as a covariate. All analyses were conducted using Stata/SE 9.0 (College Station, TX).
RESULTS
We enrolled 97 intervention and 130 control patients. Follow‐up utilization data were available for all patients. Table 1 compares sociodemographic, utilization, and comorbidity characteristics of the 2 groups, and Table 2 summarizes patient distribution and characteristics of the hospitals from which they were discharged. The control group was significantly older and more racially diverse than the intervention group. On the other hand, the intervention group had a higher burden of illness as suggested by higher ACG scores and a higher rate of hospitalization within the previous year. Most patients had been hospitalized at large, urban hospitals.
| Variable | Intervention (n = 97) | Control (n = 130) |
|---|---|---|
| ||
| Mean age (SE) | 56.3 (1.1) | 60.1 (1.2)* |
| Caucasian race, n (%) | 81 (83.5) | 70 (53.8)* |
| Female, n (%) | 56 (57.7) | 83 (63.8) |
| Mean ACG score (SE) | 0.49 (0.03) | 0.39 (0.03)* |
| Mean hospitalizations in prior year (SE) | 1.97 (0.26) | 1.18 (0.13)* |
| No primary care visit in prior year, n (%) | 8 (8.2) | 19 (14.6) |
| Medicare + Medicaid, n (%) | 40 (41.2) | 47 (36.2) |
| Chronic illness, n (%) | ||
| Diabetes mellitus | 48 (49.5) | 67 (51.5) |
| Depression | 17 (17.7) | 23 (17.9) |
| Congestive heart failure | 29 (29.5) | 45 (34.6) |
| Chronic obstructive pulmonary disease or asthma | 51 (52.6) | 57 (43.8) |
| Hospital No., Intervention or Control | No. of Patients | Hospital Characteristics |
|---|---|---|
| ||
| 1, I | 13 | Large, urban |
| 2, C | 89 | Large, urban |
| 3, I | 26 | Large, urban |
| 4, C | 35 | Large, urban |
| 5, C | 6 | Large, urban |
| 6, I | 30 | Large, urban |
| 7, I | 4 | Small, urban |
| 8, I | 5 | Small, rural |
| 9, I | 7 | Small, urban |
| 10, I | 12 | Small, rural |
Patients in the intervention group had a slightly lower 60‐day rehospitalization rate compared to the control group, but this difference was not statistically significant in unadjusted analyses (Table 3; 23.7% vs 29.2%, P = 0.35). This difference became significant after controlling for ACG score, prior inpatient utilization, and age: adjusted odds ratio (OR) [95% confidence interval (CI)] 0.49 [0.24‐1.00].
| Intervention (n = 97) | Control (n = 130) | Adjusted OR (95% CI) | |
|---|---|---|---|
| |||
| Unadjusted | 23 (23.7%) | 38 (29.2%) | 0.75 (0.41‐1.37) |
| Adjusted, model 1* | 0.49 (0.24‐1.00) | ||
| Model 1 + primary care utilization | 0.49 (0.24‐1.00) | ||
| Model 1 + care management | 0.41 (0.19‐0.88) | ||
Nearly half the intervention patients received one or more brief‐touch interventions (48.5%), and the majority of patients (61.7%) receiving a brief‐touch intervention did not require referral to care management. Table 4 lists examples of brief‐touch interventions received by patients. More patients in the intervention group than in the control group were enrolled in the CareSupport care management program (40.2% vs 14.6%, P < 0.001), and about half (53.8%) of the intervention patients referred for care management did not receive a brief‐touch intervention. Patients enrolled in care management were slightly younger (mean age 56.7 vs 59.1 years, P = 0.16), but had a higher burden of illness (mean ACG score 0.53 vs 0.40, P = 0.006) than those not enrolled in care management.
| Type of Assistance* | n (%) |
|---|---|
| |
| Access information | 13 (13.4) |
| Clinic visit/PCP change | 13 (13.4) |
| Simple self‐management advice | 10 (10.3) |
| Health promotions packet | 6 (6.2) |
| Transportation | 4 (4.1) |
| Tobacco cessation guidance | 4 (4.1) |
| Prescription/pharmacy | 4 (4.1) |
| Flu vaccine promotion | 2 (2.1) |
| Housing/home support | 1 (1.0) |
| Any type of assistance | 47 (48.5) |
More patients in the intervention group compared to control patients had one or more primary care visits within the year after hospital discharge (86.6% vs 72.3%, P = 0.01), and within 60 days after hospital discharge (68.0% vs 58.5%, P = 0.14), though the latter difference did not reach statistical significance. Interestingly, in an exploratory analysis, we found that hospitalization was more likely to introduce discontinuities in longitudinal primary care in control patients than in intervention patients: among patients who had had 3 or more primary care visits in the year prior to hospitalization, control patients were more likely than intervention patients to have 2 or fewer primary care visits during the year following hospitalization (33.8% vs 20.6%, P = 0.03).
Our mediation analyses suggested that neither post‐hospitalization primary care utilization within 60 days nor care management services accounted for the lower rate of recurrent hospitalization in the intervention group (Table 3). The addition of post‐hospitalization primary care utilization to the original model did not change the primary effect estimate, while controlling for care management enrollment actually increased the effect size. Finally, there was no difference in readmission rates between those receiving and not receiving brief‐touch interventions (31.8 vs 25.7%, P = 0.92).
DISCUSSION
We found that a simple, telephone‐based, transitional care intervention may be associated with lower 60‐day rehospitalization rates in a cohort of Medicaid managed care patients. We observed a reduced rate of readmissions in the intervention, a difference that became significant after adjustment for important confounders. Implicit in the design of the intervention was a recognition that patients' transitional care needs may vary, from help negotiating the post‐discharge follow‐up care process to more substantial and complex care management support needs. Our study adds to the current body of literature by examining an understudied, socioeconomically disadvantaged population in a resource‐poor health system. Importantly, our study targeted the most intensive intervention to those with the highest anticipated needs based on a simple triage scheme. Such targeted approaches may be especially important in resource‐poor settings.
Although our study was too small to characterize in detail the relative importance of specific elements of our intervention responsible for lower short‐term rehospitalization rates, the study does highlight the diversity of transitional care needs. Patients received logistic support negotiating the health system, preventive health promotion, and patient empowerment through self‐management and information access training. Nearly half the patients received a documented simple telephone‐based intervention, and many of these patients did not require referral for intensive nurse care management. On the other hand, our needs assessment did identify over one‐third of recently discharged patients as having more complex chronic disease management needs requiring assessment for ongoing nurse care management.
We were not able to identify the specific aspects of the intervention responsible for the observed reduction in recurrent hospitalization. Our mediation analysis suggests that triaging patients to a nurse care management program was not responsible for the observed reduction in recurrent hospitalizations. In fact, the analysis suggests these patients may have been more likely to require hospitalization, though our study was too small to allow strong conclusions to be drawn from a subgroup analysis. Past studies have similarly suggested that patients enrolled in care management may simply have a higher burden of disease or may have the need for hospitalization recognized more frequently.36 Readmission rates were also similar between patients who did and did not receive a brief‐touch intervention, possibly suggesting that patients with a higher level of need were appropriately selected to receive assistance.
Although our intervention appeared to increase post‐discharge follow‐up in primary care, this also did not explain the observed reduction in 60‐day rehospitalization rates. Despite differences in post‐discharge outpatient utilization patterns, there were relatively few patients in either group that had no follow‐up, and the lack of effect may simply reflect inadequate power given our small sample size. On the other hand, the lack of association between outpatient utilization and 60‐day rehospitalization rates may reflect a true lack of association between primary care follow‐up and rehospitalization as seen in some studies, though a larger Medicare study did find an association.3638
Improvements in outpatient utilization patterns, as we saw in this study, may be a laudable intermediate outcome benefit despite the lack of association with 60‐day rehospitalization rates in our study. Short‐term rehospitalization rates represent only one outcome and do not capture the expected slow, iterative benefits from chronic illness risk reduction, which may accrue over time, with stable longitudinal primary care and associated outpatient chronic illness care systems' innovations.15, 31, 39, 40
Recent studies of transitional care interventions in publicly insured adults have produced mixed results. An evaluation of Medicare demonstration projects found largely negative results, but did find 2 successful programs in which the highest‐risk patients seemed to benefit most, a finding that supports the importance of assessing risk and appropriately dosing interventions.41 Another recent study in a socioeconomically disadvantaged population suggests the utility of an alternate transitional care approach centered on a pharmacy‐based intervention.30
Ours is essentially a test‐of‐concept study, with several important limitations, which should temper widespread application of these results and suggest the need for further study. The sample size of our study was limited, and this, coupled with a slightly lower‐than‐expected event rate, limits our ability to detect potentially important effects. Our study was not a randomized trial, and we cannot discount the possibility that our results reflect the effect of residual or unmeasured confounders, especially those factors such as patient volume and care quality related to the discharging hospitals themselves. We attempted to minimize the effects of such confounders by balancing the types of hospitals included in each group, and by accounting for clustering by hospital in our statistical analysis. Important differences in baseline characteristics between the 2 groups also raise the possibility of residual confounding despite multivariate adjustment. However, the intervention group generally carried a higher burden of illness which would, if anything, have biased results towards the null. The pragmatic study design necessitated an intervention that was defined broadly and left much to the discretion of the staff delivering the intervention, rather than adherence to a strictly defined protocol. We believe this approach allows evaluation of systems innovations within limited‐resource settings, but we acknowledge the challenges this presents in applying study results to other settings. Finally, only approximately 1 in 4 intervention patients were successfully contacted and completed the post‐discharge survey within 1 week. The relatively low rate of successful telephone contact underscores the difficulty of implementing transitional care interventions dependent on post‐discharge contact in a socioeconomically disadvantaged population with unstable telephone access. Because only successfully contacted patients were included in the intervention group, selection bias is a potential issue, though again, most baseline discrepancies between the 2 groups suggest that intervention patients were more complex.
Transitions of care in uninsured and publicly insured nonelderly adults should be studied in greater depth. Outpatient access to care deficiencies may be compounded in these groups, especially as states face widespread budget crises. Future studies should examine the effects of inpatient to outpatient linkages for such patients. Also, studies should assess the impact of transitional care interventions on self‐management, quality of care, and intermediate health outcomes in the outpatient setting after hospital discharge. Future research should taxonomize the range of transitional care needs by qualitatively evaluating subgroups of patients and delineating challenges faced by each group. For example, the post‐discharge needs of marginally housed patients may be unique and could inform the development of interventions specifically targeted to this group.
In summary, we found that a simple, brief‐touch intervention and needs assessment in the post‐discharge period may be associated with reduced recurrent hospitalization rates in a cohort of chronically ill Medicaid managed care patients with diverse post‐discharge care needs, though the exact mechanisms responsible for the observed improvements are unclear. Future studies should evaluate transitional care interventions targeted to needs in a larger group of chronically ill patients.
Acknowledgements
The authors thank Drs Jennifer Malcom and Lauren Robertson for their help in collecting the data for this project.
- ,,.The role of medication noncompliance and adverse drug reactions in hospitalizations of the elderly.Arch Intern Med.1990;150(4):841–845.
- ,,,,.Drug‐associated hospital admissions in older medical patients.J Am Geriatr Soc.1988;36(12):1092–1098.
- ,,.Medication adherence in elderly patients receiving home health services following hospital discharge.Ann Pharmacother.2001;35(5):539–545.
- ,,,.Corticosteroid use after hospital discharge among high‐risk adults with asthma.Am J Respir Crit Care Med.2004;170(12):1281–1285.
- ,,,.Outpatient adherence to beta‐blocker therapy after acute myocardial infarction.J Am Coll Cardiol.2002;40(9):1589–1595.
- ,,,,.The incidence and severity of adverse events affecting patients after discharge from the hospital [see comment].Ann Intern Med.2003;138(3):161–167.
- ,,,,,.Adverse events due to discontinuations in drug use and dose changes in patients transferred between acute and long‐term care facilities.Arch Intern Med.2004;164(5):545–550.
- ,,.The adverse effects of hospitalization on drug regimens.Arch Intern Med.1991;151(8):1562–1564.
- ,,,.Posthospital medication discrepancies: prevalence and contributing factors.Arch Intern Med.2005;165(16):1842–1847.
- ,,,.Medical errors related to discontinuity of care from an inpatient to an outpatient setting [see comment].J Gen Intern Med.2003;18(8):646–651.
- ,,,.Posthospital care transitions: patterns, complications, and risk identification.Health Serv Res.2004;39(5):1449–1465.
- ,.Diagnosing diabetes and preventing rehospitalizations: the urban diabetes study.Med Care.2006;44(3):292–296.
- ,,,,,.Predictors of rehospitalization and death after a severe exacerbation of COPD [see comment].Chest.2007;132(6):1748–1755.
- ,,,.Multiple hospitalizations for patients with diabetes.Diabetes Care.2003;26(5):1421–1426.
- ,,,,,.Interventions to improve the management of diabetes in primary care, outpatient, and community settings: a systematic review.Diabetes Care.2001;24(10):1821–1833.
- ,,,,,.Closing the Quality Gap: A Critical Analysis of Quality Improvement Strategies.Rockville, MD:Agency for Healthcare Research and Quality, US Department of Health and Human Services;2004.
- ,,,.Clinical service organisation for heart failure [systematic review].Cochrane Database Syst Rev.2005;2:CD002752.
- ,,,.Group based training for self‐management strategies in people with type 2 diabetes mellitus [systematic review].Cochrane Database Syst Rev.2005;2:CD003417.
- ,,,,,.Proactive case management of high‐risk patients with type 2 diabetes mellitus by a clinical pharmacist: a randomized controlled trial.Am J Manag Care.2005;11(4):253–260.
- ,;for the American Geriatrics Society Health Care Systems. Improving the quality of transitional care for persons with complex care needs.J Am Geriatr Soc.2003;51(4):556–557.
- ,,,,,.A multidisciplinary intervention to prevent the readmission of elderly patients with congestive heart failure.N Engl J Med.1995;333(18):1190–1195.
- ,,.Effects of a home‐based intervention among patients with congestive heart failure discharged from acute hospital care.Arch Intern Med.1998;158(10):1067–1072.
- ,,,.Prolonged beneficial effects of a home‐based intervention on unplanned readmissions and mortality among patients with congestive heart failure.Arch Intern Med.1999;159(3):257–261.
- ,,, et al.Comprehensive discharge planning and home follow‐up of hospitalized elders: a randomized clinical trial.JAMA.1999;281(7):613–620.
- ,,,,,.Preparing patients and caregivers to participate in care delivered across settings: the Care Transitions Intervention.J Am Geriatr Soc.2004;52(11):1817–1825.
- ,,.Self‐management interventions for chronic illness.Lancet.2004;364(9444):1523–1537.
- ,,.Effectiveness of self‐management training in type 2 diabetes: a systematic review of randomized controlled trials.Diabetes Care.2001;24(3):561–587.
- ,,,.Patient self‐management of chronic disease in primary care.JAMA.2002;288(19):2469–2475.
- ,,,,.Collaborative management of chronic illness.Ann Intern Med.1997;127(12):1097–1102.
- ,,,.A reengineered hospital discharge program to decrease rehospitalization: a randomized trial.Ann Intern Med.2009;150:178–187.
- ,,.Improving primary care for patients with chronic illness.JAMA.2002;288(14):1775–1779.
- ,.Societal and individual determinants of medical care utilization in the United States.Milbank Q.2005;83(4):1–28.
- ,,,.Development of the Patient Activation Measure (PAM): conceptualizing and measuring activation in patients and consumers.Health Serv Res.2004;39(4 pt 1):1005–1026.
- ,,.Adjusted clinical groups: predictive accuracy for Medicaid enrollees in three states.Health Care Financ Rev.2002;24(1):43–61.
- ,,,.Ambulatory care groups: a categorization of diagnoses for research and management.Health Serv Res.1991;26(1):53–74.
- ,,.Does increased access to primary care reduce hospital readmissions? Veterans Affairs Cooperative Study Group on Primary Care and Hospital Readmission.N Engl J Med.1996;334(22):1441–1447.
- ,,,.Randomized controlled trial of emergency department interventions to improve primary care follow‐up for patients with acute asthma.Chest.2006;129(2):257–265.
- ,,,.Relationship between early physician follow‐up and 30‐day readmission among Medicare beneficiaries hospitalized for heart failure.JAMA.2010;303(17):1716–1722.
- Effect of intensive blood‐glucose control with metformin on complications in overweight patients with type 2 diabetes (UKPDS 34).UK Prospective Diabetes Study (UKPDS) Group.Lancet.1998;352(9131):854–865.
- ,,,,,.Effect of improved glycemic control on health care costs and utilization.JAMA.2001;285(2):182–189.
- ,,,.Effects of care coordination on hospitalization, quality of care, and health care expenditures among Medicare beneficiaries: 15 randomized trials.JAMA.2009;301(6):603–618.
Copyright © 2011 Society of Hospital Medicine
Hypoglycemia Post‐Hyperkalemia Treatment
Hyperkalemia is a common condition in hospitalized patients and can be fatal if left untreated.1 The incidence of hyperkalemia in hospitalized patients is 1‐10%.2 Hyperkalemia develops secondary to decreased renal excretion of potassium, increased potassium intake, or redistribution of potassium into the extracellular fluid. Patients with renal dysfunction, especially acute kidney injury (AKI) or end‐stage renal disease (ESRD), are especially predisposed to hyperkalemia. Drug therapy (particularly inhibitors of the renin‐angiotensin‐aldosterone system, calcineurin inhibitors, potassium sparing diuretics, and heparin) may also predispose patients to elevated potassium levels.2 High extracellular potassium adversely affects the resting membrane potential of the myocardial cell. This results in a slowing of ventricular conduction, and may precipitate ventricular fibrillation or asystole.3, 4 Due to this high risk of cardiac complications, the American Heart Association recommends treatment when potassium levels are 6.0 mEq/L.5
A threefold approach to the treatment of hyperkalemia is currently adopted by clinicians: (1) stabilizing the cardiac membranes using intravenous (IV) calcium; (2) redistribution of potassium using IV insulin and nebulized albuterol (in the setting of metabolic acidosis, IV sodium bicarbonate will also help to shift potassium into cells); and (3) elimination of potassium from the body via hemodialysis or Na‐K exchange resin binders.2
The use of insulin is incorporated into most acute hyperkalemia stabilization treatment regimens and, with or without concomitant dextrose, can predispose patients to develop hypoglycemia. Dosing recommendations for insulin and dextrose for hyperkalemia vary among clinical references but commonly include 10 units of regular insulin IV and 25‐50 gm of IV dextrose.6, 7 Hypoglycemia following insulin and dextrose administration has received limited documentation.810 Furthermore, several factors account for an increased frequency of hypoglycemia in patients with end‐stage renal disease, a group also predisposed to hyperkalemia.11 This study assesses the incidence of hypoglycemia in hospitalized patients after acute stabilization treatment of hyperkalemia with insulin.
METHODS
A retrospective search of the electronic records of a large university‐based tertiary care hospital was conducted from June 1, 2009 to December 1, 2009. Adult hospitalized patients met our study inclusion criteria if they received IV insulin as part of an acute hyperkalemia stabilization treatment regimen and their potassium level was 6 mmol/L or greater. A medical record search was performed by applying the following search criteria: 5‐10 units of intravenous insulin administered within 6 hours of a collected potassium level which was reported as 6 mmol/L or greater. Patients were excluded if they did not have a reported blood glucose level measured within 6 hours of insulin administration. Patient demographic data was collected including: patient's age, sex, weight, and presence of diabetes or renal dysfunction. AKI was defined as an acute rise in serum creatinine of >0.5 mg/dl within a 7‐day period during hospitalization. Hypoglycemia and severe hypoglycemia were defined as blood glucose levels of <70 mg/dl and <40 mg/dl, respectively, consistent with the current medical literature. Hypoglycemic patients were grouped into hypoglycemic and severely hypoglycemic subsets based on their blood glucose levels. Information on patients' hypoglycemic symptoms was recorded when documented in the medical record. All administered doses of insulin and dextrose were documented by reviewing the medication administration record for each patient. Blood glucose levels were obtained by both point‐of‐care finger stick bedside measurements and blood draws taken for laboratory analysis. The incidence of patients who became hypoglycemic following a hyperkalemic treatment was then assessed.
RESULTS
Our retrospective computer data search identified 250 hyperkalemic patients (with potassium levels 6 mmol/L) who received intravenous regular insulin within 6 hours of the potassium level measurement during the 6‐month study period. Thirty patients (12%) met study criteria but were excluded because they did not have a blood glucose level documented within 6 hours of insulin administration. One patient, who qualified for the study from the electronic data, was excluded because of an erroneous potassium level secondary to a hemolyzed blood sample. Nineteen (8.7%) of the remaining 219 study patients were identified as hypoglycemic (blood glucose <70 mg/dl). Five patients (2.3%) were classified as having severe hypoglycemia (blood glucose <40 mg/dl). The distribution of hypoglycemic events among the various insulin/dextrose regimens are shown in Table 1. Fifty‐eight percent and 40% of the blood glucose <70 mg/dl and <40 mg/dl events, respectively, occurred following the commonly employed 10 units of regular insulin by intravenous push (IVP) and 25 gm of dextrose 50% IVP treatment regimen.
| Insulin (units)/dextrose (grams) | 10/0 | 5/25 | 10/12.5 | 10/25 | 10/50 |
|---|---|---|---|---|---|
| <40 mg/dl cohort | 1/5 (20%) | 2/5 (40%) | 0 | 2/5 (40%) | 0 |
| 41‐69 mg/dl cohort | 0 | 0 | 4/14 (29%) | 9/14 (64%) | 1/14 (7%) |
| <70 mg/dl cohort (total) | 1/19 (5.5%) | 2/19 (10%) | 4/19 (21%) | 11/19 (58%) | 1/19 (5.5%) |
| Diabetic patients | 0 | 1 | 1 | 3 | 0 |
The average body weight of patients with a blood glucose <40 mg/dl was significantly less than those patients having blood sugars in the 41‐69 mg/dl range (55.8 kg vs 92.0 kg, P <0.05) or patients with blood sugars >70 mg/dl (55.8 kg vs 87.4 kg, P <0.05). Table 2 lists patient characteristics by blood glucose cohort, with the 200 patient >70 mg/dl group represented by a random subset of 70 patients.
| Patient Characteristics per Cohort | <40 mg/dl Cohort (5 Patients) | 41‐69 mg/dl Cohort (14 Patients) | >70 mg/dl Cohort (70 Patient Subset) |
|---|---|---|---|
| |||
| Age, yr | 49 | 56 | 57 |
| Male sex, no. (%) | 3 (60%) | 12 (86%) | 40 (57%) |
| Weight, kg | 55.8 | 92 | 87.4 |
| Weight <50 kg (%) | 60% | 7.5% | 6% |
| Weight 51‐70 kg (%) | 20% | 7.5% | 26% |
| Weight >70 kg (%) | 20% | 85% | 68% |
| Diabetic, no. (%) | 1 (20%) | 4 (28%) | 22 (31%) |
| AKI or ESRD, no. (%) | 4 (80%) | 11 (78%) | 46 (66%) |
| Average BG pretreatment | 148 mg/dl* | 120 mg/dl | 155 mg/dl |
| Potassium level | |||
| 6.0‐6.4 mmol/L, no. (%) | 4 (80%) | 8 (57%) | 47 (67%) |
| 6.5‐6.9 mmol/L, no. (%) | 0 | 1 (7%) | 13 (19%) |
| >7 mmol/L, no. (%) | 1 (20%) | 5 (36%) | 10 (14%) |
| Hospitalization in ICU | 60% | 36% | 23% |
| Mortality during admission | 40% | 7% | 13% |
The average pretreatment blood glucose level for this cohort of 19 patients was 127 mg/dl with a blood glucose range of 59‐298 mg/dl. One patient was identified as hypoglycemic prior to treatment. Five hypoglycemic patients were identified as diabetic. One of these patients had an A1C level >13%, and 3 patients had levels <7%. Distribution of the potassium levels within the cohort were as follows: 6.0‐6.4 mmol/L: 12 patients (67%); 6.5‐6.9 mmol/L: 1 patient (5%); and 7 mmol/L or greater: 6 patients (28%). Seven patients had stat electrocardiograms ordered at the time of their hyperkalemia, and 3 patients had repeat potassium levels which verified their hyperkalemia. Fifteen (79%) of the hypoglycemic patients had acute kidney injury or were end‐stage renal disease patients on hemodialysis at the time of treatment.
Hypoglycemia was demonstrated at a median time of 3 hours post‐insulin administration. Documentation of the patients' hypoglycemia symptoms and the treatment of the hypoglycemic events were very poor. Only 3 patients had documentation of their hypoglycemia in the notes section of the electronic chart. The documentation included common symptoms of hypoglycemia in 2 patients, and was limited to the type of hypoglycemic treatment in the third patient. Seven patients had dextrose IV documented in the medication administration record, and 1 patient was treated with cranberry juice. No documentation of treatment was found in the remaining 58% of patients.
Eight of the 19 hypoglycemic patients were treated in an intensive care unit while receiving treatment for hyperkalemia. Of the 5 patients with severe hypoglycemia, 3 were treated in an intensive care unit and 2 of these patients died the day following treatment. One of the deaths resulted from a cardiac arrest with pulseless electrical activity while the patient was on dialysis. One patient with severe hypoglycemia was transferred to the medical intensive care unit but was discharged to home 4 days later. One additional patient, with chronic myeloid leukemia and a blood glucose level between 40 and 70 mg/dl died on the day of his admission.
DISCUSSION
Studies often do not agree on whether hypoglycemia is a complication resulting from standard insulin/glucose treatments for hyperkalemia. A previous study by Kim12 evaluated a combination regimen of insulin/glucose with bicarbonate for the treatment of hyperkalemia in 8 end‐stage renal disease patients. In this study, a solution of 8.4% bicarbonate (120 cc of bicarbonate and 80 ml of normal saline) was infused at a rate of 2 mmol/min. In addition, patients simultaneously received 550 ml of 20% glucose containing 50 units of regular insulin infused at a rate of 5 mU/kg/min. The study reported that the potassium level was lowered from 6.2 to 5.2 mEq/L in 1 hour without any patients experiencing hypoglycemia. The ratio of insulin to glucose was approximately 11 units/25 gm. However, in a similar study by Allon and Copkney,9 asymptomatic hypoglycemia was reported in 75% of patients following the administration of 10 units of regular insulin and 25 gm of dextrose for hyperkalemia in patients with renal failure. The study demonstrated baseline plasma glucose levels of 85‐92 mg/dl in patients prior to the insulin and dextrose therapy. Transient hyperglycemia developed 15 minutes post‐therapy, resolved within 30 minutes, and then progressed toward significant hypoglycemia at 60 minutes with blood glucose levels declining into the 45‐56 mg/dl range. The study also demonstrated that the hypoglycemia secondary to the insulin/dextrose regimen was attenuated by the concomitant use of inhaled albuterol.
Management of acute hyperkalemia stabilization lacks a standardized treatment regimen. Often a shot‐gun approach employing multiple therapeutic modalities is prescribed concomitantly, and intravenous insulin and dextrose are commonly included in these treatment regimens. Hyperkalemia treatment regimens are often prescribed based on local treatment patterns or from online references including Pepid6 and UpToDate.7 In addition, reference manuals such as the Washington Manual of Medical Therapeutics13 also provide therapeutic guidelines. However, these sources often do not agree on a standard treatment. In terms of a combined insulin and glucose therapy for hyperkalemia, the practice at our hospital is to administer, 10 units of regular insulin IVP with 50 ml (25 gm) of dextrose 50% IVP. UpToDate7 suggests 10 units of regular insulin IVP with 25 gm of dextrose 50% IVP, followed by dextrose 10% infusion by intravenous piggyback (IVPB) at 50‐75 ml/hr with careful monitoring. Pepid6 recommends 10 units of regular insulin IVP and 25 gm of dextrose 50% IVP, whereas the Washington Manual of Medical Therapeutics13 suggests 10‐20 units of regular insulin and 25‐50 gm of glucose administered intravenously.
Our study demonstrated a hypoglycemia frequency of 8.7% (<70 mg/dl) which occurred over a range of 5‐10 units of regular insulin and 0‐50 gm of dextrose 50%. However, this frequency may underestimate the true hypoglycemic incidence, as our study excluded patients without posttreatment blood glucose levels, and we were unable to control for patient self‐treatment or nurse‐assisted treatment of hypoglycemia with dietary sources of glucose (juice, crackers, etc). Despite these limitations, a hypoglycemic incidence of 8.7% is extremely high and constitutes an unacceptably high iatrogenic risk for complications. Data from the critical care literature suggests that hypoglycemia is an independent marker of mortality.14 Fifty‐eight percent of our total hypoglycemic events developed after patients received the commonly cited regimen of 10 units of regular insulin IVP and 25 gm of 50% dextrose IVP. One of our patients developed hypoglycemia despite a regimen of 10 units of regular insulin with 50 gm of 50% dextrose. This variability of patient response suggests that no single algorithm will prevent all hypoglycemic events, therefore, careful patient assessment and blood glucose monitoring should be routinely employed.
The decision regarding the order of dextrose and insulin administration can be influenced by clinical factors. Dextrose administration should generally precede insulin administration.15 In the setting of insulin and aldosterone deficiency (ie, a patient with type 1 diabetes and type IV renal tubular acidosis), dextrose administration prior to insulin administration could exacerbate the patient's hyperkalemia. In this circumstance, insulin administration should precede dextrose administration, with dextrose dosing predicated on the patient's estimated glycemic requirements and glucose monitoring. However, in patients with isolated insulin or aldosterone deficiency, the initial administration of dextrose does not predispose to further hyperkalemia.16
Hypoglycemia risk can be minimized by increasing the dextrose component in most insulin/dextrose hyperkalemia treatment regimens. The dextrose may be administered as 100 ml of 50% dextrose IVP or 50 ml of 50% dextrose IVPB, followed by 250 ml of D10 IVPB over 1 hour. The latter regimen may be preferred for patients at higher risk of hypoglycemia, although the added volume of fluid may not be appropriate for all patients. It must be recognized that this regimen may result in short‐term hyperglycemia, and patients should be closely monitored. It is reasonable, prior to treatment, to obtain a baseline blood glucose level and to obtain a 1‐hour and 3‐hour posttreatment blood glucose level.
While an electronic hospital record provides convenient access to a large number of patients and allows cross‐referencing of various laboratory values and prescribed medications, the ability to develop persuasive conclusions from the generated data may be significantly limited by inadequate or missing documentation of patient's pretreatment symptoms and response to therapy. The documentation of treatment response in the acute stabilization of hyperkalemia of our patients lacked specificity and standardization. Similarly, documentation of hypoglycemia and subsequent treatment response is not standardized at our institution. This lack of patient data limits our ability to gauge the level of harm experienced by our patients or evaluate the timeliness and appropriateness of their hypoglycemic treatment. Therefore, documentation of hypoglycemic symptoms and treatment will be the subject of future performance improvement initiatives and study at our institution. Further, studies need to be pursued utilizing standardized charting templates to facilitate and guide appropriate treatment assessment and follow‐up documentation. This will also assist in evaluating the treatment options addressed in this article. In addition, evaluation of bolus therapy with 50% dextrose versus therapies using D10 infusions in combination with insulin for hyperkalemia treatment in emergency room patients will be pursued. Despite these limitations, any policy which can limit harm from potential hypoglycemia deserves institutional attention and study.
Iatrogenic hypoglycemia as a result of treatment for hyperkalemia is a common occurrence, is largely unrecognized, and can have adverse outcomes. In our present study, 8.7% of patients became hypoglycemic following insulin treatment for hyperkalemia. Hyperkalemia occurs disproportionately in patients with acute kidney injury or end‐stage renal function. Moreover, the risk of severe hypoglycemia escalates in patients with lower body weight, and careful surveillance is needed in these cases.
- ,.Hyperkalemia in hospitalized patients.Int Urol Nephrol.2000;32:177–180.
- ,,,.Hyperkalemia in hospitalized patients: causes, adequacy of treatment, and results of an attempt to improve physician compliance with published therapy guidelines.Arch Intern Med.1998;158:917–924.
- .Relation of electrolyte disturbances to cardiac arrhythmias.Circulation.1973;47:408–419.
- .Electrolytes and the electrocardiogram.Postgrad Med.1974;55:123–129.
- 2005 American Heart Association guidelines for cardiopulmonary resuscitation and emergency cardiovascular care. Part 10.1: Life‐threatening electrolyte abnormalities.Circulation.2005;112:IC‐121‐IV121–IC‐125.
- ,.Electrolyte disturbances. In: Marx J, Hockberger R, Walls R, eds.Rosen's Emergency Medicine.5th ed.New York, NY:Mosby;2002:1722–1731. Accessed via Pepid 1/15/11.
- .Treatment and prevention of hyperkalemia. In: Basow DS, ed.UpToDate.Waltham, MA:UpToDate;2011.
- ,,.Hypoglycaemia following treatment of hyperkalemia with insulin and dextrose.Postgrad Med.1988;64:30–32.
- ,.Albuterol and insulin for treatment of hyperkalemia in hemodialysis patients.Kidney Int.1990;38:869–872.
- ,,,.Effect of various therapeutic approaches on plasma potassium and major regulating factors in terminal renal failure.Am J Med.1988;85:507–512.
- ,,.Hypoglycemia in patients with renal failure.Renal Failure.2000;22(2):219–223.
- .Combined effect of bicarbonate and insulin with glucose in acute therapy of hyperkalemia in end stage renal disease patients.Nephron.1996;72(3):476–482.
- ,.Fluid and electrolyte management. In: Foster C, Mistry N, Peddi P, Sharma S, eds.Washington Manual of Medical Therapeutics.33rd ed.Philadelphia, PA:Wolters Kluwer;2010:390.
- ,,, et al.Intensive insulin therapy in the medical ICU.N Eng J Med.2006;354:449–461.
- ,.Should glucose be administered before, with, or after insulin in the management of hyperkalemia?Renal Failure.1993;15(1):73–76.
- ,,,.Acute hyperkalemia induced by hyperglycemia: hormonal mechanisms.Ann Int Med.1976;84:426–432.
Hyperkalemia is a common condition in hospitalized patients and can be fatal if left untreated.1 The incidence of hyperkalemia in hospitalized patients is 1‐10%.2 Hyperkalemia develops secondary to decreased renal excretion of potassium, increased potassium intake, or redistribution of potassium into the extracellular fluid. Patients with renal dysfunction, especially acute kidney injury (AKI) or end‐stage renal disease (ESRD), are especially predisposed to hyperkalemia. Drug therapy (particularly inhibitors of the renin‐angiotensin‐aldosterone system, calcineurin inhibitors, potassium sparing diuretics, and heparin) may also predispose patients to elevated potassium levels.2 High extracellular potassium adversely affects the resting membrane potential of the myocardial cell. This results in a slowing of ventricular conduction, and may precipitate ventricular fibrillation or asystole.3, 4 Due to this high risk of cardiac complications, the American Heart Association recommends treatment when potassium levels are 6.0 mEq/L.5
A threefold approach to the treatment of hyperkalemia is currently adopted by clinicians: (1) stabilizing the cardiac membranes using intravenous (IV) calcium; (2) redistribution of potassium using IV insulin and nebulized albuterol (in the setting of metabolic acidosis, IV sodium bicarbonate will also help to shift potassium into cells); and (3) elimination of potassium from the body via hemodialysis or Na‐K exchange resin binders.2
The use of insulin is incorporated into most acute hyperkalemia stabilization treatment regimens and, with or without concomitant dextrose, can predispose patients to develop hypoglycemia. Dosing recommendations for insulin and dextrose for hyperkalemia vary among clinical references but commonly include 10 units of regular insulin IV and 25‐50 gm of IV dextrose.6, 7 Hypoglycemia following insulin and dextrose administration has received limited documentation.810 Furthermore, several factors account for an increased frequency of hypoglycemia in patients with end‐stage renal disease, a group also predisposed to hyperkalemia.11 This study assesses the incidence of hypoglycemia in hospitalized patients after acute stabilization treatment of hyperkalemia with insulin.
METHODS
A retrospective search of the electronic records of a large university‐based tertiary care hospital was conducted from June 1, 2009 to December 1, 2009. Adult hospitalized patients met our study inclusion criteria if they received IV insulin as part of an acute hyperkalemia stabilization treatment regimen and their potassium level was 6 mmol/L or greater. A medical record search was performed by applying the following search criteria: 5‐10 units of intravenous insulin administered within 6 hours of a collected potassium level which was reported as 6 mmol/L or greater. Patients were excluded if they did not have a reported blood glucose level measured within 6 hours of insulin administration. Patient demographic data was collected including: patient's age, sex, weight, and presence of diabetes or renal dysfunction. AKI was defined as an acute rise in serum creatinine of >0.5 mg/dl within a 7‐day period during hospitalization. Hypoglycemia and severe hypoglycemia were defined as blood glucose levels of <70 mg/dl and <40 mg/dl, respectively, consistent with the current medical literature. Hypoglycemic patients were grouped into hypoglycemic and severely hypoglycemic subsets based on their blood glucose levels. Information on patients' hypoglycemic symptoms was recorded when documented in the medical record. All administered doses of insulin and dextrose were documented by reviewing the medication administration record for each patient. Blood glucose levels were obtained by both point‐of‐care finger stick bedside measurements and blood draws taken for laboratory analysis. The incidence of patients who became hypoglycemic following a hyperkalemic treatment was then assessed.
RESULTS
Our retrospective computer data search identified 250 hyperkalemic patients (with potassium levels 6 mmol/L) who received intravenous regular insulin within 6 hours of the potassium level measurement during the 6‐month study period. Thirty patients (12%) met study criteria but were excluded because they did not have a blood glucose level documented within 6 hours of insulin administration. One patient, who qualified for the study from the electronic data, was excluded because of an erroneous potassium level secondary to a hemolyzed blood sample. Nineteen (8.7%) of the remaining 219 study patients were identified as hypoglycemic (blood glucose <70 mg/dl). Five patients (2.3%) were classified as having severe hypoglycemia (blood glucose <40 mg/dl). The distribution of hypoglycemic events among the various insulin/dextrose regimens are shown in Table 1. Fifty‐eight percent and 40% of the blood glucose <70 mg/dl and <40 mg/dl events, respectively, occurred following the commonly employed 10 units of regular insulin by intravenous push (IVP) and 25 gm of dextrose 50% IVP treatment regimen.
| Insulin (units)/dextrose (grams) | 10/0 | 5/25 | 10/12.5 | 10/25 | 10/50 |
|---|---|---|---|---|---|
| <40 mg/dl cohort | 1/5 (20%) | 2/5 (40%) | 0 | 2/5 (40%) | 0 |
| 41‐69 mg/dl cohort | 0 | 0 | 4/14 (29%) | 9/14 (64%) | 1/14 (7%) |
| <70 mg/dl cohort (total) | 1/19 (5.5%) | 2/19 (10%) | 4/19 (21%) | 11/19 (58%) | 1/19 (5.5%) |
| Diabetic patients | 0 | 1 | 1 | 3 | 0 |
The average body weight of patients with a blood glucose <40 mg/dl was significantly less than those patients having blood sugars in the 41‐69 mg/dl range (55.8 kg vs 92.0 kg, P <0.05) or patients with blood sugars >70 mg/dl (55.8 kg vs 87.4 kg, P <0.05). Table 2 lists patient characteristics by blood glucose cohort, with the 200 patient >70 mg/dl group represented by a random subset of 70 patients.
| Patient Characteristics per Cohort | <40 mg/dl Cohort (5 Patients) | 41‐69 mg/dl Cohort (14 Patients) | >70 mg/dl Cohort (70 Patient Subset) |
|---|---|---|---|
| |||
| Age, yr | 49 | 56 | 57 |
| Male sex, no. (%) | 3 (60%) | 12 (86%) | 40 (57%) |
| Weight, kg | 55.8 | 92 | 87.4 |
| Weight <50 kg (%) | 60% | 7.5% | 6% |
| Weight 51‐70 kg (%) | 20% | 7.5% | 26% |
| Weight >70 kg (%) | 20% | 85% | 68% |
| Diabetic, no. (%) | 1 (20%) | 4 (28%) | 22 (31%) |
| AKI or ESRD, no. (%) | 4 (80%) | 11 (78%) | 46 (66%) |
| Average BG pretreatment | 148 mg/dl* | 120 mg/dl | 155 mg/dl |
| Potassium level | |||
| 6.0‐6.4 mmol/L, no. (%) | 4 (80%) | 8 (57%) | 47 (67%) |
| 6.5‐6.9 mmol/L, no. (%) | 0 | 1 (7%) | 13 (19%) |
| >7 mmol/L, no. (%) | 1 (20%) | 5 (36%) | 10 (14%) |
| Hospitalization in ICU | 60% | 36% | 23% |
| Mortality during admission | 40% | 7% | 13% |
The average pretreatment blood glucose level for this cohort of 19 patients was 127 mg/dl with a blood glucose range of 59‐298 mg/dl. One patient was identified as hypoglycemic prior to treatment. Five hypoglycemic patients were identified as diabetic. One of these patients had an A1C level >13%, and 3 patients had levels <7%. Distribution of the potassium levels within the cohort were as follows: 6.0‐6.4 mmol/L: 12 patients (67%); 6.5‐6.9 mmol/L: 1 patient (5%); and 7 mmol/L or greater: 6 patients (28%). Seven patients had stat electrocardiograms ordered at the time of their hyperkalemia, and 3 patients had repeat potassium levels which verified their hyperkalemia. Fifteen (79%) of the hypoglycemic patients had acute kidney injury or were end‐stage renal disease patients on hemodialysis at the time of treatment.
Hypoglycemia was demonstrated at a median time of 3 hours post‐insulin administration. Documentation of the patients' hypoglycemia symptoms and the treatment of the hypoglycemic events were very poor. Only 3 patients had documentation of their hypoglycemia in the notes section of the electronic chart. The documentation included common symptoms of hypoglycemia in 2 patients, and was limited to the type of hypoglycemic treatment in the third patient. Seven patients had dextrose IV documented in the medication administration record, and 1 patient was treated with cranberry juice. No documentation of treatment was found in the remaining 58% of patients.
Eight of the 19 hypoglycemic patients were treated in an intensive care unit while receiving treatment for hyperkalemia. Of the 5 patients with severe hypoglycemia, 3 were treated in an intensive care unit and 2 of these patients died the day following treatment. One of the deaths resulted from a cardiac arrest with pulseless electrical activity while the patient was on dialysis. One patient with severe hypoglycemia was transferred to the medical intensive care unit but was discharged to home 4 days later. One additional patient, with chronic myeloid leukemia and a blood glucose level between 40 and 70 mg/dl died on the day of his admission.
DISCUSSION
Studies often do not agree on whether hypoglycemia is a complication resulting from standard insulin/glucose treatments for hyperkalemia. A previous study by Kim12 evaluated a combination regimen of insulin/glucose with bicarbonate for the treatment of hyperkalemia in 8 end‐stage renal disease patients. In this study, a solution of 8.4% bicarbonate (120 cc of bicarbonate and 80 ml of normal saline) was infused at a rate of 2 mmol/min. In addition, patients simultaneously received 550 ml of 20% glucose containing 50 units of regular insulin infused at a rate of 5 mU/kg/min. The study reported that the potassium level was lowered from 6.2 to 5.2 mEq/L in 1 hour without any patients experiencing hypoglycemia. The ratio of insulin to glucose was approximately 11 units/25 gm. However, in a similar study by Allon and Copkney,9 asymptomatic hypoglycemia was reported in 75% of patients following the administration of 10 units of regular insulin and 25 gm of dextrose for hyperkalemia in patients with renal failure. The study demonstrated baseline plasma glucose levels of 85‐92 mg/dl in patients prior to the insulin and dextrose therapy. Transient hyperglycemia developed 15 minutes post‐therapy, resolved within 30 minutes, and then progressed toward significant hypoglycemia at 60 minutes with blood glucose levels declining into the 45‐56 mg/dl range. The study also demonstrated that the hypoglycemia secondary to the insulin/dextrose regimen was attenuated by the concomitant use of inhaled albuterol.
Management of acute hyperkalemia stabilization lacks a standardized treatment regimen. Often a shot‐gun approach employing multiple therapeutic modalities is prescribed concomitantly, and intravenous insulin and dextrose are commonly included in these treatment regimens. Hyperkalemia treatment regimens are often prescribed based on local treatment patterns or from online references including Pepid6 and UpToDate.7 In addition, reference manuals such as the Washington Manual of Medical Therapeutics13 also provide therapeutic guidelines. However, these sources often do not agree on a standard treatment. In terms of a combined insulin and glucose therapy for hyperkalemia, the practice at our hospital is to administer, 10 units of regular insulin IVP with 50 ml (25 gm) of dextrose 50% IVP. UpToDate7 suggests 10 units of regular insulin IVP with 25 gm of dextrose 50% IVP, followed by dextrose 10% infusion by intravenous piggyback (IVPB) at 50‐75 ml/hr with careful monitoring. Pepid6 recommends 10 units of regular insulin IVP and 25 gm of dextrose 50% IVP, whereas the Washington Manual of Medical Therapeutics13 suggests 10‐20 units of regular insulin and 25‐50 gm of glucose administered intravenously.
Our study demonstrated a hypoglycemia frequency of 8.7% (<70 mg/dl) which occurred over a range of 5‐10 units of regular insulin and 0‐50 gm of dextrose 50%. However, this frequency may underestimate the true hypoglycemic incidence, as our study excluded patients without posttreatment blood glucose levels, and we were unable to control for patient self‐treatment or nurse‐assisted treatment of hypoglycemia with dietary sources of glucose (juice, crackers, etc). Despite these limitations, a hypoglycemic incidence of 8.7% is extremely high and constitutes an unacceptably high iatrogenic risk for complications. Data from the critical care literature suggests that hypoglycemia is an independent marker of mortality.14 Fifty‐eight percent of our total hypoglycemic events developed after patients received the commonly cited regimen of 10 units of regular insulin IVP and 25 gm of 50% dextrose IVP. One of our patients developed hypoglycemia despite a regimen of 10 units of regular insulin with 50 gm of 50% dextrose. This variability of patient response suggests that no single algorithm will prevent all hypoglycemic events, therefore, careful patient assessment and blood glucose monitoring should be routinely employed.
The decision regarding the order of dextrose and insulin administration can be influenced by clinical factors. Dextrose administration should generally precede insulin administration.15 In the setting of insulin and aldosterone deficiency (ie, a patient with type 1 diabetes and type IV renal tubular acidosis), dextrose administration prior to insulin administration could exacerbate the patient's hyperkalemia. In this circumstance, insulin administration should precede dextrose administration, with dextrose dosing predicated on the patient's estimated glycemic requirements and glucose monitoring. However, in patients with isolated insulin or aldosterone deficiency, the initial administration of dextrose does not predispose to further hyperkalemia.16
Hypoglycemia risk can be minimized by increasing the dextrose component in most insulin/dextrose hyperkalemia treatment regimens. The dextrose may be administered as 100 ml of 50% dextrose IVP or 50 ml of 50% dextrose IVPB, followed by 250 ml of D10 IVPB over 1 hour. The latter regimen may be preferred for patients at higher risk of hypoglycemia, although the added volume of fluid may not be appropriate for all patients. It must be recognized that this regimen may result in short‐term hyperglycemia, and patients should be closely monitored. It is reasonable, prior to treatment, to obtain a baseline blood glucose level and to obtain a 1‐hour and 3‐hour posttreatment blood glucose level.
While an electronic hospital record provides convenient access to a large number of patients and allows cross‐referencing of various laboratory values and prescribed medications, the ability to develop persuasive conclusions from the generated data may be significantly limited by inadequate or missing documentation of patient's pretreatment symptoms and response to therapy. The documentation of treatment response in the acute stabilization of hyperkalemia of our patients lacked specificity and standardization. Similarly, documentation of hypoglycemia and subsequent treatment response is not standardized at our institution. This lack of patient data limits our ability to gauge the level of harm experienced by our patients or evaluate the timeliness and appropriateness of their hypoglycemic treatment. Therefore, documentation of hypoglycemic symptoms and treatment will be the subject of future performance improvement initiatives and study at our institution. Further, studies need to be pursued utilizing standardized charting templates to facilitate and guide appropriate treatment assessment and follow‐up documentation. This will also assist in evaluating the treatment options addressed in this article. In addition, evaluation of bolus therapy with 50% dextrose versus therapies using D10 infusions in combination with insulin for hyperkalemia treatment in emergency room patients will be pursued. Despite these limitations, any policy which can limit harm from potential hypoglycemia deserves institutional attention and study.
Iatrogenic hypoglycemia as a result of treatment for hyperkalemia is a common occurrence, is largely unrecognized, and can have adverse outcomes. In our present study, 8.7% of patients became hypoglycemic following insulin treatment for hyperkalemia. Hyperkalemia occurs disproportionately in patients with acute kidney injury or end‐stage renal function. Moreover, the risk of severe hypoglycemia escalates in patients with lower body weight, and careful surveillance is needed in these cases.
- ,.Hyperkalemia in hospitalized patients.Int Urol Nephrol.2000;32:177–180.
- ,,,.Hyperkalemia in hospitalized patients: causes, adequacy of treatment, and results of an attempt to improve physician compliance with published therapy guidelines.Arch Intern Med.1998;158:917–924.
- .Relation of electrolyte disturbances to cardiac arrhythmias.Circulation.1973;47:408–419.
- .Electrolytes and the electrocardiogram.Postgrad Med.1974;55:123–129.
- 2005 American Heart Association guidelines for cardiopulmonary resuscitation and emergency cardiovascular care. Part 10.1: Life‐threatening electrolyte abnormalities.Circulation.2005;112:IC‐121‐IV121–IC‐125.
- ,.Electrolyte disturbances. In: Marx J, Hockberger R, Walls R, eds.Rosen's Emergency Medicine.5th ed.New York, NY:Mosby;2002:1722–1731. Accessed via Pepid 1/15/11.
- .Treatment and prevention of hyperkalemia. In: Basow DS, ed.UpToDate.Waltham, MA:UpToDate;2011.
- ,,.Hypoglycaemia following treatment of hyperkalemia with insulin and dextrose.Postgrad Med.1988;64:30–32.
- ,.Albuterol and insulin for treatment of hyperkalemia in hemodialysis patients.Kidney Int.1990;38:869–872.
- ,,,.Effect of various therapeutic approaches on plasma potassium and major regulating factors in terminal renal failure.Am J Med.1988;85:507–512.
- ,,.Hypoglycemia in patients with renal failure.Renal Failure.2000;22(2):219–223.
- .Combined effect of bicarbonate and insulin with glucose in acute therapy of hyperkalemia in end stage renal disease patients.Nephron.1996;72(3):476–482.
- ,.Fluid and electrolyte management. In: Foster C, Mistry N, Peddi P, Sharma S, eds.Washington Manual of Medical Therapeutics.33rd ed.Philadelphia, PA:Wolters Kluwer;2010:390.
- ,,, et al.Intensive insulin therapy in the medical ICU.N Eng J Med.2006;354:449–461.
- ,.Should glucose be administered before, with, or after insulin in the management of hyperkalemia?Renal Failure.1993;15(1):73–76.
- ,,,.Acute hyperkalemia induced by hyperglycemia: hormonal mechanisms.Ann Int Med.1976;84:426–432.
Copyright © 2011 Society of Hospital Medicine
Hospice Eligibility
Hospice provides a wide range of palliative and supportive services to patients and families facing a life‐limiting illness which include specialized medical care, aggressive pain and symptom management, and emotional and spiritual support. Hospice has been shown to benefit both patients and families by improving satisfaction and pain management, reducing medical costs and unmet needs, and decreasing family member's concerns,14 yet services are underutilized. In over 25 years of the Medicare hospice benefit, the median length of hospice stay has remained approximately 20‐22 days. This is consistent with the National Hospice and Palliative Care Organization (NHPCO) 2009 report which reveals that approximately 41.6% of all deaths in the United States occurred under the care of a hospice program, with more than half of the patients having a length of hospice service less than 21.1 days. The short length of stay is significant, because bereaved families commonly report that more time in hospice would have been beneficial.5
Medicare has 2 requirements for hospice eligibility: 1) the patient must understand that his/her illness is life‐limiting and be willing to forego curative therapy; and 2) two physicians must declare that the patient has 6 months or less to live. Hospice agencies often rely on NHPCO published worksheets (designed to identify patients with a prognosis of less than 6 months) to assist in determining if a patient meets the Medicare requirements. Even when a patient might meet Medicare requirements for hospice, many do not receive hospice services prior to their death. Physicians, patients, and families all present different barriers to hospice referrals which include: physician difficulty with accurate prognostication, physician grief and feelings of inadequacy, lack of knowledge about hospice and the referral process, and decreased communication between decision‐makers.69 A majority of the barriers to hospice referral may be overcome with education and normalization of hospice as an appropriate and effective medical intervention.
It is not known how often clinicians recognize that a patient is hospice eligible, nor is it known how often discussion of hospice occurs with appropriate patients or families. Studies in nursing homes and among advanced cancer patients demonstrate that physicians do not recognize hospice‐eligible patients and, as a consequence, hospice is not mentioned as a treatment option; however, when physicians are informed that a patient is hospice eligible and a hospice informational visit is provided, the physician is more likely to refer and the patient is much more likely to utilize hospice services.7, 10, 11 Earlier access to hospice improves care, helps ensure medically appropriate services are received, helps ensure death occurs in the preferred location, and is preferred by caregivers.12 In order to consider hospice, the treating physician needs to recognize and accept that the patient is dying. The goal of this study was to determine the percentage of patients who met guidelines for hospice admission, and had a documented discussion regarding hospice appropriateness in the medical record during a penultimate admission, defined as the hospital admission which preceded death.
METHODS
Study Selection and Population
This study was approved by the University of Iowa Institutional Review Board. A summer research medical student (K.F.), who was closely supervised by the principle investigator, reviewed the electronic medical record of all adult inpatient deaths at The University of Iowa Hospitals and Clinics (UIHC) in 2009 (Figure 1). Traumatic deaths were excluded. For each eligible patient, K.F. recorded age, sex, race, and date of death. For those patients who had a hospitalization in the previous 12 months, K.F. reviewed all physician and social work notes from both the penultimate and terminal admissions, and recorded primary and secondary diagnoses from both admissions, hospice enrollment at the time of either admission, evidence of a hospice discussion, occurrence of a palliative care consult during either admission, number of subspecialist referrals during the penultimate admission, length of stay, and total hospital costs for each admission.

Hospice Guidelines
The NHPCO has published worksheets for hospice admission that are the standard for determining hospice eligibility based on prognosis.13, 14 The worksheets do not address the patient's goals of care and acceptance of palliative‐based treatments. Rather, the worksheets are disease‐specific and include: cancer, pulmonary disease, heart disease, neurological illness (stroke, amyotrophic lateral sclerosis [ALS], multiple sclerosis [MS], etc), renal disease, human immunodeficiency virus (HIV), dementia, clinical decline, and liver disease. Despite the fact that NHPCO intended these worksheets to be used as guidelines, they are often used by hospice agencies strictly in determining hospice eligibility. We designed our data collection sheet to strictly reflect the worksheet criteria. The penultimate discharge summary was reviewed by K.F., and the primary and secondary discharge diagnoses were compared to the NHPCO worksheets. Data needed to support worksheet‐based determinations of eligibility were collected (medications, laboratory values, echocardiographic results, pulmonary function test results, radiographic scans and films, vital signs, and speech pathology reports). Whenever possible, we used objective data (ie, forced expiratory volume in 1 second [FEV1] for respiratory criteria) versus subjective reports (ie, shortness of breath) to make the hospice‐eligibility determination.
While Medicare guidelines say a patient is eligible for hospice when 2 physicians believe the patient has a prognosis of 6 months or less, there is no penalty if the patient outlives the physician's prognosis. The patient can continue to receive hospice services as long as the physicians continue to believe the prognosis remains less than 6 months if the disease were to follow the expected trajectory. We elected to evaluate the 12‐month time period prior to the terminal admission recognizing that while 6 months is the legislative guideline, historically, a substantial number of patients receive hospice services for over 180 days.15, 16
Statistical Analysis
Data were entered in a database using unique identifiers. Statistical analysis was conducted using SPSS 18 and SAS 9.2 for Windows (SAS 9.2, SAS Institute, Inc, Cary, NC). Standard descriptive statistics were used with a 2‐sample t test to describe differences in age, number of secondary organ systems, and number of subspecialty consults among those who were hospice eligible and those that were ineligible. The chi‐square statistic, as well as the Fisher exact test, was used to test for significant differences in proportions of sex, race, primary diagnosis, days between penultimate and terminal admission, and type of insurance/payer for patients who were hospice eligible versus those that were ineligible. More specifically, the Fisher exact test was used to test proportions that did not meet the criterion for approximation with the chi‐square test statistic. These proportions included primary diagnosis and type of insurance/payer. McNemar's test for paired data was used to evaluate differences in proportions of documentation of a hospice discussion at the terminal admission versus the penultimate admission, as well as the presence of a palliative care consultation. Corresponding P values were recorded, with significance being considered at the standard level of 0.05. SPSS 18 was used to evaluate inter‐rater reliability using Cohen's Kappa.
Inter‐Rater Reliability
The data extraction was conducted by a medical student who was trained in use of the NHPCO worksheets (K.F.). To insure K.F. was using the worksheets adequately, all the charts where a determination of not hospice eligible or clinical decline was made were initially reviewed by the principal investigator (PI) (M.T.W.) until 10 consecutive charts were error free. To insure reliability of the data abstraction, 25% of the charts were randomly assigned to 3 other reviewers: 5% to the study PI, a board‐certified hospice and palliative medicine physician with 5 years of experience as a hospice medical director (M.T.W.), 10% to a board‐certified hospice and palliative medicine physician with 10 years of experience as a hospice medical director (A.B.), and 10% to a quality‐control registered nurse without hospice experience (M.K.B.). Disagreements were recorded and resolved by consensus between 2 reviewers (M.T.W. and A.B.).
RESULTS
Hospital Characteristics
This study involved patients who were admitted and died at a large, tertiary care, academic institution. The catchment area is large and includes 3 states, and there are no known open access hospice agencies in the area. The hospital has 734 beds, and patients are cared for by either a teaching team (residents, learners, and attending) or by a physician (hospitalist) working with a physician extender (physician assistant or nurse practitioner). The majority of penultimate admissions (76%) were to a resident teaching team. More details regarding admitting services and hospice eligibility at the penultimate admission can be seen in Table 1.
| Admitting Services | Total Patients (N = 209) | Hospice Eligible (N = 125) | Hospice Referral (N = 11) |
|---|---|---|---|
| |||
| General medicine or family medicine teaching team | 56 | 4 | 3 |
| General medicine hospitalist | 9 | 3 | 0 |
| Medicine subspecialty service* | |||
| Cardiology/gastrointestinal/pulmonary | 47 | 26 | 0 |
| Hematology/oncology | 46 | 40 | 5 |
| Intensive care unit | 12 | 5 | 2 |
| Surgical service | 33 | 16 | 1 |
| Neurology | 6 | 2 | 0 |
Patient Characteristics
Of the 688 adult patients who died during 2009 at UIHC, 209 (31%) had both a nontraumatic death and a penultimate admission in the 12 months preceding the terminal admission. Of the 209 who met eligibility criteria for a full chart review, the mean age was 63, the majority of patients were male, cancer was the most common terminal diagnosis, and 83% were white, which is reflective of the regional population. There were no significant differences between age, sex, race, or insurance coverage between patients who did, and did not, meet hospice‐eligibility criteria. The majority of patients (139/209) had 1 or 2 hospitalizations in the 12 months prior to their terminal admission (range 1‐17), and patients eligible for hospice had more hospitalizations in the 12 months prior to their terminal admission than the patients not eligible for hospice (mean 3.3 vs 1.9; P = 0.0003) (Table 2). The combined Kappa rating between the primary reviewer (K.F.) and the other 3 reviewers was 0.754, indicating a substantial degree of reliability.
| Hospice Eligible | ||||
|---|---|---|---|---|
| Characteristic | Total Sample (N = 209) | Yes (N = 125) | No (N = 84) | P Value |
| ||||
| Age, mean (SD), yr | 63.8 (16.9) | 62.9 (14.3) | 0.67* | |
| Sex, No. (%) | ||||
| Male | 128 (61.2) | 70 (55) | 58 (45) | 0.06 |
| Female | 81 (38.8) | 55 (68) | 26 (32) | |
| Race/ethnicity, No. (%) | ||||
| White, non‐Hispanic | 174 (83.3) | 107 (61.5) | 67 (38.5) | |
| Black, non‐Hispanic | 7 (3.3) | 2 (28.6) | 5 (71.4) | |
| Hispanic | 3 (1.4) | 2 (66.7) | 1 (33.3) | 0.49 |
| Asian | 3 (1.4) | 2 (66.7) | 1 (33.3) | |
| Other | 22 (10.5) | 12 (54.5) | 10 (45.5) | |
| Non‐white (total) | 35 (16.7) | 18 (51.4) | 17 (48.6) | 0.27 |
| Number of secondary organ systems listed on discharge summary, mean (SD) | 3.10 (1.825) | 3.11 (1.826) | 0.99 | |
| Number of subspecialty consults, mean (SD) | 0.656 (1.23) | 0.250 (0.692) | 0.003* | |
| Number of admissions in the year prior to the terminal admission, mean (SD) | 3.254 (2.86) | 1.940 (1.83) | 0.0003 | |
| Primary discharge diagnosis, No. (%) | ||||
| Cancer | 46 (22) | 35 (76.1) | 11 (23.9) | |
| Gastrointestinal | 36 (17.2) | 22 (61.1) | 14 (38.9) | |
| Infection | 33 (15.8) | 23 (69.7) | 10 (30.3) | |
| Cardiac/vascular | 32 (15.3) | 15 (46.9) | 17 (53.1) | |
| Respiratory | 16 (7.7) | 13 (81.2) | 3 (18.8) | <0.001 |
| Renal | 15 (7.2) | 9 (60) | 6 (40) | |
| Neurological | 13 (6.2) | 4 (30.8) | 9 (69.2) | |
| Hematological | 7 (3.3) | 4 (57.1) | 3 (42.9) | |
| Orthopedic | 6 (2.9) | 0 | 6 (100) | |
| Endocrine | 4 (1.9) | 0 | 4 (100) | |
| Rheumatological | 1 (0.4) | 0 | 1 (100) | |
| Days between penultimate and terminal admission, No. (%) | ||||
| 0‐13 | 13 (6.2) | 9 (7.2) | 4 (4.8) | |
| 14‐30 | 53 (25.4) | 41 (33) | 12 (14.3) | |
| 31‐90 | 77 (36.8) | 53 (42) | 24 (28.5) | <0.001 |
| 91‐180 | 32 (15.3) | 13 (10.4) | 19 (22.6) | |
| >180 | 34 (16.3) | 9 (7.2) | 25 (29.8) | |
| Type of insurance/payers, No. (%) | ||||
| Commercial | 44 (21) | 30 (24) | 14 (16.7) | |
| Medicare/Medicaid/state aid | 158 (75.6) | 93 (74.4) | 65 (77.4) | 0.05 |
| Military | 4 (1.9) | 0 | 4 (4.8) | |
| Other | 3 (1.4) | 2 (1.6) | 1 (1.2) | |
Penultimate Admission Data
A total of 125/209 or 60% of the patients met NHPCO guidelines for hospice admission at the time of discharge from the penultimate admission. The majority, 175/209 penultimate admissions (84%) occurred within 6 months of the terminal admissions, and 103/175 (59%) of the patients with a penultimate admission within 6 months of the terminal admission met NHPCO prognostic guidelines for hospice eligibility. The patients who met hospice prognostication guidelines had significantly more subspecialty consults on the penultimate admission compared to those not hospice eligible (mean of 0.66 vs 0.25; P = 0.003) (Table 2). Moreover, hospice‐eligible patients had significantly fewer days between their penultimate admission and death (mean of 62 days vs 128 days; P = 0.001).
Hospice and Palliative Care Discussions
Documentation of a hospice discussion was more common during the terminal admission than the penultimate admission (23% vs 14%; P < 0.001). Palliative care consultation was also more common at the terminal admission than the penultimate admission (47% vs 5%; P < 0.001). Of the 126 patients who were hospice eligible at the penultimate admission, 17 had a documented hospice discussion during their penultimate admission (14%). A formal hospice referral was provided to 11/17 (64%) patients prior to discharge, all of which came from a resident teaching team. Of the 7 patients referred to hospice by a physician, 5 enrolled in hospice (the 2 who did not, cited financial reasons), while only 1 of the 4 patients referred by a social worker enrolled in hospice. Cancer was the most common diagnosis in patients who had a documented hospice discussion (73%), followed by the hospice diagnosis of clinical decline (18%).
COMMENT
Our results indicate that the majority of patients (60%) who died at our large academic hospital met published medical guidelines for hospice enrollment during an admission in the year prior to their terminal admission, yet very few received the choice to utilize hospice services. While bereaved families uniformly express satisfaction with, and appreciation of, hospice services, hospice is often not mentioned until the patient is imminently dying, and this may be the first time the patient realizes hospice is an option. There are a number of reasons why physicians do not mention hospice earlier, and most are related to physician concerns with communication of bad news and prognostication.6, 7, 17 However, patients and families overwhelmingly say that they want to engage in difficult discussions, and are more satisfied after their care providers bring up topics related to advanced directives. Patients and families do not find discussions of code status uncomfortable,18 and hope is maintained even when patients are given truthful prognostic and treatment information.19
Communication of prognosis and hospice eligibility would have been appropriate for the majority of the patients in this study. In general, patients want information about healthcare options. Referrals do not require that a patient has to choose hospice care. In our subsample of patients with whom hospice was discussed, only 41% chose hospice care, which is lower than previous studies.11 Who made the referral appeared to impact the patient's willingness to enroll in hospice, with more patients enrolling when the hospice referral was made by a physician. This will be an important area to explore further, because improving referral rates has the potential to increase hospice enrollment rates. This is important since hospice has been shown in numerous studies to decrease costs at the end of life, as well as decrease length of stay and intensive care utilization, while subsequently increasing the quality and satisfaction of the care received.2024
There are no rigorously controlled studies examining hospice discussions. The majority of studies have been case‐controlled trials. While the present study revealed that hospice discussions with terminally ill inpatients are rare, there are several limitations of our evaluation. We used a retrospective chart review which introduced an unavoidable selection bias. We were unable to capture patients who were recognized as dying, referred to hospice, and did not return to the hospital to die. Nor could we capture patients who had a penultimate admission at another hospital, or had a hospice discussion in another setting and did not return to the hospital to die. Further limitations became apparent as we conducted the study. These limitations, however, do not detract from our findings that hospice discussions were rare when patients died in our hospital. Our findings are based solely on chart documentation. Hospice discussions could have occurred which were not recorded. However, since it was rare for patients to receive either a palliative care referral or a referral to hospice, it is likely that such discussions were rare. The study was not designed to examine barriers to hospice enrollment. Therefore, we do not know whether the physician did not recognize that the patient was dying, or if the physician recognized the terminal nature of the patient's illness and choose not to discuss it. However, we do know that hospice was not mentioned as a treatment option in the majority of patients that were medically appropriate for hospice services.
By selecting patients who died in the hospital from nontraumatic causes, we were able to limit our study to patients who had a terminal illness. Physicians and hospice agencies typically use the NHPCO worksheets to determine if a patient meets the medical‐eligibility criteria for hospice enrollment. This study highlighted the lack of sensitivity in the NHPCO worksheets. Strict application of the NHPCO worksheets failed to identify 84 of the 209 patients (40%) who had a terminal condition. We found the NHPCO worksheets to be inflexible and incomplete due to the limited number of diagnoses covered. We identified patients who we believed were hospice eligible from a medical standpoint, but the charts did not have sufficient data to support the strict disease‐specific criteria in the NHPCO worksheets.
One final limitation was the fact that we only addressed whether a patient was eligible for hospice from a prognostic standpoint. We have no knowledge of patient and caregiver goals (due to a lack of documentation), so we were unable to determine if patient goals of care were congruent with the hospice philosophy. The patients who died at the hospital may have self‐selected as patients who desired more aggressive care. While it is ideal to discuss the patient's goals of treatment, hopes for quality of life, and the wishes of the family on a regular basis, in reality this discussion is not commonplace.25 These discussions can be difficult and time‐consuming, particularly in a large tertiary care center, and referral to hospice may be impacted by involvement of multiple subspecialty services who may provide organ‐specific care without a general overview of the patient's status.26, 27 In fact, when a patient receives a palliative‐care consult that focuses on the plan‐of‐care coordination and communication (not just symptom management), hospice referrals are increased.28, 29 This is supported by recent studies which reveal the importance of patient goals and advanced care planning in the timing and effectiveness of hospice referral, and patient goals would be important data to obtain in future studies.11, 30
FUTURE STUDIES
This study provides data detailing how often physicians miss opportunities to discuss an effective medical intervention, hospice, with appropriate hospitalized patients. The study also shows the feasibility of using the NHPCO worksheets to identify hospice‐eligible patients during an acute hospitalization. In addition, this study presents important information about the current culture and practice of medicine in regards to dying hospitalized patients. It contains the preliminary data necessary to design a prospective, randomized control trial with a targeted intervention to increase the rate of hospice referrals of eligible inpatients. Coordinating care and knowing when to discuss hospice as a treatment option would assist in aligning medical care with patient and family goals. Appropriately timed hospice discussions and referrals would lead to a decrease in the number of acute hospitalizations, decrease the 30‐day hospital readmission rates, lower healthcare expenses, and improve comfort while tending to the goals and emotional needs of patients and families at the end of life.
Acknowledgements
The authors thank John Hyman for his assistance with data analysis.
- ,,, et al.Family perspectives on end‐of‐life care at the last place of care.JAMA.2004;291(1):88–93.
- ,,.Hospice enrollment and pain assessment and management in nursing homes.J Pain Symptom Manage.2003;26(3):791–799.
- ,,,,.Does receipt of hospice care in nursing homes improve the management of pain at the end of life?J Am Geriatr Soc.2002;50(3):507–515.
- ,,, et al.Increased satisfaction with care and lower costs: results of a randomized trial of in‐home palliative care.J Am Geriatr Soc.2007;55(7):993–1000.
- ,,,,.Timing of hospice referral and families' perceptions of services: are earlier hospice referrals better?J Am Geriatr Soc.2005;53(5):819–823.
- ,.Barriers to physicians' decisions to discuss hospice: insights gained from the United States hospice model.J Eval Clin Pract.2003;9(3):363–372.
- ,,, et al.Physician factors associated with discussions about end‐of‐life care.Cancer.2010;116(4):998–1006.
- ,,,,,.Obstacles to palliation and end‐of‐life care in a long‐term care facility.Gerontologist.2002;42(3):342–349.
- ,.Extent and determinants of error in doctors' prognoses in terminally ill patients: prospective cohort study.BMJ.2000;320(7233):469–472.
- ,,, et al.Discussions with physicians about hospice among patients with metastatic lung cancer.Arch Intern Med.2009;169(10):954–962.
- ,,,,,.Improving the use of hospice services in nursing homes: a randomized controlled trial.JAMA.2005;294(2):211–217.
- ,,, et al.Associations between end‐of‐life discussions, patient mental health, medical care near death, and caregiver bereavement adjustment.JAMA.2008;300(14):1665–1673.
- Medical guidelines for determining prognosis in selected non‐cancer diseases.The National Hospice Organization.Hosp J.1996;11(2):47–63.
- ,,,,,.Evaluation of prognostic criteria for determining hospice eligibility in patients with advanced lung, heart, or liver disease. SUPPORT Investigators. Study to Understand Prognoses and Preferences for Outcomes and Risks of Treatments.JAMA.1999;282(17):1638–1645.
- ,,,,.Long and short hospice stays among nursing home residents at the end of life.J Palliat Med.2010;13(8):957–964.
- ,.Survival of Medicare patients after enrollment in hospice programs.N Engl J Med.1996;335(3):172–178.
- ,,,.Barriers to hospice care and referrals: survey of physicians' knowledge, attitudes, and perceptions in a health maintenance organization.J Palliat Med.2004;7(3):411–418.
- ,,, et al.Code status discussions and goals of care among hospitalised adults.J Med Ethics.2009;35(6):338–342.
- ,,,,,.Giving honest information to patients with advanced cancer maintains hope.Oncology (Williston Park).2010;24(6):521–525.
- ,,, et al.Impact of hospice disenrollment on health care use and Medicare expenditures for patients with cancer.J Clin Oncol.2010;28(28):4371–4375.
- ,,,,.What length of hospice use maximizes reduction in medical expenditures near death in the US Medicare program?Soc Sci Med.2007;65(7):1466–1478.
- ,,, et al.Health care costs in the last week of life: associations with end‐of‐life conversations.Arch Intern Med.2009;169(5):480–488.
- ,,,.Medicare cost in matched hospice and non‐hospice cohorts.J Pain Symptom Manage.2004;28(3):200–210.
- ,,,,,.Proactive palliative care in the medical intensive care unit: effects on length of stay for selected high‐risk patients.Crit Care Med.2007;35(6):1530–1535.
- ,,,,,.Timing of referral to hospice and quality of care: length of stay and bereaved family members' perceptions of the timing of hospice referral.J Pain Symptom Manage.2007;34(2):120–125.
- ,.Admission to intensive care unit at the end‐of‐life: is it an informed decision?Palliat Med.2004;18(8):705–711.
- ,.Factors contributing to late hospice admission and proposals for change.Am J Hosp Palliat Care.1997;14(5):212–218.
- ,,.Hospice referrals and code status: outcomes of inpatient palliative care consultations among Asian Americans and Pacific Islanders with cancer.J Pain Symptom Manage. April 22,2011.
- ,,, et al.Survival, mortality, and location of death for patients seen by a hospital‐based palliative care team.J Palliat Med.2006;9(4):903–911.
- ,,,,.Association between advance directives and quality of end‐of‐life care: a national study.J Am Geriatr Soc.2007;55(2):189–194.
Hospice provides a wide range of palliative and supportive services to patients and families facing a life‐limiting illness which include specialized medical care, aggressive pain and symptom management, and emotional and spiritual support. Hospice has been shown to benefit both patients and families by improving satisfaction and pain management, reducing medical costs and unmet needs, and decreasing family member's concerns,14 yet services are underutilized. In over 25 years of the Medicare hospice benefit, the median length of hospice stay has remained approximately 20‐22 days. This is consistent with the National Hospice and Palliative Care Organization (NHPCO) 2009 report which reveals that approximately 41.6% of all deaths in the United States occurred under the care of a hospice program, with more than half of the patients having a length of hospice service less than 21.1 days. The short length of stay is significant, because bereaved families commonly report that more time in hospice would have been beneficial.5
Medicare has 2 requirements for hospice eligibility: 1) the patient must understand that his/her illness is life‐limiting and be willing to forego curative therapy; and 2) two physicians must declare that the patient has 6 months or less to live. Hospice agencies often rely on NHPCO published worksheets (designed to identify patients with a prognosis of less than 6 months) to assist in determining if a patient meets the Medicare requirements. Even when a patient might meet Medicare requirements for hospice, many do not receive hospice services prior to their death. Physicians, patients, and families all present different barriers to hospice referrals which include: physician difficulty with accurate prognostication, physician grief and feelings of inadequacy, lack of knowledge about hospice and the referral process, and decreased communication between decision‐makers.69 A majority of the barriers to hospice referral may be overcome with education and normalization of hospice as an appropriate and effective medical intervention.
It is not known how often clinicians recognize that a patient is hospice eligible, nor is it known how often discussion of hospice occurs with appropriate patients or families. Studies in nursing homes and among advanced cancer patients demonstrate that physicians do not recognize hospice‐eligible patients and, as a consequence, hospice is not mentioned as a treatment option; however, when physicians are informed that a patient is hospice eligible and a hospice informational visit is provided, the physician is more likely to refer and the patient is much more likely to utilize hospice services.7, 10, 11 Earlier access to hospice improves care, helps ensure medically appropriate services are received, helps ensure death occurs in the preferred location, and is preferred by caregivers.12 In order to consider hospice, the treating physician needs to recognize and accept that the patient is dying. The goal of this study was to determine the percentage of patients who met guidelines for hospice admission, and had a documented discussion regarding hospice appropriateness in the medical record during a penultimate admission, defined as the hospital admission which preceded death.
METHODS
Study Selection and Population
This study was approved by the University of Iowa Institutional Review Board. A summer research medical student (K.F.), who was closely supervised by the principle investigator, reviewed the electronic medical record of all adult inpatient deaths at The University of Iowa Hospitals and Clinics (UIHC) in 2009 (Figure 1). Traumatic deaths were excluded. For each eligible patient, K.F. recorded age, sex, race, and date of death. For those patients who had a hospitalization in the previous 12 months, K.F. reviewed all physician and social work notes from both the penultimate and terminal admissions, and recorded primary and secondary diagnoses from both admissions, hospice enrollment at the time of either admission, evidence of a hospice discussion, occurrence of a palliative care consult during either admission, number of subspecialist referrals during the penultimate admission, length of stay, and total hospital costs for each admission.
Hospice Guidelines
The NHPCO has published worksheets for hospice admission that are the standard for determining hospice eligibility based on prognosis.13, 14 The worksheets do not address the patient's goals of care and acceptance of palliative‐based treatments. Rather, the worksheets are disease‐specific and include: cancer, pulmonary disease, heart disease, neurological illness (stroke, amyotrophic lateral sclerosis [ALS], multiple sclerosis [MS], etc), renal disease, human immunodeficiency virus (HIV), dementia, clinical decline, and liver disease. Despite the fact that NHPCO intended these worksheets to be used as guidelines, they are often used by hospice agencies strictly in determining hospice eligibility. We designed our data collection sheet to strictly reflect the worksheet criteria. The penultimate discharge summary was reviewed by K.F., and the primary and secondary discharge diagnoses were compared to the NHPCO worksheets. Data needed to support worksheet‐based determinations of eligibility were collected (medications, laboratory values, echocardiographic results, pulmonary function test results, radiographic scans and films, vital signs, and speech pathology reports). Whenever possible, we used objective data (ie, forced expiratory volume in 1 second [FEV1] for respiratory criteria) versus subjective reports (ie, shortness of breath) to make the hospice‐eligibility determination.
While Medicare guidelines say a patient is eligible for hospice when 2 physicians believe the patient has a prognosis of 6 months or less, there is no penalty if the patient outlives the physician's prognosis. The patient can continue to receive hospice services as long as the physicians continue to believe the prognosis remains less than 6 months if the disease were to follow the expected trajectory. We elected to evaluate the 12‐month time period prior to the terminal admission recognizing that while 6 months is the legislative guideline, historically, a substantial number of patients receive hospice services for over 180 days.15, 16
Statistical Analysis
Data were entered in a database using unique identifiers. Statistical analysis was conducted using SPSS 18 and SAS 9.2 for Windows (SAS 9.2, SAS Institute, Inc, Cary, NC). Standard descriptive statistics were used with a 2‐sample t test to describe differences in age, number of secondary organ systems, and number of subspecialty consults among those who were hospice eligible and those that were ineligible. The chi‐square statistic, as well as the Fisher exact test, was used to test for significant differences in proportions of sex, race, primary diagnosis, days between penultimate and terminal admission, and type of insurance/payer for patients who were hospice eligible versus those that were ineligible. More specifically, the Fisher exact test was used to test proportions that did not meet the criterion for approximation with the chi‐square test statistic. These proportions included primary diagnosis and type of insurance/payer. McNemar's test for paired data was used to evaluate differences in proportions of documentation of a hospice discussion at the terminal admission versus the penultimate admission, as well as the presence of a palliative care consultation. Corresponding P values were recorded, with significance being considered at the standard level of 0.05. SPSS 18 was used to evaluate inter‐rater reliability using Cohen's Kappa.
Inter‐Rater Reliability
The data extraction was conducted by a medical student who was trained in use of the NHPCO worksheets (K.F.). To insure K.F. was using the worksheets adequately, all the charts where a determination of not hospice eligible or clinical decline was made were initially reviewed by the principal investigator (PI) (M.T.W.) until 10 consecutive charts were error free. To insure reliability of the data abstraction, 25% of the charts were randomly assigned to 3 other reviewers: 5% to the study PI, a board‐certified hospice and palliative medicine physician with 5 years of experience as a hospice medical director (M.T.W.), 10% to a board‐certified hospice and palliative medicine physician with 10 years of experience as a hospice medical director (A.B.), and 10% to a quality‐control registered nurse without hospice experience (M.K.B.). Disagreements were recorded and resolved by consensus between 2 reviewers (M.T.W. and A.B.).
RESULTS
Hospital Characteristics
This study involved patients who were admitted and died at a large, tertiary care, academic institution. The catchment area is large and includes 3 states, and there are no known open access hospice agencies in the area. The hospital has 734 beds, and patients are cared for by either a teaching team (residents, learners, and attending) or by a physician (hospitalist) working with a physician extender (physician assistant or nurse practitioner). The majority of penultimate admissions (76%) were to a resident teaching team. More details regarding admitting services and hospice eligibility at the penultimate admission can be seen in Table 1.
| Admitting Services | Total Patients (N = 209) | Hospice Eligible (N = 125) | Hospice Referral (N = 11) |
|---|---|---|---|
| |||
| General medicine or family medicine teaching team | 56 | 4 | 3 |
| General medicine hospitalist | 9 | 3 | 0 |
| Medicine subspecialty service* | |||
| Cardiology/gastrointestinal/pulmonary | 47 | 26 | 0 |
| Hematology/oncology | 46 | 40 | 5 |
| Intensive care unit | 12 | 5 | 2 |
| Surgical service | 33 | 16 | 1 |
| Neurology | 6 | 2 | 0 |
Patient Characteristics
Of the 688 adult patients who died during 2009 at UIHC, 209 (31%) had both a nontraumatic death and a penultimate admission in the 12 months preceding the terminal admission. Of the 209 who met eligibility criteria for a full chart review, the mean age was 63, the majority of patients were male, cancer was the most common terminal diagnosis, and 83% were white, which is reflective of the regional population. There were no significant differences between age, sex, race, or insurance coverage between patients who did, and did not, meet hospice‐eligibility criteria. The majority of patients (139/209) had 1 or 2 hospitalizations in the 12 months prior to their terminal admission (range 1‐17), and patients eligible for hospice had more hospitalizations in the 12 months prior to their terminal admission than the patients not eligible for hospice (mean 3.3 vs 1.9; P = 0.0003) (Table 2). The combined Kappa rating between the primary reviewer (K.F.) and the other 3 reviewers was 0.754, indicating a substantial degree of reliability.
| Hospice Eligible | ||||
|---|---|---|---|---|
| Characteristic | Total Sample (N = 209) | Yes (N = 125) | No (N = 84) | P Value |
| ||||
| Age, mean (SD), yr | 63.8 (16.9) | 62.9 (14.3) | 0.67* | |
| Sex, No. (%) | ||||
| Male | 128 (61.2) | 70 (55) | 58 (45) | 0.06 |
| Female | 81 (38.8) | 55 (68) | 26 (32) | |
| Race/ethnicity, No. (%) | ||||
| White, non‐Hispanic | 174 (83.3) | 107 (61.5) | 67 (38.5) | |
| Black, non‐Hispanic | 7 (3.3) | 2 (28.6) | 5 (71.4) | |
| Hispanic | 3 (1.4) | 2 (66.7) | 1 (33.3) | 0.49 |
| Asian | 3 (1.4) | 2 (66.7) | 1 (33.3) | |
| Other | 22 (10.5) | 12 (54.5) | 10 (45.5) | |
| Non‐white (total) | 35 (16.7) | 18 (51.4) | 17 (48.6) | 0.27 |
| Number of secondary organ systems listed on discharge summary, mean (SD) | 3.10 (1.825) | 3.11 (1.826) | 0.99 | |
| Number of subspecialty consults, mean (SD) | 0.656 (1.23) | 0.250 (0.692) | 0.003* | |
| Number of admissions in the year prior to the terminal admission, mean (SD) | 3.254 (2.86) | 1.940 (1.83) | 0.0003 | |
| Primary discharge diagnosis, No. (%) | ||||
| Cancer | 46 (22) | 35 (76.1) | 11 (23.9) | |
| Gastrointestinal | 36 (17.2) | 22 (61.1) | 14 (38.9) | |
| Infection | 33 (15.8) | 23 (69.7) | 10 (30.3) | |
| Cardiac/vascular | 32 (15.3) | 15 (46.9) | 17 (53.1) | |
| Respiratory | 16 (7.7) | 13 (81.2) | 3 (18.8) | <0.001 |
| Renal | 15 (7.2) | 9 (60) | 6 (40) | |
| Neurological | 13 (6.2) | 4 (30.8) | 9 (69.2) | |
| Hematological | 7 (3.3) | 4 (57.1) | 3 (42.9) | |
| Orthopedic | 6 (2.9) | 0 | 6 (100) | |
| Endocrine | 4 (1.9) | 0 | 4 (100) | |
| Rheumatological | 1 (0.4) | 0 | 1 (100) | |
| Days between penultimate and terminal admission, No. (%) | ||||
| 0‐13 | 13 (6.2) | 9 (7.2) | 4 (4.8) | |
| 14‐30 | 53 (25.4) | 41 (33) | 12 (14.3) | |
| 31‐90 | 77 (36.8) | 53 (42) | 24 (28.5) | <0.001 |
| 91‐180 | 32 (15.3) | 13 (10.4) | 19 (22.6) | |
| >180 | 34 (16.3) | 9 (7.2) | 25 (29.8) | |
| Type of insurance/payers, No. (%) | ||||
| Commercial | 44 (21) | 30 (24) | 14 (16.7) | |
| Medicare/Medicaid/state aid | 158 (75.6) | 93 (74.4) | 65 (77.4) | 0.05 |
| Military | 4 (1.9) | 0 | 4 (4.8) | |
| Other | 3 (1.4) | 2 (1.6) | 1 (1.2) | |
Penultimate Admission Data
A total of 125/209 or 60% of the patients met NHPCO guidelines for hospice admission at the time of discharge from the penultimate admission. The majority, 175/209 penultimate admissions (84%) occurred within 6 months of the terminal admissions, and 103/175 (59%) of the patients with a penultimate admission within 6 months of the terminal admission met NHPCO prognostic guidelines for hospice eligibility. The patients who met hospice prognostication guidelines had significantly more subspecialty consults on the penultimate admission compared to those not hospice eligible (mean of 0.66 vs 0.25; P = 0.003) (Table 2). Moreover, hospice‐eligible patients had significantly fewer days between their penultimate admission and death (mean of 62 days vs 128 days; P = 0.001).
Hospice and Palliative Care Discussions
Documentation of a hospice discussion was more common during the terminal admission than the penultimate admission (23% vs 14%; P < 0.001). Palliative care consultation was also more common at the terminal admission than the penultimate admission (47% vs 5%; P < 0.001). Of the 126 patients who were hospice eligible at the penultimate admission, 17 had a documented hospice discussion during their penultimate admission (14%). A formal hospice referral was provided to 11/17 (64%) patients prior to discharge, all of which came from a resident teaching team. Of the 7 patients referred to hospice by a physician, 5 enrolled in hospice (the 2 who did not, cited financial reasons), while only 1 of the 4 patients referred by a social worker enrolled in hospice. Cancer was the most common diagnosis in patients who had a documented hospice discussion (73%), followed by the hospice diagnosis of clinical decline (18%).
COMMENT
Our results indicate that the majority of patients (60%) who died at our large academic hospital met published medical guidelines for hospice enrollment during an admission in the year prior to their terminal admission, yet very few received the choice to utilize hospice services. While bereaved families uniformly express satisfaction with, and appreciation of, hospice services, hospice is often not mentioned until the patient is imminently dying, and this may be the first time the patient realizes hospice is an option. There are a number of reasons why physicians do not mention hospice earlier, and most are related to physician concerns with communication of bad news and prognostication.6, 7, 17 However, patients and families overwhelmingly say that they want to engage in difficult discussions, and are more satisfied after their care providers bring up topics related to advanced directives. Patients and families do not find discussions of code status uncomfortable,18 and hope is maintained even when patients are given truthful prognostic and treatment information.19
Communication of prognosis and hospice eligibility would have been appropriate for the majority of the patients in this study. In general, patients want information about healthcare options. Referrals do not require that a patient has to choose hospice care. In our subsample of patients with whom hospice was discussed, only 41% chose hospice care, which is lower than previous studies.11 Who made the referral appeared to impact the patient's willingness to enroll in hospice, with more patients enrolling when the hospice referral was made by a physician. This will be an important area to explore further, because improving referral rates has the potential to increase hospice enrollment rates. This is important since hospice has been shown in numerous studies to decrease costs at the end of life, as well as decrease length of stay and intensive care utilization, while subsequently increasing the quality and satisfaction of the care received.2024
There are no rigorously controlled studies examining hospice discussions. The majority of studies have been case‐controlled trials. While the present study revealed that hospice discussions with terminally ill inpatients are rare, there are several limitations of our evaluation. We used a retrospective chart review which introduced an unavoidable selection bias. We were unable to capture patients who were recognized as dying, referred to hospice, and did not return to the hospital to die. Nor could we capture patients who had a penultimate admission at another hospital, or had a hospice discussion in another setting and did not return to the hospital to die. Further limitations became apparent as we conducted the study. These limitations, however, do not detract from our findings that hospice discussions were rare when patients died in our hospital. Our findings are based solely on chart documentation. Hospice discussions could have occurred which were not recorded. However, since it was rare for patients to receive either a palliative care referral or a referral to hospice, it is likely that such discussions were rare. The study was not designed to examine barriers to hospice enrollment. Therefore, we do not know whether the physician did not recognize that the patient was dying, or if the physician recognized the terminal nature of the patient's illness and choose not to discuss it. However, we do know that hospice was not mentioned as a treatment option in the majority of patients that were medically appropriate for hospice services.
By selecting patients who died in the hospital from nontraumatic causes, we were able to limit our study to patients who had a terminal illness. Physicians and hospice agencies typically use the NHPCO worksheets to determine if a patient meets the medical‐eligibility criteria for hospice enrollment. This study highlighted the lack of sensitivity in the NHPCO worksheets. Strict application of the NHPCO worksheets failed to identify 84 of the 209 patients (40%) who had a terminal condition. We found the NHPCO worksheets to be inflexible and incomplete due to the limited number of diagnoses covered. We identified patients who we believed were hospice eligible from a medical standpoint, but the charts did not have sufficient data to support the strict disease‐specific criteria in the NHPCO worksheets.
One final limitation was the fact that we only addressed whether a patient was eligible for hospice from a prognostic standpoint. We have no knowledge of patient and caregiver goals (due to a lack of documentation), so we were unable to determine if patient goals of care were congruent with the hospice philosophy. The patients who died at the hospital may have self‐selected as patients who desired more aggressive care. While it is ideal to discuss the patient's goals of treatment, hopes for quality of life, and the wishes of the family on a regular basis, in reality this discussion is not commonplace.25 These discussions can be difficult and time‐consuming, particularly in a large tertiary care center, and referral to hospice may be impacted by involvement of multiple subspecialty services who may provide organ‐specific care without a general overview of the patient's status.26, 27 In fact, when a patient receives a palliative‐care consult that focuses on the plan‐of‐care coordination and communication (not just symptom management), hospice referrals are increased.28, 29 This is supported by recent studies which reveal the importance of patient goals and advanced care planning in the timing and effectiveness of hospice referral, and patient goals would be important data to obtain in future studies.11, 30
FUTURE STUDIES
This study provides data detailing how often physicians miss opportunities to discuss an effective medical intervention, hospice, with appropriate hospitalized patients. The study also shows the feasibility of using the NHPCO worksheets to identify hospice‐eligible patients during an acute hospitalization. In addition, this study presents important information about the current culture and practice of medicine in regards to dying hospitalized patients. It contains the preliminary data necessary to design a prospective, randomized control trial with a targeted intervention to increase the rate of hospice referrals of eligible inpatients. Coordinating care and knowing when to discuss hospice as a treatment option would assist in aligning medical care with patient and family goals. Appropriately timed hospice discussions and referrals would lead to a decrease in the number of acute hospitalizations, decrease the 30‐day hospital readmission rates, lower healthcare expenses, and improve comfort while tending to the goals and emotional needs of patients and families at the end of life.
Acknowledgements
The authors thank John Hyman for his assistance with data analysis.
- ,,, et al.Family perspectives on end‐of‐life care at the last place of care.JAMA.2004;291(1):88–93.
- ,,.Hospice enrollment and pain assessment and management in nursing homes.J Pain Symptom Manage.2003;26(3):791–799.
- ,,,,.Does receipt of hospice care in nursing homes improve the management of pain at the end of life?J Am Geriatr Soc.2002;50(3):507–515.
- ,,, et al.Increased satisfaction with care and lower costs: results of a randomized trial of in‐home palliative care.J Am Geriatr Soc.2007;55(7):993–1000.
- ,,,,.Timing of hospice referral and families' perceptions of services: are earlier hospice referrals better?J Am Geriatr Soc.2005;53(5):819–823.
- ,.Barriers to physicians' decisions to discuss hospice: insights gained from the United States hospice model.J Eval Clin Pract.2003;9(3):363–372.
- ,,, et al.Physician factors associated with discussions about end‐of‐life care.Cancer.2010;116(4):998–1006.
- ,,,,,.Obstacles to palliation and end‐of‐life care in a long‐term care facility.Gerontologist.2002;42(3):342–349.
- ,.Extent and determinants of error in doctors' prognoses in terminally ill patients: prospective cohort study.BMJ.2000;320(7233):469–472.
- ,,, et al.Discussions with physicians about hospice among patients with metastatic lung cancer.Arch Intern Med.2009;169(10):954–962.
- ,,,,,.Improving the use of hospice services in nursing homes: a randomized controlled trial.JAMA.2005;294(2):211–217.
- ,,, et al.Associations between end‐of‐life discussions, patient mental health, medical care near death, and caregiver bereavement adjustment.JAMA.2008;300(14):1665–1673.
- Medical guidelines for determining prognosis in selected non‐cancer diseases.The National Hospice Organization.Hosp J.1996;11(2):47–63.
- ,,,,,.Evaluation of prognostic criteria for determining hospice eligibility in patients with advanced lung, heart, or liver disease. SUPPORT Investigators. Study to Understand Prognoses and Preferences for Outcomes and Risks of Treatments.JAMA.1999;282(17):1638–1645.
- ,,,,.Long and short hospice stays among nursing home residents at the end of life.J Palliat Med.2010;13(8):957–964.
- ,.Survival of Medicare patients after enrollment in hospice programs.N Engl J Med.1996;335(3):172–178.
- ,,,.Barriers to hospice care and referrals: survey of physicians' knowledge, attitudes, and perceptions in a health maintenance organization.J Palliat Med.2004;7(3):411–418.
- ,,, et al.Code status discussions and goals of care among hospitalised adults.J Med Ethics.2009;35(6):338–342.
- ,,,,,.Giving honest information to patients with advanced cancer maintains hope.Oncology (Williston Park).2010;24(6):521–525.
- ,,, et al.Impact of hospice disenrollment on health care use and Medicare expenditures for patients with cancer.J Clin Oncol.2010;28(28):4371–4375.
- ,,,,.What length of hospice use maximizes reduction in medical expenditures near death in the US Medicare program?Soc Sci Med.2007;65(7):1466–1478.
- ,,, et al.Health care costs in the last week of life: associations with end‐of‐life conversations.Arch Intern Med.2009;169(5):480–488.
- ,,,.Medicare cost in matched hospice and non‐hospice cohorts.J Pain Symptom Manage.2004;28(3):200–210.
- ,,,,,.Proactive palliative care in the medical intensive care unit: effects on length of stay for selected high‐risk patients.Crit Care Med.2007;35(6):1530–1535.
- ,,,,,.Timing of referral to hospice and quality of care: length of stay and bereaved family members' perceptions of the timing of hospice referral.J Pain Symptom Manage.2007;34(2):120–125.
- ,.Admission to intensive care unit at the end‐of‐life: is it an informed decision?Palliat Med.2004;18(8):705–711.
- ,.Factors contributing to late hospice admission and proposals for change.Am J Hosp Palliat Care.1997;14(5):212–218.
- ,,.Hospice referrals and code status: outcomes of inpatient palliative care consultations among Asian Americans and Pacific Islanders with cancer.J Pain Symptom Manage. April 22,2011.
- ,,, et al.Survival, mortality, and location of death for patients seen by a hospital‐based palliative care team.J Palliat Med.2006;9(4):903–911.
- ,,,,.Association between advance directives and quality of end‐of‐life care: a national study.J Am Geriatr Soc.2007;55(2):189–194.
Copyright © 2011 Society of Hospital Medicine
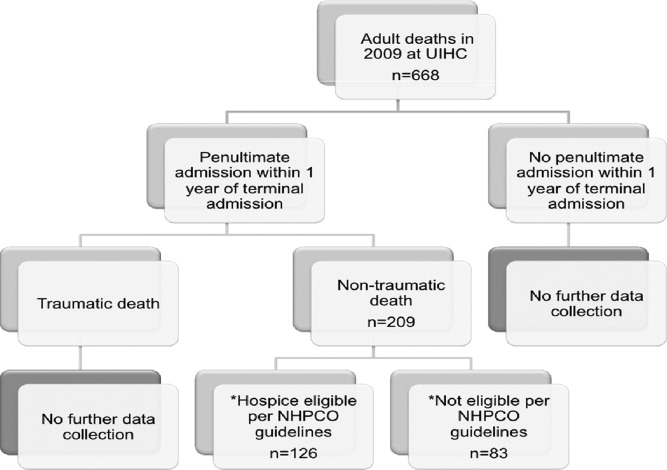
Diagnosis by Treatment
A 46‐year‐old Mexican woman with acquired immune deficiency syndrome (AIDS), admitted for 6 months of diarrhea and failure to thrive, developed acute shortness of breath following colonoscopy. She reported dyspnea in the recumbent position, associated with a nonproductive cough, which improved with elevation of the head of the bed. She denied chest pain, palpitations, lightheadedness, hemoptysis, abdominal pain, nausea, and fever.
The approach to acute shortness of breath in hospitalized patients should include evaluation for life‐threatening cardiopulmonary processes. The patient should be assessed for cardiopulmonary process, including myocardial infarction, pulmonary embolism, aortic dissection, congestive heart failure, unstable arrhythmias, cardiac tamponade, and pneumothorax. The presence of orthopnea does suggest pulmonary congestion and a cardiac process. Given the timing of her symptoms, there is also concern for complications related to the colonoscopy, including aspiration pneumonitis, bronchospasm due to ethylene glycol, and methemoglobinemia from benzocaine used during the procedure.
The patient had been admitted the prior day for 6 months of diarrhea, weight loss, and failure to thrive. On admission, she was afebrile with a blood pressure of 110/50 mmHg and a pulse of 110 beats per minute; electrocardiogram (EKG) at the time revealed normal sinus rhythm. Her oxygen saturation was 100% on ambient air, and she had no complaints of cough, fevers, or dyspnea.
On admission, a peripherally inserted central catheter (PICC) was placed and total parenteral nutrition (TPN) was initiated. A gastroenterology consult was obtained, and colonoscopy was recommended to evaluate the cause of her chronic diarrhea. Overnight, the patient was started on polyethylene glycol electrolyte solution, with nothing else by mouth, and initiation of maintenance intravenous normal saline at 50 ml/hr in addition to her TPN. The patient expressed difficulty completing the colonoscopy preparation, but her preparation was acceptable to proceed with the procedure. She denied fever, chills, abdominal pain, and respiratory symptoms. She was taken down to endoscopy where she underwent conscious sedation, followed by an uneventful colonoscopy with mucosal biopsies. She subsequently was transported back to her hospital room in the supine position and almost immediately began to complain of mild shortness of breath. No aspiration event was witnessed following her procedure and transport.
Considering the patient's chronic diarrhea, there may be a unifying cause of both the gastrointestinal (GI) and pulmonary symptoms. Possibilities include infectious causes (Toxoplasma gondii and Trypanosoma cruzi), infiltrative diseases (amyloidosis), and metabolic processes (hyperthyroidism). More specifically, T. cruzi can cause dilated cardiomyopathy, with subsequent congestive heart failure and associated pulmonary symptoms; furthermore, it can lead to a dilated colon with abnormal bowel movements. Opportunistic infections, including Microsporidia, Cryptosporidium, Mycobacterium avium complex (MAC), and cytomegalovirus (CMV) should be considered. MAC and CMV can present with non‐bloody diarrhea and evolve into respiratory illnesses. Lastly, human immunodeficiency virus (HIV) is known to involve multiple organ systems, including the heart and gastrointestinal tract. History of prior cardiac or pulmonary disease, CD4 count and viral load, use of antiretroviral and prophylactic medications, and recent travel should be obtained.
Thirteen years previously, the patient was diagnosed with HIV, and subsequently developed AIDS with thrush and uncomplicated CMV viremia. At that time, highly active antiretroviral therapy (HAART)was initiated, but she was intolerant of her medications and received therapy intermittently. Her past medical history included multiple fractures secondary to osteoporosis. She denied any history of respiratory or cardiac symptoms. The patient was born in rural Mexico and immigrated to the United States 20 years prior. Her last visit to Mexico occurred 2 months prior to admission, and 4 months following the development of chronic diarrhea. Previously, she worked as a housekeeper and was not aware of any toxic exposures during cleaning. She denied a history of alcohol or recreational drug use. Despite her generalized weakness, her baseline functional status included performing all activities of daily living without symptoms.
Over the prior 6 months, the patient had developed diffuse watery diarrhea, associated with a 20‐pound weight loss. Stool evaluation, 1 week prior, was negative for Clostridium difficile, Microsporidia, Isospora, Cryptosporidium, Escherichia coli, Campylobacter, and ova and parasites. Her CD4 count was 8 cells per cubic millimeter.
The low CD4 count predisposes the patient to all opportunistic infections. Considering the history of CMV viremia, there is likelihood of reactivation with viremia and colitis, leading to chronic diarrhea and pneumonia. Disseminated MAC infection is also a consideration and would account for wasting, diarrhea, and dyspnea. However, it is important to note that the acute onset of dyspnea is atypical for CMV and MAC infections.
On physical exam, she was a thin woman with temporal wasting, in mild respiratory distress. Her temperature was 37.3C, blood pressure 133/55 mmHg, heart rate 140 beats/min, respiratory rate 22 breaths/min, and oxygen saturation 89% on room air. Her oropharynx was clear and without acral cyanosis. Use of accessory muscles for breathing was noted. The trachea was midline and no lymphadenopathy or thyromegaly were present. Her jugular venous pulse was normal. Cardiac exam revealed tachycardia with a new S4 gallop. A prominent apical impulse was noted. No murmurs or rubs were appreciated. There was no pulsus paradoxus. Her radial, femoral, and dorsalis pedis pulses were 2+ without delay. Her lung exam revealed inspiratory crackles involving the lower one‐third of both lungs. The lower extremities revealed 2+ pitting edema to the knees. The rest of her exam, including her neurologic evaluation, was unremarkable.
These clinical findings are consistent with left‐sided heart failure, concerning for ischemic injury or structural disorders of the heart. It is possible that the patient has had progressive heart failure, which is now unmasked by the volume received with TPN and endoscopy. If the heart failure has been longstanding, one has to consider potential non‐ischemic causes of cardiomyopathy, including infectious etiologies such as HIV, Epstein‐Barr virus (EBV), coxsackie virus, CMV, Toxoplasma gondii, and Trypanosoma cruzi; alcohol‐associated; and pericardial disease with Mycobacterium tuberculosis (MTB). Toxoplasma should be evaluated if the patient has exposure to cats. Considering her country of origin and travel history, risk factors for trypanosomiasis and MTB should be assessed.
At this point, the patient's respiratory failure should be aggressively addressed. Supplemental oxygen should be administered. She should be evaluated for acute coronary syndrome with an EKG and serial cardiac enzymes. A chest x‐ray should be obtained to grossly evaluate for pulmonary, pericardial, and aortic illnesses. Brain natriuretic peptide (BNP) levels should also be sent. Considering the evidence of volume overload and her HIV status, liver function tests, serum electrolytes, and urinalysis should be sent to exclude liver and renal involvement.
The patient was placed on 2 liters of oxygen by nasal cannula with resolution of her symptoms and improvement in her oxygen saturation to 95%. An EKG demonstrated sinus tachycardia, without evidence of ischemia. Metabolic panel revealed sodium 134 mmol/L; potassium 4.3 mmol/L; chloride 105 mmol/L; bicarbonate 16 mmol/L; creatinine 0.6 mg/dL, and liver function tests were within normal limits. Her troponin level was within the normal range for a negative value, and BNP was 823 pg/ml (normal 100). The complete blood count demonstrated leukopenia and anemia (hemoglobin 9.8 g/dL), which were unchanged from admission. Urinalysis was negative. A portable chest x‐ray demonstrated vascular congestion and mild pulmonary edema, without evidence of pneumothorax or pleural effusion.
The significantly elevated BNP and pulmonary vascular congestion seen on chest x‐ray confirm the clinical diagnosis of heart failure. However, the negative troponin and unremarkable EKG suggest a non‐ischemic cause for her symptoms. An echocardiogram should be obtained with specific emphasis on the presence of valve regurgitation, pericardial effusion, and ventricular/atrial thickening consistent with infiltrative disorders. Thyroid stimulating hormone (TSH) and serologies for infectious agents, including, T. cruzi, HIV, CMV, and Toxoplasmosis gondii, should also be sent. The patient should receive intravenous loop diuretics to improve her cardiac dynamics and pulmonary edema.
Intravenous furosemide was administered. Her symptoms improved and oxygen saturation on room air was 92%. An echocardiogram revealed global hypokinesis with left ventricular ejection fraction (LVEF) of 35% to 40%. There was no evidence of an underlying valvular or infiltrative process. TSH was normal. T. cruzi antibodies were sent.
The echocardiogram did not reveal an underlying structural heart abnormality. Infiltrative cardiomyopathies do not typically demonstrate global hypokinesis on echocardiogram, particularly without evidence of ventricular wall thickening or increased echogenicity, that can be seen in amyloid and sarcoid cardiomyopathies. Therefore, infiltrative cardiomyopathy is unlikely to be a cause of this patient's heart failure. The rapid improvement of her symptoms with furosemide decreases the likelihood of infectious causes for her acute decompensation. In reviewing the patient's history, she had developed severe chronic diarrhea associated with poor oral intake and a 20‐pound weight loss prior to hospitalization. These symptoms, along with a history of osteoporosis at an early age without traditional risk factors, indicate a state of severe malnutrition, placing her at risk for thiamine deficiency. Checking the thiamine level would be appropriate.
Considering the patient's long history of malnutrition and negative infectious and ischemic evaluation, she was empirically treated for wet beriberi with thiamine supplementation through her TPN. A serum thiamine B1 was obtained prior to supplementation. A vitamin D 25OH level was also sent, which was 15 ng/mL (normal >30 ng/mL), further suggesting malnutrition.
The patient continued to improve and furosemide was discontinued. Her initial serum thiamine level was 49 nmol/L (reference range: 70‐180 nmol/L). A repeat echocardiogram 5 days later revealed resolution of her systolic dysfunction and regional wall motion abnormality. The LVEF improved to 60%. Her colonoscopy biopsies revealed evidence of HIV enteropathy and CMV inclusion bodies. Her CMV viral load was 1223 genomes/mL. The T. cruzi antibodies were negative. She was restarted on HAART and ganciclovir. She continued to have diarrhea and was discharged home with TPN. Her serum thiamine level at discharge was 123 nmol/L.
Heart failure due to thiamine deficiency, or wet beriberi, was diagnosed considering the rapid clinical improvement in cardiac function after initiating thiamine therapy. While HIV cardiomyopathy could have contributed to heart failure in this patient, it is unlikely to improve so significantly over such a brief period of time.
DISCUSSION
Beriberi is a disease caused by severe thiamine deficiency. In fact, thiamine, also known as vitamin B1, was first named the anti‐beriberi factor in 1926. However, the earliest descriptions of beriberi can be found in Chinese medical texts dating back to 2697 BC.1 Beriberi is most commonly seen in Asia, where the diet is high in polished rice and the thiamine‐containing rice germs and husks have been removed. In the United States, thiamine‐enriched bread has virtually abolished the disease, except in severely malnourished populations such as alcoholics, those on fad diets, and patients with chronic diarrhea. Beriberi may also occur in patients with altered intestinal absorption such as post‐bariatric surgery patients.2 In 1985, the first case of beriberi as a complication of TPN without vitamin supplementation was reported.3 Subsequent cases of Wernicke's encephalopathy and beriberi have been noted in patients with gastrointestinal diseases and malabsorption on chronic TPN. More recently, thiamine deficiency has also been recognized in patients on long‐term diuretic therapy, as diuretics increase urinary excretion of this water‐soluble vitamin.4, 5 Since there is limited tissue storage of thiamine and its biologic half‐life is 10 to 20 days, high‐risk patients can develop thiamine deficiency within 4 weeks of initiation of diuretic therapy.6
Beriberi is classically divided into 2 types: wet, characterized by congestive heart failure, and dry, manifested as a symmetric peripheral neuropathy with both sensory and motor impairments.7 These 2 types of beriberi can coexist in the same patient; however, it is unclear why both types occur in some patients and not in others. Wet beriberi, also known as beriberi cardiomyopathy, typically presents as high‐output heart failure secondary to vasodilation, with a compensatory increase in blood volume and tachycardia.8 This state eventually leads to myocardial injury with systolic dysfunction and development of a low‐output state.8 Patients experience hypotension, lactic acidosis, and eventually fulminant vascular collapse. Although minor EKG changes such as sinus tachycardia, low‐voltage ventricular complexes, QT prolongation, and biphasic or inverted T waves are not uncommon in beriberi cardiomyopathy, major EKG changes, such as ST segment elevations and tall or deeply inverted T waves, are rare. Similarly, troponin elevation in beriberi cardiomyopathy is uncommon, but has been described.6
The pathogenesis of heart failure in beriberi is multifactorial. Thiamine is required for glucose to enter the Krebs cycle for aerobic metabolism, serving as a catalyst in the conversion of pyruvate to acetyl‐CoA. Without thiamine, anaerobic metabolism occurs, leading to the development of lactic acidosis and cellular malfunction. In fact, severe metabolic acidosis with serum pH values as low as 6.70 have been reported in cases of fulminant beriberi (although it is unclear if the lactic acidosis is mostly from anaerobic metabolism or from the low‐output state ultimately caused by thiamine deficiency).3
Laboratory diagnosis of thiamine deficiency, based on measurements of thiamine stores and metabolites, is often fraught with error and therefore unreliable. Serum pyruvate and lactate levels are commonly measured, and while elevated levels may be sensitive for thiamine deficiency, they are nonspecific. Measurement of whole blood thiamine is easy and the test is widely available; however, a low blood thiamine concentration is not always a sensitive indicator of deficiency since less than 1% of total body thiamine is found in whole blood.9 Additionally, this value may also be artificially elevated by thiamine intake immediately preceding the measurement. Urinary thiamine excretion has been proposed as a more accurate measurement, but this laboratory test is also problematic since urinary thiamine excretion reflects dietary intake more than total body stores.9 Erythrocyte transketolase activity (ETKA) is a functional enzyme test in which transketolase uses thiamine pyrophosphate as a catalyzer. This may be a more reliable measurement since red blood cells are among the first cells to be affected by thiamine depletion.9 Although a low ETKA level often indicates thiamine deficiency, this test is influenced by the hemoglobin concentration, and it is not widely available. Thus, the diagnosis of wet beriberi is usually made on the basis of rapid response to thiamine replacement.
Similar to the patient discussed, the clinical improvement in wet beriberi occurs within hours of treatment. There is an initial elevation in blood pressure and resolution of acidosis, followed by decrease in heart rate and normalization of cardiac output. Overall cardiac function improves within 24 to 48 hours after treatment, and return to a normal hemodynamic condition often occurs within 2 weeks of the start of treatment.10
There are no well‐established guidelines for the treatment of patients with beriberi, but general recommendations are an initial loading dose of intravenous thiamine 100 to 500 mg followed by 25 to 100 mg orally for 7 to 14 days.1 Thereafter, the daily thiamine requirement can be calculated based upon total caloric intake. The current recommendations in the United States are 0.5 mg of thiamine per 1000 kcal.1 However, one must consider whether a patient has impaired intestinal absorption or increased urinary losses when determining an appropriate maintenance dose.
Chronic malnutrition can lead to significant morbidity and mortality. Prior to admission, this patient already exhibited signs of severe malnutrition with a history of multiple pathologic fractures and diagnosis of osteoporosis. Considering her age and lack of risk factors for bone disease, osteoporosis suggests vitamin D deficiency. In this patient with chronic diarrhea caused by CMV, it is unlikely that a selective absorptive deficiency would occur. When the common causes of acute heart failure following volume challenge were excluded, the diagnosis of thiamine deficiency became more likely. Fortunately, an empiric trial of intravenous thiamine resulted in diagnosis by treatment and improvement of her cardiac function.
The approach to clinical conundrums by an expert clinician is revealed through the presentation of an actual patient's case in an approach typical of a morning report. Similarly to patient care, sequential pieces of information are provided to the clinician, who is unfamiliar with the case. The focus is on the thought processes of both the clinical team caring for the patient and the discussant.
KEY TEACHING POINTS
-
Hospitalists should consider vitamin B1 deficiency in patients with chronic illness and malnutrition.
-
Diagnosis of wet beriberi based on laboratory values can be challenging and, therefore, high clinical suspicion should prompt immediate treatment with thiamine.
-
Congestive heart failure due to thiamine deficiency can be reversed with thiamine replacement.
- ,,, et al.Thiamin. Modern Nutrition in Health and Disease.9th ed.1999:381–389.
- ,,, et al.One‐year outcomes of Roux‐en‐Y gastric bypass for morbidly obese adolescents: a multicenter study from the Pediatric Bariatric Study Group.J Pediatr Surg.2006;41:137–143.
- ,,.Severe acute metabolic acidosis (acute beriberi): an avoidable complication of total parenteral nutrition.J Parenter Enteral Nutr.1985;9(2):216–219.
- ,,, et al.Urinary thiamine excretion in the rat: effects of furosemide, other diuretics, and volume load.J Lab Clin Med.1999;134:232–237.
- ,,, et al.Urinary loss of thiamine is increased by low doses of furosemide in healthy volunteers.J Lab ClinMed.1999;134:238–243.
- .Increased troponin I in “wet” beriberi.J Clin Pathol.2006;59(5):555.
- ,,, et al.Shoshin syndrome: two case reports representing opposite ends of the same disease spectrum.Acta Cardiol.1998;53:195.
- ,.The challenge of cardiomyopathy.J Am Coll Cardiol.1989;13:1219–1239.
- .Loop diuretic therapy, thiamine balance, and heart failure.Congest Heart Fail.2007;13(4):244–247.
- ,,.Cardiovascular beriberi.Am J Cardiol.1972;30:418–422.
A 46‐year‐old Mexican woman with acquired immune deficiency syndrome (AIDS), admitted for 6 months of diarrhea and failure to thrive, developed acute shortness of breath following colonoscopy. She reported dyspnea in the recumbent position, associated with a nonproductive cough, which improved with elevation of the head of the bed. She denied chest pain, palpitations, lightheadedness, hemoptysis, abdominal pain, nausea, and fever.
The approach to acute shortness of breath in hospitalized patients should include evaluation for life‐threatening cardiopulmonary processes. The patient should be assessed for cardiopulmonary process, including myocardial infarction, pulmonary embolism, aortic dissection, congestive heart failure, unstable arrhythmias, cardiac tamponade, and pneumothorax. The presence of orthopnea does suggest pulmonary congestion and a cardiac process. Given the timing of her symptoms, there is also concern for complications related to the colonoscopy, including aspiration pneumonitis, bronchospasm due to ethylene glycol, and methemoglobinemia from benzocaine used during the procedure.
The patient had been admitted the prior day for 6 months of diarrhea, weight loss, and failure to thrive. On admission, she was afebrile with a blood pressure of 110/50 mmHg and a pulse of 110 beats per minute; electrocardiogram (EKG) at the time revealed normal sinus rhythm. Her oxygen saturation was 100% on ambient air, and she had no complaints of cough, fevers, or dyspnea.
On admission, a peripherally inserted central catheter (PICC) was placed and total parenteral nutrition (TPN) was initiated. A gastroenterology consult was obtained, and colonoscopy was recommended to evaluate the cause of her chronic diarrhea. Overnight, the patient was started on polyethylene glycol electrolyte solution, with nothing else by mouth, and initiation of maintenance intravenous normal saline at 50 ml/hr in addition to her TPN. The patient expressed difficulty completing the colonoscopy preparation, but her preparation was acceptable to proceed with the procedure. She denied fever, chills, abdominal pain, and respiratory symptoms. She was taken down to endoscopy where she underwent conscious sedation, followed by an uneventful colonoscopy with mucosal biopsies. She subsequently was transported back to her hospital room in the supine position and almost immediately began to complain of mild shortness of breath. No aspiration event was witnessed following her procedure and transport.
Considering the patient's chronic diarrhea, there may be a unifying cause of both the gastrointestinal (GI) and pulmonary symptoms. Possibilities include infectious causes (Toxoplasma gondii and Trypanosoma cruzi), infiltrative diseases (amyloidosis), and metabolic processes (hyperthyroidism). More specifically, T. cruzi can cause dilated cardiomyopathy, with subsequent congestive heart failure and associated pulmonary symptoms; furthermore, it can lead to a dilated colon with abnormal bowel movements. Opportunistic infections, including Microsporidia, Cryptosporidium, Mycobacterium avium complex (MAC), and cytomegalovirus (CMV) should be considered. MAC and CMV can present with non‐bloody diarrhea and evolve into respiratory illnesses. Lastly, human immunodeficiency virus (HIV) is known to involve multiple organ systems, including the heart and gastrointestinal tract. History of prior cardiac or pulmonary disease, CD4 count and viral load, use of antiretroviral and prophylactic medications, and recent travel should be obtained.
Thirteen years previously, the patient was diagnosed with HIV, and subsequently developed AIDS with thrush and uncomplicated CMV viremia. At that time, highly active antiretroviral therapy (HAART)was initiated, but she was intolerant of her medications and received therapy intermittently. Her past medical history included multiple fractures secondary to osteoporosis. She denied any history of respiratory or cardiac symptoms. The patient was born in rural Mexico and immigrated to the United States 20 years prior. Her last visit to Mexico occurred 2 months prior to admission, and 4 months following the development of chronic diarrhea. Previously, she worked as a housekeeper and was not aware of any toxic exposures during cleaning. She denied a history of alcohol or recreational drug use. Despite her generalized weakness, her baseline functional status included performing all activities of daily living without symptoms.
Over the prior 6 months, the patient had developed diffuse watery diarrhea, associated with a 20‐pound weight loss. Stool evaluation, 1 week prior, was negative for Clostridium difficile, Microsporidia, Isospora, Cryptosporidium, Escherichia coli, Campylobacter, and ova and parasites. Her CD4 count was 8 cells per cubic millimeter.
The low CD4 count predisposes the patient to all opportunistic infections. Considering the history of CMV viremia, there is likelihood of reactivation with viremia and colitis, leading to chronic diarrhea and pneumonia. Disseminated MAC infection is also a consideration and would account for wasting, diarrhea, and dyspnea. However, it is important to note that the acute onset of dyspnea is atypical for CMV and MAC infections.
On physical exam, she was a thin woman with temporal wasting, in mild respiratory distress. Her temperature was 37.3C, blood pressure 133/55 mmHg, heart rate 140 beats/min, respiratory rate 22 breaths/min, and oxygen saturation 89% on room air. Her oropharynx was clear and without acral cyanosis. Use of accessory muscles for breathing was noted. The trachea was midline and no lymphadenopathy or thyromegaly were present. Her jugular venous pulse was normal. Cardiac exam revealed tachycardia with a new S4 gallop. A prominent apical impulse was noted. No murmurs or rubs were appreciated. There was no pulsus paradoxus. Her radial, femoral, and dorsalis pedis pulses were 2+ without delay. Her lung exam revealed inspiratory crackles involving the lower one‐third of both lungs. The lower extremities revealed 2+ pitting edema to the knees. The rest of her exam, including her neurologic evaluation, was unremarkable.
These clinical findings are consistent with left‐sided heart failure, concerning for ischemic injury or structural disorders of the heart. It is possible that the patient has had progressive heart failure, which is now unmasked by the volume received with TPN and endoscopy. If the heart failure has been longstanding, one has to consider potential non‐ischemic causes of cardiomyopathy, including infectious etiologies such as HIV, Epstein‐Barr virus (EBV), coxsackie virus, CMV, Toxoplasma gondii, and Trypanosoma cruzi; alcohol‐associated; and pericardial disease with Mycobacterium tuberculosis (MTB). Toxoplasma should be evaluated if the patient has exposure to cats. Considering her country of origin and travel history, risk factors for trypanosomiasis and MTB should be assessed.
At this point, the patient's respiratory failure should be aggressively addressed. Supplemental oxygen should be administered. She should be evaluated for acute coronary syndrome with an EKG and serial cardiac enzymes. A chest x‐ray should be obtained to grossly evaluate for pulmonary, pericardial, and aortic illnesses. Brain natriuretic peptide (BNP) levels should also be sent. Considering the evidence of volume overload and her HIV status, liver function tests, serum electrolytes, and urinalysis should be sent to exclude liver and renal involvement.
The patient was placed on 2 liters of oxygen by nasal cannula with resolution of her symptoms and improvement in her oxygen saturation to 95%. An EKG demonstrated sinus tachycardia, without evidence of ischemia. Metabolic panel revealed sodium 134 mmol/L; potassium 4.3 mmol/L; chloride 105 mmol/L; bicarbonate 16 mmol/L; creatinine 0.6 mg/dL, and liver function tests were within normal limits. Her troponin level was within the normal range for a negative value, and BNP was 823 pg/ml (normal 100). The complete blood count demonstrated leukopenia and anemia (hemoglobin 9.8 g/dL), which were unchanged from admission. Urinalysis was negative. A portable chest x‐ray demonstrated vascular congestion and mild pulmonary edema, without evidence of pneumothorax or pleural effusion.
The significantly elevated BNP and pulmonary vascular congestion seen on chest x‐ray confirm the clinical diagnosis of heart failure. However, the negative troponin and unremarkable EKG suggest a non‐ischemic cause for her symptoms. An echocardiogram should be obtained with specific emphasis on the presence of valve regurgitation, pericardial effusion, and ventricular/atrial thickening consistent with infiltrative disorders. Thyroid stimulating hormone (TSH) and serologies for infectious agents, including, T. cruzi, HIV, CMV, and Toxoplasmosis gondii, should also be sent. The patient should receive intravenous loop diuretics to improve her cardiac dynamics and pulmonary edema.
Intravenous furosemide was administered. Her symptoms improved and oxygen saturation on room air was 92%. An echocardiogram revealed global hypokinesis with left ventricular ejection fraction (LVEF) of 35% to 40%. There was no evidence of an underlying valvular or infiltrative process. TSH was normal. T. cruzi antibodies were sent.
The echocardiogram did not reveal an underlying structural heart abnormality. Infiltrative cardiomyopathies do not typically demonstrate global hypokinesis on echocardiogram, particularly without evidence of ventricular wall thickening or increased echogenicity, that can be seen in amyloid and sarcoid cardiomyopathies. Therefore, infiltrative cardiomyopathy is unlikely to be a cause of this patient's heart failure. The rapid improvement of her symptoms with furosemide decreases the likelihood of infectious causes for her acute decompensation. In reviewing the patient's history, she had developed severe chronic diarrhea associated with poor oral intake and a 20‐pound weight loss prior to hospitalization. These symptoms, along with a history of osteoporosis at an early age without traditional risk factors, indicate a state of severe malnutrition, placing her at risk for thiamine deficiency. Checking the thiamine level would be appropriate.
Considering the patient's long history of malnutrition and negative infectious and ischemic evaluation, she was empirically treated for wet beriberi with thiamine supplementation through her TPN. A serum thiamine B1 was obtained prior to supplementation. A vitamin D 25OH level was also sent, which was 15 ng/mL (normal >30 ng/mL), further suggesting malnutrition.
The patient continued to improve and furosemide was discontinued. Her initial serum thiamine level was 49 nmol/L (reference range: 70‐180 nmol/L). A repeat echocardiogram 5 days later revealed resolution of her systolic dysfunction and regional wall motion abnormality. The LVEF improved to 60%. Her colonoscopy biopsies revealed evidence of HIV enteropathy and CMV inclusion bodies. Her CMV viral load was 1223 genomes/mL. The T. cruzi antibodies were negative. She was restarted on HAART and ganciclovir. She continued to have diarrhea and was discharged home with TPN. Her serum thiamine level at discharge was 123 nmol/L.
Heart failure due to thiamine deficiency, or wet beriberi, was diagnosed considering the rapid clinical improvement in cardiac function after initiating thiamine therapy. While HIV cardiomyopathy could have contributed to heart failure in this patient, it is unlikely to improve so significantly over such a brief period of time.
DISCUSSION
Beriberi is a disease caused by severe thiamine deficiency. In fact, thiamine, also known as vitamin B1, was first named the anti‐beriberi factor in 1926. However, the earliest descriptions of beriberi can be found in Chinese medical texts dating back to 2697 BC.1 Beriberi is most commonly seen in Asia, where the diet is high in polished rice and the thiamine‐containing rice germs and husks have been removed. In the United States, thiamine‐enriched bread has virtually abolished the disease, except in severely malnourished populations such as alcoholics, those on fad diets, and patients with chronic diarrhea. Beriberi may also occur in patients with altered intestinal absorption such as post‐bariatric surgery patients.2 In 1985, the first case of beriberi as a complication of TPN without vitamin supplementation was reported.3 Subsequent cases of Wernicke's encephalopathy and beriberi have been noted in patients with gastrointestinal diseases and malabsorption on chronic TPN. More recently, thiamine deficiency has also been recognized in patients on long‐term diuretic therapy, as diuretics increase urinary excretion of this water‐soluble vitamin.4, 5 Since there is limited tissue storage of thiamine and its biologic half‐life is 10 to 20 days, high‐risk patients can develop thiamine deficiency within 4 weeks of initiation of diuretic therapy.6
Beriberi is classically divided into 2 types: wet, characterized by congestive heart failure, and dry, manifested as a symmetric peripheral neuropathy with both sensory and motor impairments.7 These 2 types of beriberi can coexist in the same patient; however, it is unclear why both types occur in some patients and not in others. Wet beriberi, also known as beriberi cardiomyopathy, typically presents as high‐output heart failure secondary to vasodilation, with a compensatory increase in blood volume and tachycardia.8 This state eventually leads to myocardial injury with systolic dysfunction and development of a low‐output state.8 Patients experience hypotension, lactic acidosis, and eventually fulminant vascular collapse. Although minor EKG changes such as sinus tachycardia, low‐voltage ventricular complexes, QT prolongation, and biphasic or inverted T waves are not uncommon in beriberi cardiomyopathy, major EKG changes, such as ST segment elevations and tall or deeply inverted T waves, are rare. Similarly, troponin elevation in beriberi cardiomyopathy is uncommon, but has been described.6
The pathogenesis of heart failure in beriberi is multifactorial. Thiamine is required for glucose to enter the Krebs cycle for aerobic metabolism, serving as a catalyst in the conversion of pyruvate to acetyl‐CoA. Without thiamine, anaerobic metabolism occurs, leading to the development of lactic acidosis and cellular malfunction. In fact, severe metabolic acidosis with serum pH values as low as 6.70 have been reported in cases of fulminant beriberi (although it is unclear if the lactic acidosis is mostly from anaerobic metabolism or from the low‐output state ultimately caused by thiamine deficiency).3
Laboratory diagnosis of thiamine deficiency, based on measurements of thiamine stores and metabolites, is often fraught with error and therefore unreliable. Serum pyruvate and lactate levels are commonly measured, and while elevated levels may be sensitive for thiamine deficiency, they are nonspecific. Measurement of whole blood thiamine is easy and the test is widely available; however, a low blood thiamine concentration is not always a sensitive indicator of deficiency since less than 1% of total body thiamine is found in whole blood.9 Additionally, this value may also be artificially elevated by thiamine intake immediately preceding the measurement. Urinary thiamine excretion has been proposed as a more accurate measurement, but this laboratory test is also problematic since urinary thiamine excretion reflects dietary intake more than total body stores.9 Erythrocyte transketolase activity (ETKA) is a functional enzyme test in which transketolase uses thiamine pyrophosphate as a catalyzer. This may be a more reliable measurement since red blood cells are among the first cells to be affected by thiamine depletion.9 Although a low ETKA level often indicates thiamine deficiency, this test is influenced by the hemoglobin concentration, and it is not widely available. Thus, the diagnosis of wet beriberi is usually made on the basis of rapid response to thiamine replacement.
Similar to the patient discussed, the clinical improvement in wet beriberi occurs within hours of treatment. There is an initial elevation in blood pressure and resolution of acidosis, followed by decrease in heart rate and normalization of cardiac output. Overall cardiac function improves within 24 to 48 hours after treatment, and return to a normal hemodynamic condition often occurs within 2 weeks of the start of treatment.10
There are no well‐established guidelines for the treatment of patients with beriberi, but general recommendations are an initial loading dose of intravenous thiamine 100 to 500 mg followed by 25 to 100 mg orally for 7 to 14 days.1 Thereafter, the daily thiamine requirement can be calculated based upon total caloric intake. The current recommendations in the United States are 0.5 mg of thiamine per 1000 kcal.1 However, one must consider whether a patient has impaired intestinal absorption or increased urinary losses when determining an appropriate maintenance dose.
Chronic malnutrition can lead to significant morbidity and mortality. Prior to admission, this patient already exhibited signs of severe malnutrition with a history of multiple pathologic fractures and diagnosis of osteoporosis. Considering her age and lack of risk factors for bone disease, osteoporosis suggests vitamin D deficiency. In this patient with chronic diarrhea caused by CMV, it is unlikely that a selective absorptive deficiency would occur. When the common causes of acute heart failure following volume challenge were excluded, the diagnosis of thiamine deficiency became more likely. Fortunately, an empiric trial of intravenous thiamine resulted in diagnosis by treatment and improvement of her cardiac function.
The approach to clinical conundrums by an expert clinician is revealed through the presentation of an actual patient's case in an approach typical of a morning report. Similarly to patient care, sequential pieces of information are provided to the clinician, who is unfamiliar with the case. The focus is on the thought processes of both the clinical team caring for the patient and the discussant.
KEY TEACHING POINTS
-
Hospitalists should consider vitamin B1 deficiency in patients with chronic illness and malnutrition.
-
Diagnosis of wet beriberi based on laboratory values can be challenging and, therefore, high clinical suspicion should prompt immediate treatment with thiamine.
-
Congestive heart failure due to thiamine deficiency can be reversed with thiamine replacement.
- ,,, et al.Thiamin. Modern Nutrition in Health and Disease.9th ed.1999:381–389.
- ,,, et al.One‐year outcomes of Roux‐en‐Y gastric bypass for morbidly obese adolescents: a multicenter study from the Pediatric Bariatric Study Group.J Pediatr Surg.2006;41:137–143.
- ,,.Severe acute metabolic acidosis (acute beriberi): an avoidable complication of total parenteral nutrition.J Parenter Enteral Nutr.1985;9(2):216–219.
- ,,, et al.Urinary thiamine excretion in the rat: effects of furosemide, other diuretics, and volume load.J Lab Clin Med.1999;134:232–237.
- ,,, et al.Urinary loss of thiamine is increased by low doses of furosemide in healthy volunteers.J Lab ClinMed.1999;134:238–243.
- .Increased troponin I in “wet” beriberi.J Clin Pathol.2006;59(5):555.
- ,,, et al.Shoshin syndrome: two case reports representing opposite ends of the same disease spectrum.Acta Cardiol.1998;53:195.
- ,.The challenge of cardiomyopathy.J Am Coll Cardiol.1989;13:1219–1239.
- .Loop diuretic therapy, thiamine balance, and heart failure.Congest Heart Fail.2007;13(4):244–247.
- ,,.Cardiovascular beriberi.Am J Cardiol.1972;30:418–422.
Weight Loss Modest With Primary Care Program
Enhanced brief lifestyle counseling by a primary care team helped about one-third of obese patients lose and keep off 5% or more of their baseline weight after 2 years, according to a study published online Nov. 14 in the New England Journal of Medicine and simultaneously presented at the annual meeting of the American Heart Association.
However, many of the patients during the study’s second year regained at least some of the lost weight, confirming "the problem of weight regain despite ongoing counseling for weight-loss maintenance," the study’s authors noted.
The intervention involved quarterly visits with a primary care physician, brief lifestyle coaching delivered monthly by a medical assistant, and the use of meal replacements or weight-loss medication.
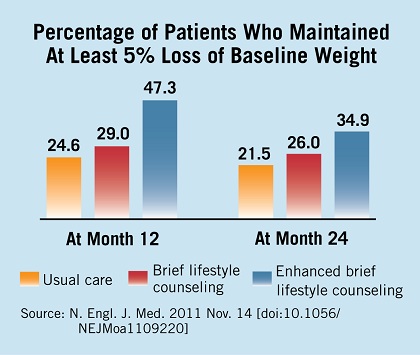
The average weight loss of 4.7%, most of which was maintained for 2 years and was accompanied by improvements in some cardiovascular risk factors, was greater than that observed in other primary care trials, said Thomas A. Wadden, Ph.D., of the department of psychiatry at the University of Pennsylvania, Philadelphia, and his associates (N. Engl. J. Med. 2011 Nov. 14 [doi:10.1056/NEJMoa1109220]).
The results of the 2-year study of 390 obese patients demonstrate that "primary care physicians could help a considerable minority of obese persons achieve clinically meaningful weight loss, which they may not achieve if they were simply told to reduce their weight on their own," the investigators noted.
Dr. Wadden and his colleagues conducted the POWER-UP (Practice-based Opportunities for Weight Reduction trial at the University of Pennsylvania) study at three primary care practices in urban settings and three in suburban settings. A total of 30 primary care physicians took part.
The study enrolled 311 women and 79 men, with a mean age of 52 years, a mean body weight of 108 kg, and a mean body mass index of 39 kg/m2 at baseline. By patient self-report, approximately 59% were white, 38.5% were black, and 4.6% were Hispanic.
The study participants all had the same dietary and activity goals but were given different levels of support to achieve them.
All were instructed to gradually increase their physical activity to 180 min/wk. Those who weighed less than 113 kg were prescribed a diet of 1,200-1,500 kcal/day, while those who were heavier were prescribed 1,500-1,800 kcal/day.
A total of 130 patients were randomly assigned to receive usual care, which consisted of quarterly visits in which their primary care physician spent 5-7 minutes discussing the weight-loss information and reviewing any weight change.
Another 131 were randomly assigned to that same care plus brief lifestyle counseling, in which they spent 10-15 min/mo with a medical assistant, called a "lifestyle coach," who conducted a weigh-in, reviewed a diary of food intake, reviewed a physical activity diary, and delivered abbreviated lessons from the Diabetes Prevention Program.
Another 129 patients were randomly assigned to receive enhanced lifestyle counseling, which included that same intervention plus their choice of taking sibutramine, orlistat, or meal replacements under the guidance of the primary care physician. Sibutramine was withdrawn from the market during the trial, and patients in that group were switched to orlistat or meal replacements.
Patients taking meal replacements were instructed to substitute two meals and one snack every day with Slim-Fast shakes or meal bars for the first 4 months, and to replace one meal and one snack each day for the remainder of the study.
The primary outcome was weight loss at 2 years. Enhanced lifestyle counseling produced significantly greater weight loss (mean, 4.6 kg) than either lifestyle counseling (2.9 kg) or usual care (1.7 kg). Within the group receiving enhanced lifestyle counseling, there were no significant differences in weight loss among those taking meal replacements (67 patients), sibutramine (38 patients), or orlistat (24 patients).
The differences among the groups were first evident at 6 months, and maximal weight loss was achieved at 12 months. Between year 1 and year 2, however, most patients regained at least some of the weight they had lost.
Secondary outcomes also were significantly better in the group that received enhanced lifestyle counseling than in the usual-care group, including the percentage of patients whose weight was at or below their baseline weight at 1 year (72.1% vs. 59.2%) and 2 years (67.4% vs. 53.1%); the percentages who lost 5% or more of their baseline weight at 1 year (47.3% vs. 24.6%) and 2 years (34.9% vs. 21.5%); and the percentages who lost 10% or more of their baseline weight at 1 year (25.6% vs. 3.9%) and 2 years (17.8% vs. 6.2%).
Patients who received enhanced lifestyle counseling showed significantly greater improvements in waist circumference, HDL cholesterol levels, and triglyceride levels, but not in LDL cholesterol levels or blood pressure.
There were 73 hospitalizations for severe adverse events, with no significant differences among the three study groups. Only three such events were deemed to be possibly related to the intervention: two cholecystectomies, and one case of syncope. In addition, sibutramine was discontinued in seven patients because of blood pressure elevation, tachycardia, or anxiety; and orlistat was discontinued in five patients because of gastrointestinal symptoms.
"Although our study has shown that primary care personnel can provide effective weight-management support, it has not addressed the more challenging question of who will pay for these or related weight-loss interventions," the researchers noted.
The National Heart, Lung, and Blood Institute funded the study. Dr. Wadden reported ties to Novo Nordisk, Orexigen, Vivus, Nutrisystem, Guilford Press, and the Cardiometabolic Support Network. His associates reported ties to numerous industry sources. Orlistat and Slim-Fast products were provided free of charge by the manufacturers, GlaxoSmithKline and Unilever.
Enhanced brief lifestyle counseling by a primary care team helped about one-third of obese patients lose and keep off 5% or more of their baseline weight after 2 years, according to a study published online Nov. 14 in the New England Journal of Medicine and simultaneously presented at the annual meeting of the American Heart Association.
However, many of the patients during the study’s second year regained at least some of the lost weight, confirming "the problem of weight regain despite ongoing counseling for weight-loss maintenance," the study’s authors noted.
The intervention involved quarterly visits with a primary care physician, brief lifestyle coaching delivered monthly by a medical assistant, and the use of meal replacements or weight-loss medication.
The average weight loss of 4.7%, most of which was maintained for 2 years and was accompanied by improvements in some cardiovascular risk factors, was greater than that observed in other primary care trials, said Thomas A. Wadden, Ph.D., of the department of psychiatry at the University of Pennsylvania, Philadelphia, and his associates (N. Engl. J. Med. 2011 Nov. 14 [doi:10.1056/NEJMoa1109220]).
The results of the 2-year study of 390 obese patients demonstrate that "primary care physicians could help a considerable minority of obese persons achieve clinically meaningful weight loss, which they may not achieve if they were simply told to reduce their weight on their own," the investigators noted.
Dr. Wadden and his colleagues conducted the POWER-UP (Practice-based Opportunities for Weight Reduction trial at the University of Pennsylvania) study at three primary care practices in urban settings and three in suburban settings. A total of 30 primary care physicians took part.
The study enrolled 311 women and 79 men, with a mean age of 52 years, a mean body weight of 108 kg, and a mean body mass index of 39 kg/m2 at baseline. By patient self-report, approximately 59% were white, 38.5% were black, and 4.6% were Hispanic.
The study participants all had the same dietary and activity goals but were given different levels of support to achieve them.
All were instructed to gradually increase their physical activity to 180 min/wk. Those who weighed less than 113 kg were prescribed a diet of 1,200-1,500 kcal/day, while those who were heavier were prescribed 1,500-1,800 kcal/day.
A total of 130 patients were randomly assigned to receive usual care, which consisted of quarterly visits in which their primary care physician spent 5-7 minutes discussing the weight-loss information and reviewing any weight change.
Another 131 were randomly assigned to that same care plus brief lifestyle counseling, in which they spent 10-15 min/mo with a medical assistant, called a "lifestyle coach," who conducted a weigh-in, reviewed a diary of food intake, reviewed a physical activity diary, and delivered abbreviated lessons from the Diabetes Prevention Program.
Another 129 patients were randomly assigned to receive enhanced lifestyle counseling, which included that same intervention plus their choice of taking sibutramine, orlistat, or meal replacements under the guidance of the primary care physician. Sibutramine was withdrawn from the market during the trial, and patients in that group were switched to orlistat or meal replacements.
Patients taking meal replacements were instructed to substitute two meals and one snack every day with Slim-Fast shakes or meal bars for the first 4 months, and to replace one meal and one snack each day for the remainder of the study.
The primary outcome was weight loss at 2 years. Enhanced lifestyle counseling produced significantly greater weight loss (mean, 4.6 kg) than either lifestyle counseling (2.9 kg) or usual care (1.7 kg). Within the group receiving enhanced lifestyle counseling, there were no significant differences in weight loss among those taking meal replacements (67 patients), sibutramine (38 patients), or orlistat (24 patients).
The differences among the groups were first evident at 6 months, and maximal weight loss was achieved at 12 months. Between year 1 and year 2, however, most patients regained at least some of the weight they had lost.
Secondary outcomes also were significantly better in the group that received enhanced lifestyle counseling than in the usual-care group, including the percentage of patients whose weight was at or below their baseline weight at 1 year (72.1% vs. 59.2%) and 2 years (67.4% vs. 53.1%); the percentages who lost 5% or more of their baseline weight at 1 year (47.3% vs. 24.6%) and 2 years (34.9% vs. 21.5%); and the percentages who lost 10% or more of their baseline weight at 1 year (25.6% vs. 3.9%) and 2 years (17.8% vs. 6.2%).
Patients who received enhanced lifestyle counseling showed significantly greater improvements in waist circumference, HDL cholesterol levels, and triglyceride levels, but not in LDL cholesterol levels or blood pressure.
There were 73 hospitalizations for severe adverse events, with no significant differences among the three study groups. Only three such events were deemed to be possibly related to the intervention: two cholecystectomies, and one case of syncope. In addition, sibutramine was discontinued in seven patients because of blood pressure elevation, tachycardia, or anxiety; and orlistat was discontinued in five patients because of gastrointestinal symptoms.
"Although our study has shown that primary care personnel can provide effective weight-management support, it has not addressed the more challenging question of who will pay for these or related weight-loss interventions," the researchers noted.
The National Heart, Lung, and Blood Institute funded the study. Dr. Wadden reported ties to Novo Nordisk, Orexigen, Vivus, Nutrisystem, Guilford Press, and the Cardiometabolic Support Network. His associates reported ties to numerous industry sources. Orlistat and Slim-Fast products were provided free of charge by the manufacturers, GlaxoSmithKline and Unilever.
FROM THE NEW ENGLAND JOURNAL OF MEDICINE
Major Finding: Enhanced lifestyle counseling produced significantly greater weight loss (mean, 4.6 kg) than did either brief lifestyle counseling (2.9 kg) or usual care (1.7 kg).
Data Source: A randomized clinical trial comparing weight loss in 390 obese patients after 2 years of usual care, brief lifestyle counseling, and enhanced lifestyle counseling delivered by a primary care physician and staff medical assistants.
Disclosures: The study was supported by the National Heart, Lung, and Blood Institute. Dr. Wadden reported ties to Novo Nordisk, Orexigen, Vivus, Nutrisystem, Guilford Press, and the Cardiometabolic Support Network. His associates reported ties to numerous industry sources. Orlistat and Slim-Fast products were provided free of charge by the manufacturers, GlaxoSmithKline and Unilever.
Novel Therapies Put Multiple Myeloma 'On the Ropes'
SAN FRANCISCO – A sweep of new agents are poised to deliver what could be a knock-out blow to multiple myeloma, according to the director of the myeloma program at the University of California, San Francisco.
Some are second- or third-generation agents in a mainstay class that appear to have less toxicity than and/or overcome resistance to their predecessors, Dr. Jeffrey L. Wolf said at the annual Oncology Congress here. Others come from classes not previously used in this disease.

"There is a rush to develop new drugs in myeloma," Dr. Wolf told attendees. "We [understand] some mechanisms that the disease seems to favor, so we can interfere with those."
The prospects, in turn, are excellent: "We have made such tremendous headway in myeloma, except for those exceptional cases with 17p deletions and some other adverse prognostic features," he said. "As a disease, it seems to be on the ropes."
A Less-Toxic Proteasome Inhibitor
The first-generation proteasome inhibitor bortezomib (Velcade) improves myeloma outcomes, but maximizing its benefit will require addressing the peripheral neuropathy that limits its use. Three strategies may lessen this toxicity without compromising efficacy, Dr. Wolf suggested: modestly reducing the standard dose, adjusting the schedule from twice to once weekly, and altering the route of administration from intravenous to subcutaneous.
For example, in patients with pretreated myeloma, giving bortezomib subcutaneously instead of intravenously results in an identical overall response rate of 52% (Lancet Oncol. 2011;12:431-40). But there are significant reductions in rates of peripheral neuropathy of any grade (38% vs. 53%) and grade 3 or higher (6% vs. 16%).
"Practically everybody that we see now at UCSF gets subcutaneous [bortezomib]," Dr. Wolf said. It’s a great way to go back and treat patients who maybe otherwise have stopped their therapy because of their neuropathy."
Carfilzomib, an investigational next-generation proteasome inhibitor in phase III trials, is showing good antimyeloma activity and a low rate of peripheral neuropathy. Among patients with pretreated, relapsed, or refractory disease, carfilzomib monotherapy achieved overall response rates of 42% to 53% in a bortezomib-naive group (ASCO 2011 annual meeting. Abstract 8026) and 21% in a bortezomib-exposed group (Haematologica 2010;95:452 Abstract 1099). Median time to progression was at least 8 months for both.
Dr. Wolf said that unpublished data suggest that the response rate was still 17% specifically among patients who had had progression on bortezomib, "so there appears to be some activity in patients who are already refractory to a prior proteasome inhibitor."
Meanwhile, the rates of grade 1/2 and grade 3 peripheral neuropathy were 6% and 1%, respectively. And only a single patient of the 155 had to stop treatment because of this adverse effect.
When carfilzomib is combined with lenalidomide-dexamethasone (the so-called CRd regimen), the overall response rate in patients with pretreated, relapsed, and refractory disease is 78%, and the rate of complete or near complete response is 24% (ASCO 2011 meeting. Abstract 8025).
And, in newly diagnosed myeloma, among 18 patients receiving eight cycles of CRd, the overall response rate was 100%, and the rate of stringent-complete, complete, or near-complete response was 61% (2011 International Myeloma Workshop. Poster P-253). "This is very, very exciting—I don’t think we’ve seen this in any other combination," Dr. Wolf commented. "But these are small numbers of patients; we still need to increase the numbers of patients studied with this combination."
Bortezomib and carfilzomib may soon have company from several investigational proteasome inhibitors available in oral formulations that have shown promise in preclinical testing or have advanced to clinical trials: CEP-18770 (Cephalon), ONX-0912 (Onyx), and MLN-9708 (Millenium).
A Third-Generation IMiD in Trials
Pomalidomide, a third-generation immunomodulatory drug (IMiD), coming after thalidomide (Thalomid), and lenalidomide (Revlimid), is also showing good antimyeloma activity in clinical trials, according to Dr. Wolf.
Among patients with pretreated myeloma, the rate of partial or better response when pomalidomide is combined with dexamethasone has ranged from 25% to 42%, depending on the trial and patient population. Adverse events are primarily hematologic.
And in patients who have previously received lenalidomide, the response rate is similar, at 35% (ASCO 2011 annual meeting. Abstract 8067). "So, as with carfilzomib, where there appear to be responses in patients who have prior resistance to bortezomib, it appears that pomalidomide can give us responses in patients who have already had resistance to lenalidomide," he said.
HDAC Inhibitors Show Activity
The histone deacetylase (HDAC) inhibitor vorinostat (Zolinza) is approved for treatment of lymphoma. But it is being tested in clinical trials for myeloma, in combination therapy, with promising results, according to Dr. Wolf. Overall response rates have ranged from 40% to 94%, depending on the patient population and combination.
Similarly, the HDAC inhibitor romidepsin (Istodax) is approved for lymphoma treatment but is also being studied for antimyeloma activity. And panobinostat, an investigational member of this drug class, is being evaluated as a component of combination therapy in phase II and III myeloma trials.
Monoclonal Antibodies Tested
Elotuzumab is an investigational monoclonal antibody directed against CS1, a glycoprotein that is highly expressed on the surface of plasma cells and implicated in myeloma pathogenesis.
In a phase I trial among patients with relapsed or refractory myeloma, the combination of elotuzumab with lenalidomide and low-dose dexamethasone yielded an overall response rate of 82% (ASCO 2011 meeting. Abstract 8076). The rate was 83% among the subset of patients whose disease was refractory to the most recent therapy and 95% among the subset of lenalidomide-naive patients.
The combination of elotuzumab with bortezomib has also been tested in patients with relapsed or refractory myeloma. But the overall response rate with this combination was less impressive, at 48% (ASH 2010 meeting. Abstract 3023).
Other Agents and Pathways
Several other agents are being eyed for roles in myeloma therapy as well. They include bendamustine (Treanda), an old drug initially revived for lymphoma treatment; aurora kinase inhibitors (for example, MLN-8237); and inhibitors of the mammalian target of rapamycin, or mTOR (for example, INK-128).
Additionally, there is considerable interest in agents that target fibroblast growth factor receptor 3 (FGFR3) for one subgroup. "In patients with the 4;14 translocation, FGFR3 is overexpressed," Dr. Wolf explained. "Finding an inhibitor for that or a direct antibody ... may be quite effective in those patients."
Investigators are also assessing the impact of targeting certain signaling pathways, such as the Jak/Stat pathway and the AKT pathway. For instance, a phase III trial is testing perifosine, an investigational AKT inhibitor, in combination therapy among patients with relapsed or refractory myeloma (NCT01002248).
The Oncology Congress is presented by Reed Medical Education. Reed Medical Education and this news organization are owned by Reed Elsevier Inc.
Dr. Wolf disclosed that he is on the speakers bureaus of Millenium, Celgene, and Ortho-Biotech, and is a consultant to and speaker for Onyx.
SAN FRANCISCO – A sweep of new agents are poised to deliver what could be a knock-out blow to multiple myeloma, according to the director of the myeloma program at the University of California, San Francisco.
Some are second- or third-generation agents in a mainstay class that appear to have less toxicity than and/or overcome resistance to their predecessors, Dr. Jeffrey L. Wolf said at the annual Oncology Congress here. Others come from classes not previously used in this disease.
"There is a rush to develop new drugs in myeloma," Dr. Wolf told attendees. "We [understand] some mechanisms that the disease seems to favor, so we can interfere with those."
The prospects, in turn, are excellent: "We have made such tremendous headway in myeloma, except for those exceptional cases with 17p deletions and some other adverse prognostic features," he said. "As a disease, it seems to be on the ropes."
A Less-Toxic Proteasome Inhibitor
The first-generation proteasome inhibitor bortezomib (Velcade) improves myeloma outcomes, but maximizing its benefit will require addressing the peripheral neuropathy that limits its use. Three strategies may lessen this toxicity without compromising efficacy, Dr. Wolf suggested: modestly reducing the standard dose, adjusting the schedule from twice to once weekly, and altering the route of administration from intravenous to subcutaneous.
For example, in patients with pretreated myeloma, giving bortezomib subcutaneously instead of intravenously results in an identical overall response rate of 52% (Lancet Oncol. 2011;12:431-40). But there are significant reductions in rates of peripheral neuropathy of any grade (38% vs. 53%) and grade 3 or higher (6% vs. 16%).
"Practically everybody that we see now at UCSF gets subcutaneous [bortezomib]," Dr. Wolf said. It’s a great way to go back and treat patients who maybe otherwise have stopped their therapy because of their neuropathy."
Carfilzomib, an investigational next-generation proteasome inhibitor in phase III trials, is showing good antimyeloma activity and a low rate of peripheral neuropathy. Among patients with pretreated, relapsed, or refractory disease, carfilzomib monotherapy achieved overall response rates of 42% to 53% in a bortezomib-naive group (ASCO 2011 annual meeting. Abstract 8026) and 21% in a bortezomib-exposed group (Haematologica 2010;95:452 Abstract 1099). Median time to progression was at least 8 months for both.
Dr. Wolf said that unpublished data suggest that the response rate was still 17% specifically among patients who had had progression on bortezomib, "so there appears to be some activity in patients who are already refractory to a prior proteasome inhibitor."
Meanwhile, the rates of grade 1/2 and grade 3 peripheral neuropathy were 6% and 1%, respectively. And only a single patient of the 155 had to stop treatment because of this adverse effect.
When carfilzomib is combined with lenalidomide-dexamethasone (the so-called CRd regimen), the overall response rate in patients with pretreated, relapsed, and refractory disease is 78%, and the rate of complete or near complete response is 24% (ASCO 2011 meeting. Abstract 8025).
And, in newly diagnosed myeloma, among 18 patients receiving eight cycles of CRd, the overall response rate was 100%, and the rate of stringent-complete, complete, or near-complete response was 61% (2011 International Myeloma Workshop. Poster P-253). "This is very, very exciting—I don’t think we’ve seen this in any other combination," Dr. Wolf commented. "But these are small numbers of patients; we still need to increase the numbers of patients studied with this combination."
Bortezomib and carfilzomib may soon have company from several investigational proteasome inhibitors available in oral formulations that have shown promise in preclinical testing or have advanced to clinical trials: CEP-18770 (Cephalon), ONX-0912 (Onyx), and MLN-9708 (Millenium).
A Third-Generation IMiD in Trials
Pomalidomide, a third-generation immunomodulatory drug (IMiD), coming after thalidomide (Thalomid), and lenalidomide (Revlimid), is also showing good antimyeloma activity in clinical trials, according to Dr. Wolf.
Among patients with pretreated myeloma, the rate of partial or better response when pomalidomide is combined with dexamethasone has ranged from 25% to 42%, depending on the trial and patient population. Adverse events are primarily hematologic.
And in patients who have previously received lenalidomide, the response rate is similar, at 35% (ASCO 2011 annual meeting. Abstract 8067). "So, as with carfilzomib, where there appear to be responses in patients who have prior resistance to bortezomib, it appears that pomalidomide can give us responses in patients who have already had resistance to lenalidomide," he said.
HDAC Inhibitors Show Activity
The histone deacetylase (HDAC) inhibitor vorinostat (Zolinza) is approved for treatment of lymphoma. But it is being tested in clinical trials for myeloma, in combination therapy, with promising results, according to Dr. Wolf. Overall response rates have ranged from 40% to 94%, depending on the patient population and combination.
Similarly, the HDAC inhibitor romidepsin (Istodax) is approved for lymphoma treatment but is also being studied for antimyeloma activity. And panobinostat, an investigational member of this drug class, is being evaluated as a component of combination therapy in phase II and III myeloma trials.
Monoclonal Antibodies Tested
Elotuzumab is an investigational monoclonal antibody directed against CS1, a glycoprotein that is highly expressed on the surface of plasma cells and implicated in myeloma pathogenesis.
In a phase I trial among patients with relapsed or refractory myeloma, the combination of elotuzumab with lenalidomide and low-dose dexamethasone yielded an overall response rate of 82% (ASCO 2011 meeting. Abstract 8076). The rate was 83% among the subset of patients whose disease was refractory to the most recent therapy and 95% among the subset of lenalidomide-naive patients.
The combination of elotuzumab with bortezomib has also been tested in patients with relapsed or refractory myeloma. But the overall response rate with this combination was less impressive, at 48% (ASH 2010 meeting. Abstract 3023).
Other Agents and Pathways
Several other agents are being eyed for roles in myeloma therapy as well. They include bendamustine (Treanda), an old drug initially revived for lymphoma treatment; aurora kinase inhibitors (for example, MLN-8237); and inhibitors of the mammalian target of rapamycin, or mTOR (for example, INK-128).
Additionally, there is considerable interest in agents that target fibroblast growth factor receptor 3 (FGFR3) for one subgroup. "In patients with the 4;14 translocation, FGFR3 is overexpressed," Dr. Wolf explained. "Finding an inhibitor for that or a direct antibody ... may be quite effective in those patients."
Investigators are also assessing the impact of targeting certain signaling pathways, such as the Jak/Stat pathway and the AKT pathway. For instance, a phase III trial is testing perifosine, an investigational AKT inhibitor, in combination therapy among patients with relapsed or refractory myeloma (NCT01002248).
The Oncology Congress is presented by Reed Medical Education. Reed Medical Education and this news organization are owned by Reed Elsevier Inc.
Dr. Wolf disclosed that he is on the speakers bureaus of Millenium, Celgene, and Ortho-Biotech, and is a consultant to and speaker for Onyx.
EXPERT ANALYSIS FROM THE ANNUAL ONCOLOGY CONGRESS
Partner with Pharmacy to Maximize Patient Care
You’re ready to discharge a patient, but you don’t know whether the medication you’ve ordered will be available in the outpatient setting. Who do you ask? Your pharmacy service will have the answers, and if you’ve established a collegial relationship with the pharmacists there, most likely you can get a quick answer via page, text, or phone call. But if you don’t have personal contact with your pharmacists, chances are the interchange will impersonal—and that could mean missing ou
“Pharmacists may be underutilized, especially if the range of clinical services they offer are not recognized,” notes Kristine Gleason, RPh, clinical quality leader at Northwestern Memorial Hospital in Chicago. “We can be an excellent resource for young hospitalists and clinicians, offering information on clinical dosing and monitoring of complex, high-risk medications.”
Pharmacists also can be valuable resources for medication reconciliation and patient counseling, Gleason says, adding that “our goal is to work collaboratively with our clinicians to help ensure patients receive evidence-based medication regimens that are safe and without error and that are tailored to each patient’s individualized characteristics.”
Benefits of Rounding
Interactions between hospital pharmacies and HM services vary by institution size and organization. Roberta Barber, PharmD, MPH, is assistant vice president of pharmacy for Virtua Health’s four hospital campuses in New Jersey. At Memorial Hospital, where Erik DeLue, MD, MBA, SFHM, first established a hospitalist program, pharmacists are present in the ICU units and participate in care-coordination rounds.
Barber is crafting policies to extend the decentralized pharmacist model to all of Virtua’s hospitals. Equipped with cordless phones and tablet computers, pharmacists will be able to round with the HM team without sacrificing availability to other physicians and hospital staff. In this way, she says, “physicians will be able to consult with pharmacists as they’re creating their treatment plans, and the pharmacist can intervene regarding potential problem orders right then and there.”
At the University of California at San Francisco Medical Center, clinical pharmacists in the general medicine division work closely with the nine medicine teams run by hospitalists. That means 24/7 availability by pager, participating in multidisciplinary rounds, and furnishing new physicians with a “contacts” card and an orientation guide to help hospitalists write better orders, says Vicki Ising Jue, PharmD.
The personal touch is appreciated. “If I am in the pharmacy making a call and not on the unit, it just makes the phone call so much easier if the caller happens to be someone I’ve worked with before,” says UCSF’s Alan Tan, PharmD.
View hundreds of HM opportunities at SHM's Career Center
The degree of communication with pharmacy services may depend on whether you’re working in a teaching hospital with a structured orientation program or starting out in a community hospital. No matter the setting, though, Gleason says the pharmacist’s mission stays the same.
“We’re all striving to get to the same goal: safe, effective and patient-centered care to achieve positive outcomes for our patients,” she says. “Partnering with pharmacists can really move all of us closer to that goal.”
Gretchen Henkel is a freelance writer based in California.
Be PROACTIVE
One excellent way to foster collaboration with your hospital pharmacists and gain a better understanding of the medication management services they can provide, Gleason says, is to visit the department. “Spend an hour with us, shadow us, come to a meeting, and understand what we do professionally,” she explains.
Barber agrees: “If your hospital doesn’t offer training on the range of pharmacy services, solicit that yourself. Orient yourself to pharmacy rules and regulations; familiarize yourself with your hospital’s formulary and the role of the P&T committee in placing drugs on the formulary.”—GH