User login
For Lethargic Patient, Trouble Is Brewing
ANSWER
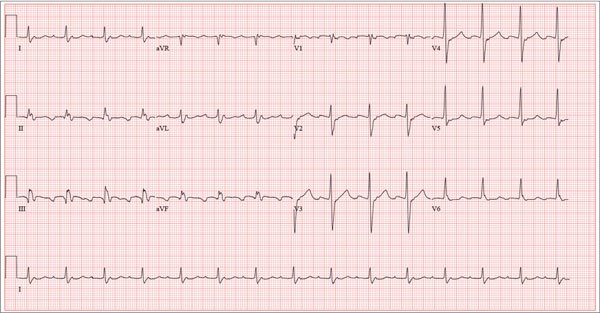
The correct interpretation is an atrial tachycardia with 2:1 ventricular conduction. The ventricular rate is 87 beats/min (690 ms), and the atrial rate is 174 beats/min (345 ms). Two P waves are present for each QRS, which excludes a first-degree atrioventricular block. The less obvious P wave is found in the terminal portion of the QRS complex. (You may convince yourself of this by using calipers to measure the R-R interval, dividing that measurement in half, and then applying it to the ECG. You will see the P waves march through without changing the ventricular response.)
A nonspecific intraventricular conduction delay is also present. The QRS duration is > 100 ms; however, the criteria for right or left bundle branch block are absent.
A thorough investigation revealed that the clerk formulating the herbs for the tea was using, among other things, dried foxglove. Foxglove has been used as a remedy for lethargy in the elderly, presumably because it inadvertently treats symptoms of congestive heart failure. It was the tea consumption that accounted for the presence of digoxin in the patient’s blood. (Recall that there is a substantial overlap between therapeutic and toxic serum concentrations of digoxin.) When the patient stopped consuming the tea, his atrial tachycardia resolved, as did his symptoms.
ANSWER
The correct interpretation is an atrial tachycardia with 2:1 ventricular conduction. The ventricular rate is 87 beats/min (690 ms), and the atrial rate is 174 beats/min (345 ms). Two P waves are present for each QRS, which excludes a first-degree atrioventricular block. The less obvious P wave is found in the terminal portion of the QRS complex. (You may convince yourself of this by using calipers to measure the R-R interval, dividing that measurement in half, and then applying it to the ECG. You will see the P waves march through without changing the ventricular response.)
A nonspecific intraventricular conduction delay is also present. The QRS duration is > 100 ms; however, the criteria for right or left bundle branch block are absent.
A thorough investigation revealed that the clerk formulating the herbs for the tea was using, among other things, dried foxglove. Foxglove has been used as a remedy for lethargy in the elderly, presumably because it inadvertently treats symptoms of congestive heart failure. It was the tea consumption that accounted for the presence of digoxin in the patient’s blood. (Recall that there is a substantial overlap between therapeutic and toxic serum concentrations of digoxin.) When the patient stopped consuming the tea, his atrial tachycardia resolved, as did his symptoms.

A 72-year-old man presents with a primary complaint of lethargy. He emigrated from Southeast Asia to the United States about a year ago and neither speaks nor understands English. His grandson, who is fluent, accompanies him to his appointment. Through his grandson, the patient explains that he has become increasingly tired in the past four months—to the extent that exercise and activities of daily living have become difficult. The patient’s libido also has been affected. In an effort to correct this, he visited a local Asian goods store, where he was given a mixture of herbs from which to brew tea to treat his symptoms. For three weeks, he consumed the tea twice daily. Initially, his energy, stamina, and libido improved. However, his symptoms eventually returned, so he doubled his tea consumption with the idea that this would improve his condition. Unfortunately, in addition to his lethargy, he is now experiencing palpitations, a fluttering sensation in his chest, and occasional dizziness. He denies chest pain, shortness of breath, nocturnal dyspnea, syncope, or near syncope. Medical history is difficult to elicit. He denies prior history of hypertension, myocardial infarction, congestive heart failure, or diabetes. Neither he nor his grandson understands the concept of arrhythmias (eg, atrial fibrillation). He was treated for tuberculosis as a child and has had no recurrence. He has had no surgeries. The patient takes no prescribed medications. He does, however, use herbal products including ginseng, horny goat weed, and fenugreek (in addition to his herbal tea). He has no known drug allergies. Social history reveals that the patient lives with his son’s family, having moved to the US from Thailand after his wife died of old age. He worked as a farmer his entire life. He drinks one ounce of whiskey daily and smokes 1 to 1.5 packs of cigarettes a day. The review of systems is noncontributory. His grandson is reluctant to ask the patient many questions regarding his health, once he notices his grandfather’s agitation at answering questions. The physical exam reveals a thin, elderly male with weathered skin who is in no acute distress. Vital signs include a blood pressure of 118/62 mm Hg; pulse, 80 beats/min and regular; respiratory rate, 16 breaths/min; and temperature, 97.8°F. His height is 62 in and his weight, 117 lb. The HEENT exam is remarkable for arcus senilis and multiple missing teeth. There is no jugular distention, and the thyroid is not enlarged. The lungs reveal coarse breath sounds that clear with coughing in all lung fields. (The patient has an occasional harsh cough.) The cardiac exam is positive for a grade II/VI systolic murmur best heard at the left upper sternal border, which radiates to the carotid arteries. The rhythm is regular at a rate of 80 beats/min, and there are no clicks or rubs. The abdomen is scaphoid, soft, and nontender, with no palpable masses. The peripheral pulses are strong and equal bilaterally. Extremities demonstrate full range of motion, and the neurologic exam is grossly intact. Routine laboratory tests including a complete blood count and electrolyte panel are obtained. Because you are unsure of his medication regimen, you order a toxicology screen. You are surprised to see a serum digoxin level of 0.7 ng/mL. Finally, given the patient’s symptoms of palpitations and dizziness, you order an ECG. It shows the following: a ventricular rate of 87 beats/min; PR interval, 218 ms; QRS duration, 130 ms; QT/QTc interval, 416/500 ms; P axis, 24°; R axis, 49°; and T axis, 45°. What is your interpretation of this ECG?
These Old Lesions? She’s Had Them for Years …
ANSWER
The correct answer is disseminated superficial actinic porokeratosis (DSAP; choice “a”). This condition, caused by an inherited defect of the SART3 gene, is seen mostly on the sun-exposed skin of middle-aged women.
Stasis dermatitis (choice “b”) can cause a number of skin changes, but not the discrete annular lesions seen with DSAP.
Seborrheic keratoses (choice “c”) are common on the legs. However, they don’t display this same morphology.
Nummular eczema (choice “d”) presents with annular papulosquamous lesions (as opposed to the fixed lesions seen with DSAP), often on the legs and lower trunk, but without the thready circumferential scaly border.
Continue reading for Joe Monroe's discussion...
DISCUSSION
Leg skin is prey to an astonishing array of problems; many have to do with increased hydrostatic pressure (eg, venous stasis disease), with the almost complete lack of sebaceous glands (eg, nummular eczema), or with the simple fact of being “in harm’s way.” And there is no law that says a given patient can’t have more than one problem at a time, co-existing and serving to confuse the examiner. Such is the case with this patient.
Her concern about possible blood clots is misplaced but understandable. Deep vein thromboses would not present in multiples, would not be on the surface or scaly, and would almost certainly be painful.
The fixed nature of this patient’s scaly lesions is extremely significant—but only if you know about DSAP, which typically manifests in the third decade of life and slowly worsens. The lesions’ highly palpable and unique scaly border makes them hard to leave alone. This might not be a problem except for the warfarin, which makes otherwise minor trauma visible as purpuric macules. Chronic sun damage tends to accentuate them as well. The positive family history is nicely corroborative and quite common.
The brown macules on the patient’s legs are solar lentigines (sun-caused freckles), which many patients (and even younger providers) erroneously call “age spots.” When these individuals become “aged,” they’ll understand that there is no such thing as an age spot.
This patient could easily have had nummular eczema, but not for 30 years! Those lesions, treated or not, will come and go. But not DSAP, about which many questions remain: If they’re caused by sun exposure, why don’t we see them more often on the face and arms? And why don’t we see them on the sun-damaged skin of older men?
If needed, a biopsy could have been performed. It would have been confirmatory of the diagnosis and effectively would have ruled out the other items in the differential, including wart, squamous cell carcinoma, and actinic or seborrheic keratosis.
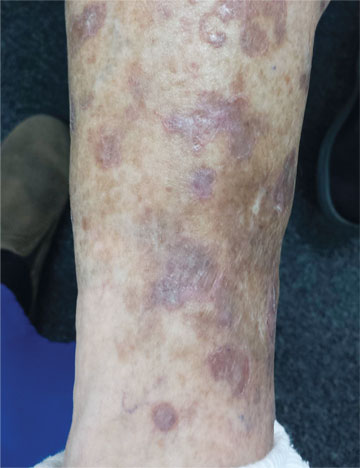
A 65-year-old woman is referred to dermatology with discoloration of her legs that started several weeks ago. Her family suggested it might be “blood clots,” although she has been taking warfarin since she was diagnosed with atrial fibrillation several months ago. Her dermatologic condition is basically asymptomatic, but the patient admits to scratching her legs, saying it’s “hard to leave them alone.” On further questioning, she reveals that she has had “rough places” on her legs for at least 20 years and volunteers that her sister had the same problem, which was diagnosed years ago as “fungal infection.” Both she and her sister spent a great deal of time in the sun as children, long before sunscreen was invented. The patient is otherwise fairly healthy. She takes medication for her lipids, as well as daily vitamins. Her atrial fibrillation is under control and requires no medications other than the warfarin. A great deal of focal discoloration is seen on both legs, circumferentially distributed from well below the knees to just above the ankles. Many of the lesions are brown macules, but more are purplish-red, annular, and scaly. On closer examination, these lesions—the ones the patient says she has had for decades—have a very fine, thready, scaly border that palpation reveals to be tough and adherent. They average about 2 cm in diameter. There are no such lesions noted elsewhere on the patient’s skin. There is, however, abundant evidence of excessive sun exposure, characterized by a multitude of solar lentigines, many fine wrinkles, and extremely thin arm skin.

7 questions to ask when evaluating a noninferiority trial
The traditional clinical trial, designed to test whether a new treatment is better than a placebo or another active treatment, is known as a “superiority” trial—although rarely labeled as such. In contrast, the goal of a noninferiority trial is simply to demonstrate that a new treatment is not substantially less effective than the standard therapy.
Such trials are useful when a new therapy is thought to be safer, easier to administer, or less costly than the existing treatment, but not necessarily more effective. And, because it would be unethical to randomize patients with a serious condition for which there already is an effective treatment to placebo, a noninferiority trial is another means of determining if the new treatment is effective.
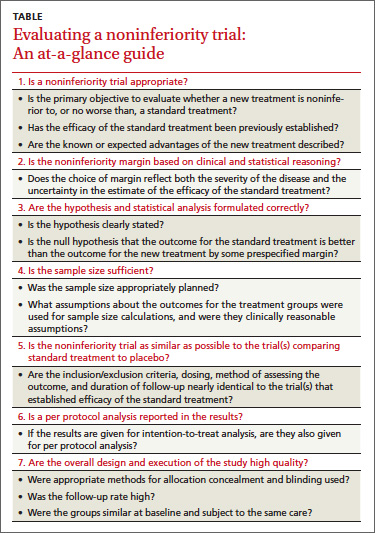
Noninferiority trials have unique design features and methodology and require a different analysis than traditional superiority trials. Yet many physicians know far less about them; many investigators appear to be less than proficient, as well. A review of 116 noninferiority trials and 46 equivalence trials found that only 20% fulfilled generally accepted quality criteria.1 To improve the quality of noninferiority trials, the CONSORT (Consolidated Standards of Reporting Trials) Group has published a checklist for trial design and reporting standards.2,3 Based on this checklist, we came up with 7 key questions to consider when evaluating a noninferiority trial. In the pages that follow, you’ll also find an at-a-glance guide (TABLE) and a methodology review using a hypothetical case (page E7).
1. Is a noninferiority trial appropriate?
The introduction to a noninferiority trial should provide the rationale for this design and the absence of a placebo control group. Look for a review of the evidence of the efficacy of the reference treatment that placebo-controlled trials have revealed, along with the effect size. The advantages of the new treatment over the standard treatment—eg, fewer adverse effects, easier administration, or lower cost—should be discussed, as well.
In the Randomized Evaluation of Long-term Anticoagulation Therapy (RE-LY)—a prominent noninferiority trial—investigators compared the standard anticoagulant (warfarin) for patients with atrial fibrillation (AF) at risk of stroke with a new agent, dabigatran.4 In the methods section of the abstract and the statistical analysis section of the main body, the authors clearly indicated that this was a noninferiority trial. They began by referring to the existing evidence of warfarin’s effectiveness, then detailed the qualities that make warfarin cumbersome to use, including the need for frequent laboratory monitoring. This was followed by evidence that many patients stop taking warfarin and that even for those who persist with treatment, adequate anticoagulation is difficult to maintain.
The authors went on to state that because dabigatran requires no long-term monitoring, it is easier to use. Therefore, if dabigatran could be shown to be no worse than warfarin in preventing strokes, it would be a reasonable alternative, leaving no doubt that this was an appropriate noninferiority trial.
2. Is the noninferiority margin based on clinical judgment and statistical reasoning?
The noninferiority margin should be based on clinical judgment as to how effective a new treatment must be in order to be declared not clinically inferior to the standard treatment. This can be based on several factors, including the severity of the outcome and the expected advantages of the new treatment. The margin should also take into account the size of the standard treatment’s effect vs placebo. In RELY, for example, the authors noted that the noninferiority margin was based on the desire to preserve at least 50% of the lower limit of the confidence interval (CI) of warfarin’s estimated effect; this was done using data from a previously published meta-analysis of 6 trials comparing warfarin with placebo for stroke prevention in patients with AF.4-6
3. Are the hypothesis and statistical analysis formulated correctly?
The clinical hypothesis in a noninferiority trial is that the new treatment is not worse than the standard treatment by a prespecified margin; therefore, the statistical null hypothesis to be tested is that the new treatment is worse than the reference treatment by more than that margin. Rejecting a true null hypothesis (for example, because the P value is <.05) is known as a type l error. In this setting, making a type I error would mean accepting a new treatment that is truly worse than the standard by at least the specified margin. Failure to reject a false null hypothesis is known as a type II error, which in this case would mean failing to identify a new treatment that is truly noninferior to the standard.7
In RE-LY, the authors stated that the upper limit of the one-sided 97.5% CI for the relative risk of a stroke with dabigatran vs warfarin had to fall below 1.46.4 (This is the same as testing the null hypothesis that the hazard ratio is ≥1.46.) Thus, the hypothesis was formulated correctly.
4. Is the sample size appropriate and justified?
The sample size in a noninferiority trial should provide high power to reject the null hypothesis that the difference (or relative risk) between groups is equal to or greater than the noninferiority margin under some clinically meaningful assumption about the true difference (or absolute risk reduction) between groups. A true difference of 0 (or a relative risk of 1) is typically assumed for sample size calculation. However, assuming that the new treatment is truly slightly better or slightly worse than the standard may be clinically appropriate in some cases. This would indicate a need for a smaller or larger sample size, respectively, than that required under the usual assumption of no difference.
When the justification for the sample size in a noninferiority trial is not provided or the number of participants is based on an inappropriate approach (eg, using superiority trial calculations for a noninferiority trial), questions about the quality of the trial arise. The primary concern is whether the noninferiority margin was actually selected before the trial began, as it should have been. And if the researchers used overly optimistic assumptions about the efficacy of the new treatment relative to the standard therapy, the failure to rule out the margin could be misleading. (As with superiority trials that fail to reject the null hypothesis, post hoc power calculations should be avoided.) After the study has ended, the resulting CIs should be used to evaluate whether the study was large enough to adequately assess the relative effectiveness of the treatments.
The RE-LY trial calculated the sample size that was expected to provide 84% power to rule out the prespecified hazard ratio of 1.46, assuming a true event rate of 1.6% per year (presumably for both groups), a recruitment period of 2 years, and at least one year of follow-up. The sample size was subsequently increased from 15,000 to 18,000 to maintain power in case of a low event rate.4,5
5. Is the noninferiority trial as similar as possible to the trial(s) comparing the standard treatment with placebo?
Characteristics of participants, setting, reference treatment, and outcomes used in a noninferiority trial should be as close as possible to those in the trial(s) comparing the treatment with placebo. This is known as the constancy assumption, and it is key to researchers’ ability to draw a conclusion about noninferiority.
The trials used to calculate the noninferiority margin and the RE-LY trial itself involved similar populations of patients with AF, and the outcome (stroke) was similar.
6. Is a per protocol analysis reported in the results?
In randomized controlled superiority trials, the participants should be analyzed in the groups to which they were originally allocated, regardless of whether they adhered to treatment during the entire follow-up period. Such intention-to-treat (ITT) analysis is important because it provides a more conservative estimate of treatment effect—taking into account that some people who are offered treatment will not accept it and others will discontinue treatment. An ITT analysis therefore tends to minimize treatment effects compared with a “per protocol” analysis, in which participants are analyzed according to the treatment they actually received and are often removed from the analysis if they discontinue or do not adhere to treatment.
In noninferiority trials, if patients in the intervention group cross over to the standard treatment group or those in the standard treatment group have poor adherence, an ITT analysis can increase the risk of wrongly claiming noninferiority.7 Therefore, a per protocol analysis should be included—and indeed may be preferable.
In RE-LY, ITT analyses were reported, and complete follow-up data were available for 99.9% of patients. However, the rates of treatment discontinuation at one year were about 15% for those on dabigatran and 10% for the warfarin group, and 21% and 17%, respectively, at 2 years.4,5 If the new treatment were truly less efficacious than the standard treatment, these moderate discontinuation rates could lead to more similar rates of stroke in the 2 groups than would be expected with higher continuation rates, biasing results towards the alternative of noninferiority. Although the original publication of trial results did not include a per protocol analysis, the RE-LY authors later reported that a per protocol analysis yielded similar results to the ITT analysis.
7. Are the overall design and execution of the trial high quality?
Because a poor quality noninferiority trial can appear to demonstrate noninferiority, looking at such studies critically is crucial. Appropriate randomization, concealed allocation, masking, and careful attention to participant flow must all be assessed.2,3
To continue with our example, the RE-LY trial was well conducted. Randomization was performed centrally via an automated telephone system and 2 doses of dabigatran were administered in a masked fashion, while warfarin was open-label. Remarkably, follow-up was achieved for 99.9% of participants over a median of 2 years, and independent adjudicators masked to treatment group assessed outcomes.4,5
CORRESPONDENCE
Anne Mounsey, MD, UNC Chapel Hill Department of Family Medicine, 590 Manning Drive, CB 7595, Chapel Hill, NC 27590; [email protected]
1. Le Henanff A, Giraudeau B, Baron G, et al. Quality of reporting of noninferiority and equivalence randomized trials. JAMA. 2006;295:1147-1151.
2. Piaggio G, Elbourne DR, Pocock SJ, et al; CONSORT Group. Reporting of noninferiority and equivalence randomized trials: extension of the CONSORT 2010 statement. JAMA. 2012;308:2594-2604.
3. Moher D, Schulz KF, Altman D; CONSORT Group (Consolidated Standards of Reporting Trials). The CONSORT statement: revised recommendations for improving the quality of reports of parallel-group randomized trials. JAMA. 2001;285:1987-1991.
4. Connolly SJ, Ezekowitz MD, Yusuf S, et al; RE-LY Steering Committee and Investigators. Dabigatran versus warfarin in patients with atrial fibrillation. N Engl J Med. 2009;361:1139-1151.
5. Ezekowitz MD, Connolly S, Parekh A, et al. Rationale and design of RE-LY: randomized evaluation of long-term anticoagulant therapy, warfarin, compared with dabigatran. Am Heart J. 2009;157:805-810, 810.e1-2.
6. Hart RG, Benavente O, McBride R, et al. Antithrombotic therapy to prevent stroke in patients with atrial fibrillation: a meta-analysis. Ann Intern Med. 1999;131:492-501.
7. US Department of Health and Human Services. Guidance for industry non-inferiority clinical trials. US Food and Drug Administration Web site. March 2010. Available at: http://www.fda.gov/downloads/Drugs/GuidanceComplianceRegulatoryInformation/Guidances/UCM202140.pdf. Accessed February 4, 2014.
The traditional clinical trial, designed to test whether a new treatment is better than a placebo or another active treatment, is known as a “superiority” trial—although rarely labeled as such. In contrast, the goal of a noninferiority trial is simply to demonstrate that a new treatment is not substantially less effective than the standard therapy.
Such trials are useful when a new therapy is thought to be safer, easier to administer, or less costly than the existing treatment, but not necessarily more effective. And, because it would be unethical to randomize patients with a serious condition for which there already is an effective treatment to placebo, a noninferiority trial is another means of determining if the new treatment is effective.
Noninferiority trials have unique design features and methodology and require a different analysis than traditional superiority trials. Yet many physicians know far less about them; many investigators appear to be less than proficient, as well. A review of 116 noninferiority trials and 46 equivalence trials found that only 20% fulfilled generally accepted quality criteria.1 To improve the quality of noninferiority trials, the CONSORT (Consolidated Standards of Reporting Trials) Group has published a checklist for trial design and reporting standards.2,3 Based on this checklist, we came up with 7 key questions to consider when evaluating a noninferiority trial. In the pages that follow, you’ll also find an at-a-glance guide (TABLE) and a methodology review using a hypothetical case (page E7).
1. Is a noninferiority trial appropriate?
The introduction to a noninferiority trial should provide the rationale for this design and the absence of a placebo control group. Look for a review of the evidence of the efficacy of the reference treatment that placebo-controlled trials have revealed, along with the effect size. The advantages of the new treatment over the standard treatment—eg, fewer adverse effects, easier administration, or lower cost—should be discussed, as well.
In the Randomized Evaluation of Long-term Anticoagulation Therapy (RE-LY)—a prominent noninferiority trial—investigators compared the standard anticoagulant (warfarin) for patients with atrial fibrillation (AF) at risk of stroke with a new agent, dabigatran.4 In the methods section of the abstract and the statistical analysis section of the main body, the authors clearly indicated that this was a noninferiority trial. They began by referring to the existing evidence of warfarin’s effectiveness, then detailed the qualities that make warfarin cumbersome to use, including the need for frequent laboratory monitoring. This was followed by evidence that many patients stop taking warfarin and that even for those who persist with treatment, adequate anticoagulation is difficult to maintain.
The authors went on to state that because dabigatran requires no long-term monitoring, it is easier to use. Therefore, if dabigatran could be shown to be no worse than warfarin in preventing strokes, it would be a reasonable alternative, leaving no doubt that this was an appropriate noninferiority trial.
2. Is the noninferiority margin based on clinical judgment and statistical reasoning?
The noninferiority margin should be based on clinical judgment as to how effective a new treatment must be in order to be declared not clinically inferior to the standard treatment. This can be based on several factors, including the severity of the outcome and the expected advantages of the new treatment. The margin should also take into account the size of the standard treatment’s effect vs placebo. In RELY, for example, the authors noted that the noninferiority margin was based on the desire to preserve at least 50% of the lower limit of the confidence interval (CI) of warfarin’s estimated effect; this was done using data from a previously published meta-analysis of 6 trials comparing warfarin with placebo for stroke prevention in patients with AF.4-6
3. Are the hypothesis and statistical analysis formulated correctly?
The clinical hypothesis in a noninferiority trial is that the new treatment is not worse than the standard treatment by a prespecified margin; therefore, the statistical null hypothesis to be tested is that the new treatment is worse than the reference treatment by more than that margin. Rejecting a true null hypothesis (for example, because the P value is <.05) is known as a type l error. In this setting, making a type I error would mean accepting a new treatment that is truly worse than the standard by at least the specified margin. Failure to reject a false null hypothesis is known as a type II error, which in this case would mean failing to identify a new treatment that is truly noninferior to the standard.7
In RE-LY, the authors stated that the upper limit of the one-sided 97.5% CI for the relative risk of a stroke with dabigatran vs warfarin had to fall below 1.46.4 (This is the same as testing the null hypothesis that the hazard ratio is ≥1.46.) Thus, the hypothesis was formulated correctly.
4. Is the sample size appropriate and justified?
The sample size in a noninferiority trial should provide high power to reject the null hypothesis that the difference (or relative risk) between groups is equal to or greater than the noninferiority margin under some clinically meaningful assumption about the true difference (or absolute risk reduction) between groups. A true difference of 0 (or a relative risk of 1) is typically assumed for sample size calculation. However, assuming that the new treatment is truly slightly better or slightly worse than the standard may be clinically appropriate in some cases. This would indicate a need for a smaller or larger sample size, respectively, than that required under the usual assumption of no difference.
When the justification for the sample size in a noninferiority trial is not provided or the number of participants is based on an inappropriate approach (eg, using superiority trial calculations for a noninferiority trial), questions about the quality of the trial arise. The primary concern is whether the noninferiority margin was actually selected before the trial began, as it should have been. And if the researchers used overly optimistic assumptions about the efficacy of the new treatment relative to the standard therapy, the failure to rule out the margin could be misleading. (As with superiority trials that fail to reject the null hypothesis, post hoc power calculations should be avoided.) After the study has ended, the resulting CIs should be used to evaluate whether the study was large enough to adequately assess the relative effectiveness of the treatments.
The RE-LY trial calculated the sample size that was expected to provide 84% power to rule out the prespecified hazard ratio of 1.46, assuming a true event rate of 1.6% per year (presumably for both groups), a recruitment period of 2 years, and at least one year of follow-up. The sample size was subsequently increased from 15,000 to 18,000 to maintain power in case of a low event rate.4,5
5. Is the noninferiority trial as similar as possible to the trial(s) comparing the standard treatment with placebo?
Characteristics of participants, setting, reference treatment, and outcomes used in a noninferiority trial should be as close as possible to those in the trial(s) comparing the treatment with placebo. This is known as the constancy assumption, and it is key to researchers’ ability to draw a conclusion about noninferiority.
The trials used to calculate the noninferiority margin and the RE-LY trial itself involved similar populations of patients with AF, and the outcome (stroke) was similar.
6. Is a per protocol analysis reported in the results?
In randomized controlled superiority trials, the participants should be analyzed in the groups to which they were originally allocated, regardless of whether they adhered to treatment during the entire follow-up period. Such intention-to-treat (ITT) analysis is important because it provides a more conservative estimate of treatment effect—taking into account that some people who are offered treatment will not accept it and others will discontinue treatment. An ITT analysis therefore tends to minimize treatment effects compared with a “per protocol” analysis, in which participants are analyzed according to the treatment they actually received and are often removed from the analysis if they discontinue or do not adhere to treatment.
In noninferiority trials, if patients in the intervention group cross over to the standard treatment group or those in the standard treatment group have poor adherence, an ITT analysis can increase the risk of wrongly claiming noninferiority.7 Therefore, a per protocol analysis should be included—and indeed may be preferable.
In RE-LY, ITT analyses were reported, and complete follow-up data were available for 99.9% of patients. However, the rates of treatment discontinuation at one year were about 15% for those on dabigatran and 10% for the warfarin group, and 21% and 17%, respectively, at 2 years.4,5 If the new treatment were truly less efficacious than the standard treatment, these moderate discontinuation rates could lead to more similar rates of stroke in the 2 groups than would be expected with higher continuation rates, biasing results towards the alternative of noninferiority. Although the original publication of trial results did not include a per protocol analysis, the RE-LY authors later reported that a per protocol analysis yielded similar results to the ITT analysis.
7. Are the overall design and execution of the trial high quality?
Because a poor quality noninferiority trial can appear to demonstrate noninferiority, looking at such studies critically is crucial. Appropriate randomization, concealed allocation, masking, and careful attention to participant flow must all be assessed.2,3
To continue with our example, the RE-LY trial was well conducted. Randomization was performed centrally via an automated telephone system and 2 doses of dabigatran were administered in a masked fashion, while warfarin was open-label. Remarkably, follow-up was achieved for 99.9% of participants over a median of 2 years, and independent adjudicators masked to treatment group assessed outcomes.4,5
CORRESPONDENCE
Anne Mounsey, MD, UNC Chapel Hill Department of Family Medicine, 590 Manning Drive, CB 7595, Chapel Hill, NC 27590; [email protected]
1. Le Henanff A, Giraudeau B, Baron G, et al. Quality of reporting of noninferiority and equivalence randomized trials. JAMA. 2006;295:1147-1151.
2. Piaggio G, Elbourne DR, Pocock SJ, et al; CONSORT Group. Reporting of noninferiority and equivalence randomized trials: extension of the CONSORT 2010 statement. JAMA. 2012;308:2594-2604.
3. Moher D, Schulz KF, Altman D; CONSORT Group (Consolidated Standards of Reporting Trials). The CONSORT statement: revised recommendations for improving the quality of reports of parallel-group randomized trials. JAMA. 2001;285:1987-1991.
4. Connolly SJ, Ezekowitz MD, Yusuf S, et al; RE-LY Steering Committee and Investigators. Dabigatran versus warfarin in patients with atrial fibrillation. N Engl J Med. 2009;361:1139-1151.
5. Ezekowitz MD, Connolly S, Parekh A, et al. Rationale and design of RE-LY: randomized evaluation of long-term anticoagulant therapy, warfarin, compared with dabigatran. Am Heart J. 2009;157:805-810, 810.e1-2.
6. Hart RG, Benavente O, McBride R, et al. Antithrombotic therapy to prevent stroke in patients with atrial fibrillation: a meta-analysis. Ann Intern Med. 1999;131:492-501.
7. US Department of Health and Human Services. Guidance for industry non-inferiority clinical trials. US Food and Drug Administration Web site. March 2010. Available at: http://www.fda.gov/downloads/Drugs/GuidanceComplianceRegulatoryInformation/Guidances/UCM202140.pdf. Accessed February 4, 2014.

Team uses light to measure coagulation

Credit: Максим Кукушкин
Researchers have developed an optical device that requires only a few drops of blood and a few minutes to measure coagulation parameters that can guide blood transfusions and anticoagulant therapy.
The team described their device in Biomedical Optics Express.
“Currently, the most comprehensive measures of coagulation are a battery of lab tests that are expensive and can take hours to perform,” said study author Seemantini Nadkarni, PhD, of Massachusetts General Hospital in Boston.
She noted that other systems have been developed that provide clotting measurements at the point of care, but the systems can be big and expensive or have other limitations, such as requiring significant amounts of blood or only measuring clotting time.
“Our goal is to provide as much information as a lab test, but to provide it quickly and cheaply at a patient’s bedside,” Dr Nadkarni said.
To reach this goal, she and her colleagues turned to an optical technique they pioneered called laser speckle rheology. The technique involves shining a laser into a sample and monitoring the patterns of light that bounce back.
The researchers had previously used the technique to measure the mechanical properties of a range of different tissue types and found that it was extremely sensitive to the coagulation of blood.
When light hits a blood sample, blood cells and platelets scatter the light. In unclotted blood, these light-scattering particles move easily about, making the pattern of scattered light, a speckle pattern, fluctuate rapidly.
“It’s almost like looking at a starry night sky, with twinkling stars,” Dr Nadkarni said. “But as the blood starts to coagulate, blood cells and platelets come together within a fibrin network to form a clot. The motion is restricted as the sample gets stiffer, and the ‘twinkling’ of the speckle pattern is reduced significantly.”
Dr Nadkarni and her colleagues used a miniature high-speed camera to record the fluctuating speckle pattern and then correlated the intensity of changes in the pattern with 2 blood sample measurements: clotting time and fibrinogen concentration.
The team noted that physicians could use the measurements to make decisions about how much blood to give a bleeding patient and what type of blood product is needed most.
“The timely detection of clotting defects followed by the appropriate blood product transfusion is critical in managing bleeding patients,” Dr Nadkarni said. “If you transfuse too much, there could be further coagulation defects that occur, but if you don’t transfuse enough, bleeding continues.”
On the other end of the spectrum, the device could help patients on anticoagulant therapy. Having a small device that can analyze their blood in a doctor’s office or at home could reduce the cost and inconvenience of blood tests, while increasing the safety of anticoagulation treatment, Dr Nadkarni said.
At present, her team’s device is about the size of a tissue box and is connected to a computer. The researchers are working to further miniaturize the system and aim to perform clinical studies with a version smaller than a cell phone within the next year. ![]()
Mutation responsible for insecticide resistance

spray insecticide
Credit: Morgana Wingard
A single genetic mutation can cause resistance to the main insecticides used to combat malaria, according to a study published in Genome Biology.
Researchers identified a mutation in the gene GSTe2 that allows mosquitoes to break down the insecticide DDT into non-toxic substances.
The mutation also makes mosquitoes resistant to pyrethroids, an insecticide class used in mosquito nets.
“We found a population of mosquitoes fully resistant to DDT but also to pyrethroids,” said study author Charles Wondji, PhD, of the Liverpool School of Tropical Medicine in the UK.
“So we wanted to elucidate the molecular basis of that resistance in the population and design a field-applicable diagnostic assay for its monitoring.”
To that end, the researchers did a genome-wide comparison on mosquitoes that were fully susceptible to insecticides and Anopheles funestus mosquitoes from the Republic of Benin in Africa, which were resistant to DDT and the pyrethroid permethrin.
The team found the GSTe2 gene was upregulated in the resistant mosquitoes. And a single mutation (L119F) changed a non-resistant version of the gene to an insecticide-resistant version.
The researchers then designed a DNA-based diagnostic test for this metabolic resistance and confirmed that this mutation was found in mosquitoes from other areas of the world with DDT resistance, but it was completely absent in regions without resistance.
X-ray crystallography of the protein coded by the gene illustrated exactly how the mutation conferred resistance—by opening up the active site where DDT molecules bind to the protein so that more can be broken down. In other words, the mosquito can survive by breaking down the poison into non-toxic substances.
The researchers also introduced the gene into Drosophila melanogaster and found the flies became resistant to DDT and pyrethroids, whereas control flies did not. The team said this confirms that a single mutation is enough to make insects resistant to both DDT and pyrethroids.
“For the first time, we have been able to identify a molecular marker for metabolic resistance in a mosquito population and to design a DNA-based diagnostic assay,” Dr Wondji said.
“Such tools will allow control programs to detect and track resistance at an early stage in the field, which is an essential requirement to successfully tackle the growing problem of insecticide resistance in vector control. This significant progress opens the door for us to do this with other forms of resistance as well and in other vector species.” ![]()
Actionability of TPAD Results
Effective communication between inpatient and primary care physicians (PCPs) is essential for safe, high‐quality transitions. Unfortunately, PCPs are often not meaningfully engaged in this process; communication is frequently challenging or nonexistent.[1, 2] Instead, information is suboptimally conveyed via lengthy, disorganized discharge summaries.[3] Consequently, timely knowledge is not transferred to PCPs, who instead must seek out and identify actionable information themselves. These deficiencies can lead to misinterpretation of information and patient harm.[4]
An important component of ideal transitions[5] is timely communication of results of tests pending at discharge (TPADs). TPADs are variably documented in discharge summaries, and physician awareness about them is strikingly poor.[3, 6, 7] Communication about TPADs should convey rationales for ordering tests and necessary actions to take in response to finalized results. Most often, this knowledge resides with the inpatient team.
Health information technology (HIT) is an effective strategy for improving test‐result management. We implemented an automated system that notifies inpatient attendings and PCPs of TPAD results via email and demonstrated increased awareness by these physicians at the time of required action.[8, 9] Nevertheless, without timely knowledge transfer, attendings and PCPs may have differing opinions regarding which TPAD results require action. We conducted a secondary analysis of survey respondents from our original clustered randomized controlled trial to measure the degree of agreement between inpatient and ambulatory physicians regarding actionability of TPAD results.
METHODS
The methods of our original study are described elsewhere.[9] In that study, the attending and PCP of each patient were independently surveyed (via email and then by fax if the electronic survey was not completed) to determine their awareness of finalized TPAD results, and to identify actionable results and the types of actions taken (or that would need to be taken). Discharge summaries were available in our electronic medical record (EMR) within 24 hours of discharge. Network physicians (affiliated with Partners HealthCare, Inc.) had access to all components of the EMR, including the discharge summary and test results. Non‐network PCPs were faxed discharge summaries within 48 hours of discharge per institutional policies. For this study, we identified all patients for whom the attending and PCP completed the survey and answered questions about TPAD actionability. We then compared the identified TPADs listed by the attending and PCP in that survey.
RESULTS
We enrolled 441 patients in our original study. We sent 441 surveys to 117 attendings and 353 surveys to 273 PCPs. Eighty‐eight patients did not have an identified PCP. We received 275 responses from 83 attendings (62% response rate), and 152 responses from 112 PCPs (43% response rate). Patient and physician characteristics are reported elsewhere.[9]
For this analysis, we identified the 98 patients (aged 6018 years, 44 male, 52 Caucasian, 46 non‐Caucasian, 85 network, 13 non‐network) cared for by 46 attendings (aged 4411 years, 33 male, 22 hospitalists, 24 nonhospitalists) and 79 PCPs (aged 4512.5, 33 male, 66 network, 13 non‐network) for whom we received completed surveys from both physicians. For 59 patients, both thought none of the TPAD results were actionable. For 12 patients, both thought at least 1 was actionable, and they identified the same actionable TPAD result for all 12. Overall, attendings and PCPs agreed on actionability in 72.5% (71/98) (Kappa 0.29, 95% confidence interval: 0.09‐0.50). Table 1 shows the type of action taken by responsible providers. There were 9 patients (9%) for whom the attending alone thought at least 1 TPAD result was actionable; of these, subsequent attending‐initiated communication occurred in 77.8% (7/9). There were 18 patients (18%) for whom the PCP alone thought at least 1 TPAD result was actionable; of these, subsequent PCP‐initiated communication occurred in 77.8% (14/18). Table 2 shows concordance of actionable TPAD by type. In instances of disagreement, the attending frequently reported microbiology TPADs (eg, culture data, viral serologies) as actionable, whereas the PCP reported all TPAD types (eg, culture data, colon biopsy, vitamin D, magnetic resonance imaging) as actionable.
| Inpatient Attending‐Initiated Action(s)a | PCP‐Initiated Action(s)a | |
|---|---|---|
| ||
| Patient was notifiedb | 11.1% (1/9) | 66.7% (12/18) |
| Subspecialist was contacted | 33.3% (3/9) | 16.7% (3/18) |
| PCP or inpatient team contacted | 33.3% (3/9) | 16.7% (3/18) |
| Further testing/modified treatment | 11.1% (1/9) | 33.3% (6/18) |
| Referred to ambulatory visit/emergency room | 0% (0/9) | 11.1% (2/18) |
| Documentation | 11.1% (1/9) | 16.7% (3/18) |
| Type of TPAD | Attending and PCP Agreed on Identity of Actionable TPADa | Attending and PCP Disagreed on Identity of Actionable TPADa | ||
|---|---|---|---|---|
| TPAD Identified | No TPAD Identified, n=59 | TPAD Identified by Attending Only | TPAD Identified by PCP Only | |
| ||||
| Microbiologyb | 25% (3/12) | N/A | 56% (5/9) | 17% (3/18) |
| Pathologyc | 17% (2/12) | N/A | 0% (0/9) | 17% (3/18) |
| Chemistry and hematologyd | 58% (7/12) | N/A | 11% (1/9) | 22% (4/18) |
| Radiologye | 0% (0/12) | N/A | 11% (1/9) | 39% (5/18) |
| Unclassified (left blank) | 0% (0/12) | N/A | 22% (1/9) | 17% (3/18) |
DISCUSSION
We found fair agreement between attendings and PCPs regarding actionability of TPAD results. In 27 patients (27.5%), either the attending or PCP considered TPAD results actionable when the other did not. Possible explanations for this include different thresholds for taking action (eg, inpatient physicians may view vitamin D levels as acceptable within broader ranges than PCPs, and PCPs may view negative results as actionable if they need to contact the patient whereas attendings may not), varying clinical context (eg, rationale for why microbiology culture data is actionable), and varying practices for escalating care (eg, referring patients back to the hospital).
Our study was limited by small sample size and low PCP response rate. Nonetheless, the findings suggest that poor concordance between inpatient and ambulatory physicians will persist without tools that promote more effective communication. Greater awareness alone may be insufficient to mitigate consequences of missed TPAD results if physicians are not on the same page regarding which results require action.
To better engage PCPs, healthcare systems require HIT infrastructure that facilitates seamless care team communication across care settings.[2] When optimally configured, HIT can facilitate greater PCP involvement in postdischarge communication. For example, our system promoted subsequent postdischarge communication in 78% of initial discordance in TPAD actionability; however, most of it was not between the attending and the PCP. Thus, improvements could be made to facilitate more effective communication among key inpatient and ambulatory providers. Furthermore, when configured to facilitate conversation among these providers regarding the discharge care plan throughout a patient's entire hospital course, HIT can promote effective knowledge transfer by virtue of adding clinical context to test ordering and follow‐up. Additional work is needed to understand whether such communication clarifies contingencies and facilitates appropriate postdischarge action. Nevertheless, current electronic solutions (eg, passive placement into results in‐baskets) will likely be ineffective because they do not reliably improve awareness and active communication about context, rationale, interpretation, suggested action, or transfer of responsibility.
In summary, discrepancies in TPAD actionability by inpatient and ambulatory providers still exist, even when awareness of TPAD results is improved by HIT. By fostering more effective communication among key care‐team members across care settings, HIT could mitigate the consequences of suboptimal care transitions. With regard to TPAD results, this may favorably impact unnecessary testing, diagnostic and therapeutic delays, and medical errors.
Disclosures: This article is based on research funded through AHRQ grant #R21HS018229; the authors have no other disclosures or conflicts or interest.
- , , , et al. Problems after discharge and understanding of communication with their primary care physicians among hospitalized seniors: a mixed methods study. J Hosp Med. 2010;5:385–391.
- . A primary care physician's ideal transitions of care—where's the evidence? J Hosp Med. 2013;8(8):472–477.
- , , , et al. Deficits in communication and information transfer between hospital‐based and primary care physicians: implications for patient safety and continuity of care. JAMA. 2007;297(8):831–841.
- , , , , . The incidence and severity of adverse events affecting patients after discharge from the hospital. Ann Intern Med. 2003;138:161–167.
- , , , . Moving beyond readmission penalties: creating an ideal process to improve transitional care. J Hosp Med. 2012;8(2):102–109.
- , , , et al. Adequacy of hospital discharge summaries in documenting tests with pending results and outpatient follow‐up providers. J Gen Intern Med. 2009;24(9):1002–1006.
- , , , et al. Patient safety concerns rising from test results that return after hospital discharge. Ann Intern Med. 2005;143:121–128.
- , , , et al. Design and implementation of an automated email notification system for results of tests pending at discharge. J Am Med Inform Assoc. 2012;19(4):523–528.
- , , , et al. Impact of an automated email notification system for results of rest pending at discharge: a cluster‐randomized controlled trial [published online ahead of print October 23, 2013]. J Am Med Inform Assoc. doi:10.1136/amiajnl‐2013‐002030.
Effective communication between inpatient and primary care physicians (PCPs) is essential for safe, high‐quality transitions. Unfortunately, PCPs are often not meaningfully engaged in this process; communication is frequently challenging or nonexistent.[1, 2] Instead, information is suboptimally conveyed via lengthy, disorganized discharge summaries.[3] Consequently, timely knowledge is not transferred to PCPs, who instead must seek out and identify actionable information themselves. These deficiencies can lead to misinterpretation of information and patient harm.[4]
An important component of ideal transitions[5] is timely communication of results of tests pending at discharge (TPADs). TPADs are variably documented in discharge summaries, and physician awareness about them is strikingly poor.[3, 6, 7] Communication about TPADs should convey rationales for ordering tests and necessary actions to take in response to finalized results. Most often, this knowledge resides with the inpatient team.
Health information technology (HIT) is an effective strategy for improving test‐result management. We implemented an automated system that notifies inpatient attendings and PCPs of TPAD results via email and demonstrated increased awareness by these physicians at the time of required action.[8, 9] Nevertheless, without timely knowledge transfer, attendings and PCPs may have differing opinions regarding which TPAD results require action. We conducted a secondary analysis of survey respondents from our original clustered randomized controlled trial to measure the degree of agreement between inpatient and ambulatory physicians regarding actionability of TPAD results.
METHODS
The methods of our original study are described elsewhere.[9] In that study, the attending and PCP of each patient were independently surveyed (via email and then by fax if the electronic survey was not completed) to determine their awareness of finalized TPAD results, and to identify actionable results and the types of actions taken (or that would need to be taken). Discharge summaries were available in our electronic medical record (EMR) within 24 hours of discharge. Network physicians (affiliated with Partners HealthCare, Inc.) had access to all components of the EMR, including the discharge summary and test results. Non‐network PCPs were faxed discharge summaries within 48 hours of discharge per institutional policies. For this study, we identified all patients for whom the attending and PCP completed the survey and answered questions about TPAD actionability. We then compared the identified TPADs listed by the attending and PCP in that survey.
RESULTS
We enrolled 441 patients in our original study. We sent 441 surveys to 117 attendings and 353 surveys to 273 PCPs. Eighty‐eight patients did not have an identified PCP. We received 275 responses from 83 attendings (62% response rate), and 152 responses from 112 PCPs (43% response rate). Patient and physician characteristics are reported elsewhere.[9]
For this analysis, we identified the 98 patients (aged 6018 years, 44 male, 52 Caucasian, 46 non‐Caucasian, 85 network, 13 non‐network) cared for by 46 attendings (aged 4411 years, 33 male, 22 hospitalists, 24 nonhospitalists) and 79 PCPs (aged 4512.5, 33 male, 66 network, 13 non‐network) for whom we received completed surveys from both physicians. For 59 patients, both thought none of the TPAD results were actionable. For 12 patients, both thought at least 1 was actionable, and they identified the same actionable TPAD result for all 12. Overall, attendings and PCPs agreed on actionability in 72.5% (71/98) (Kappa 0.29, 95% confidence interval: 0.09‐0.50). Table 1 shows the type of action taken by responsible providers. There were 9 patients (9%) for whom the attending alone thought at least 1 TPAD result was actionable; of these, subsequent attending‐initiated communication occurred in 77.8% (7/9). There were 18 patients (18%) for whom the PCP alone thought at least 1 TPAD result was actionable; of these, subsequent PCP‐initiated communication occurred in 77.8% (14/18). Table 2 shows concordance of actionable TPAD by type. In instances of disagreement, the attending frequently reported microbiology TPADs (eg, culture data, viral serologies) as actionable, whereas the PCP reported all TPAD types (eg, culture data, colon biopsy, vitamin D, magnetic resonance imaging) as actionable.
| Inpatient Attending‐Initiated Action(s)a | PCP‐Initiated Action(s)a | |
|---|---|---|
| ||
| Patient was notifiedb | 11.1% (1/9) | 66.7% (12/18) |
| Subspecialist was contacted | 33.3% (3/9) | 16.7% (3/18) |
| PCP or inpatient team contacted | 33.3% (3/9) | 16.7% (3/18) |
| Further testing/modified treatment | 11.1% (1/9) | 33.3% (6/18) |
| Referred to ambulatory visit/emergency room | 0% (0/9) | 11.1% (2/18) |
| Documentation | 11.1% (1/9) | 16.7% (3/18) |
| Type of TPAD | Attending and PCP Agreed on Identity of Actionable TPADa | Attending and PCP Disagreed on Identity of Actionable TPADa | ||
|---|---|---|---|---|
| TPAD Identified | No TPAD Identified, n=59 | TPAD Identified by Attending Only | TPAD Identified by PCP Only | |
| ||||
| Microbiologyb | 25% (3/12) | N/A | 56% (5/9) | 17% (3/18) |
| Pathologyc | 17% (2/12) | N/A | 0% (0/9) | 17% (3/18) |
| Chemistry and hematologyd | 58% (7/12) | N/A | 11% (1/9) | 22% (4/18) |
| Radiologye | 0% (0/12) | N/A | 11% (1/9) | 39% (5/18) |
| Unclassified (left blank) | 0% (0/12) | N/A | 22% (1/9) | 17% (3/18) |
DISCUSSION
We found fair agreement between attendings and PCPs regarding actionability of TPAD results. In 27 patients (27.5%), either the attending or PCP considered TPAD results actionable when the other did not. Possible explanations for this include different thresholds for taking action (eg, inpatient physicians may view vitamin D levels as acceptable within broader ranges than PCPs, and PCPs may view negative results as actionable if they need to contact the patient whereas attendings may not), varying clinical context (eg, rationale for why microbiology culture data is actionable), and varying practices for escalating care (eg, referring patients back to the hospital).
Our study was limited by small sample size and low PCP response rate. Nonetheless, the findings suggest that poor concordance between inpatient and ambulatory physicians will persist without tools that promote more effective communication. Greater awareness alone may be insufficient to mitigate consequences of missed TPAD results if physicians are not on the same page regarding which results require action.
To better engage PCPs, healthcare systems require HIT infrastructure that facilitates seamless care team communication across care settings.[2] When optimally configured, HIT can facilitate greater PCP involvement in postdischarge communication. For example, our system promoted subsequent postdischarge communication in 78% of initial discordance in TPAD actionability; however, most of it was not between the attending and the PCP. Thus, improvements could be made to facilitate more effective communication among key inpatient and ambulatory providers. Furthermore, when configured to facilitate conversation among these providers regarding the discharge care plan throughout a patient's entire hospital course, HIT can promote effective knowledge transfer by virtue of adding clinical context to test ordering and follow‐up. Additional work is needed to understand whether such communication clarifies contingencies and facilitates appropriate postdischarge action. Nevertheless, current electronic solutions (eg, passive placement into results in‐baskets) will likely be ineffective because they do not reliably improve awareness and active communication about context, rationale, interpretation, suggested action, or transfer of responsibility.
In summary, discrepancies in TPAD actionability by inpatient and ambulatory providers still exist, even when awareness of TPAD results is improved by HIT. By fostering more effective communication among key care‐team members across care settings, HIT could mitigate the consequences of suboptimal care transitions. With regard to TPAD results, this may favorably impact unnecessary testing, diagnostic and therapeutic delays, and medical errors.
Disclosures: This article is based on research funded through AHRQ grant #R21HS018229; the authors have no other disclosures or conflicts or interest.
- , , , et al. Problems after discharge and understanding of communication with their primary care physicians among hospitalized seniors: a mixed methods study. J Hosp Med. 2010;5:385–391.
- . A primary care physician's ideal transitions of care—where's the evidence? J Hosp Med. 2013;8(8):472–477.
- , , , et al. Deficits in communication and information transfer between hospital‐based and primary care physicians: implications for patient safety and continuity of care. JAMA. 2007;297(8):831–841.
- , , , , . The incidence and severity of adverse events affecting patients after discharge from the hospital. Ann Intern Med. 2003;138:161–167.
- , , , . Moving beyond readmission penalties: creating an ideal process to improve transitional care. J Hosp Med. 2012;8(2):102–109.
- , , , et al. Adequacy of hospital discharge summaries in documenting tests with pending results and outpatient follow‐up providers. J Gen Intern Med. 2009;24(9):1002–1006.
- , , , et al. Patient safety concerns rising from test results that return after hospital discharge. Ann Intern Med. 2005;143:121–128.
- , , , et al. Design and implementation of an automated email notification system for results of tests pending at discharge. J Am Med Inform Assoc. 2012;19(4):523–528.
- , , , et al. Impact of an automated email notification system for results of rest pending at discharge: a cluster‐randomized controlled trial [published online ahead of print October 23, 2013]. J Am Med Inform Assoc. doi:10.1136/amiajnl‐2013‐002030.
Race, geography play role in MGUS incidence

showing multiple myeloma
Blacks may be twice as likely as whites to develop multiple myeloma (MM) because they are more likely to have monoclonal gammopathy of undetermined significance (MGUS), according to research published in Leukemia.
In a US-wide study, researchers found that MGUS is more common in blacks than in whites or Hispanics.
And the type of MGUS seen in the black population is more apt to have features associated with a higher risk of progression to full-blown MM.
The study also revealed different rates of MGUS in different parts of the country, which suggests there may be an environmental component to the racial disparities.
“We have known for a long time that there is a marked racial disparity in multiple myeloma, but the big question has been why that disparity exists,” said study author Vincent Rajkumar, MD, of the Mayo Clinic in Rochester, Minnesota.
“We suspected it may be genetic or it may be environmental. We also thought that the predisposing factor is more common, or it may be that the predisposing factor progresses to cancer much more quickly. We found that the answer is all of the above.”
A number of studies have investigated the prevalence of MGUS in various populations. The most prominent took place in the predominantly white community of Olmsted County, Minnesota. There, researchers estimated that MGUS occurred in approximately 3.2% of individuals aged 50 and older.
In the current study, Dr Rajkumar and his colleagues set out to determine the prevalence of MGUS in blacks and Hispanics, as well as whites in other parts of the country. They analyzed stored serum samples of 12,482 people older than 50 years of age taken from the National Health and Nutritional Examination Survey.
By examining the M protein present in each sample, the researchers assessed both the prevalence of MGUS and its likelihood for progression. They found that the prevalence of MGUS was significantly higher in blacks (3.7%) compared with whites (2.3%) or Hispanics (1.8%), as were features that posed a higher risk of progression to MM.
The researchers were surprised that the prevalence of MGUS in whites in their national sample was significantly lower than the rates previously reported for Olmsted County. However, when they broke down the national numbers into geographic regions, they found that people living in Northern and Midwestern states have a higher incidence of MGUS than those living in Southern and Western states.
“We would have missed this geographic difference if we hadn’t looked at the whole country,” Dr Rajkumar said. “This is the largest study of its kind and the first to look at MGUS in a sample of the entire US population.”
Dr Rajkumar and his colleagues are now investigating the underlying causes of these geographic variations to see if they can identify the genetic and environmental factors contributing to the risk of MGUS. They are also repeating their experiments in samples from individuals under age 50 in an effort to pinpoint when the risk of MGUS and, ultimately, MM begins. ![]()
Group compares anticoagulants as stroke prophylaxis in NVAF

Credit: Kevin MacKenzie
Updated guidelines from the American Academy of Neurology provide a comparison of oral anticoagulants as stroke prophylaxis in patients with nonvalvular atrial fibrillation (NVAF).
The guidelines suggest that newer anticoagulants, such as dabigatran, rivaroxaban, and apixaban, are at least as effective, if not more effective, than warfarin at preventing stroke in patients with NVAF. But bleeding risks vary.
Clopidogrel plus aspirin appears to be less effective than warfarin and its derivatives but more effective than aspirin alone.
Apixaban also appears to be more effective than aspirin, with a similar bleeding risk. And triflusal plus acenocoumarol is likely more effective than acenocoumarol alone.
“Of course, doctors will need to consider the individual patient’s situation in making a decision whether or not to use anticoagulants and which one to use, as the risks and benefits can vary for each person,” said guideline author Antonio Culebras, MD, of SUNY Upstate Medical University in Syracuse, New York.
Comparing therapies
The authors noted that several new anticoagulants have been developed since the American Academy of Neurology’s last published guidelines on this topic, in 1998.
For the current guidelines, the authors evaluated the results of 6 studies comparing antithrombotics to warfarin and its derivatives, as well as 2 studies comparing antithrombotics to aspirin.
One study suggested that dabigatran is probably more effective than warfarin for reducing the risk of stroke or systemic embolism. Hemorrhage risks were similar with the 2 drugs. But intracranial hemorrhage was less frequent with dabigatran, and gastrointestinal bleeding was higher with dabigatran.
Another study indicated that rivaroxaban is likely as effective as warfarin for preventing cerebral and systemic embolism. Patients who received rivaroxaban had an increased risk of gastrointestinal bleeding but a decreased risk of intracranial hemorrhage and fatal bleeding.
Apixaban seemed to be more effective than warfarin in patients with NVAF who were at moderate risk of embolism. However, this superiority appeared to be the result of a decreased risk in bleeding and reduced mortality. Apixaban was no more effective than warfarin in reducing the risk of cerebral and systemic embolism.
Yet another study suggested that vitamin K antagonists (VKAs) are likely more effective than clopidogrel plus aspirin as stroke prevention in NVAF patients. However, intracranial bleeding was more common with VKAs.
In NVAF patients at moderate risk of stroke, treatment with triflusal plus acenocoumarol and moderate-intensity anticoagulation (INR target 1.25–2.0) appeared to be more effective than treatment with acenocoumarol alone and conventional-intensity anticoagulation (INR target 2.0–3.0).
Low-dose aspirin plus dose-adjusted VKA (fluindione) appeared to increase the risk of hemorrhagic complications compared to VKA therapy alone. However, there was not enough evidence to determine whether aspirin plus VKA decreases the risk of ischemic stroke or other thromboembolic events.
Apixaban appeared to be more effective than aspirin for decreasing the risk of stroke or systemic embolism in patients with NVAF who have a moderate risk of embolism and are not candidates for warfarin treatment. And the bleeding risks were similar with apixaban and aspirin.
In patients with NVAF who were ineligible for VKA therapy, clopidogrel plus aspirin reduced the risk of major vascular events, especially stroke, when compared to aspirin alone. However, the combination also increased the risk of major hemorrhage, including intracranial bleeding.
Recommendations
The authors noted that determining stroke risk in NVAF patients is difficult. So they recommend that clinicians weigh the risks and benefits of stroke prophylaxis in each patient. The authors also recommend informing patients about the potential risk of stroke and taking the patient’s preferences into account.
Clinicians should routinely offer anticoagulant therapy to patients with NVAF and a history of transient ischemic attack or stroke. On the other hand, anticoagulants might not be necessary in NVAF patients who lack additional risk factors for stroke.
Clinicians should use a risk-stratification scheme to help them identify patients at a higher risk for stroke and those with no clinically significant risk. However, anticoagulation thresholds are not necessarily definitive indicators of the need for anticoagulant therapy.
When choosing among anticoagulants, clinicians should consider the individual patient’s needs and take into account the aforementioned efficacy and safety data.
For more details, see the guidelines in Neurology. ![]()
Placenta fails to deliver: Mother dies of hemorrhage
PLACENTA FAILS TO DELIVER: MOTHER DIES OF HEMORRHAGE
After a 38-year-old woman gave birth, the placenta did not deliver. The ObGyn was unable remove the entire placenta and the mother began to hemorrhage. After an hour, the patient was given a blood transfusion. She could not be stabilized and died.
ESTATE’S CLAIM The ObGyn was negligent. He failed to remove the entire placenta and did not treat the hemorrhage in a timely manner. The hospital staff was negligent in failing to properly address the massive hemorrhage. A prompt transfusion would have saved the woman’s life, but the anesthesiologist who had to approve the procedure could not be located. Other procedures, including a hysterectomy, could have saved the mother’s life.
DEFENDANTS’ DEFENSE The ObGyn claimed that incomplete delivery of the placenta and postpartum hemorrhage are known complications of a delivery. The hospital claimed that the staff had acted appropriately and that it was not responsible for the actions of the anesthesiologist, an independent contractor. The anesthesiologist denied negligence.
VERDICT A $2 million New York settlement was reached that included $200,000 from the hospital and $1.8 million from the physicians’ insurers.
Related Article: Postpartum hemorrhage: 11 critical questions, answered by an expert Haywood L. Brown, MD (January 2011)
DECREASED FETAL MOVEMENT OVERLOOKED; SEVERE INJURY TO BABY
At her 39th-week prenatal visit at a clinic, the mother reported decreased fetal movement. Acoustic stimulation of the fetus was attempted twice without response. The fetal heart-rate monitor identified a normal heart rate without variability or accelerations. The mother was taken by wheelchair to the hospital next door. A note explaining the nonreassuring findings allegedly accompanied her.
The mother waited to be admitted. When a fetal heart-rate monitor was connected 30 minutes after admission, results were still nonreassuring.
A resident examined the mother 45 minutes later. He called the attending ObGyn, and they decided to postpone cesarean delivery because the mother had eaten breakfast.
When the fetal heart rate crashed 4 hours later, a second-year resident began emergency cesarean delivery. The ObGyn, who had never examined the patient, observed some of the procedure in the OR.
The baby was born with catastrophic brain damage, and has spastic quadriplegia cerebral palsy, feeding problems, and significant cognitive and developmental delays.
PARENTS’ CLAIM A cesarean delivery should have been performed immediately after the mother’s admission. Even if the cesarean had been begun 15 to 20 minutes earlier, the injury could have been avoided. The ObGyn never examined the mother nor did he participate in the cesarean delivery.
DEFENDANTS’ DEFENSE The ObGyn and hospital denied negligence. The note was not attached to the patient’s chart. At trial, the ObGyn admitted that a delivery 15 to 20 minutes earlier might have avoided the injury.
VERDICT A $33,591,900 Tennessee verdict was returned.
WOMAN BECOMES PREGNANT AFTER TUBAL LIGATION
A 32-year-old woman requested sterilization after the birth of her third child. A Falope ring tubal ligation procedure was performed by a gynecologist in April 2006. During surgery, the device used by the gynecologist ejected 2 silastic bands on the right side instead of one.
The patient learned she was pregnant in March 2007. Her high-risk pregnancy ended with cesarean delivery in September 2007. The delivering ObGyn found the patient’s right fallopian tube in its natural, unscarred state. A silastic band was applied to the right ovarian ligament, not the right fallopian tube.
PATIENT’S CLAIM The gynecologist banded the ovarian ligament instead of the fallopian tube.
PHYSICIAN’S DEFENSE The procedure was properly performed. The rings initially enclosed the fallopian tube and ovarian ligament, but the top ring subsequently migrated off the structures, allowing the fallopian tube to slip out of the attachment. Failure to sterilize is a known risk of the procedure.
VERDICT An Illinois defense verdict was returned.

ABORTION ATTEMPTED BUT PREGNANCY IS ECTOPIC
A 14-year-old patient went to a clinic for elective abortion at 8 weeks’ gestation. Ultrasonography (US) prior to the procedure showed an intrauterine pregnancy. After dilating the cervix, the ObGyn inserted a semi-rigid vacuum aspiration curette to suction the uterine contents, but received nothing. A second US confirmed an intrauterine pregnancy. The ObGyn was able to locate the pregnancy and indent the gestational sac with 3 different dilators and the curette. The pregnancy decreased in size on US after the suction was applied. However, the patient’s vital signs dropped dramatically, and she was rushed to the hospital. During emergency surgery, severe pelvic adhesive disease complicated the ability to stop the hemorrhage. Four physicians concurred that supracervical hysterectomy was needed to save the patient’s life. Postoperative pathology identified a cornual or interstitial ectopic pregnancy.
PATIENT’S CLAIM The ObGyn failed to heed several warning signs of ectopic pregnancy. Further testing should have been done before the second round of vacuum. If ectopic pregnancy had been discovered earlier, the patient could have undergone surgery that would have preserved her uterus and allowed her to bear children. The ObGyn tore the uterus multiple times when he turned on the suction, causing massive hemorrhage.
PHYSICIAN’S DEFENSE Ultrasonography clearly showed an intrauterine pregnancy. There was nothing to cause suspicion that the pregnancy was ectopic. She might be able to have a child through surrogacy.
VERDICT A $950,000 Illinois verdict was returned.
Related Article: Is the hCG discriminatory zone a reliable indicator of intrauterine or ectopic pregnancy? Andrew M. Kaunitz, MD (Examining the Evidence, February 2012)
MACROSOMIC FETUS: MOTHER AND BABY BOTH INJURED
When prenatal ultrasonography indicated the fetal weight was 10 lbs, the patient and her mother expressed concern over delivery of such a large baby. The ObGyn reassured them that it would not be a problem.
Four days later, the mother went into labor. She was 9-cm dilated 4.5 hours later, but only progressed to 9.5 cm over the next 7 hours. She was told to begin to push, but, after 2 hours, birth had not occurred. The ObGyn used forceps to deliver the head 45 minutes later. Shoulder dystocia was encountered and there was a 3.5-minute delivery delay. The baby suffered oxygen deprivation and the mother experienced a 4th-degree perineal tear.
After the NICU team resuscitated the baby, she was transferred to another hospital, where she underwent “head cooling” in an attempt to mitigate her injuries. The child has mild cerebral palsy, with right hemiparesis, speech delay, and additional neurologic injuries.
PARENTS' CLAIM Cesarean delivery was unnecessarily delayed. The ObGyn was negligent in not performing an emergency cesarean delivery after 2 hours of pushing was not effective. The ObGyn never suggested a cesarean delivery, it was not noted in the chart, and no one else present at the time remembered the option being offered.
PHYSICIAN’S DEFENSE There was nothing during labor to contraindicate a vaginal birth. The ObGyn claimed that he offered a cesarean delivery after 2 hours of pushing. The baby’s blood gas reading at delivery was normal. Any brain injuries to the baby were from resuscitation.
VERDICT A $4,080,500 Pennsylvania verdict was returned.
Related Articles:
When macrosomia is suspected at term, does induction of labor lower the risk of cesarean delivery? Jennifer T. Ahn, MD (Examining the Evidence, May 2012)
Develop and use a checklist for 3rd- and 4th-degree perinatal lacerations Robert L. Barbieri, MD (Editorial, August 2013)
BOWEL INJURY DURING CESAREAN DELIVERY
During cesarean delivery, the mother suffered a bowel injury that led to infection and several abdominal abscesses. She required two procedures for drain placement plus two additional operations.
PATIENT’S CLAIM The ObGyn was negligent in how he performed the cesarean delivery and for not treating the injury and subsequent infection in a timely manner. The abscesses took 3 years to resolve; additional procedures left scarring and aggravated a spinal injury.
PHYSICIAN’S DEFENSE Bowel perforation is a known complication of cesarean delivery. It probably occurred during manipulation of the uterus in an area that was not visible.
VERDICT A $750,000 New Jersey verdict was returned.
Related Article: How to avoid intestinal and urinary tract injuries during gynecologic laparoscopy Michael Baggish, MD (Surgical Technique, October 2012)
These cases were selected by the editors of OBG Management from Medical Malpractice Verdicts, Settlements & Experts, with permission of the editor, Lewis Laska (www.verdictslaska.com). The information available to the editors about the cases presented here is sometimes incomplete. Moreover, the cases may or may not have merit. Nevertheless, these cases represent the types of clinical situations that typically result in litigation and are meant to illustrate nationwide variation in jury verdicts and awards.
TELL US WHAT YOU THINK!
Share your thoughts on this article or on any topic relevant to ObGyns and women’s health practitioners. Tell us which topics you’d like to see covered in future issues, and what challenges you face in daily practice. We will consider publishing your letter and in a future issue.
Send your letter to: [email protected] Please include the city and state in which you practice.
Stay in touch! Your feedback is important to us!
PLACENTA FAILS TO DELIVER: MOTHER DIES OF HEMORRHAGE
After a 38-year-old woman gave birth, the placenta did not deliver. The ObGyn was unable remove the entire placenta and the mother began to hemorrhage. After an hour, the patient was given a blood transfusion. She could not be stabilized and died.
ESTATE’S CLAIM The ObGyn was negligent. He failed to remove the entire placenta and did not treat the hemorrhage in a timely manner. The hospital staff was negligent in failing to properly address the massive hemorrhage. A prompt transfusion would have saved the woman’s life, but the anesthesiologist who had to approve the procedure could not be located. Other procedures, including a hysterectomy, could have saved the mother’s life.
DEFENDANTS’ DEFENSE The ObGyn claimed that incomplete delivery of the placenta and postpartum hemorrhage are known complications of a delivery. The hospital claimed that the staff had acted appropriately and that it was not responsible for the actions of the anesthesiologist, an independent contractor. The anesthesiologist denied negligence.
VERDICT A $2 million New York settlement was reached that included $200,000 from the hospital and $1.8 million from the physicians’ insurers.
Related Article: Postpartum hemorrhage: 11 critical questions, answered by an expert Haywood L. Brown, MD (January 2011)
DECREASED FETAL MOVEMENT OVERLOOKED; SEVERE INJURY TO BABY
At her 39th-week prenatal visit at a clinic, the mother reported decreased fetal movement. Acoustic stimulation of the fetus was attempted twice without response. The fetal heart-rate monitor identified a normal heart rate without variability or accelerations. The mother was taken by wheelchair to the hospital next door. A note explaining the nonreassuring findings allegedly accompanied her.
The mother waited to be admitted. When a fetal heart-rate monitor was connected 30 minutes after admission, results were still nonreassuring.
A resident examined the mother 45 minutes later. He called the attending ObGyn, and they decided to postpone cesarean delivery because the mother had eaten breakfast.
When the fetal heart rate crashed 4 hours later, a second-year resident began emergency cesarean delivery. The ObGyn, who had never examined the patient, observed some of the procedure in the OR.
The baby was born with catastrophic brain damage, and has spastic quadriplegia cerebral palsy, feeding problems, and significant cognitive and developmental delays.
PARENTS’ CLAIM A cesarean delivery should have been performed immediately after the mother’s admission. Even if the cesarean had been begun 15 to 20 minutes earlier, the injury could have been avoided. The ObGyn never examined the mother nor did he participate in the cesarean delivery.
DEFENDANTS’ DEFENSE The ObGyn and hospital denied negligence. The note was not attached to the patient’s chart. At trial, the ObGyn admitted that a delivery 15 to 20 minutes earlier might have avoided the injury.
VERDICT A $33,591,900 Tennessee verdict was returned.
WOMAN BECOMES PREGNANT AFTER TUBAL LIGATION
A 32-year-old woman requested sterilization after the birth of her third child. A Falope ring tubal ligation procedure was performed by a gynecologist in April 2006. During surgery, the device used by the gynecologist ejected 2 silastic bands on the right side instead of one.
The patient learned she was pregnant in March 2007. Her high-risk pregnancy ended with cesarean delivery in September 2007. The delivering ObGyn found the patient’s right fallopian tube in its natural, unscarred state. A silastic band was applied to the right ovarian ligament, not the right fallopian tube.
PATIENT’S CLAIM The gynecologist banded the ovarian ligament instead of the fallopian tube.
PHYSICIAN’S DEFENSE The procedure was properly performed. The rings initially enclosed the fallopian tube and ovarian ligament, but the top ring subsequently migrated off the structures, allowing the fallopian tube to slip out of the attachment. Failure to sterilize is a known risk of the procedure.
VERDICT An Illinois defense verdict was returned.
ABORTION ATTEMPTED BUT PREGNANCY IS ECTOPIC
A 14-year-old patient went to a clinic for elective abortion at 8 weeks’ gestation. Ultrasonography (US) prior to the procedure showed an intrauterine pregnancy. After dilating the cervix, the ObGyn inserted a semi-rigid vacuum aspiration curette to suction the uterine contents, but received nothing. A second US confirmed an intrauterine pregnancy. The ObGyn was able to locate the pregnancy and indent the gestational sac with 3 different dilators and the curette. The pregnancy decreased in size on US after the suction was applied. However, the patient’s vital signs dropped dramatically, and she was rushed to the hospital. During emergency surgery, severe pelvic adhesive disease complicated the ability to stop the hemorrhage. Four physicians concurred that supracervical hysterectomy was needed to save the patient’s life. Postoperative pathology identified a cornual or interstitial ectopic pregnancy.
PATIENT’S CLAIM The ObGyn failed to heed several warning signs of ectopic pregnancy. Further testing should have been done before the second round of vacuum. If ectopic pregnancy had been discovered earlier, the patient could have undergone surgery that would have preserved her uterus and allowed her to bear children. The ObGyn tore the uterus multiple times when he turned on the suction, causing massive hemorrhage.
PHYSICIAN’S DEFENSE Ultrasonography clearly showed an intrauterine pregnancy. There was nothing to cause suspicion that the pregnancy was ectopic. She might be able to have a child through surrogacy.
VERDICT A $950,000 Illinois verdict was returned.
Related Article: Is the hCG discriminatory zone a reliable indicator of intrauterine or ectopic pregnancy? Andrew M. Kaunitz, MD (Examining the Evidence, February 2012)
MACROSOMIC FETUS: MOTHER AND BABY BOTH INJURED
When prenatal ultrasonography indicated the fetal weight was 10 lbs, the patient and her mother expressed concern over delivery of such a large baby. The ObGyn reassured them that it would not be a problem.
Four days later, the mother went into labor. She was 9-cm dilated 4.5 hours later, but only progressed to 9.5 cm over the next 7 hours. She was told to begin to push, but, after 2 hours, birth had not occurred. The ObGyn used forceps to deliver the head 45 minutes later. Shoulder dystocia was encountered and there was a 3.5-minute delivery delay. The baby suffered oxygen deprivation and the mother experienced a 4th-degree perineal tear.
After the NICU team resuscitated the baby, she was transferred to another hospital, where she underwent “head cooling” in an attempt to mitigate her injuries. The child has mild cerebral palsy, with right hemiparesis, speech delay, and additional neurologic injuries.
PARENTS' CLAIM Cesarean delivery was unnecessarily delayed. The ObGyn was negligent in not performing an emergency cesarean delivery after 2 hours of pushing was not effective. The ObGyn never suggested a cesarean delivery, it was not noted in the chart, and no one else present at the time remembered the option being offered.
PHYSICIAN’S DEFENSE There was nothing during labor to contraindicate a vaginal birth. The ObGyn claimed that he offered a cesarean delivery after 2 hours of pushing. The baby’s blood gas reading at delivery was normal. Any brain injuries to the baby were from resuscitation.
VERDICT A $4,080,500 Pennsylvania verdict was returned.
Related Articles:
When macrosomia is suspected at term, does induction of labor lower the risk of cesarean delivery? Jennifer T. Ahn, MD (Examining the Evidence, May 2012)
Develop and use a checklist for 3rd- and 4th-degree perinatal lacerations Robert L. Barbieri, MD (Editorial, August 2013)
BOWEL INJURY DURING CESAREAN DELIVERY
During cesarean delivery, the mother suffered a bowel injury that led to infection and several abdominal abscesses. She required two procedures for drain placement plus two additional operations.
PATIENT’S CLAIM The ObGyn was negligent in how he performed the cesarean delivery and for not treating the injury and subsequent infection in a timely manner. The abscesses took 3 years to resolve; additional procedures left scarring and aggravated a spinal injury.
PHYSICIAN’S DEFENSE Bowel perforation is a known complication of cesarean delivery. It probably occurred during manipulation of the uterus in an area that was not visible.
VERDICT A $750,000 New Jersey verdict was returned.
Related Article: How to avoid intestinal and urinary tract injuries during gynecologic laparoscopy Michael Baggish, MD (Surgical Technique, October 2012)
These cases were selected by the editors of OBG Management from Medical Malpractice Verdicts, Settlements & Experts, with permission of the editor, Lewis Laska (www.verdictslaska.com). The information available to the editors about the cases presented here is sometimes incomplete. Moreover, the cases may or may not have merit. Nevertheless, these cases represent the types of clinical situations that typically result in litigation and are meant to illustrate nationwide variation in jury verdicts and awards.
TELL US WHAT YOU THINK!
Share your thoughts on this article or on any topic relevant to ObGyns and women’s health practitioners. Tell us which topics you’d like to see covered in future issues, and what challenges you face in daily practice. We will consider publishing your letter and in a future issue.
Send your letter to: [email protected] Please include the city and state in which you practice.
Stay in touch! Your feedback is important to us!
Is there a primary care tool to detect aberrant drug-related behaviors in patients on opioids?
Yes. Of the several screening instruments developed and originally validated in patients in a pain center population (TABLE), one also has been validated in primary care. The Current Opioid Misuse Measure (COMM) predicts aberrant drug-related behaviors in primary care patients who have been prescribed opioids within the past 12 months with a sensitivity of 77% and specificity of 77% (strength of recommendation [SOR]: B, cohort studies).
Although not validated in primary care populations, 3 other instruments (the Addiction Behaviors Checklist [ABC], Prescription Opioid Misuse Index [POMI], and Prescription Drug Use Questionnaire [PDUQ]) detect aberrant drug-related behaviors in pain center patients with chronic pain with sensitivities of 82% to 87.5% and specificities of 86.14% to 92.3% (SOR: B, cohort studies).
EVIDENCE SUMMARY
The COMM—originally designed to detect recent aberrant drug-related behaviors in pain center patients—was validated by a cross-sectional study involving 238 primary care patients who had been prescribed an opioid within the previous 12 months.1
The study authors defined aberrant drug-related behaviors as meeting the criteria for prescription drug use disorder in the Diagnostic and Statistical Manual of Mental Disorders, 4th edition (DSM-IV). High COMM scores significantly predicted this diagnosis (P<.001). A COMM cutoff score >13 yielded a sensitivity of 77% and a specificity of 77% (positive predictive value=0.30; negative predictive value=0.96).
Development of the COMM. The authors of the COMM developed questions by expert consensus for use in a population of patients in a pain center. They established the validity of the questions by correlating COMM results from a cohort of pain center patients with 2 previously validated instruments: The Marlowe-Crowne Social Desirability Scale and the Aberrant Drug Behavior Index. They also tested COMM’s validity for monitoring changes in aberrant drug-related behaviors in a second cohort (sensitivity=94%; specificity=73%).2 They later cross-validated COMM with another group of 226 patients treated at pain management clinics, achieving similar results.3
Three additional tools have been validated only among pain clinic patients
The ABC was developed based on literature review and validated against the PDUQ and clinician judgment of opioid misuse. Scores on the ABC differed significantly between patients who were discontinued from opioid therapy (based on urine toxicology, for example) and patients who weren’t (P=.021).4
The authors of the POMI determined sensitivity and specificity by comparing the POMI with DSM-IV diagnostic criteria for opiate addiction. One weakness of this index is that it is based on a small, homogenous sample.5
Items in the PDUQ were based on a literature review and extracts from the charts of patients with chronic pain.6
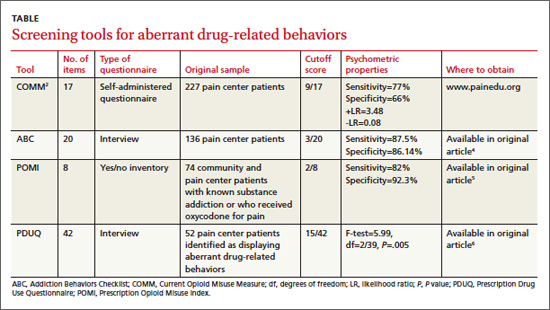
Additional reviews
Two systematic reviews of screening tools used to predict aberrant behaviors in pain center populations included several studies with methodologic limitations.7,8
RECOMMENDATIONS
A guideline from the American Pain Society based on a systematic review concluded that the most predictive factor for aberrant drug-related behaviors is a personal or family history of drug or alcohol abuse.9,10 In 2009, APS and American Academy of Pain Medicine developed guidelines to assist in selecting, risk-stratifying, and monitoring patients on chronic pain medication.9,10 The American Society of Interventional Pain Physicians recommends evaluation of misuse risk, but considers screening tools an optional measure during initial assessment for opioid prescribing.11
1. Meltzer EC, Rybin D, Saitz R, et al. Identifying prescription opioid use disorder in primary care: diagnostic characteristics of the Current Opioid Misuse Measure (COMM). Pain. 2011;152:397-402.
2. Butler SF, Budham SH, Fernandez KC, et al. Development and validation of the Current Opioid Misuse Measure. Pain. 2007;130:144-156.
3. Butler SF, Budman SH, Fanciullo GJ, et al. Cross validation of the current opioid misuse measure (COMM) to monitor chronic pain patients on opioid therapy. Clin J Pain. 2010;26:770-776.
4. Wu SM, Compton P, Bolus R, et. al. The addiction behaviors checklist: validation of a new clinician-based measure of inappropriate opioid use in chronic pain. J Pain Symptom Manage. 2006;32:342-351.
5. Knisely JS, Wunsch MJ, Cropsey KL, et al. Prescription Opioid Misuse Index: A brief questionnaire to assess misuse. J Subst Abuse Treat. 2008;35:380-386.
6. Compton P, Darakjian J, Miotto K. Screening for addiction in patients with chronic pain and “problematic” substance use: evaluation of a pilot assessment tool. J Pain Symptom Manage. 1998;16:355-363.
7. Sehgal N, Manchikanti L, Smith HS. Prescription opioid abuse in chronic pain: a review of opioid abuse predictors and strategies to curb opioid abuse. Pain Physician. 2012;15(3 suppl):ES67-ES92.
8. Solanki DR, Koyyalagunta D, Shah RV, et al. Monitoring opioid adherence in chronic pain patients: assessment of risk of substance misuse. Pain Physician. 2011;14:E119-E131.
9. Chou R. 2009 Clinical guidelines from the American Pain Society and the American Academy of Pain Medicine on the use of chronic opioid therapy in chronic noncancer pain: what are the key messages for clinical practice? Pol Arch Med Wewn. 2009;119:469-477.
10. Chou R, Fanciullo GJ, Fine PG, et al. Clinical guidelines for the use of chronic opioid therapy in chronic noncancer pain. J Pain. 2009;10:113-130.
11. Manchikanti L, Abdi S, Alturi S, et al; American Pain Society-American Academy of Pain Medicine Opioids Guidelines Panel. American Society of Interventional Pain Physicians (ASIPP) guidelines for responsible opioid prescribing in chronic non-cancer pain: Part 2—guidance. Pain Physician. 2012;15(3 suppl):S67-S116.
Yes. Of the several screening instruments developed and originally validated in patients in a pain center population (TABLE), one also has been validated in primary care. The Current Opioid Misuse Measure (COMM) predicts aberrant drug-related behaviors in primary care patients who have been prescribed opioids within the past 12 months with a sensitivity of 77% and specificity of 77% (strength of recommendation [SOR]: B, cohort studies).
Although not validated in primary care populations, 3 other instruments (the Addiction Behaviors Checklist [ABC], Prescription Opioid Misuse Index [POMI], and Prescription Drug Use Questionnaire [PDUQ]) detect aberrant drug-related behaviors in pain center patients with chronic pain with sensitivities of 82% to 87.5% and specificities of 86.14% to 92.3% (SOR: B, cohort studies).
EVIDENCE SUMMARY
The COMM—originally designed to detect recent aberrant drug-related behaviors in pain center patients—was validated by a cross-sectional study involving 238 primary care patients who had been prescribed an opioid within the previous 12 months.1
The study authors defined aberrant drug-related behaviors as meeting the criteria for prescription drug use disorder in the Diagnostic and Statistical Manual of Mental Disorders, 4th edition (DSM-IV). High COMM scores significantly predicted this diagnosis (P<.001). A COMM cutoff score >13 yielded a sensitivity of 77% and a specificity of 77% (positive predictive value=0.30; negative predictive value=0.96).
Development of the COMM. The authors of the COMM developed questions by expert consensus for use in a population of patients in a pain center. They established the validity of the questions by correlating COMM results from a cohort of pain center patients with 2 previously validated instruments: The Marlowe-Crowne Social Desirability Scale and the Aberrant Drug Behavior Index. They also tested COMM’s validity for monitoring changes in aberrant drug-related behaviors in a second cohort (sensitivity=94%; specificity=73%).2 They later cross-validated COMM with another group of 226 patients treated at pain management clinics, achieving similar results.3
Three additional tools have been validated only among pain clinic patients
The ABC was developed based on literature review and validated against the PDUQ and clinician judgment of opioid misuse. Scores on the ABC differed significantly between patients who were discontinued from opioid therapy (based on urine toxicology, for example) and patients who weren’t (P=.021).4
The authors of the POMI determined sensitivity and specificity by comparing the POMI with DSM-IV diagnostic criteria for opiate addiction. One weakness of this index is that it is based on a small, homogenous sample.5
Items in the PDUQ were based on a literature review and extracts from the charts of patients with chronic pain.6
Additional reviews
Two systematic reviews of screening tools used to predict aberrant behaviors in pain center populations included several studies with methodologic limitations.7,8
RECOMMENDATIONS
A guideline from the American Pain Society based on a systematic review concluded that the most predictive factor for aberrant drug-related behaviors is a personal or family history of drug or alcohol abuse.9,10 In 2009, APS and American Academy of Pain Medicine developed guidelines to assist in selecting, risk-stratifying, and monitoring patients on chronic pain medication.9,10 The American Society of Interventional Pain Physicians recommends evaluation of misuse risk, but considers screening tools an optional measure during initial assessment for opioid prescribing.11
1. Meltzer EC, Rybin D, Saitz R, et al. Identifying prescription opioid use disorder in primary care: diagnostic characteristics of the Current Opioid Misuse Measure (COMM). Pain. 2011;152:397-402.
2. Butler SF, Budham SH, Fernandez KC, et al. Development and validation of the Current Opioid Misuse Measure. Pain. 2007;130:144-156.
3. Butler SF, Budman SH, Fanciullo GJ, et al. Cross validation of the current opioid misuse measure (COMM) to monitor chronic pain patients on opioid therapy. Clin J Pain. 2010;26:770-776.
4. Wu SM, Compton P, Bolus R, et. al. The addiction behaviors checklist: validation of a new clinician-based measure of inappropriate opioid use in chronic pain. J Pain Symptom Manage. 2006;32:342-351.
5. Knisely JS, Wunsch MJ, Cropsey KL, et al. Prescription Opioid Misuse Index: A brief questionnaire to assess misuse. J Subst Abuse Treat. 2008;35:380-386.
6. Compton P, Darakjian J, Miotto K. Screening for addiction in patients with chronic pain and “problematic” substance use: evaluation of a pilot assessment tool. J Pain Symptom Manage. 1998;16:355-363.
7. Sehgal N, Manchikanti L, Smith HS. Prescription opioid abuse in chronic pain: a review of opioid abuse predictors and strategies to curb opioid abuse. Pain Physician. 2012;15(3 suppl):ES67-ES92.
8. Solanki DR, Koyyalagunta D, Shah RV, et al. Monitoring opioid adherence in chronic pain patients: assessment of risk of substance misuse. Pain Physician. 2011;14:E119-E131.
9. Chou R. 2009 Clinical guidelines from the American Pain Society and the American Academy of Pain Medicine on the use of chronic opioid therapy in chronic noncancer pain: what are the key messages for clinical practice? Pol Arch Med Wewn. 2009;119:469-477.
10. Chou R, Fanciullo GJ, Fine PG, et al. Clinical guidelines for the use of chronic opioid therapy in chronic noncancer pain. J Pain. 2009;10:113-130.
11. Manchikanti L, Abdi S, Alturi S, et al; American Pain Society-American Academy of Pain Medicine Opioids Guidelines Panel. American Society of Interventional Pain Physicians (ASIPP) guidelines for responsible opioid prescribing in chronic non-cancer pain: Part 2—guidance. Pain Physician. 2012;15(3 suppl):S67-S116.
Evidence-based answers from the Family Physicians Inquiries Network