User login
Efficacy, not tolerability, of bowel prep is primary
The efficacy, not the tolerability, of bowel cleansing is the primary concern in patients undergoing colonoscopy, because of the substantial adverse consequences of inadequate bowel preparation, according to a consensus report published simultaneously in Gastroenterology, the American Journal of Gastroenterology, and Gastrointestinal Endoscopy.
As many as 20%-25% of all colonoscopies reportedly have inadequate bowel cleansing, which is associated with lower rates of lesion detection, longer procedure times, and increased electrocautery risks, in addition to the excess costs and risks of repeat procedures. “Efficacy should be a higher priority than tolerability, [so] the choice of a bowel-cleansing regimen should be based on cleansing efficacy first and patient tolerability second,” said Dr. David A. Johnson of Eastern Veterans Administration Medical School, Norfolk (Va.) and his associates on the U.S. Multi-Society Task Force on Colorectal Cancer.

The USMSTF comprised representatives from the American College of Gastroenterology, the American Gastroenterological Association, and the American Society for Gastrointestinal Endoscopy, who compiled recommendations and wrote this report based on a systematic review and meta-analysis of the literature concerning bowel preparation from 1980 to the present.
When selecting a bowel-cleansing regimen for patients, physicians should consider the patient’s medical history, medications, and, if applicable, the adequacy of bowel preparation for previous colonoscopies. High-quality evidence shows that a split-dose regimen of 4 liters of polyethylene glycol–electrolyte lavage solution (PEG-ELS) provides superior bowel cleansing to other doses and solutions. The second dose ideally should begin 4-6 hours and conclude at least 2 hours before the procedure time. However, same-day regimens are acceptable, especially for patients scheduled for an afternoon colonoscopy.
Using a split-dose regimen allows some flexibility with the diet on the day before the procedure. Instead of ingesting only clear liquids, patients can consume either a full liquid or a low-residue diet for part or all of the day preceding colonoscopy, which improves their tolerance of the bowel preparation.
Over-the-counter, nonapproved (by the FDA) bowel-cleansing agents have widely varying efficacy, ranging from adequate to excellent. They generally are safe, but “caution is required when using these agents in certain populations” such as patients with chronic kidney disease. The routine use of adjunctive agents intended to enhance purgation or visualization of the mucosa is not recommended, Dr. Johnson and his associates said (Gastroenterology 2014;147:903-24).
At present, the evidence is insufficient to allow recommendation of specific bowel-preparation regimens for special patient populations such as the elderly, children and adolescents, people with inflammatory bowel disease, patients who have undergone bariatric surgery, and people with spinal cord injury. However, sodium phosphate preparations should be avoided in the elderly, children, and people with IBD. Additional bowel purgatives can be considered for patients at risk for inadequate preparation, such as those with a history of constipation, those using opioids or other constipating medications, those who have undergone previous colon resection, and those with spinal cord injury.
The report also includes recommendations concerning patient education, the risk factors for inadequate bowel preparation, assessing the adequacy of bowel preparation before and during the procedure, and salvage options for cases in which preparation is inadequate. It is available at http://dx.doi.org/10.1053/j.gastro.2014.07.002.
The efficacy, not the tolerability, of bowel cleansing is the primary concern in patients undergoing colonoscopy, because of the substantial adverse consequences of inadequate bowel preparation, according to a consensus report published simultaneously in Gastroenterology, the American Journal of Gastroenterology, and Gastrointestinal Endoscopy.
As many as 20%-25% of all colonoscopies reportedly have inadequate bowel cleansing, which is associated with lower rates of lesion detection, longer procedure times, and increased electrocautery risks, in addition to the excess costs and risks of repeat procedures. “Efficacy should be a higher priority than tolerability, [so] the choice of a bowel-cleansing regimen should be based on cleansing efficacy first and patient tolerability second,” said Dr. David A. Johnson of Eastern Veterans Administration Medical School, Norfolk (Va.) and his associates on the U.S. Multi-Society Task Force on Colorectal Cancer.
The USMSTF comprised representatives from the American College of Gastroenterology, the American Gastroenterological Association, and the American Society for Gastrointestinal Endoscopy, who compiled recommendations and wrote this report based on a systematic review and meta-analysis of the literature concerning bowel preparation from 1980 to the present.
When selecting a bowel-cleansing regimen for patients, physicians should consider the patient’s medical history, medications, and, if applicable, the adequacy of bowel preparation for previous colonoscopies. High-quality evidence shows that a split-dose regimen of 4 liters of polyethylene glycol–electrolyte lavage solution (PEG-ELS) provides superior bowel cleansing to other doses and solutions. The second dose ideally should begin 4-6 hours and conclude at least 2 hours before the procedure time. However, same-day regimens are acceptable, especially for patients scheduled for an afternoon colonoscopy.
Using a split-dose regimen allows some flexibility with the diet on the day before the procedure. Instead of ingesting only clear liquids, patients can consume either a full liquid or a low-residue diet for part or all of the day preceding colonoscopy, which improves their tolerance of the bowel preparation.
Over-the-counter, nonapproved (by the FDA) bowel-cleansing agents have widely varying efficacy, ranging from adequate to excellent. They generally are safe, but “caution is required when using these agents in certain populations” such as patients with chronic kidney disease. The routine use of adjunctive agents intended to enhance purgation or visualization of the mucosa is not recommended, Dr. Johnson and his associates said (Gastroenterology 2014;147:903-24).
At present, the evidence is insufficient to allow recommendation of specific bowel-preparation regimens for special patient populations such as the elderly, children and adolescents, people with inflammatory bowel disease, patients who have undergone bariatric surgery, and people with spinal cord injury. However, sodium phosphate preparations should be avoided in the elderly, children, and people with IBD. Additional bowel purgatives can be considered for patients at risk for inadequate preparation, such as those with a history of constipation, those using opioids or other constipating medications, those who have undergone previous colon resection, and those with spinal cord injury.
The report also includes recommendations concerning patient education, the risk factors for inadequate bowel preparation, assessing the adequacy of bowel preparation before and during the procedure, and salvage options for cases in which preparation is inadequate. It is available at http://dx.doi.org/10.1053/j.gastro.2014.07.002.
FROM GASTROENTEROLOGY
Key clinical point: Efficacy, not tolerability, of bowel preparation is the primary concern before colonoscopy.
Major finding: Up to 20%-25% of all colonoscopies have inadequate bowel preparation, which lowers detection rates, lengthens procedure time, raises electrocautery risks, and raises overall costs and risks by requiring repeat procedures.
Data source: A consensus statement based on a systematic review and meta-analysis of the literature concerning bowel preparation for colonoscopy.
Disclosures: This report was supported by the American College of Gastroenterology, the American Gastroenterological Association, and the American Society for Gastrointestinal Endoscopy, with further support provided by the U.S. Veterans Health Administration. Dr. Johnson reported serving as a consultant and clinical investigator for Epigenomics, Given Imaging, and Exact Sciences; his associates reported numerous ties to industry sources.

Point/Counterpoint: Is TEVAR required for all Type B aortic dissections?
Yes, TEVAR is clearly indicated.
Aortic dissection is a devastating condition afflicting an estimated two to eight per 100,000 people annually and comprises a large portion of the clinical entity known as the acute aortic syndromes. Patients presenting with an uncomplicated type B acute aortic dissection (TBAD) generally have low in-hospital mortality rates (2.4%-9%) when managed appropriately with anti-impulse therapy. However, survival continues to decrease with follow-up, with survival ranging between 80% and more than 95% at 1 year, progressing to approximately 75% at 3-4 years, and 48%-65% at 10 years. In late follow-up, the development of a new dissection with complications is estimated to occur in 20%-50% of patients. Complicated aortic dissections affect between 22% and 47%, and when present, mortality reaches more than 50% within the first week. TEVAR in these patients has been shown to be clearly indicated in a variety of studies with marked improvements in early mortality and late survival. Thus, one can see that aortic dissection is a disease that needs to be managed lifelong, and is associated with a high risk of mortality for the next 10 years after the initial presentation.1,2,3
The long-term effects of a patent false lumen have been well documented. Several studies following patients with chronic TBAD have documented progressive enlargement in aortic diameter with a patent false lumen. The mean increase in maximum aortic diameter ranges from 3.8 to 7.1 mm annually with any flow in the false lumen (FL) versus 1-2 mm per year with a thrombosed FL. Patients with a patent FL had 7.5 times increased risk of a dissection-related death or need for surgery as compared to patients with thrombosis of the FL. Dissection-related death or need for surgery occurred at a significantly earlier follow-up period in the patients with a patent FL.1,2,3
The aortic diameter may also influence the patency of the FL at presentation. In a review of 110 patients presenting with acute uncomplicated TBAD, 44% were identified to have a patent FL on initial imaging. Thirty-one percent of these patients had a maximum aortic diameter of 45 mm or more versus 14% of patients with a thrombosed FL (P = .053). Incidentally, patients with FL patency were on average 4 years younger than their thrombosed counterparts (62 vs. 66 years, P = .009).
Moreover, it appears that the long-term risks associated with a patent FL are further augmented by aortic dilatation at presentation. When combining both risk factors (FL patency and aortic diameter of 40 mm or more), only 22% of patients are dissection-related event–free at 5-year follow-up.Onitsuka et al.4 substantiated this finding on multivariate analysis. Interestingly, 10 of the 76 patients included in that study met both conditions, and seven of those patients (70%) experienced a dissection-related death or surgical conversion. Certainly patients meeting both criteria merit close follow-up for the development of aortic enlargement or symptoms of impending rupture.
The natural history of TBAD lends itself to at least some thrombus formation within the FL and is a common finding as the dissection becomes chronic. But in fact, partial thrombosis of the FL is associated with higher mortality in patients discharged from the hospital with stable TBAD at 1- and 3-year follow-up (15.4% and 31.6%, respectively). Matched patients with a patent FL had a 5.4% and 13.7% rate of mortality at 1 and 3 years, and patients with complete FL thrombosis were found to have mortality rates of 0% and 22.6% at the same follow-up.
Aortic remodeling after TEVAR
Placement of a thoracic endograft under these acute circumstances can often significantly alter the preoperative morphology of the true and false lumen. Schoder and colleagues5 followed changes in the TL and FL diameter in 20 patients after TEVAR for acute complicated dissection. Ninety percent of patients were found to have complete FL thrombosis of the thoracic aorta at 1 year, with a mean decrease in FL diameter of 11.6 mm. Two patients with a patent FL showed a mean increase in the maximal aortic diameter of 4.5 mm. In a similar study, Conrad et al.6 documented aortic remodeling of 21 patients in the year following TEVAR, 88% of whom had thrombosis of the FL. Most often the mobile septum is easily displaced by the radial force of the stent graft, with minimal limitation of expansion to the design diameter. Thus, endograft selection should be directed by the diameter of the normal unaffected aorta with minimal oversizing commonly limited to 5%-10%. Balloon profiling is not typically necessary.
The INSTEAD trial7 evaluated the management of uncomplicated type B aortic dissection and compared optimum medical therapy (OMT) to OMT with TEVAR. A total of 140 subjects were enrolled at seven European sites with 68 patients enrolled in OMT and 72 in OMT with TEVAR. In patients treated with TEVAR there was 90.6% complete FL thrombosis with a maximum true lumen diameter of 32.6 mm as compared to 22% and 18.7 mm in those treated with medical therapy alone. Furthermore, there was a 12.4% absolute risk reduction in aortic specific mortality and a 19.1% absolute risk reduction in disease progression in patients treated with TEVAR.
It is clear that patients that present with complicated type B aortic dissections mandate intervention with TEVAR and potentially other interventions to alleviate the complications at presentation. INSTEAD demonstrates that elective TEVAR results in favorable aortic remodeling and long-term survival, reinterventions were low, and it prevents late expansion and malperfusion. TEVAR was also associated with improved 5-year aortic-specific survival. TEVAR appears to be beneficial in those patients who present initially with a false lumen diameter of greater than 22 mm and an aortic diameter of greater than 40 mm with a patent false lumen.
References
1. Circ. Cardiovasc. Interv. 2013;4:407-16.
2. J. Vasc. Surg. 2012;55:641-51.
3. J. Vasc. Surg. 2011;54:985-92
4. Ann. Thorac. Surg. 2004;78:1268-73.
5. Ann. Thorac. Surg. 2007;83:1059-66.
6. J. Vasc. Surg. 2009;50:510-17.
7. Circulation 2009;120:2519-28.
Dr. Arko is with the Aortic Institute, Sanger Heart & Vascular Institute, Charlotte, N.C. He reported no relevant conflicts.
No, evidence supports careful choice of patients.
While the role of TEVAR has been proven to treat complications of acute type B dissections,1 its value as a prophylactic treatment in uncomplicated cases remains controversial. Optimal medical treatment (OMT) with strict blood pressure (SBP less than 120 mm Hg) and heart rate control is associated with a low morbidity and mortality, despite the risk of progressive aortic dilation. On the other hand TEVAR can result in early death and significant neurologic complications; other devastating complications of TEVAR include retrograde aortic dissection and access vessel rupture with a high associated mortality.
A meta-analysis of the published literature reported a high technical success of TEVAR for uncomplicated type B dissection and a relatively high conversion rate (20%) for patient treated with OMT, however the results did not identify an advantage for TEVAR with respect to 30-day and 2-year mortality.2

An expert panel review of the world literature also did not find significant data to support use of TEVAR for uncomplicated type B dissection.3 In the only randomized prospective trial to examine the role of TEVAR for uncomplicated type B dissection, the INSTEAD trial randomized 140 patients to OMT vs. OMT and TEVAR.4 The study results also did not support the use of TEVAR for the treatment of uncomplicated type B dissection, there was no survival advantage at 2 years, while TEVAR was associated with a 11.1% overall mortality and 4.3% neurologic complication rate, compared with 4.4% and 1.4% in the OMT group. The initial study did however report improved aortic remodeling at 2 years with TEVAR. The results of INSTEAD have been challenged because critical analysis of the INSTEAD trial has determined that the results were underpowered and that there was a 21% crossover in the OMT group and four patients received TEVAR that should have been excluded.5
Subsequent long-term analysis of the INSTEAD XL data do demonstrate a significant survival benefit and freedom from aortic adverse events in the TEVAR group after the initial 2-year analysis.6 At the 5-year follow up only 27 patients remained without a TEVAR. Fortunately there were no adverse events in the patients that crossed over to TEVAR from the OMT group demonstrating the safety of delayed TEVAR in this group. The high rate of aortic associated adverse events may favor early TEVAR. The INSTEAD XL study did identify a large primary tear (more than 10 mm) and an initial aortic diameter of 40 mm as risk factors to crossover suggesting a more aggressive approach in this subset of patients.
So while the INSTEAD XL trial now supports the use of TEVAR for uncomplicated type B dissections this was a relatively small trial that was underpowered in its initial analysis. Expert review of the world literature still supports medical management in the initial phase of treatment. Obviously in cases of failure of medical management TEVAR provides an effective treatment to restore the true lumen and visceral perfusion with possible sustained remodeling of the false lumen.
Given the not insignificant morbidity associated with TEVAR placement, routine treatment of all acute, uncomplicated type B dissections cannot be supported with the current evidence. However, a strategy of selective treatment based on size of the entry tear, extent of dissection, false lumen diameter and extent of thrombosis, effectiveness of antihypertension medications, ability to comply with medical therapy, and surveillance may be implemented. Furthermore treatment at centers of excellence with extensive TEVAR experience based on established protocols favor improved patient outcomes.
References
1. N. Engl. J. Med. 199;340:1546-52
2. Vasc. Endovascular. Surg. 2013 Oct 12;47(7):497-501. Epub 2013 Jul 12.
3. J. Am. Coll. Cardiol. 2013;61(16):1661-78.
4. Circulation 2009;120:2519-28.
5. Circulation 2009;120:2513-14.
6. Circ. Cardiovasc. Interv. 2013;6:407-16.
Dr. Shames is professor of surgery and radiology and program director of vascular surgery at the University of South Florida, Tampa. He reported no relevant conflicts.
Yes, TEVAR is clearly indicated.
Aortic dissection is a devastating condition afflicting an estimated two to eight per 100,000 people annually and comprises a large portion of the clinical entity known as the acute aortic syndromes. Patients presenting with an uncomplicated type B acute aortic dissection (TBAD) generally have low in-hospital mortality rates (2.4%-9%) when managed appropriately with anti-impulse therapy. However, survival continues to decrease with follow-up, with survival ranging between 80% and more than 95% at 1 year, progressing to approximately 75% at 3-4 years, and 48%-65% at 10 years. In late follow-up, the development of a new dissection with complications is estimated to occur in 20%-50% of patients. Complicated aortic dissections affect between 22% and 47%, and when present, mortality reaches more than 50% within the first week. TEVAR in these patients has been shown to be clearly indicated in a variety of studies with marked improvements in early mortality and late survival. Thus, one can see that aortic dissection is a disease that needs to be managed lifelong, and is associated with a high risk of mortality for the next 10 years after the initial presentation.1,2,3
The long-term effects of a patent false lumen have been well documented. Several studies following patients with chronic TBAD have documented progressive enlargement in aortic diameter with a patent false lumen. The mean increase in maximum aortic diameter ranges from 3.8 to 7.1 mm annually with any flow in the false lumen (FL) versus 1-2 mm per year with a thrombosed FL. Patients with a patent FL had 7.5 times increased risk of a dissection-related death or need for surgery as compared to patients with thrombosis of the FL. Dissection-related death or need for surgery occurred at a significantly earlier follow-up period in the patients with a patent FL.1,2,3
The aortic diameter may also influence the patency of the FL at presentation. In a review of 110 patients presenting with acute uncomplicated TBAD, 44% were identified to have a patent FL on initial imaging. Thirty-one percent of these patients had a maximum aortic diameter of 45 mm or more versus 14% of patients with a thrombosed FL (P = .053). Incidentally, patients with FL patency were on average 4 years younger than their thrombosed counterparts (62 vs. 66 years, P = .009).
Moreover, it appears that the long-term risks associated with a patent FL are further augmented by aortic dilatation at presentation. When combining both risk factors (FL patency and aortic diameter of 40 mm or more), only 22% of patients are dissection-related event–free at 5-year follow-up.Onitsuka et al.4 substantiated this finding on multivariate analysis. Interestingly, 10 of the 76 patients included in that study met both conditions, and seven of those patients (70%) experienced a dissection-related death or surgical conversion. Certainly patients meeting both criteria merit close follow-up for the development of aortic enlargement or symptoms of impending rupture.
The natural history of TBAD lends itself to at least some thrombus formation within the FL and is a common finding as the dissection becomes chronic. But in fact, partial thrombosis of the FL is associated with higher mortality in patients discharged from the hospital with stable TBAD at 1- and 3-year follow-up (15.4% and 31.6%, respectively). Matched patients with a patent FL had a 5.4% and 13.7% rate of mortality at 1 and 3 years, and patients with complete FL thrombosis were found to have mortality rates of 0% and 22.6% at the same follow-up.
Aortic remodeling after TEVAR
Placement of a thoracic endograft under these acute circumstances can often significantly alter the preoperative morphology of the true and false lumen. Schoder and colleagues5 followed changes in the TL and FL diameter in 20 patients after TEVAR for acute complicated dissection. Ninety percent of patients were found to have complete FL thrombosis of the thoracic aorta at 1 year, with a mean decrease in FL diameter of 11.6 mm. Two patients with a patent FL showed a mean increase in the maximal aortic diameter of 4.5 mm. In a similar study, Conrad et al.6 documented aortic remodeling of 21 patients in the year following TEVAR, 88% of whom had thrombosis of the FL. Most often the mobile septum is easily displaced by the radial force of the stent graft, with minimal limitation of expansion to the design diameter. Thus, endograft selection should be directed by the diameter of the normal unaffected aorta with minimal oversizing commonly limited to 5%-10%. Balloon profiling is not typically necessary.
The INSTEAD trial7 evaluated the management of uncomplicated type B aortic dissection and compared optimum medical therapy (OMT) to OMT with TEVAR. A total of 140 subjects were enrolled at seven European sites with 68 patients enrolled in OMT and 72 in OMT with TEVAR. In patients treated with TEVAR there was 90.6% complete FL thrombosis with a maximum true lumen diameter of 32.6 mm as compared to 22% and 18.7 mm in those treated with medical therapy alone. Furthermore, there was a 12.4% absolute risk reduction in aortic specific mortality and a 19.1% absolute risk reduction in disease progression in patients treated with TEVAR.
It is clear that patients that present with complicated type B aortic dissections mandate intervention with TEVAR and potentially other interventions to alleviate the complications at presentation. INSTEAD demonstrates that elective TEVAR results in favorable aortic remodeling and long-term survival, reinterventions were low, and it prevents late expansion and malperfusion. TEVAR was also associated with improved 5-year aortic-specific survival. TEVAR appears to be beneficial in those patients who present initially with a false lumen diameter of greater than 22 mm and an aortic diameter of greater than 40 mm with a patent false lumen.
References
1. Circ. Cardiovasc. Interv. 2013;4:407-16.
2. J. Vasc. Surg. 2012;55:641-51.
3. J. Vasc. Surg. 2011;54:985-92
4. Ann. Thorac. Surg. 2004;78:1268-73.
5. Ann. Thorac. Surg. 2007;83:1059-66.
6. J. Vasc. Surg. 2009;50:510-17.
7. Circulation 2009;120:2519-28.
Dr. Arko is with the Aortic Institute, Sanger Heart & Vascular Institute, Charlotte, N.C. He reported no relevant conflicts.
No, evidence supports careful choice of patients.
While the role of TEVAR has been proven to treat complications of acute type B dissections,1 its value as a prophylactic treatment in uncomplicated cases remains controversial. Optimal medical treatment (OMT) with strict blood pressure (SBP less than 120 mm Hg) and heart rate control is associated with a low morbidity and mortality, despite the risk of progressive aortic dilation. On the other hand TEVAR can result in early death and significant neurologic complications; other devastating complications of TEVAR include retrograde aortic dissection and access vessel rupture with a high associated mortality.
A meta-analysis of the published literature reported a high technical success of TEVAR for uncomplicated type B dissection and a relatively high conversion rate (20%) for patient treated with OMT, however the results did not identify an advantage for TEVAR with respect to 30-day and 2-year mortality.2
An expert panel review of the world literature also did not find significant data to support use of TEVAR for uncomplicated type B dissection.3 In the only randomized prospective trial to examine the role of TEVAR for uncomplicated type B dissection, the INSTEAD trial randomized 140 patients to OMT vs. OMT and TEVAR.4 The study results also did not support the use of TEVAR for the treatment of uncomplicated type B dissection, there was no survival advantage at 2 years, while TEVAR was associated with a 11.1% overall mortality and 4.3% neurologic complication rate, compared with 4.4% and 1.4% in the OMT group. The initial study did however report improved aortic remodeling at 2 years with TEVAR. The results of INSTEAD have been challenged because critical analysis of the INSTEAD trial has determined that the results were underpowered and that there was a 21% crossover in the OMT group and four patients received TEVAR that should have been excluded.5
Subsequent long-term analysis of the INSTEAD XL data do demonstrate a significant survival benefit and freedom from aortic adverse events in the TEVAR group after the initial 2-year analysis.6 At the 5-year follow up only 27 patients remained without a TEVAR. Fortunately there were no adverse events in the patients that crossed over to TEVAR from the OMT group demonstrating the safety of delayed TEVAR in this group. The high rate of aortic associated adverse events may favor early TEVAR. The INSTEAD XL study did identify a large primary tear (more than 10 mm) and an initial aortic diameter of 40 mm as risk factors to crossover suggesting a more aggressive approach in this subset of patients.
So while the INSTEAD XL trial now supports the use of TEVAR for uncomplicated type B dissections this was a relatively small trial that was underpowered in its initial analysis. Expert review of the world literature still supports medical management in the initial phase of treatment. Obviously in cases of failure of medical management TEVAR provides an effective treatment to restore the true lumen and visceral perfusion with possible sustained remodeling of the false lumen.
Given the not insignificant morbidity associated with TEVAR placement, routine treatment of all acute, uncomplicated type B dissections cannot be supported with the current evidence. However, a strategy of selective treatment based on size of the entry tear, extent of dissection, false lumen diameter and extent of thrombosis, effectiveness of antihypertension medications, ability to comply with medical therapy, and surveillance may be implemented. Furthermore treatment at centers of excellence with extensive TEVAR experience based on established protocols favor improved patient outcomes.
References
1. N. Engl. J. Med. 199;340:1546-52
2. Vasc. Endovascular. Surg. 2013 Oct 12;47(7):497-501. Epub 2013 Jul 12.
3. J. Am. Coll. Cardiol. 2013;61(16):1661-78.
4. Circulation 2009;120:2519-28.
5. Circulation 2009;120:2513-14.
6. Circ. Cardiovasc. Interv. 2013;6:407-16.
Dr. Shames is professor of surgery and radiology and program director of vascular surgery at the University of South Florida, Tampa. He reported no relevant conflicts.

Shorter regimen can prevent GVHD
![]()
Credit: Chad McNeeley
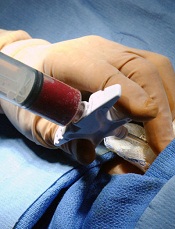
Combining a couple of “promising” treatment approaches can prevent graft-vs-host disease (GVHD) as well as conventional therapy, researchers have reported in the Journal of Clinical Oncology.
They combined a 4-day myeloablative conditioning regimen of busulfan and fludarabine with 2 days of high-dose cyclophosphamide after transplant.
Typically, patients receive 6 months of immunosuppressive therapy to reduce their risk of GVHD.
The conditioning regimen and post-transplant cyclophosphamide have been tested separately in other studies and have good track records in controlling cancer and preventing severe GVHD.
Those successes led Leo Luznik, MD, of the Johns Hopkins University School of Medicine in Baltimore, Maryland, and his colleagues to combine the 2 therapies.
The team tested the combination in 92 patients with high-risk hematologic malignancies. Diagnoses included acute and chronic leukemias, multiple myeloma, non-Hodgkin lymphoma, and myelodysplastic syndromes. Patients had a median age of 49 (range, 21-65).
All patients received 40 mg/m2/day of intravenous (IV) fludarabine immediately before busulfan on all 4 days of conditioning. The busulfan dose of 130 mg/m2 IV daily was adjusted based on pharmacokinetics.
One or 2 days of rest were allowed before patients received a T-cell-replete bone marrow allograft. Forty-five patients had a matched, related donor, and 47 had a matched, unrelated donor.
Patients received 50 mg/kg/day of IV cyclophosphamide for 2 days, with the first dose starting 62 to 72 hours after the start of allograft infusion.
At 100 days after transplant, 51% of patients had developed grade 2-4 acute GVHD, and 15% had grade 3-4 acute GVHD. Fourteen percent of patients developed chronic GVHD.
The 2-year overall survival rate was 67%, and 2-year event-free survival was 62%.
Dr Luznik said he was encouraged by the low rate of chronic GVHD with the regimen. And he noted that percentages of acute GVHD are similar to those seen with the standard 6-month regimen of immunosuppressive drugs.
Reducing the post-transplant treatment to 2 days with cyclophosphamide, he said, “also allows for the earlier integration of other treatments.”
For example, immunotherapies used to eradicate any remaining cancer could be started much sooner with this regimen, said study author Christopher Kanakry, MD, of the Sidney Kimmel Cancer Center at Johns Hopkins.
“If you give patients immune cells to eradicate any remaining cancer cells that might be present,” he said, “those immune cells would not be prevented from doing their job by ongoing immune suppression drugs that are being used in patients treated with conventional transplant approaches.”
Dr Luznik said the researchers’ next step will be a phase 3 trial comparing this regimen to another experimental approach to prevent GVHD or to the more traditional 6-month immunosuppressive therapy.
Funding for this study was provided by Otsuka Pharmaceutical Co., Ltd. and the National Institutes of Health. ![]()
![]()
Credit: Chad McNeeley
Combining a couple of “promising” treatment approaches can prevent graft-vs-host disease (GVHD) as well as conventional therapy, researchers have reported in the Journal of Clinical Oncology.
They combined a 4-day myeloablative conditioning regimen of busulfan and fludarabine with 2 days of high-dose cyclophosphamide after transplant.
Typically, patients receive 6 months of immunosuppressive therapy to reduce their risk of GVHD.
The conditioning regimen and post-transplant cyclophosphamide have been tested separately in other studies and have good track records in controlling cancer and preventing severe GVHD.
Those successes led Leo Luznik, MD, of the Johns Hopkins University School of Medicine in Baltimore, Maryland, and his colleagues to combine the 2 therapies.
The team tested the combination in 92 patients with high-risk hematologic malignancies. Diagnoses included acute and chronic leukemias, multiple myeloma, non-Hodgkin lymphoma, and myelodysplastic syndromes. Patients had a median age of 49 (range, 21-65).
All patients received 40 mg/m2/day of intravenous (IV) fludarabine immediately before busulfan on all 4 days of conditioning. The busulfan dose of 130 mg/m2 IV daily was adjusted based on pharmacokinetics.
One or 2 days of rest were allowed before patients received a T-cell-replete bone marrow allograft. Forty-five patients had a matched, related donor, and 47 had a matched, unrelated donor.
Patients received 50 mg/kg/day of IV cyclophosphamide for 2 days, with the first dose starting 62 to 72 hours after the start of allograft infusion.
At 100 days after transplant, 51% of patients had developed grade 2-4 acute GVHD, and 15% had grade 3-4 acute GVHD. Fourteen percent of patients developed chronic GVHD.
The 2-year overall survival rate was 67%, and 2-year event-free survival was 62%.
Dr Luznik said he was encouraged by the low rate of chronic GVHD with the regimen. And he noted that percentages of acute GVHD are similar to those seen with the standard 6-month regimen of immunosuppressive drugs.
Reducing the post-transplant treatment to 2 days with cyclophosphamide, he said, “also allows for the earlier integration of other treatments.”
For example, immunotherapies used to eradicate any remaining cancer could be started much sooner with this regimen, said study author Christopher Kanakry, MD, of the Sidney Kimmel Cancer Center at Johns Hopkins.
“If you give patients immune cells to eradicate any remaining cancer cells that might be present,” he said, “those immune cells would not be prevented from doing their job by ongoing immune suppression drugs that are being used in patients treated with conventional transplant approaches.”
Dr Luznik said the researchers’ next step will be a phase 3 trial comparing this regimen to another experimental approach to prevent GVHD or to the more traditional 6-month immunosuppressive therapy.
Funding for this study was provided by Otsuka Pharmaceutical Co., Ltd. and the National Institutes of Health. ![]()
A safer gene therapy for SCID-X1?
Credit: Chad McNeeley
A new gene therapy appears safe and effective for boys with X-linked severe combined immunodeficiency syndrome (SCID-X1).
Early data from a small trial suggest the treatment may not pose a risk of leukemia, which was seen in previous trials of gene therapy in SCID-X1 patients.
The new therapy is a self-inactivating γ-retrovirus designed to deliver its payload while minimizing the chance of inadvertently activating
oncogenes that could lead to leukemia.
Researchers described results with this therapy in The New England Journal of Medicine.
The team enrolled 9 boys with SCID-X1. They received bone marrow-derived CD34+ cells transduced with the self-inactivating γ-chain vector, without preparative conditioning.
Eight boys are still alive after 12.1 to 38.7 months of follow-up, with no SCID-X1-associated infections. One child died of an overwhelming infection that was present at the time gene therapy began.
Gene therapy alone generated functioning immune systems in 7 of the patients.
Genetic studies of the boys’ new T cells revealed that the viral vector did not lead to an expansion of cells with vector insertions near known oncogenes, raising cautious hopes about the vector’s long-term safety.
The researchers said they will continue to monitor the patients for any signs of treatment-related leukemia for 15 years.
In prior European trials, which were the first to demonstrate gene therapy’s potential to successfully cure a disease, leukemia appeared 2 to 5 years after treatment. This outcome was one of several events that, together, slowed clinical progress in gene therapy for many years.
“Our goal was to take the molecular data from the prior trial and use it to produce a vector that would remain effective and, at the same time, reduce the risk of leukemia,” said David A. Williams, MD, of the Dana-Farber/Boston Children’s Cancer and Blood Disorders Center in Massachusetts.
“The efficacy data from our study is clear: The vector does work to correct the disease. And by a surrogate endpoint, we have improved the treatment’s safety, although it’s too early to say that we’ve completely eliminated the long-term risk of leukemia.”
After a single round of treatment, 6 of 7 boys for whom the gene therapy was successful had achieved the trial’s primary efficacy endpoints—a T-cell count greater than 300 cells per microliter of blood and T-cell proliferation in response to stimulation with phytohemagglutinin.
The seventh boy received a second round of gene therapy and remains healthy despite having relatively low T-cell counts. The eighth surviving patient was successfully treated with a conventional hematopoietic stem cell transplant after gene therapy failed to stimulate T-cell production. ![]()
Microscopy advances net Nobel Prize

Credit: Max Planck Institute
for Biophysical Chemistry
Three scientists have received the 2014 Nobel Prize in Chemistry for aiding the development of super-resolved fluorescence microscopy.
For a long time, optical microscopy was held back by a presumed limitation: that it would never obtain a better resolution than half the wavelength
of light.
Working separately, this year’s Nobel Laureates in Chemistry circumvented this limitation and brought optical microscopy into the nanodimension.
Now, scientists can monitor the interplay between individual molecules inside cells, watch disease-related proteins aggregate, and track cell division at the nanolevel.
For enabling these advances, Eric Betzig, PhD, of the Howard Hughes Medical Institute in Ashburn, Virginia; Stefan W. Hell, PhD, of the Max Planck Institute for Biophysical Chemistry in Göttingen, Germany; and William E. Moerner, PhD, of Stanford University in California, received the prize. The prize amount was SEK 8 million, to be shared equally among the Laureates.
The work in brief
In 1873, the microscopist Ernst Abbe stipulated a physical limit for the maximum resolution of traditional optical microscopy—0.2 micrometers. Drs Moerner, Hell, and Betzig were able to bypass this limit.
Dr Hell developed stimulated emission depletion (STED) microscopy. This method employs 2 laser beams. One stimulates fluorescent molecules to glow, and another cancels out all fluorescence except for that in a nanometer-sized volume.
Scanning over the sample, nanometer for nanometer, yields an image with a resolution better than Abbe’s stipulated limit.
Drs Betzig and Moerner laid the foundation for another method, single-molecule microscopy. This method relies upon the possibility to turn the fluorescence of individual molecules on and off.
Scientists image the same area multiple times, letting just a few interspersed molecules glow each time. Superimposing these images yields a dense super-image resolved at the nanolevel. In 2006, Dr Betzig used this method for the first time.
For more details on the Nobel Laureates and their work, visit Nobelprize.org. ![]()
Price increases drive spending on cancer drugs

Credit: Steven Harbour
The recent surge in spending on oral anticancer drugs in the US exceeds the increase in use of these drugs, new research shows.
Average quarterly national spending on oral oncologics increased 37% during the period studied, from $940 million in the first quarter of 2006 to $1.4 billion in the third quarter of 2011.
But the average quarterly use of these drugs in the same time period increased by only 10%.
This suggests price increases are a significant driver of spending trends.
Rena M. Conti, PhD, of the University of Chicago in Illinois, and her colleagues examined recent trends in spending and use of oral oncologics and disclosed their findings in Health Affairs.
Of the 47 drugs analyzed, most were targeted agents (30%), hormonal agents (26%), and alkylating agents (19%).
The researchers observed a significant increase in national spending on oral oncologics from 2006 to 2011—an estimated average quarterly increase of $20 million.
This was driven by brand-name, patent-protected drugs, but the use of these drugs climbed a comparatively small amount. Average quarterly spending of patent-protected drugs increased 61%, and average quarterly use increased 30% between 2006 and the period from September 2010 to September 2011.
“This is an exciting time, an era of breakthrough cancer drugs,” Dr Conti said. “Some of these medications have extended the lives of many people with certain types of cancer. However, spending on these brand-name oral oncologics is outstripping national spending on all pharmaceuticals and all medical care spending generally.”
The researchers also discovered that when oncologics lose patent protection, spending takes a nosedive. The use of newly off-patent drugs increased by 16%, but average quarterly spending on those drugs fell by 65%.
Another finding was that US spending on targeted anticancer agents increased from 35% of all oral cancer drugs in 2006 to nearly 60% in 2011.
Meanwhile, spending on hormonal agents decreased from 42% of total spending to 19%, spending on antimetabolites increased from 11% to 12%, and spending on alkylating agents decreased from 10% to 8%. ![]()
Cosmetic Corner: Dermatologists Weigh in on OTC Pigment Control Products
To improve patient care and outcomes, leading dermatologists offered their recommendations on the top OTC pigment control products. Consideration must be given to:
- Even Better
Clinique Laboratories, LLC
“It also is useful as prevention and offers many different options.”—Antonella Tosti, MD, Miami, Florida
“These OTC products have good clinical data to support use for hyperpigmentation. Patients tell me that they feel good on their skin and aren’t irritating.”—Gary Goldenberg, MD, New York, New York
- Lumixyl Brightening System
Envy Medical, Inc
“A great option for patients who may be experiencing modest issues with pigmentation. Use of a retinoid with this product also may enhance its efficacy.”—Joel Schlessinger, MD, Omaha, Nebraska
- Lytera Skin Brightening Complex
SkinMedica
“With key ingredients such as hexylresorcinol, retinol, and niacinamide, it has been clinically shown to lighten dark patches in its trials as well as adding luminosity to the skin.”—Anthony Rossi, MD, New York, New York
Recommended by Elizabeth K. Hale, MD, New York, New York
- Pigmentclar Serum
La-Roche Posay Laboratoire Dermatologique
“It attacks pigment production at every stage.”—Whitney Bowe, MD, Brooklyn, New York
Cutis invites readers to send us their recommendations. Mineral makeup, eyelash enhancers, and facial scrubs will be featured in upcoming editions of Cosmetic Corner. Please e-mail your recommendation(s) to [email protected].
Disclaimer: Opinions expressed herein do not necessarily reflect those of Cutis or Frontline Medical Communications Inc and shall not be used for product endorsement purposes. Any reference made to a specific commercial product does not indicate or imply that Cutis or Frontline Medical Communications Inc endorses, recommends, or favors the product mentioned. No guarantee is given to the effects of recommended products.

COSMECEUTICAL CRITIQUE: Master formulators: The ‘Julia Childs’ of skin care
In the multibillion-dollar skin care industry, there are many well-recognized brands. However, we sometimes forget that behind these products were formulators who took their scientific ideas and turned them into recipes for cosmetically elegant active formulations.
I have spent the last 15 years researching the activity of cosmeceutical ingredients for my new textbook, “Cosmeceuticals and Cosmetic Ingredients” (McGraw Hill, 2014). Each ingredient has its own quirks, and they all do not “play well in the sandbox” together. Formulation knowledge (cosmetic chemistry) is required to take these ingredients and combine them in a way that enhances rather than hinders their activity, just as a chef combines ingredients and cooking techniques to enhance the flavor and presentation of food. When I discuss cosmeceutical products, I always stress the importance of the ingredients and understanding ingredient interactions, because they determine the end product – how effective it is and how elegant it feels. If a product works well but smells bad and feels unpleasant, consumers will not use it.

Whom are we trusting when it comes to this science? The formulators, also known as cosmetic chemists, who put their blood, sweat, and tears into years of work to develop products that yield efficacious results. They are often behind the scenes, and their contributions are not always recognized. I refer to them as the “Julia Childs” of skin care, because they remind me of how Julia Child combined her knowledge of ingredients and aesthetic sensibilities to change the world of cooking.
I’d like to shine the spotlight on several top skin care formulators that I have met. Their relentless desire to perfect skin care recipes has helped the industry boom and has improved skin health.
Richard Parker
Location: Melbourne
Richard Parker is the CEO/founder of the Australia-based company Rationale. When he was unable to find skin care products that worked with his skin type, he decided to study cosmetic chemistry and create his own skin care line. Today, Rationale can be found in dermatologists’ and plastic surgeons’ offices across Australia. Parker’s passion for cosmetic science is evident. Australia has a high incidence of melanoma, and sunscreens undergo greater scrutiny there compared with other countries. One of the things that Parker is most proud of is his creation of SPF products that are “as elegant as they are effective.” This is a difficult combination to achieve, because sunscreens tend to be too white or too greasy; formulating them properly requires a “master chef.”
In addition to formulating effective and elegant sun protection, he has developed Essential Six: a combination of six products that work in synergy, delivering the perfect combination of active ingredients at the correct concentration to be recognized and utilized by skin cells.
In order to succeed in the formulations industry, you must possess a desire to make it better; and Parker does just that. It’s his wish for the industry to have an increased awareness of a holistic approach to skin care that includes immune protection, antioxidants, sunscreens, gentle cleansing, alpha-hydroxy acids, and vitamin A.
If being at the forefront of this evolution isn’t enough, Parker is devoted to continue his mission for years to come, all the while helping younger chemists/formulators embrace the culture.
“For the past 25 years, I have had the privilege to work with Australia’s leading dermatologists to create the best possible products and procedures,” he said. “At this stage of my career, it is so gratifying to see the younger generation of skin specialists embrace medical skin care as a part of best clinical practice.”
Chuck Friedman
Location: Wendell, N.C.
Chuck Friedman is a man who prides himself on the use of natural products – not a small achievement for a man who has been in the industry for almost half a century. His work as a formulation chemist has spanned globally recognized companies such as Lanvin-Charles of the Ritz, Almay, Estée Lauder, Burt’s Bees, and Polysciences.
Friedman prides himself on his natural products. His product list includes hypoallergenic and natural versions of cleansers; toners; exfoliators; moisturizers and masks; shampoos; conditioners; dandruff treatments and hair sprays; antiperspirants and deodorants; lip balms; salves and cuticle treatments; shaving creams and aftershaves; over-the-counter analgesics; acne treatments and sunscreens; toothpastes; and liquid soap.
Friedman has said that he is most proud of his Burt’s Bees Orange Essence Cleansing Cream, which won Health Magazine’s Healthiest Cleanser of the Year in 1999. The product is an anhydrous, 100% natural, self-preserving translucent gel-emulsion of vegetable oil and vegetable glycerin stabilized by a proprietary protein.
During his tenure in the industry, Friedman has faced many hurdles in creating his natural formulations – achieving esthetics, efficacy, and physical stability at temperature extremes while maintaining microbiological integrity and using more green, renewable ingredients while formulating with fewer petrochemicals. His breakthrough natural formulations developed at Burt’s Bees are emulated and marketed widely today.
Sergio Nacht
Location: Las Vegas
Sergio Nacht is a biochemist, researcher, and product developer with 48 years of formulation experience. Currently, he is chief scientific officer/cofounder at resolutionMD and Riley-Nacht.
“A better understanding of the structure and function of the skin has resulted in the development of better functional products that deliver clinically demonstrable benefits and not only ‘hope in a jar,’ ” he has said.
Nacht has coauthored more than 50 scientific papers, and he holds 17 international and U.S. patents.
Possibly his most significant accomplishment followed the discovery of what he believes is one of the biggest challenges in skin care formulation. Microsponge Technology is the first – and still the only – U.S. Food and Drug Administration–approved controlled-release technology for topical products that maximizes efficacy while minimizing side effects and optimizing cosmetic attributes by allowing slow release of ingredients. The microsponge is used to provide various therapeutic solutions for antiaging, acne treatment, skin firming, skin lightening, and mattifying – most notably as the lead technology behind Retin-A Micro.
Byeong-Deog Park
Location: Seoul, South Korea
Byeong-Deog Park holds a Ph.D. in industrial chemicals from Seoul National University, among his other achievements. Dr. Park’s company, Neopharm, is located in Seoul. He is a true scientist who has been awarded many patents in the areas of ceramides for the treatment of dry skin and atopic dermatitis; PPAR (peroxisome proliferator-activated receptor)-alpha in the treatment of inflammatory disorders; and an antimicrobial peptide, Defensamide, which has been shown to prevent colonization of Staphylococcus aureus. His research led to the development of a proprietary MLE (multilamellar emulsion) technology in which lipids and ceramides form the identical Maltese cross structure that is seen in the natural lipid barrier of the skin, allowing effective skin barrier repair.
With MLE technology, the ceramides, fatty acids, and cholesterol required for an intact skin barrier are replaced in the proper ratio and three-dimensional structure needed to emulate the skin’s natural structure. This reforms the skin’s barrier and prevents water evaporation from the skin’s surface. Dr. Park has said that he is most proud of his patented MLE technology, found in the brands Atopalm and Zerafite. He also combined MLE technology and Defensamide in an atopic dermatitis treatment known as Zeroid.
Dr. Park never ceases to impress me with his scientific knowledge and dedication to the scientific method. In a field where many products are considered “hope in a jar,” his cosmetically elegant products stand out as “verified science in a jar.”
Gordon Dow
Location: Petaluma, Calif.
Gordon Dow started Dow Pharmaceutical Sciences in his garage. Today, Dow Pharmaceutical Sciences (recently acquired by Valeant Pharmaceuticals International) is a leading company in the formulation and manufacturing of dermatological products.
Over the past 25 years, Dow has commanded the company’s evolution by carefully balancing science and business. He previously served as vice president of research and development for Ingram Pharmaceuticals, where he developed seven commercially successful products, including four dermatologicals. He also served as the executive secretary of the research advisory panel for the State of California. A few of Dow’s best-known products include MetroGel, Ziana, and Acanya.
The passion for science and skin care of these individuals has shaped the dermatologic landscape for the best. They would probably agree with Julia Child, who once said, “Find something you’re passionate about and keep tremendously interested in it.”
Dr. Baumann is chief executive officer of the Baumann Cosmetic & Research Institute in Miami Beach. She founded the cosmetic dermatology center at the University of Miami in 1997. Dr. Baumann wrote the textbook “Cosmetic Dermatology: Principles and Practice” (McGraw-Hill, April 2002), and a book for consumers, “The Skin Type Solution” (Bantam, 2006). She has contributed to the Cosmeceutical Critique column in Skin & Allergy News since January 2001. Dr. Baumann has received funding for clinical grants from Allergan, Aveeno, Avon Products, Galderma, Mary Kay, Medicis Pharmaceuticals, Neutrogena, Philosophy, Stiefel, Topix Pharmaceuticals, and Unilever.
In the multibillion-dollar skin care industry, there are many well-recognized brands. However, we sometimes forget that behind these products were formulators who took their scientific ideas and turned them into recipes for cosmetically elegant active formulations.
I have spent the last 15 years researching the activity of cosmeceutical ingredients for my new textbook, “Cosmeceuticals and Cosmetic Ingredients” (McGraw Hill, 2014). Each ingredient has its own quirks, and they all do not “play well in the sandbox” together. Formulation knowledge (cosmetic chemistry) is required to take these ingredients and combine them in a way that enhances rather than hinders their activity, just as a chef combines ingredients and cooking techniques to enhance the flavor and presentation of food. When I discuss cosmeceutical products, I always stress the importance of the ingredients and understanding ingredient interactions, because they determine the end product – how effective it is and how elegant it feels. If a product works well but smells bad and feels unpleasant, consumers will not use it.
Whom are we trusting when it comes to this science? The formulators, also known as cosmetic chemists, who put their blood, sweat, and tears into years of work to develop products that yield efficacious results. They are often behind the scenes, and their contributions are not always recognized. I refer to them as the “Julia Childs” of skin care, because they remind me of how Julia Child combined her knowledge of ingredients and aesthetic sensibilities to change the world of cooking.
I’d like to shine the spotlight on several top skin care formulators that I have met. Their relentless desire to perfect skin care recipes has helped the industry boom and has improved skin health.
Richard Parker
Location: Melbourne
Richard Parker is the CEO/founder of the Australia-based company Rationale. When he was unable to find skin care products that worked with his skin type, he decided to study cosmetic chemistry and create his own skin care line. Today, Rationale can be found in dermatologists’ and plastic surgeons’ offices across Australia. Parker’s passion for cosmetic science is evident. Australia has a high incidence of melanoma, and sunscreens undergo greater scrutiny there compared with other countries. One of the things that Parker is most proud of is his creation of SPF products that are “as elegant as they are effective.” This is a difficult combination to achieve, because sunscreens tend to be too white or too greasy; formulating them properly requires a “master chef.”
In addition to formulating effective and elegant sun protection, he has developed Essential Six: a combination of six products that work in synergy, delivering the perfect combination of active ingredients at the correct concentration to be recognized and utilized by skin cells.
In order to succeed in the formulations industry, you must possess a desire to make it better; and Parker does just that. It’s his wish for the industry to have an increased awareness of a holistic approach to skin care that includes immune protection, antioxidants, sunscreens, gentle cleansing, alpha-hydroxy acids, and vitamin A.
If being at the forefront of this evolution isn’t enough, Parker is devoted to continue his mission for years to come, all the while helping younger chemists/formulators embrace the culture.
“For the past 25 years, I have had the privilege to work with Australia’s leading dermatologists to create the best possible products and procedures,” he said. “At this stage of my career, it is so gratifying to see the younger generation of skin specialists embrace medical skin care as a part of best clinical practice.”
Chuck Friedman
Location: Wendell, N.C.
Chuck Friedman is a man who prides himself on the use of natural products – not a small achievement for a man who has been in the industry for almost half a century. His work as a formulation chemist has spanned globally recognized companies such as Lanvin-Charles of the Ritz, Almay, Estée Lauder, Burt’s Bees, and Polysciences.
Friedman prides himself on his natural products. His product list includes hypoallergenic and natural versions of cleansers; toners; exfoliators; moisturizers and masks; shampoos; conditioners; dandruff treatments and hair sprays; antiperspirants and deodorants; lip balms; salves and cuticle treatments; shaving creams and aftershaves; over-the-counter analgesics; acne treatments and sunscreens; toothpastes; and liquid soap.
Friedman has said that he is most proud of his Burt’s Bees Orange Essence Cleansing Cream, which won Health Magazine’s Healthiest Cleanser of the Year in 1999. The product is an anhydrous, 100% natural, self-preserving translucent gel-emulsion of vegetable oil and vegetable glycerin stabilized by a proprietary protein.
During his tenure in the industry, Friedman has faced many hurdles in creating his natural formulations – achieving esthetics, efficacy, and physical stability at temperature extremes while maintaining microbiological integrity and using more green, renewable ingredients while formulating with fewer petrochemicals. His breakthrough natural formulations developed at Burt’s Bees are emulated and marketed widely today.
Sergio Nacht
Location: Las Vegas
Sergio Nacht is a biochemist, researcher, and product developer with 48 years of formulation experience. Currently, he is chief scientific officer/cofounder at resolutionMD and Riley-Nacht.
“A better understanding of the structure and function of the skin has resulted in the development of better functional products that deliver clinically demonstrable benefits and not only ‘hope in a jar,’ ” he has said.
Nacht has coauthored more than 50 scientific papers, and he holds 17 international and U.S. patents.
Possibly his most significant accomplishment followed the discovery of what he believes is one of the biggest challenges in skin care formulation. Microsponge Technology is the first – and still the only – U.S. Food and Drug Administration–approved controlled-release technology for topical products that maximizes efficacy while minimizing side effects and optimizing cosmetic attributes by allowing slow release of ingredients. The microsponge is used to provide various therapeutic solutions for antiaging, acne treatment, skin firming, skin lightening, and mattifying – most notably as the lead technology behind Retin-A Micro.
Byeong-Deog Park
Location: Seoul, South Korea
Byeong-Deog Park holds a Ph.D. in industrial chemicals from Seoul National University, among his other achievements. Dr. Park’s company, Neopharm, is located in Seoul. He is a true scientist who has been awarded many patents in the areas of ceramides for the treatment of dry skin and atopic dermatitis; PPAR (peroxisome proliferator-activated receptor)-alpha in the treatment of inflammatory disorders; and an antimicrobial peptide, Defensamide, which has been shown to prevent colonization of Staphylococcus aureus. His research led to the development of a proprietary MLE (multilamellar emulsion) technology in which lipids and ceramides form the identical Maltese cross structure that is seen in the natural lipid barrier of the skin, allowing effective skin barrier repair.
With MLE technology, the ceramides, fatty acids, and cholesterol required for an intact skin barrier are replaced in the proper ratio and three-dimensional structure needed to emulate the skin’s natural structure. This reforms the skin’s barrier and prevents water evaporation from the skin’s surface. Dr. Park has said that he is most proud of his patented MLE technology, found in the brands Atopalm and Zerafite. He also combined MLE technology and Defensamide in an atopic dermatitis treatment known as Zeroid.
Dr. Park never ceases to impress me with his scientific knowledge and dedication to the scientific method. In a field where many products are considered “hope in a jar,” his cosmetically elegant products stand out as “verified science in a jar.”
Gordon Dow
Location: Petaluma, Calif.
Gordon Dow started Dow Pharmaceutical Sciences in his garage. Today, Dow Pharmaceutical Sciences (recently acquired by Valeant Pharmaceuticals International) is a leading company in the formulation and manufacturing of dermatological products.
Over the past 25 years, Dow has commanded the company’s evolution by carefully balancing science and business. He previously served as vice president of research and development for Ingram Pharmaceuticals, where he developed seven commercially successful products, including four dermatologicals. He also served as the executive secretary of the research advisory panel for the State of California. A few of Dow’s best-known products include MetroGel, Ziana, and Acanya.
The passion for science and skin care of these individuals has shaped the dermatologic landscape for the best. They would probably agree with Julia Child, who once said, “Find something you’re passionate about and keep tremendously interested in it.”
Dr. Baumann is chief executive officer of the Baumann Cosmetic & Research Institute in Miami Beach. She founded the cosmetic dermatology center at the University of Miami in 1997. Dr. Baumann wrote the textbook “Cosmetic Dermatology: Principles and Practice” (McGraw-Hill, April 2002), and a book for consumers, “The Skin Type Solution” (Bantam, 2006). She has contributed to the Cosmeceutical Critique column in Skin & Allergy News since January 2001. Dr. Baumann has received funding for clinical grants from Allergan, Aveeno, Avon Products, Galderma, Mary Kay, Medicis Pharmaceuticals, Neutrogena, Philosophy, Stiefel, Topix Pharmaceuticals, and Unilever.
Risk-directed therapy improves survival in ALL

Credit: St Jude Biomedical
Communications
Risk-directed therapy can level the playing field for patients with BCR-ABL1-like acute lymphoblastic leukemia (ALL), new research suggests.
Using minimal residual disease (MRD) and other risk factors to guide treatment intensity allowed patients withBCR-ABL1-like ALL to have survival rates comparable to those of other B-ALL patients.
The research also revealed that not all BCR-ABL1-like ALL patients have high-risk disease.
Ching-Hon Pui, MD, of St Jude Children’s Research Hospital in Memphis, Tennessee, and his colleagues reported these results in the Journal of Clinical Oncology.
Patients with BCR-ABL1-like ALL tend to have poor outcomes, so Dr Pui and his colleagues evaluated the utility of risk-directed therapy in these and other B-ALL patients.
The team assessed patients enrolled in the Total Therapy XV study between 2000 and 2007. They were 1 to 18 years of age at diagnosis. There were 344 subjects with adequate samples for gene expression profiling.
Forty patients (11.6%) had BCR-ABL1-like ALL. They were significantly more likely than other study participants to be male, have Down syndrome, and have higher MRD levels on day 19 and at the end of induction.
The researchers monitored patients and adjusted their treatment intensity based on MRD at days 19 and 42. The treatment regimen was described in JAMA in 2009.
The MRD monitoring combined with conventional risk factors, such as patient age and white blood count at diagnosis, demonstrated that BCR-ABL1-like ALL is not a uniformly high-risk disease.
Forty percent of BCR-ABL1-like ALL patients were actually classified as having low-risk disease because they had other favorable clinical or biological features and no MRD at the end of remission induction.
The other 60% were classified as having standard-risk or high-risk disease. The group included 6 patients who underwent transplant.
There were no significant differences in event-free or overall survival in patients with BCR-ABL1-like ALL and the other ALL patients. At 5 years, event-free survival was 90.0% ± 4.7% and 88.4% ± 1.9%, respectively. And 5-year overall survival was 92.5% ± 4.2% and 95.1% ± 1.3%, respectively.
When available, more sophisticated genetic testing should be used to identify which of the B-ALL patients with high levels of MRD have the BCR-ABL1-like ALL subtype, Dr Pui said. Many of these patients have genetic alterations that make them responsive to tyrosine kinase inhibitors (TKIs) and possibly other targeted therapies.
For example, in this study, the researchers evaluated genetic abnormalities in 25 BCR-ABL1-like ALL patients. Eleven had a genomic rearrangement of CRLF2, 6 had fusion transcripts responsive to ABL TKIs or JAK inhibitors, and 7 had mutations involving the Ras signaling pathway.
“In the future, genetic testing will likely be used at diagnosis to identify [BCR-ABL1-like ALL] and direct patients to the best targeted therapy,” Dr Pui said, “possibly including some drugs that are currently experimental.” ![]()
Program for poor can boost hospital profits

Credit: Petr Kratochvil
A federal program designed to help the poor may actually be used to help US hospitals increase their profits, according to research published in Health Affairs.
Researchers examined enrollment in the 340B program, which provides deep discounts on outpatient drug purchases.
They found that hospitals and clinics that joined the program since 2004 currently serve more affluent and well-insured communities than those that qualified for the program in previous years.
This supports the idea that the program is changing from one that serves patients in need to one that enriches hospitals and their affiliated clinics, according to the researchers.
“This study provides the first nationally representative empirical evidence suggesting that the program’s original intent is being eroded by the actions of certain hospitals,” said study author Rena M. Conti, PhD, of the University of Chicago in Illinois.
This study follows work by Dr Conti and Peter B. Bach, MD, of Memorial Sloan-Kettering Cancer Center in New York, that was published in JAMA last year.
The JAMA study explained how 340B-qualified hospital-affiliated clinics can boost profits thanks to discounts on expensive anticancer drugs. The facilities receive the discounts under the expectation that the savings will be passed on to poor patients.
“Hospitals qualify for the program based on the poverty of their inpatient census only,” Dr Conti said. “The affiliated clinics are the only 340B institutions not required to pass the discounts off to patients or their insurers, nor do they have to report to the government exactly how these profits are used to serve the poor. Insurers’ and their patients’ payments for outpatient drug treatment don’t reflect the discounts the hospital receives.”
The 340B program, which began in 1992, was designed to help selected hospitals and their outpatient clinics serve low-income and uninsured patients by providing discounts of 30% to 50% on outpatient drugs.
About a decade ago, enrollment in 340B began to increase rapidly. Now, more than a third of the 4375 US non-federal hospitals are 340B-qualified. Recent Congressional and news reports suggest that, for selected hospitals, profits off the 340B program can be significant.
For their new study, Drs Conti and Bach examined the populations served by hospitals and clinics qualifying for 340B before and after the decade-long growth spurt. They matched data for all hospitals and clinics registered with the 340B program to socioeconomic data from the US Census Bureau.
The results showed that communities served by hospital-affiliated clinics joining the program in 2004 or later tended to have higher household incomes, much less unemployment, and higher rates of health insurance.
The researchers said their findings are consistent with recent complaints that, rather than serving vulnerable communities, the 340B program is being used to increase profits for hospitals and their affiliated clinics. ![]()