User login
How Effective Is Group Cognitive Behavioral Therapy to Treat PTSD?
Anxiety is a necessary and natural reaction to trauma, but, sometimes, anxiety symptoms become excessive and problematic, as experienced with posttraumatic stress disorder (PTSD). Some patients who struggle with PTSD endure a relentless apprehension so intense that it keeps them from participating in everyday activities, such as attending work and partaking in social activities. Associated anxiety symptoms severely impair everyday function and include increased heart rate, sweating, intrusive images, poor attention, fear, or insomnia. Posttraumatic stress disorder symptoms often lead to occupational dysfunction, relationship difficulty, and numerous other functional impairments.
Approximately 300,000 veterans meet the criteria for PTSD related to ongoing or recent wars.1 The veteran does not bear the personal and functional burden alone; however, the financial load is felt throughout society. One recent study suggests that for veterans diagnosed with PTSD, the first 2 years after deployment cost society an estimated $7,000 per individial.2 Current research suggests that this potentially debilitating disorder occurs in about 14% of Operation Iraqi Freedom/Operation Enduring Freedom combat troops, whereas the similar U.S. demographic population experiences PTSD at a rate of about 7%.1,3 The ongoing military trauma exposures are compelling the mental health community to establish efficient and effective treatment options.4,5
Several treatment strategies exist to reduce PTSD symptoms, but health care professionals must seek a balance between therapeutic benefit and cost. The treatment of PTSD is diverse and variable; however, in the most recent Clinical Practice Guideline (CPG) for PTSD, the VA and DoD specifically endorse some psychotherapeutic interventions while dissuading the use of others.6 Of note, the VA and DoD CPG strongly encourages Stress Inoculation Training (SIT) and similar cognitive therapies aimed at guiding patients through the process of consciously understanding the relationship between thoughts and feelings and then modifying thoughts to appropriately manage stressors.6 Meanwhile, group psychotherapy has been determined to be “somewhat helpful.”6 Even though cognitive- and group-based therapies have long been established as efficacious for numerous psychological disorders (depression, obsessive compulsive disorder, eating disorders, etc), neither the American Group Psychotherapy Association nor the VA and DoD CPG directly endorse the use of group cognitive behavioral therapy (GCBT) for the treatment of PTSD.6,7 However, both VA and DoD mental health providers commonly practice CBT and various group psychotherapies for the treatment of PTSD.
Despite the widespread use of CBT, there is a gap in the clinical understanding of the evidence supporting GCBT for PTSD. The goal of this synthesis was to understand the efficacy of treating PTSD symptoms with group psychotherapy. To begin this investigation, the following PICO (population, intervention, comparison, outcome) question was asked: In adults diagnosed with PTSD, how effective is group cognitive behavioral therapy in reducing PTSD-related symptoms?
Methods
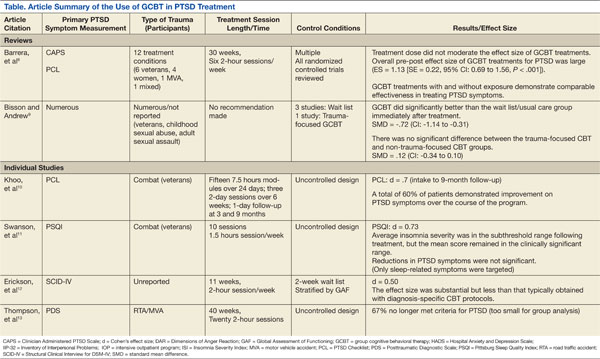
Research articles addressing the use of GCBT in PTSD were obtained via database searches that took place during October 2012 (Table). Searched databases included the Cochrane Central Register of Controlled Trials, Cochrane Database of Systematic Reviews Randomized Controlled Trials, Psychological Information (PsycINFO), and Public Medicine (PubMed).
The PubMed database was searched using the following MeSH (medical subject heading) terms: “psychotherapy, group” and “stress disorders, post-traumatic” and “cognitive therapy.” Limitations were set to include only patients aged ≥ 18 years, results in English, those involving human subjects, and articles published within the past 5 years. A manual search of references was also conducted, and relevant articles were retained.
Articles that addressed primary substance abuse, other DSM Axis I disorders, intimate partner violence, or family issues were excluded from the evidence sample due to concerns of an alternate treatment focus. Articles with a focus on telehealth or alternative medicine were considered confounding to the scope of this review were also excluded. It was also noted that the term CBT is used collectively for an umbrella of treatments; however, treatments that focused on elements other than the components of CBT being delivered in a group were not included. To prevent duplication of the results, research from an inclusive review was not considered individually.
SUMMARY OF EVIDENCE
Six works fulfilled the PICO criteria and were of sufficient quality to be synthesized. Of the 6 articles retained for synthesis, 2 were high-level reviews. Both reviews supported the use of GCBT for PTSD treatment. Barrera and colleagues reported an overall large effect size regardless of the presence of exposure in-group among the 12 treatment conditions and 651 study participants.8 These researchers also reported that in-group exposure did not further traumatize other group members.
Similarly, although a notably older and smaller review, Bisson and Andrew reported a significant standard mean deviation between 4 GCBT treatment and wait list controls. These reviewers did not find a significant difference between trauma- and nontrauma-focused treatment groups. The reviews also noted that individual psychotherapy and/or pharmacotherapy was most often continued throughout the reviewed studies.8,9
The 4 other studies contribute substantively to this synthesis but arguably represent lower evidence quality. A large longitudinal study of 496 Australian veterans reported a large effect size that was sustained 9 months after treatment began.10 These researchers used an intensive outpatient program that included medication and other treatment modalities as the basis for GCBT delivery. They reported that the majority of the patients revealed improvement in PTSD symptoms.
Another study sampled a similar group of 10 combat veterans but focused particular attention on sleep-related PTSD symptoms of insomnia, nightmares, and sleep quality.11 Although these researchers were unable to report a significant difference in overall PTSD symptoms for the 8 subjects who completed the protocol, they did find a large effect size on insomnia severity and a medium effect size on sleep quality. Regular treatment, including medication, continued throughout this study.
Other researchers reported a medium effect size on PTSD symptoms while using GCBT in a heterogeneous group with various anxiety disorders, including obsessive compulsive disorder, generalized anxiety disorder, social phobia, panic disorders, and PTSD.12 Although reporting similar results as all other included studies, this study has some significant limitations, including a 26% dropout rate among the 152 participants. The final study included for synthesis reported a remarkable 67% elimination of the PTSD diagnosis among 6 motor vehicle accident survivors in the small, uncontrolled study.13 Concomitant treatments, including medications, were not reported in detail for these 4 studies except as mentioned.
As a whole, the 6 studies revealed some appreciable commonalities. Time since diagnosis did not seem to influence the results. Attrition was consistently found to be similar to other PTSD treatments. The reported session topics were loosely based on common CBT tenets (ie, education, challenging cognitions, and relaxation techniques) and were typically similar among treatment groups, including the use of homework.
DISCUSSION
As the diagnosis of PTSD increases to unfamiliar levels, GCBT has the potential to be helpful to clinicians and patients seeking alternatives to their current treatments.1,4,14 The reported results imply that GCBT can be useful in PTSD symptom reduction. This could be particularly useful to VA and military providers or rural providers operating with limited resources.
Treatment protocols are not well established and should be approached with care prior to the establishment of CBT treatment groups for those diagnosed with PTSD. Session overviews and descriptions, such as those mentioned in Thompson and colleagues, could provide a reference point for future use.13
Also worth considering, CBT can be an ambiguous term requiring deliberate definition within treatment protocols. As noted in the VA and DoD CPG, exposure- and trauma-focused treatment designs can be efficacious, but these elements do not seem to be required within the GCBT treatment setting.
The current research also suggests GCBT efficacy regardless of the index trauma. This does not suggest that heterogeneous groups were frequently studied nor can conclusions be drawn regarding heterogeneous treatment groups. Elements such as group size and session length are inconsistently reported and require specific consideration as well. There is a distinct lack of research directly comparing individual CBT with GCBT directly, which prohibits meaningful conclusions regarding PTSD symptom reduction. This research gap may well have influenced the recommendations within the VA and DoD CPG. Although some higher quality studies exist, many of the published reports on GCBT have noteworthy design flaw, such as inadequate controls and statistical analysis.
LIMITATIONS
There are some limitations to this literature synthesis. Although the search was limited to the past 5 years, the inclusion of reviews accounts for older evidence. As alluded to earlier, the lack of a standardized GCBT treatment protocol challenges results comparisons as well. The consequent treatment variations make direct interstudy comparison and synthesis difficult. Similarly, outcome measures varied between studies. Also, group psychotherapy is well established and accepted. Therefore, much of the supporting research was accomplished outside the parameters of this literature search. This empirical view of group psychotherapy among mental health providers may also contribute to the lack of available research.
It is also worth noting that studies finding neutral or negative results are often unpublished. This publication bias could account for the lack of available evidence. The research reports do not consistently report therapist qualifications; however, board certificates in group psychotherapy and CBT are undeniably variables available for debate. The inclusion of uncontrolled trials limits these findings as well. Although the above limitations are not exhaustive, they do provide necessary caveats to future generalizations.
FUTURE IMPLICATIONS
Perhaps the most important information to gain from future research is that of treatment outcomes. Studies that include a detailed outcome evaluation could reveal patient satisfaction, efficacy, and financial considerations. In the presence of adequate supportive data, GCBT could contribute outcome data regarding trauma survivor symptom normalization, peer support formation, access to care, treatment efficiency, and health care resources utilization. As noted in Barrera and colleagues, future analysis will require a greater volume of trials with an overall increase in methodological rigor.8
Current research has demonstrated a solid base from which to spawn specific treatment protocols. The available research is investigational in terms of treatment procedures. Replication of these studies could dictate treatment protocol and contribute substantively to future VA and DoD CPG updates. Future researchers should consider the use of a standard PTSD symptom assessment tool to make interstudy comparisons more meaningful. The length of treatment and exposure elements should be targeted specifically in future research as these components currently vary the most.
The military represents an obvious avenue for future research due to increased PTSD diagnosis in recent years. Although the etiology of the increase in PTSD is unclear and most likely multifactorial (decreased resilience, increased awareness, increased pursuit of secondary gains, etc), the need for treatment options is apparent.1 Group cohesion has been shown to be a core component of successful group psychotherapy, so military members who are accustomed to unit cohesion might represent a uniquely suitable population for this modality.15 Interestingly and for reasons not currently understood, veterans do not see effects of therapy as large as their civilian counterparts.8 This underscores the need for further evaluation of military-specific outcomes.
CONCLUSIONS
Although the available evidence is not robust, results do support the careful use of GCBT as an effective treatment for PTSD symptom reduction.8 Group psychotherapy has been generally regarded as an efficacious and cost-effective method to achieve similar outcomes to individual therapy. Increasing PTSD prevalence compels mental health care providers to explore all available treatment options. The potential for GCBT as an option is exciting, especially for mental health providers and those with limited resources. Rising health care standards and the current national fiscal situation is dictating a reevaluation of treatment options; so perhaps all health care providers will soon consider the use of GCBT.
As with any group assignment, the clinician should carefully consider the individual’s suitability and desire for group participation.16 With GCBT, providers could facilitate the relief of relentless apprehension and functional impairment for several patients simultaneously. Although there are many details left to explore regarding the use of GCBT for PTSD, the therapy’s foundation for use as a PTSD treatment is apparent.
Author disclosures
The author reports no actual or potential conflicts of interest with regard to this article.
Disclaimer
The opinions expressed herein are those of the author and do not necessarily reflect those of Federal Practitioner, Frontline Medical Communications Inc., the U.S. Government, or any of its agencies. This article may discuss unlabeled or investigational use of certain drugs. Please review the complete prescribing information for specific drugs or drug combinations—including indications, contraindications, warnings, and adverse effects—before administering pharmacologic therapy to patients.
1. Litz B, Schlenger W. Posttraumatic stress disorder in service members and new veterans of the Iraq and Afghanistan wars: A bibliography and critique. PTSD Res Q. 2009;20(1):1-3.
2. Tanielian T. Assessing combat exposure and post-traumatic stress disorder in troops and estimating the costs to society: Implications from the RAND Invisible Wounds of War Study. http://www.rand.org/pubs/testimonies/CT321.html. Published 2009. Accessed September 29, 2014.
3. Kessler RC, Chiu WT, Demler O, Merikangas KR, Walters EE. Prevalence, severity, and comorbidity of 12-month DSM-IV disorders in the National Comorbidity Survey Replication. Arch Gen Psychiatry. 2005;62(6):617-627.
4. Cukor J, Spitalnick J, Difede J, Rizzo A, Rothbaum BO. Emerging treatments for PTSD. Clinical Psychol Rev. 2009;29(8):715-726.
5. Hoge CW. Interventions for war-related posttraumatic stress disorder: Meeting veterans where they are. JAMA. 2011;306(5):549-551.
6. Veterans Health Administration, Department of Defense. VA/DoD Clinical Practice Guideline: Management of Post-Traumatic Stress, Version 2.0. Washington, DC: Veterans Health Administration and Department of Defense; 2010.
7. Burlingame GM, Fuhriman A, Mosier J. The differential effectiveness of group psychotherapy: A meta-analytic perspective. Group Dyn. 2003;7(1):3-12.
8. Barrera TL, Mott JM, Hofstein RF, Teng EJ. A meta-analytic review of exposure in group cognitive behavioral therapy for posttraumatic stress disorder. Clin Psychol Rev. 2013;33(1):24-32.
9. Bisson J, Andrew M. Psychological treatment of post-traumatic stress disorder (PTSD). Cochrane Database Syst Rev. 2007;(3):CD003388.
10. Khoo A, Dent MT, Oei TS. (2011). Group cognitive behaviour therapy for military service-related post-traumatic stress disorder: Effectiveness, sustainability and repeatability. Aust N Z J Psychiatry. 2011;45(8):663-672.
11. Swanson LM, Favorite TK, Horin E, Arnedt JT. A combined group treatment for nightmares and insomnia in combat veterans: A pilot study. J Trauma Stress. 2009;22(6):639-642.
12. Erickson DH, Janeck A, Tallman K. A cognitive-behavioral group for patients with various anxiety disorders. Psychiatr Serv. 2007;58(9):1205-1211.
13. Thompson AR, Wilde E, Boon K. The development of group CBT for the treatment of road-traffic-accident-related post-traumatic stress disorder: A pilot study. Cognitive Behav Therapist. 2010;2(1):32-42.
14. Slade T, Johnston A, Oakley-Browne MA, Andrews G, Whiteford H. 2007 National Survey of Mental Health and Wellbeing: Methods and key findings. Aust N Z J Psychiatry. 2009;43(7):594-605.
15. Crowe TP, Grenyer BF. Is therapist alliance or whole group cohesion more influential in group psychotherapy outcomes? Clin Psychol Psychother. 2008;15(4):239-246.
16. Leszcz M, Kobos JC. Evidence-based group psychotherapy: Using AGPA’s practice guidelines to enhance clinical effectiveness. J Clin Psychol. 2008;64(11):1238-1260.
Anxiety is a necessary and natural reaction to trauma, but, sometimes, anxiety symptoms become excessive and problematic, as experienced with posttraumatic stress disorder (PTSD). Some patients who struggle with PTSD endure a relentless apprehension so intense that it keeps them from participating in everyday activities, such as attending work and partaking in social activities. Associated anxiety symptoms severely impair everyday function and include increased heart rate, sweating, intrusive images, poor attention, fear, or insomnia. Posttraumatic stress disorder symptoms often lead to occupational dysfunction, relationship difficulty, and numerous other functional impairments.
Approximately 300,000 veterans meet the criteria for PTSD related to ongoing or recent wars.1 The veteran does not bear the personal and functional burden alone; however, the financial load is felt throughout society. One recent study suggests that for veterans diagnosed with PTSD, the first 2 years after deployment cost society an estimated $7,000 per individial.2 Current research suggests that this potentially debilitating disorder occurs in about 14% of Operation Iraqi Freedom/Operation Enduring Freedom combat troops, whereas the similar U.S. demographic population experiences PTSD at a rate of about 7%.1,3 The ongoing military trauma exposures are compelling the mental health community to establish efficient and effective treatment options.4,5
Several treatment strategies exist to reduce PTSD symptoms, but health care professionals must seek a balance between therapeutic benefit and cost. The treatment of PTSD is diverse and variable; however, in the most recent Clinical Practice Guideline (CPG) for PTSD, the VA and DoD specifically endorse some psychotherapeutic interventions while dissuading the use of others.6 Of note, the VA and DoD CPG strongly encourages Stress Inoculation Training (SIT) and similar cognitive therapies aimed at guiding patients through the process of consciously understanding the relationship between thoughts and feelings and then modifying thoughts to appropriately manage stressors.6 Meanwhile, group psychotherapy has been determined to be “somewhat helpful.”6 Even though cognitive- and group-based therapies have long been established as efficacious for numerous psychological disorders (depression, obsessive compulsive disorder, eating disorders, etc), neither the American Group Psychotherapy Association nor the VA and DoD CPG directly endorse the use of group cognitive behavioral therapy (GCBT) for the treatment of PTSD.6,7 However, both VA and DoD mental health providers commonly practice CBT and various group psychotherapies for the treatment of PTSD.
Despite the widespread use of CBT, there is a gap in the clinical understanding of the evidence supporting GCBT for PTSD. The goal of this synthesis was to understand the efficacy of treating PTSD symptoms with group psychotherapy. To begin this investigation, the following PICO (population, intervention, comparison, outcome) question was asked: In adults diagnosed with PTSD, how effective is group cognitive behavioral therapy in reducing PTSD-related symptoms?
Methods
Research articles addressing the use of GCBT in PTSD were obtained via database searches that took place during October 2012 (Table). Searched databases included the Cochrane Central Register of Controlled Trials, Cochrane Database of Systematic Reviews Randomized Controlled Trials, Psychological Information (PsycINFO), and Public Medicine (PubMed).
The PubMed database was searched using the following MeSH (medical subject heading) terms: “psychotherapy, group” and “stress disorders, post-traumatic” and “cognitive therapy.” Limitations were set to include only patients aged ≥ 18 years, results in English, those involving human subjects, and articles published within the past 5 years. A manual search of references was also conducted, and relevant articles were retained.
Articles that addressed primary substance abuse, other DSM Axis I disorders, intimate partner violence, or family issues were excluded from the evidence sample due to concerns of an alternate treatment focus. Articles with a focus on telehealth or alternative medicine were considered confounding to the scope of this review were also excluded. It was also noted that the term CBT is used collectively for an umbrella of treatments; however, treatments that focused on elements other than the components of CBT being delivered in a group were not included. To prevent duplication of the results, research from an inclusive review was not considered individually.
SUMMARY OF EVIDENCE
Six works fulfilled the PICO criteria and were of sufficient quality to be synthesized. Of the 6 articles retained for synthesis, 2 were high-level reviews. Both reviews supported the use of GCBT for PTSD treatment. Barrera and colleagues reported an overall large effect size regardless of the presence of exposure in-group among the 12 treatment conditions and 651 study participants.8 These researchers also reported that in-group exposure did not further traumatize other group members.
Similarly, although a notably older and smaller review, Bisson and Andrew reported a significant standard mean deviation between 4 GCBT treatment and wait list controls. These reviewers did not find a significant difference between trauma- and nontrauma-focused treatment groups. The reviews also noted that individual psychotherapy and/or pharmacotherapy was most often continued throughout the reviewed studies.8,9
The 4 other studies contribute substantively to this synthesis but arguably represent lower evidence quality. A large longitudinal study of 496 Australian veterans reported a large effect size that was sustained 9 months after treatment began.10 These researchers used an intensive outpatient program that included medication and other treatment modalities as the basis for GCBT delivery. They reported that the majority of the patients revealed improvement in PTSD symptoms.
Another study sampled a similar group of 10 combat veterans but focused particular attention on sleep-related PTSD symptoms of insomnia, nightmares, and sleep quality.11 Although these researchers were unable to report a significant difference in overall PTSD symptoms for the 8 subjects who completed the protocol, they did find a large effect size on insomnia severity and a medium effect size on sleep quality. Regular treatment, including medication, continued throughout this study.
Other researchers reported a medium effect size on PTSD symptoms while using GCBT in a heterogeneous group with various anxiety disorders, including obsessive compulsive disorder, generalized anxiety disorder, social phobia, panic disorders, and PTSD.12 Although reporting similar results as all other included studies, this study has some significant limitations, including a 26% dropout rate among the 152 participants. The final study included for synthesis reported a remarkable 67% elimination of the PTSD diagnosis among 6 motor vehicle accident survivors in the small, uncontrolled study.13 Concomitant treatments, including medications, were not reported in detail for these 4 studies except as mentioned.
As a whole, the 6 studies revealed some appreciable commonalities. Time since diagnosis did not seem to influence the results. Attrition was consistently found to be similar to other PTSD treatments. The reported session topics were loosely based on common CBT tenets (ie, education, challenging cognitions, and relaxation techniques) and were typically similar among treatment groups, including the use of homework.
DISCUSSION
As the diagnosis of PTSD increases to unfamiliar levels, GCBT has the potential to be helpful to clinicians and patients seeking alternatives to their current treatments.1,4,14 The reported results imply that GCBT can be useful in PTSD symptom reduction. This could be particularly useful to VA and military providers or rural providers operating with limited resources.
Treatment protocols are not well established and should be approached with care prior to the establishment of CBT treatment groups for those diagnosed with PTSD. Session overviews and descriptions, such as those mentioned in Thompson and colleagues, could provide a reference point for future use.13
Also worth considering, CBT can be an ambiguous term requiring deliberate definition within treatment protocols. As noted in the VA and DoD CPG, exposure- and trauma-focused treatment designs can be efficacious, but these elements do not seem to be required within the GCBT treatment setting.
The current research also suggests GCBT efficacy regardless of the index trauma. This does not suggest that heterogeneous groups were frequently studied nor can conclusions be drawn regarding heterogeneous treatment groups. Elements such as group size and session length are inconsistently reported and require specific consideration as well. There is a distinct lack of research directly comparing individual CBT with GCBT directly, which prohibits meaningful conclusions regarding PTSD symptom reduction. This research gap may well have influenced the recommendations within the VA and DoD CPG. Although some higher quality studies exist, many of the published reports on GCBT have noteworthy design flaw, such as inadequate controls and statistical analysis.
LIMITATIONS
There are some limitations to this literature synthesis. Although the search was limited to the past 5 years, the inclusion of reviews accounts for older evidence. As alluded to earlier, the lack of a standardized GCBT treatment protocol challenges results comparisons as well. The consequent treatment variations make direct interstudy comparison and synthesis difficult. Similarly, outcome measures varied between studies. Also, group psychotherapy is well established and accepted. Therefore, much of the supporting research was accomplished outside the parameters of this literature search. This empirical view of group psychotherapy among mental health providers may also contribute to the lack of available research.
It is also worth noting that studies finding neutral or negative results are often unpublished. This publication bias could account for the lack of available evidence. The research reports do not consistently report therapist qualifications; however, board certificates in group psychotherapy and CBT are undeniably variables available for debate. The inclusion of uncontrolled trials limits these findings as well. Although the above limitations are not exhaustive, they do provide necessary caveats to future generalizations.
FUTURE IMPLICATIONS
Perhaps the most important information to gain from future research is that of treatment outcomes. Studies that include a detailed outcome evaluation could reveal patient satisfaction, efficacy, and financial considerations. In the presence of adequate supportive data, GCBT could contribute outcome data regarding trauma survivor symptom normalization, peer support formation, access to care, treatment efficiency, and health care resources utilization. As noted in Barrera and colleagues, future analysis will require a greater volume of trials with an overall increase in methodological rigor.8
Current research has demonstrated a solid base from which to spawn specific treatment protocols. The available research is investigational in terms of treatment procedures. Replication of these studies could dictate treatment protocol and contribute substantively to future VA and DoD CPG updates. Future researchers should consider the use of a standard PTSD symptom assessment tool to make interstudy comparisons more meaningful. The length of treatment and exposure elements should be targeted specifically in future research as these components currently vary the most.
The military represents an obvious avenue for future research due to increased PTSD diagnosis in recent years. Although the etiology of the increase in PTSD is unclear and most likely multifactorial (decreased resilience, increased awareness, increased pursuit of secondary gains, etc), the need for treatment options is apparent.1 Group cohesion has been shown to be a core component of successful group psychotherapy, so military members who are accustomed to unit cohesion might represent a uniquely suitable population for this modality.15 Interestingly and for reasons not currently understood, veterans do not see effects of therapy as large as their civilian counterparts.8 This underscores the need for further evaluation of military-specific outcomes.
CONCLUSIONS
Although the available evidence is not robust, results do support the careful use of GCBT as an effective treatment for PTSD symptom reduction.8 Group psychotherapy has been generally regarded as an efficacious and cost-effective method to achieve similar outcomes to individual therapy. Increasing PTSD prevalence compels mental health care providers to explore all available treatment options. The potential for GCBT as an option is exciting, especially for mental health providers and those with limited resources. Rising health care standards and the current national fiscal situation is dictating a reevaluation of treatment options; so perhaps all health care providers will soon consider the use of GCBT.
As with any group assignment, the clinician should carefully consider the individual’s suitability and desire for group participation.16 With GCBT, providers could facilitate the relief of relentless apprehension and functional impairment for several patients simultaneously. Although there are many details left to explore regarding the use of GCBT for PTSD, the therapy’s foundation for use as a PTSD treatment is apparent.
Author disclosures
The author reports no actual or potential conflicts of interest with regard to this article.
Disclaimer
The opinions expressed herein are those of the author and do not necessarily reflect those of Federal Practitioner, Frontline Medical Communications Inc., the U.S. Government, or any of its agencies. This article may discuss unlabeled or investigational use of certain drugs. Please review the complete prescribing information for specific drugs or drug combinations—including indications, contraindications, warnings, and adverse effects—before administering pharmacologic therapy to patients.
1. Litz B, Schlenger W. Posttraumatic stress disorder in service members and new veterans of the Iraq and Afghanistan wars: A bibliography and critique. PTSD Res Q. 2009;20(1):1-3.
2. Tanielian T. Assessing combat exposure and post-traumatic stress disorder in troops and estimating the costs to society: Implications from the RAND Invisible Wounds of War Study. http://www.rand.org/pubs/testimonies/CT321.html. Published 2009. Accessed September 29, 2014.
3. Kessler RC, Chiu WT, Demler O, Merikangas KR, Walters EE. Prevalence, severity, and comorbidity of 12-month DSM-IV disorders in the National Comorbidity Survey Replication. Arch Gen Psychiatry. 2005;62(6):617-627.
4. Cukor J, Spitalnick J, Difede J, Rizzo A, Rothbaum BO. Emerging treatments for PTSD. Clinical Psychol Rev. 2009;29(8):715-726.
5. Hoge CW. Interventions for war-related posttraumatic stress disorder: Meeting veterans where they are. JAMA. 2011;306(5):549-551.
6. Veterans Health Administration, Department of Defense. VA/DoD Clinical Practice Guideline: Management of Post-Traumatic Stress, Version 2.0. Washington, DC: Veterans Health Administration and Department of Defense; 2010.
7. Burlingame GM, Fuhriman A, Mosier J. The differential effectiveness of group psychotherapy: A meta-analytic perspective. Group Dyn. 2003;7(1):3-12.
8. Barrera TL, Mott JM, Hofstein RF, Teng EJ. A meta-analytic review of exposure in group cognitive behavioral therapy for posttraumatic stress disorder. Clin Psychol Rev. 2013;33(1):24-32.
9. Bisson J, Andrew M. Psychological treatment of post-traumatic stress disorder (PTSD). Cochrane Database Syst Rev. 2007;(3):CD003388.
10. Khoo A, Dent MT, Oei TS. (2011). Group cognitive behaviour therapy for military service-related post-traumatic stress disorder: Effectiveness, sustainability and repeatability. Aust N Z J Psychiatry. 2011;45(8):663-672.
11. Swanson LM, Favorite TK, Horin E, Arnedt JT. A combined group treatment for nightmares and insomnia in combat veterans: A pilot study. J Trauma Stress. 2009;22(6):639-642.
12. Erickson DH, Janeck A, Tallman K. A cognitive-behavioral group for patients with various anxiety disorders. Psychiatr Serv. 2007;58(9):1205-1211.
13. Thompson AR, Wilde E, Boon K. The development of group CBT for the treatment of road-traffic-accident-related post-traumatic stress disorder: A pilot study. Cognitive Behav Therapist. 2010;2(1):32-42.
14. Slade T, Johnston A, Oakley-Browne MA, Andrews G, Whiteford H. 2007 National Survey of Mental Health and Wellbeing: Methods and key findings. Aust N Z J Psychiatry. 2009;43(7):594-605.
15. Crowe TP, Grenyer BF. Is therapist alliance or whole group cohesion more influential in group psychotherapy outcomes? Clin Psychol Psychother. 2008;15(4):239-246.
16. Leszcz M, Kobos JC. Evidence-based group psychotherapy: Using AGPA’s practice guidelines to enhance clinical effectiveness. J Clin Psychol. 2008;64(11):1238-1260.
CAR T cells serve as bridge to HSCT in ALL
Credit: Charles Haymond
An anti-CD19 chimeric antigen receptor (CAR) T-cell therapy can elicit complete responses (CRs) in heavily pretreated patients with acute lymphoblastic leukemia (ALL), results of a phase 1 trial suggest.
More than half of the 21 patients enrolled achieved a CR, and most of those patients went on to hematopoietic stem cell transplant (HSCT).
All 10 patients who underwent HSCT remain leukemia-free at a median follow-up of 10 months.
The CAR T cells did prompt some serious adverse effects, but all effects were fully reversible.
Crystal L. Mackall, MD, of the National Cancer Institute in Bethesda, Maryland, and her colleagues reported these results in The Lancet.
The phase 1 study enrolled patients ages 1 to 30 years who had relapsed or refractory ALL or non-Hodgkin lymphoma. Twenty patients had B-cell ALL, and 1 had diffuse large B-cell lymphoma (DLBCL). All of the patients had been heavily pretreated, and 8 had received a prior HSCT.
Patients received a conditioning regimen of cyclophosphamide and fludarabine, followed by a single infusion of CAR T cells: either 1×10⁶ CAR-transduced T cells per kg or 3×10⁶ CAR-transduced T cells per kg.
The CAR T cells were produced from each patient’s own peripheral blood mononuclear cells, modified using a gammaretroviral vector encoding the CAR, as well as a CD28 costimulatory moiety. After the dose-escalation phase, an expansion cohort was treated at the maximum-tolerated dose.
Twenty-one patients were enrolled and infused, but 2 of them did not receive the prescribed dose of CAR T cells, as the assigned dose could not be generated. The maximum-tolerated dose was 1×10⁶ CAR T cells per kg.
All toxicities were fully reversible. The most common non-hematologic grade 3 adverse events were fever (n=9), hypokalemia (n=9), fever and neutropenia (n=8), and cytokine release syndrome (n=3). Grade 4 cytokine release syndrome occurred in 3 patients.
At day 28, 12 patients had achieved a minimal residual disease (MRD)-negative CR. One patient had an MRD-positive CR, 1 had an MRD-positive CR with incomplete count recovery, and 3 patients had stable disease. Four patients, including the one with DLBCL, progressed.
Ten of the patients with an MRD-negative CR subsequently underwent HSCT, and all 10 remained disease-free with a median follow-up of 10 months.
“The results show that this treatment is feasible in many patients with ALL and can eradicate chemoresistant disease with an acceptable toxicity profile,” said Gary Schiller, MD, of the University of California, Los Angeles, who was not involved in this study.
“Further, the findings demonstrate substantially higher response rates than seen in the literature for the most recently approved agent for refractory ALL. CD19-CAR therapy represents a potentially important new tool to address the urgent need for new treatment modalities in these patients.”
Researchers previously reported positive results with this therapy in patients with chemotherapy-refractory DLBCL. ![]()
Lactate Clearance Portends Better Outcomes after Cardiac Arrest
Clinical question: Is greater lactate clearance following resuscitation from cardiac arrest associated with lower mortality and better neurologic outcomes?
Background: Recommendations from the International Liaison Committee on Resuscitation for monitoring serial lactate levels in post-resuscitation patients are based primarily on extrapolation from other conditions such as sepsis. Two single-retrospective analyses found effective lactate clearance was associated with decreased mortality. This association had not previously been validated in a multicenter, prospective study.
Study design: Multicenter, prospective, observational study.
Setting: Four urban, tertiary-care teaching hospitals.
Synopsis: Absolute lactate levels and the differences in the percent lactate change over 24 hours were compared in 100 patients who suffered out-of-hospital cardiac arrest. Ninety-seven percent received therapeutic hypothermia, and overall survival was 46%. Survivors and patients with a good neurologic outcome had lower lactate levels at zero hours (4.1 vs. 7.3), 12 hours (2.2 vs. 6.0), and 24 hours (1.6 vs. 4.4) compared with nonsurvivors and patients with bad neurologic outcomes.
The percent lactate decreased was greater in survivors and in those with good neurologic outcomes (odds ratio, 2.2; 95% confidence interval, 1.1–4.4).
Nonsurvivors or those with poor neurologic outcomes were less likely to have received bystander CPR, to have suffered a witnessed arrest, or to have had a shockable rhythm at presentation. Superior lactate clearance in survivors and those with good neurologic outcomes suggests a potential role in developing markers of effective resuscitation.
Bottom line: Lower lactate levels and more effective clearance of lactate in patients following cardiac arrest are associated with improved survival and good neurologic outcome.
Citation: Donnino MW, Andersen LW, Giberson T, et al. Initial lactate and lactate change in post-cardiac arrest: a multicenter validation study. Crit Care Med. 2014;42(8):1804-1811.
Time to Meds Matters for Patients with Cardiac Arrest Due to Nonshockable Rhythms
Clinical question: Is earlier administration of epinephrine in patients with cardiac arrest due to nonshockable rhythms associated with increased return of spontaneous circulation, survival, and neurologically intact survival?
Background: About 200,000 hospitalized patients in the U.S. have a cardiac arrest, commonly due to nonshockable rhythms. Cardiopulmonary resuscitation has been the only efficacious intervention. There are no well-controlled trials of the use of epinephrine on survival and neurological outcomes.
Study design: Prospective cohort from a large multicenter registry of in-hospital cardiac arrests.
Setting: Data from 570 hospitals from 2000 to 2009.
Synopsis: Authors included 25,095 adults from 570 hospitals who had cardiac arrests in hospital with asystole or pulseless electrical activity as the initial rhythm. Time to first administration of epinephrine was recorded and then separated into quartiles, and odds ratios were evaluated using one to three minutes as the reference group. Outcomes of survival to hospital discharge (10%), return of spontaneous circulation (47%), and survival to hospital discharge with favorable neurologic status (7%) were assessed.
Survival to discharge decreased as the time to administration of the first dose of epinephrine increased. Of those patients receiving epinephrine in one minute, 12% survived. This dropped to 7% for those first receiving epinephrine after seven minutes. Return of spontaneous circulation and survival to discharge with favorable neurologic status showed a similar stepwise decrease with longer times to first administration of epinephrine.
Bottom line: Earlier administration of epinephrine to patients with cardiac arrest due to nonshockable rhythms is associated with improved survival to discharge, return of spontaneous circulation, and neurologically intact survival.
Citation: Donnino MW, Salciccioli JD, Howell MD, et al. Time to administration of epinephrine and outcome after in-hospital cardiac arrest with non-shockable rhythms: restrospective analysis of large in-hospital data registry. BMJ. 2014;348:g3028.
Frailty Indices Tool Predicts Post-Operative Complications, Mortality after Elective Surgery in Geriatric Patients
Clinical question: Is there a more accurate way to predict adverse post-operative outcomes in geriatric patients undergoing elective surgery?
Background: More than half of all operations in the U.S. involve geriatric patients. Most tools hospitalists use to predict post-operative outcomes are focused on cardiovascular events and do not account for frailty. Common in geriatric patients, frailty is thought to influence post-operative outcomes.
Study design: Prospective cohort study.
Setting: A 1,000-bed academic hospital in Seoul, South Korea.
Synopsis: A cohort of 275 elderly patients (>64 years old) who were scheduled for elective intermediate or high-risk surgery underwent a pre-operative comprehensive geriatric assessment (CGA) that included measures of frailty. This cohort was then followed for mortality, major post-operative complications (pneumonia, urinary infection, pulmonary embolism, and unplanned transfer to intensive care), length of stay, and transfer to a nursing home. Post-operative complications, transfer to a nursing facility, and one-year mortality were associated with a derived scoring tool that included the Charlson Comorbidity Index, activities of daily living (ADL), instrumental activities of daily living (IADL), dementia, risk for delirium, mid-arm circumference, and a mini-nutritional assessment.
This tool was more accurate at predicting one-year mortality than the American Society of Anesthesiologists (ASA) classification.
Bottom line: This study establishes that measures of frailty predict post-operative outcomes in geriatric patients undergoing elective surgery; however, the authors’ tool depends on CGA, which is time-consuming, cumbersome, and depends on indices not familiar to many hospitalists.
Citation: Kim SW, Han HS, Jung HW, et al. Multidimensional frailty scores for the prediction of postoperative mortality risk. JAMA Surg. 2014;149(7):633-640.
Pre-Operative Use of Angiotension Converting Enzyme Inhibitors, Angiotension Receptor Blockers Examined in Elective Joint Replacement Surgery
Clinical question: Should angiotension-converting enzyme inhibitors or angiotension receptor blockers (ACEI/ARB) be held the morning of elective joint replacement?
Background: In patients taking ACEI/ARB, the decision regarding whether or not to give these medications on the day of surgery is controversial. UptoDate recommends holding ACEI/ARB the day of surgery; American College of Physicians Guidelines and SHM Consult Medicine recommend giving these drugs on the day of surgery.
Study design: Retrospective cohort (case control) study.
Setting: A large academic hospital in Pennsylvania.
Synopsis: Researchers studied adults undergoing elective spinal fusion, total knee replacement, or total hip replacement, and compared outcomes in 323 patients who were taking an ACEI/ARB (study group) to outcomes in the 579 patients who were not taking an ACEI/ARB (control group) before surgery. It was assumed—but not studied—that the ACEI/ARB was continued the morning of surgery in all patients in the study group, because that was the standard practice at this hospital.
Compared to the control group, the study group had more post-induction hypotension (12.2% vs. 6.7%) and more post-operative acute kidney injury (5.76% vs. 3.28%). Patients who developed acute kidney injury had longer length of stay (5.76 vs. 3.28 days) but no difference in two-year mortality.
Patients in the study group had higher baseline creatinine, were older, were more likely to be taking a diuretic, and were more likely to have diabetes, heart failure, and coronary artery disease. The authors used multiple logistic regression to adjust for these differences. Anesthesia and intra-operative fluid management were not standardized or compared.
Bottom line: ACEI/ARB administration on the morning of elective major orthopedic surgery is likely associated with a higher risk of intra-operative hypotension and acute kidney injury.
Citation: Nielson E, Hennrikus E, Lehman E, Mets B. Angiotensin axis blockade, hypotension, and acute kidney injury in elective major orthopedic surgery. J Hosp Med. 2014;9(5):283-288.
No Mortality Difference Associated with Pre-Operative Beta Blocker Use for Coronary Artery Bypass Grafting Without Recent Myocardial Infarction
Clinical question: Is the use of beta blockers within 24 hours of coronary artery bypass grafting (CABG) surgery without recent myocardial infarction (MI) associated with decreased peri-operative mortality?
Background: Several retrospective observational studies suggest a reduction in peri-operative mortality with CABG surgery if beta blockers are administered prior to surgery. Although the use of beta blockers pre-operatively for CABG is now a quality measure, the use of pre-operative beta blockers is still controversial due to the results of more recent studies, with the observed benefit thought to be driven mainly by patients with recent MI.
Study design: Retrospective cohort analysis.
Setting: More than 1,100 U.S. hospitals.
Synopsis: The Society of Thoracic Surgeons’ National Adult Cardiac Surgery database identified 506,110 adult patients (without MI within 21 days) nonemergently undergoing CABG surgery. Beta blocker use was defined as receiving a beta blocker within 24 hours before surgery. Although most patients (86%) received beta blockers prior to surgery, there was no significant difference in operative mortality, permanent stroke, prolonged ventilation, and renal failure between patients receiving beta blockers and those who did not, although atrial fibrillation (Afib) was more common with pre-operative beta blocker use.
Bottom line: For patients undergoing nonemergent CABG surgery without recent MI, pre-operative beta blocker use is not associated with improved outcomes and is associated with slightly higher rates of Afib.
Citation: Brinkman W, Herbert MA, O’Brien S, et al. Preoperative beta-blocker use in coronary artery bypass grafting surgery: national database analysis. JAMA Intern Med. 2014;174(8):1320-1327.
Delirium Severity Scoring System CAM-S Correlates with Length of Stay, Mortality
Clinical question: Does the CAM-S, a modified version of the Confusion Assessment Method (CAM), which measures delirium severity, correlate with clinical outcomes?
Background: In 1990, Dr. Sharon Inouye developed the CAM, which is a common, standard measure to identify the presence of delirium. Although other scoring systems exist to quantify delirium severity, Dr. Inouye proposes an extension of the CAM (CAM-S) to measure delirium severity.
Study design: Validation analysis.
Setting: Three academic medical centers in the U.S.
Synopsis: Two validation cohorts of patients 70 years or older without dementia and moderate-to-high-risk of developing delirium during hospitalization were studied. The first cohort comprised 300 patients scheduled for elective, noncardiac surgery; the second cohort was made up of 250 patients admitted to an inpatient medical service. The CAM-S uses the same items as the original CAM and rates each symptom 0 for absent, 1 for mild, or 2 for marked; acute onset of fluctuation receives 0 (absent) or 1 (present). Higher CAM-S scores appear to correlate with various outcome measures, including increased length of stay, new nursing home placement, and 90-day mortality.
Bottom line: Higher scores on the CAM-S, a scoring system based on the CAM and designed to measure delirium severity, are associated with worse in-hospital and post-discharge outcomes.
Citation: Inouye SK, Kosar CM, Tommet D, et al. The CAM-S: development and validation of a new scoring system for delirium severity in 2 cohorts. Ann Intern Med. 2014;160(8):526-533.
Thrombolytics in Pulmonary Embolism Associated with Lower Mortality, Increased Bleeding
Clinical question: What are the mortality benefits and bleeding risks associated with thrombolytic therapy, compared with other anticoagulants, in pulmonary embolism (PE)?
Background: Thrombolytics are not routinely administered for PE but can be considered in patients with hemodynamic instability with massive PE and those not responding to anticoagulation.
Study design: Meta-analysis.
Setting: Sixteen randomized clinical trials (RCTs) occurring in a variety of settings.
Synopsis: Trials involving 2,115 patients (thrombolytic therapy cohort 1,061; anticoagulation cohort 1,054) with PE were studied, with special attention given to those patients with intermediate risk PEs defined by subclinical cardiovascular compromise. Thrombolytics were compared with low molecular weight heparin, unfractionated heparin, vitamin K antagonists, and fondaparinux. The primary outcomes were all-cause mortality and major bleeding. Secondary outcomes included risk of recurrence of the PE and intracranial hemorrhage.
Thrombolytic therapy was associated with lower all-cause mortality and with higher risk of bleeding. There was a 9.24% rate of major bleeding in the thrombolytic therapy cohort and a 3.42% rate in the anticoagulation cohort. Intracranial hemorrhage was greater in the thrombolytic therapy cohort (1.46% vs. 0.19%). Patients with intermediate risk PE had greater major bleeding rate (7.74% vs. 2.25%) and lower mortality (1.39% vs. 2.92%) with thrombolytics compared to anticoagulation. A net clinical benefit calculation (mortality benefit accounting for intracranial hemorrhage risk) was performed and demonstrated a net clinical benefit of 0.81% (95% CI, 0.65%-1.01%) for those patients who received thrombolytics versus other anticoagulation.
Bottom line: This study suggested a mortality benefit of thrombolytics overall, including those patients with intermediate risk PE.
Citation: Chatterjee S, Chakraborty A, Weinberg I, et al. Thrombolysis for pulmonary embolism and risk of all-cause mortality, major bleeding, and intracranial hemorrhage: a meta-analysis. JAMA. 2014;311(23):2414-2421.
Interventions Effective in Preventing Hospital Readmissions
Clinical question: Which interventions are most effective to prevent 30-day readmissions in medical or surgical patients?
Background: Preventing early readmissions has become a national priority. This study set out to determine which intervention had the largest impact on the prevention of early readmission.
Study design: Meta-analysis.
Setting: Forty-seven studies in multiple locations.
Synopsis: This study evaluated 47 randomized trials that assessed the effectiveness of peri-discharge interventions on the risk of all-cause or unplanned 30-day readmissions for medical and surgical patients. Outcomes included unplanned readmissions, all-cause readmissions, and a composite of unplanned and all-cause readmissions plus out-of-hospital deaths.
The included studies reported up to seven methods of preventing readmissions, including involvement of case management, home visits, education of patients, and self-care support. In 42 trials reporting readmission rates, the pooled relative risk of readmission was 0.82 (95 % CI, 0.73-0.91; P<0.001) within 30 days.
Multiple subgroup analyses noted that the most effective interventions on hospital readmission were those that were more complex and those that sought to augment patient capacity to access and enact dependable post-discharge care.
Limitations included single-center academic studies, lack of standard for dealing with missing data, existence of publication bias, and differing methods used to evaluate intervention effects.
Bottom line: This study was the largest of its kind, to date, and suggests that the interventions analyzed in this study, although complex (e.g. enhancing capacity for self-care at home), were efficacious in reducing 30-day readmissions.
Citation: Leppin AL, Gionfriddo MR, Kessler M, et al. Preventing 30-day hospital readmissions: a systematic review and meta-analysis of randomized trials. JAMA Intern Med. 2014;174(7):1095-1107.