User login
HM15's Top 10 Must-See Sessions

In fact, the issue for those attending HM15 (March 29-April 1 in National Harbor, Md.) won’t be choosing which sessions to soak in. It will be struggling to choose which ones to miss.
Assistant course director Melissa Mattison, MD, SFHM, puts it this way: “The opportunity to learn about faculty development, the opportunity to learn about administrative concerns in running a hospital medicine program, the opportunity to address quality improvement…the opportunity to meet other folks who are doing very similar work and learn from them—all of those things exist.”
So how does one choose the best sessions? Allow us to help. Here’s a list of recommendations from Team Hospitalist, the only reader involvement group of its kind in hospital medicine.
1 “Hospital Management of Patients Presenting with ALTE: An Evidence-Based Approach”
Monday, March 30; 10:35-11:35 a.m.
Dr. Pressel: This is an extremely common problem for pediatric hospitalists—what to do with an infant presenting with a spell. Management can range from just observation to enormous and expensive workups. An authoritative and data-driven paradigm is needed to guide an approach to these children.
2 “Striving for Optimal Care: Updates in Quality, Value, and Patient Satisfaction”
Monday, March 30; 10:35-11:50 a.m.
Dr. Allen-Dicker: Michelle Mourad and Chris Moriates are two dynamic speakers who have been talking about quality (Michelle) and value (Chris) since before they were trendy topics. No hospitalist should be without a proper and up-to-date framework for thinking about these issues; they will make you a better clinician, improve your standing within your hospital medicine group, and enhance your relationships with patients.
3 “Case Studies in Improving Patient Experience”
Monday, March 30; 10:35-11:35 a.m.
Dr. Kanikkannan: Patient experience is such an important focus for many hospitals today. Hospitalists are frontline providers who are asked to work with their hospitals in improving the patient experience. Many hospitals are employing innovative approaches to achieve just this, and this session promises to engage the audience with case studies of improving patient experience. I’m looking forward to learning from these success stories during this session.
4 “Taking the Confusion out of Confusion: Assessment and Management of Delirium”
Monday, March 30; 11:20 a.m.-noon
Dr. Suehler: This is a clinically relevant topic. Hospitalists encounter patients with confusion and delirium, many of them elderly, almost daily. This will be a helpful review to manage these conditions, which are often very disturbing to staff and families, accurately and confidently.
Dr. Zeitoun: Delirium is frequently underdiagnosed and often leads to functional decline, institutionalization, and, ultimately, death. It complicates acute medical care. Hospitalists, in particular, must recognize and regularly assess for both hypoactive and hyperactive delirium early in hospitalized patients.
5 “Broken Heart Going to Surgery? Update in ACC Pre-Op Guidelines”
Tuesday, March 31; 11:45 a.m.-12:25 p.m.
Dr. Kanikkannan: Hospitalists are frequently asked to perform pre-op evaluations in the hospital setting. I’m looking forward to this session because it is a clinically relevant topic that impacts my everyday function as a hospitalist. There is controversy about peri-operative management. Keeping up to date on ACC guidelines is critical to providing evidence-based recommendations to our surgical colleagues when we get back to our institutions.
Dr. Zeitoun: Hospitalists often are asked to provide medical optimization, recommendation, and risk assessment for hospitalized patients requiring surgery during their stay. [We] need to be aware of the 2014 guidelines, as there are major changes to the pre-op protocol, specifically a change from three to two surgical risk categories and an emphasis on functional status, indications for echocardiography/noninvasive stress testing/coronary angiography, and use of beta-blockers. Hospitalists should bring back this information and share with their colleagues to ensure standardization of practice.
6 “Insulin Pumps: Who Should Manage Them Inpatient…You or the Patient”
Tuesday, March 31; 2:50-3:30 p.m.
Dr. Suehler: Insulin pumps have found a much more widespread use in recent years, and many of our patients who present with an unrelated problem will have an insulin pump. Hospitals generally have protocols so patients can use their insulin pumps as inpatients, which is preferred for most patients. Hospitalists need to have, however, a basic knowledge of insulin pumps and their functionality to adequately manage these patients.
7 “It’s Getting Hot in Here–the Management of Febrile Infants”
Tuesday, March 31; 2:50 - 4:05 p.m.
Dr. Pressel: Many protocols for managing febrile infants date from last century and are outdated. Changes in microbacterial epidemiology and patient vaccination status, as well as technological changes in testing, demand a different approach to the traditional academic teaching. Hopefully, this session will be it.
8 “The Scoop on (Gettin’ Them to) Poop: Update in Constipation Management”
Tuesday, March 31; 5:05-5:45 p.m.
Dr. Allen-Dicker: This session is more than just a funny title. [Presenter] Brijen Shah is an accomplished gastroenterologist and medical educator who has recognized the importance of appropriate constipation prevention and management for inpatients. Come to this session to find out how there is more to constipation treatment than just senna and colace.
9 “My Smartphone Went to Medical School—Medical Mobile Resources to Augment Inpatient Practice”
Wednesday, April 1; 7:40-8:35 a.m.
Dr. Kanikkannan: In the era of smartphones and an abundance of apps to download, it would be great to know which of the available resources will add value to my inpatient practice. I frequently use my phone to cross-reference medical topics and drugs. I hope to learn the utility and usefulness of popular apps that are available to the medical professional in this session.
10 “More than Blowing Hot Air: CPAP, BIPAP and Cases to Illustrate Their Use”
Wednesday, April 1; 8:00-9:05 a.m.
Dr. Suehler: As hospitalists, we routinely encounter patients requiring CPAP and BiPAP. We all know the basic principles, but for many of us it is a bit of a “black box.” A great review for hospitalists who want their level of involvement with CPAP and BiPAP to go beyond the order “RT to manage.”
Richard Quinn is a freelance writer in New Jersey.
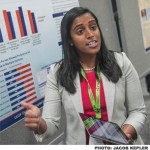
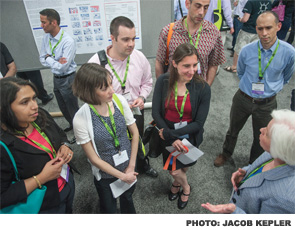
Research, Innovations, Clinical Vignettes Poster Competition Draws Record Number of Abstracts to HM15

As program chair for HM15’s scientific abstract competition—also known as the Research, Innovations, and Clinical Vignettes (RIV) competition—Margaret Fang, MD, MPH, can’t help but think of the future.
RIV is “a chance to hear cutting-edge research or developments in the field, and to look around and say, ‘This is what’s going to show up in your medical journals in a couple of months or next year,’” says Dr. Fang, a hospitalist, researcher, and medical director at the University of California San Francisco. “Sort of like ‘breaking news.’”
This year, the RIV committee encouraged submissions to focus on “the patient experience” and will highlight some of these abstracts as part of the meeting theme, Dr. Fang says. The approach seems to have worked, as a record 1,297 abstracts were submitted for HM15. That figure eclipsed last year’s record high of 1,132 and is double the 634 abstracts submitted for HM10, according to SHM.
“As more and more hospitalists engage in quality improvement and research, I think there’s a big interest in showcasing their efforts and their scholarly works,” Dr. Fang says. “One of the really exciting things about seeing the number of submissions rise year after year is that this not only showcases a breadth of talent in hospital medicine, but also [shows] the engagement and degree of interest in innovations, clinical vignettes, and research.”
As well it should be, says assistant course director Melissa Mattison, MD, FACP, SFHM.
“It’s a really nice opportunity to see firsthand what others are doing and creative ways to address common problems [for] clinical situations. Sometimes they are somewhat unique, but at the same time there are learning points that we can all benefit from,” she adds. “It’s a great opportunity to see good stuff that people are doing all across the country.”

a breadth of talent in hospital medicine, but also [shows] the engagement and degree of interest in innovations, clinical vignettes, and research. —Dr. Fang
In line with Dr. Fang’s point of “breaking news,” this year’s RIV is adding a new feature called “You Heard It Here First,” which will highlight abstracts that were first presented at recent SHM meetings and subsequently were published in noteworthy medical journals. Dr. Fang is proud of the fact that so many abstracts made for colleagues at HM’s annual meeting go on to be important data points for healthcare as a whole.
“The annual meeting is a great venue for that, and RIV especially connects a lot of people who might not have otherwise come into contact with each other,” Dr. Fang says. “During the poster session, we have on-site judges who are groups of senior mentors who go around and get to learn about some of the projects that the presenters are working on. In addition, just the foot traffic, the mingling—you really get to see this fantastic mosaic of what’s going on in the world of hospital medicine.”
Richard Quinn is a freelance writer in New Jersey.
As program chair for HM15’s scientific abstract competition—also known as the Research, Innovations, and Clinical Vignettes (RIV) competition—Margaret Fang, MD, MPH, can’t help but think of the future.
RIV is “a chance to hear cutting-edge research or developments in the field, and to look around and say, ‘This is what’s going to show up in your medical journals in a couple of months or next year,’” says Dr. Fang, a hospitalist, researcher, and medical director at the University of California San Francisco. “Sort of like ‘breaking news.’”
This year, the RIV committee encouraged submissions to focus on “the patient experience” and will highlight some of these abstracts as part of the meeting theme, Dr. Fang says. The approach seems to have worked, as a record 1,297 abstracts were submitted for HM15. That figure eclipsed last year’s record high of 1,132 and is double the 634 abstracts submitted for HM10, according to SHM.
“As more and more hospitalists engage in quality improvement and research, I think there’s a big interest in showcasing their efforts and their scholarly works,” Dr. Fang says. “One of the really exciting things about seeing the number of submissions rise year after year is that this not only showcases a breadth of talent in hospital medicine, but also [shows] the engagement and degree of interest in innovations, clinical vignettes, and research.”
As well it should be, says assistant course director Melissa Mattison, MD, FACP, SFHM.
“It’s a really nice opportunity to see firsthand what others are doing and creative ways to address common problems [for] clinical situations. Sometimes they are somewhat unique, but at the same time there are learning points that we can all benefit from,” she adds. “It’s a great opportunity to see good stuff that people are doing all across the country.”
a breadth of talent in hospital medicine, but also [shows] the engagement and degree of interest in innovations, clinical vignettes, and research. —Dr. Fang
In line with Dr. Fang’s point of “breaking news,” this year’s RIV is adding a new feature called “You Heard It Here First,” which will highlight abstracts that were first presented at recent SHM meetings and subsequently were published in noteworthy medical journals. Dr. Fang is proud of the fact that so many abstracts made for colleagues at HM’s annual meeting go on to be important data points for healthcare as a whole.
“The annual meeting is a great venue for that, and RIV especially connects a lot of people who might not have otherwise come into contact with each other,” Dr. Fang says. “During the poster session, we have on-site judges who are groups of senior mentors who go around and get to learn about some of the projects that the presenters are working on. In addition, just the foot traffic, the mingling—you really get to see this fantastic mosaic of what’s going on in the world of hospital medicine.”
Richard Quinn is a freelance writer in New Jersey.
Healthcare Improvement Guru Maureen Bisognano Sees Hospitalists As Agents for Change
Scan HM15’s meeting schedule, and you’ll see that two of the three keynote speakers are names most every hospitalist knows.
Peter Pronovost, MD. He’s also known as the “checklist doctor.”
Robert Wachter, MD, MHM, is as much a meeting tradition as pre-courses and networking. But in the age of generational healthcare reform that focuses on systems and processes, the plenary session between those two titans of talk shouldn’t get lost. That’s when Maureen Bisognano, president and CEO of the Institute for Healthcare Improvement (IHI), will give her presentation, “Leading Transformational Change.”
“These talks certainly are given at a 30,000-foot level and may not be directly applicable to what I’m going to do this afternoon when I’m taking care of a patient, but it sure is nice to hear what great thinkers have to say about some of these concerns, because in the big picture it really does impact clinical care in the country,” says assistant course director Melissa Mattison, MD, FACP, SFHM, of Beth Israel Deaconess Medical Center in Boston. “These are the leading thought leaders in our society, and understanding what their perspective is and what they think is happening and where we should be turning our attention is always interesting.”
HM15’s keynote addresses kick off with Dr. Pronovost’s presentation, “Taking Quality to the Next Level.” The meeting will end, as it always does, with Dr. Wachter’s address, “The Digital Doctor: Hope, Hype, and Harm at the Dawn of Medicine’s Computer Age.”
—Dr. Bisognano
In between will be the perspective of Bisognano, considered an authority on improving healthcare systems. She is an instructor of medicine at Harvard Medical School in Boston and former CEO of the now-shuttered Massachusetts Respiratory Hospital in Braintree.
She “is a very dynamic speaker, and how [much] greater a partner would SHM have than the Institute for Healthcare Improvement, given that innovation and quality improvement is the core competency of SHM,” says HM15 course director Efren Manjarrez, MD, SFHM. “To have her speak at our annual meeting is just huge.”
Bisognano is just as pleased, because she has worked with hospitalists in the past.
“It’s a critical role that they play, because they are there every single day, and they do take responsibility for those handovers,” Bisognano says. “When hospitalist medicine is at its best, we see them being...the captain of the ship and really orchestrating the care and designing it. What I see in many places that don’t have/use hospitalists is individual clinicians coming in to take care of their body part or their symptom, and the patient ends up needing to be the coordinator at a time when they’re most vulnerable.”
Bisognano travels the country frequently and has a list of four questions she always asks when she visits a hospital. First: Do you know how good you are? That gets at whether the institution has data—and whether they review said data to gauge performance.
Next: Do you know where you stand relative to the best?
“Most leaders look internally at the data, but they have no way of knowing where they stand relative to other organizations,” she says. “When they do see that gap, it’s often very provocative for them.”
Her third question is, “Do you know where your variation exists?” The idea is that even if a hospital is measuring and reviewing data—both internally and as a benchmark against comparable institutions—what good is the data if it doesn’t identify weakness?
“The last question is, “Do you know your rate of improvement over time?” And again, most people think that they’re getting better much more quickly than they actually are,” Bisognano says. “Walking them through these four questions is often a provocative assessment for them, and it does help them speed up the velocity of improvement in their organization.”
It’s a checklist that attendees may take back to their institutions, or it may just revitalize them to view things in a different way. Either way works for Bisognano, as she sees hospitalists playing a key role in healthcare reform. In particular, she’s impressed with hospitalists leading multi-disciplinary rounds where they can develop strong relationships with nursing, therapists, and others in the care continuum.
“When clinicians are running, specialists are running in and out and they’re looking at a specific piece of data. What I find is if they don’t get an answer immediately, they often order another test,” Bisognano says. “That kind of perpetual ordering of tests delays discharge, and it oftentimes doesn’t get to a diagnosis. But I think the hospitalist takes this more total view of the patient and often has the time to sit and make a decision that doesn’t involve testing repeatedly, but gets to a diagnosis more quickly.”
Richard Quinn is a freelance writer in New Jersey.
Hospitalists on the Hill Day Offers Advocacy-Minded A Voice, Opportunity

“Every [Congressional] district has a hospital in it,” says SHM Public Policy Committee Chair Ron Greeno, MD, FCCP, MHM. “Every congressman has physicians in their community, and they value the opinion of those physicians. Nothing is more effective than having one of our members meet with a representative from their home district about the issues that we care about, or the staff of a member from their home district.
“Those are the most important interactions that we have.”
Welcome to Hill Day, vintage 2015.

Dr. Greeno and Josh Boswell, SHM’s director of government relations, have been hard at work planning this year’s daylong advocacy effort, scheduled for Wednesday, April 1. In 2013, more than 150 hospitalists participated in advocacy training, 113 hospitalists visited Capitol Hill, and dozens more wanted to participate but could not be accommodated. All told, hospitalists held 409 individual meetings with legislators and staff members.
This year, early interest forecasts similar results. Good thing, too, given that last fall’s mid-term Congressional elections means there are a lot of new faces in Washington who may never have met a hospitalist.
“There was a pretty big turnover in this election,” Dr. Greeno says. “There will be a lot of people that we’ll be interacting with for the first time, educating them about hospitalists and what hospitalists are, how we can help, and what the issues are that we care about. It’s particularly important this spring to get to know those new members.”
Part of the success of Hill Day, Dr. Greeno says, is preparation. SHM’s focuses this year will be:
- Clearing up confusion surrounding the two-midnight rule. The Centers for Medicare and Medicaid Services (CMS) changed the rules in 2014 to allow physicians to admit a patient if they reasonably expect and document in the medical record that a beneficiary will need to stay in the hospital for more than two midnights. But uncertainty and confusion call for more clarity.
- Medicaid parity. In 2013, via a regulation included in the Affordable Care Act, CMS increased Medicaid payments for certain primary care services to 100% of Medicare levels through the end of 2014. Bills have been hanging around both houses of Congress to either extend the rule or pass a new one, but no decision has yet been made. SHM supports continuing the 100% level. “When hospitalists are discharging patients with Medicaid, it’s very difficult to get someone to see them in the outpatient world. That was made a lot easier by the outpatient primary care physicians knowing that they were going to get Medicare levels of payment,” Dr. Greeno says.
- Meaningful use for electronic health records (EHR) exemption for hospitalists. SHM helped get an extension passed to exempt hospitalists from penalties in 2014, but not beyond. There are existing exemptions for hospital-based physicians, but that doesn’t help hospitalists who see significant numbers of patients in observation, those who round in skilled nursing or other post-acute facilities, or those who practice in those settings full time.
“The issues that we’re advocating for are really nonpartisan issues,” Dr. Greeno says. “But getting an agreement on an exact solution is just more difficult in this highly partisan atmosphere. It requires an increased level of activity on our part if we want to be successful. Our presence in D.C. has been greater and greater every year, our message has become more clear, and our efforts have paid off.”
But a standing on Capitol Hill is just the first step.

Jairy Hunter III, MD, MBA, SFHM, associate executive medical director for case management and care transitions at the Medical University of South Carolina (MUSC) in Charleston, S.C., attended his first Hill Day in 2013. Since then, he’s been in contact with legislators and staff, sometimes formally and sometimes just running into someone at a football game.
But each time offers a chance to keep up the dialogue.
“I feel like I have a voice, and I feel like if I’m clear about what I need and I can present that in a cogent manner, I think they’ll listen to me,” says Dr. Hunter, a member of Team Hospitalist. “And hopefully along the way I can have that relationship if they need me. Or, if I need them for patient issues or for bigger issues with our university, I can be a resource for them. Frankly, it’s an opportunity to put your money where your mouth is.”
Dr. Hunter says Hill Day allows hospitalists to stop complaining and start making a difference.
“If we have the opportunity…to put ourselves in front of the people who make the decisions,” he says, “why wouldn’t we take advantage of that?”
Richard Quinn is a freelance writer in New Jersey.
“Every [Congressional] district has a hospital in it,” says SHM Public Policy Committee Chair Ron Greeno, MD, FCCP, MHM. “Every congressman has physicians in their community, and they value the opinion of those physicians. Nothing is more effective than having one of our members meet with a representative from their home district about the issues that we care about, or the staff of a member from their home district.
“Those are the most important interactions that we have.”
Welcome to Hill Day, vintage 2015.
Dr. Greeno and Josh Boswell, SHM’s director of government relations, have been hard at work planning this year’s daylong advocacy effort, scheduled for Wednesday, April 1. In 2013, more than 150 hospitalists participated in advocacy training, 113 hospitalists visited Capitol Hill, and dozens more wanted to participate but could not be accommodated. All told, hospitalists held 409 individual meetings with legislators and staff members.
This year, early interest forecasts similar results. Good thing, too, given that last fall’s mid-term Congressional elections means there are a lot of new faces in Washington who may never have met a hospitalist.
“There was a pretty big turnover in this election,” Dr. Greeno says. “There will be a lot of people that we’ll be interacting with for the first time, educating them about hospitalists and what hospitalists are, how we can help, and what the issues are that we care about. It’s particularly important this spring to get to know those new members.”
Part of the success of Hill Day, Dr. Greeno says, is preparation. SHM’s focuses this year will be:
- Clearing up confusion surrounding the two-midnight rule. The Centers for Medicare and Medicaid Services (CMS) changed the rules in 2014 to allow physicians to admit a patient if they reasonably expect and document in the medical record that a beneficiary will need to stay in the hospital for more than two midnights. But uncertainty and confusion call for more clarity.
- Medicaid parity. In 2013, via a regulation included in the Affordable Care Act, CMS increased Medicaid payments for certain primary care services to 100% of Medicare levels through the end of 2014. Bills have been hanging around both houses of Congress to either extend the rule or pass a new one, but no decision has yet been made. SHM supports continuing the 100% level. “When hospitalists are discharging patients with Medicaid, it’s very difficult to get someone to see them in the outpatient world. That was made a lot easier by the outpatient primary care physicians knowing that they were going to get Medicare levels of payment,” Dr. Greeno says.
- Meaningful use for electronic health records (EHR) exemption for hospitalists. SHM helped get an extension passed to exempt hospitalists from penalties in 2014, but not beyond. There are existing exemptions for hospital-based physicians, but that doesn’t help hospitalists who see significant numbers of patients in observation, those who round in skilled nursing or other post-acute facilities, or those who practice in those settings full time.
“The issues that we’re advocating for are really nonpartisan issues,” Dr. Greeno says. “But getting an agreement on an exact solution is just more difficult in this highly partisan atmosphere. It requires an increased level of activity on our part if we want to be successful. Our presence in D.C. has been greater and greater every year, our message has become more clear, and our efforts have paid off.”
But a standing on Capitol Hill is just the first step.
Jairy Hunter III, MD, MBA, SFHM, associate executive medical director for case management and care transitions at the Medical University of South Carolina (MUSC) in Charleston, S.C., attended his first Hill Day in 2013. Since then, he’s been in contact with legislators and staff, sometimes formally and sometimes just running into someone at a football game.
But each time offers a chance to keep up the dialogue.
“I feel like I have a voice, and I feel like if I’m clear about what I need and I can present that in a cogent manner, I think they’ll listen to me,” says Dr. Hunter, a member of Team Hospitalist. “And hopefully along the way I can have that relationship if they need me. Or, if I need them for patient issues or for bigger issues with our university, I can be a resource for them. Frankly, it’s an opportunity to put your money where your mouth is.”
Dr. Hunter says Hill Day allows hospitalists to stop complaining and start making a difference.
“If we have the opportunity…to put ourselves in front of the people who make the decisions,” he says, “why wouldn’t we take advantage of that?”
Richard Quinn is a freelance writer in New Jersey.
Key Information Sessions, Speakers, Networking Opportunities for Hospitalists Lined up at HM15

Efren Manjarrez, MD, SFHM, exudes excitement for HM15.
As the chair of SHM’s Annual Meeting Committee and course director for the four-day assembly (March 29-April 1) at the Gaylord National Resort and Convention Center in National Harbor, Md., he just can’t help but sound like a proud papa.
“There’s no greater source of information about our profession, period,” Dr. Manjarrez boasts. “This annual meeting is chock full of the best speakers, the most up-to-date information—and let’s not forget that this is just the greatest opportunity for networking that we have annually as a profession.”
This year’s meeting is on pace to draw at least 2,500 attendees, a tally that tops even the 2014 meeting in Las Vegas. Dr. Manjarrez says there’s plenty to keep a few thousand of his colleagues busy. Highlights this year will include:
- Seven pre-courses on March 29, all of which can be applied toward CME credits. A new offering this year, “Enhancing Communication Skills to Improve the Patient and Provider Experience,” aims to give participants hands-on lessons.
- A new “Young Hospitalists” educational track on March 30 features sessions on “Career Pathways in Hospital Medicine” and “Making the Most of Your Mentoring Relationships.”
- The largest Research, Innovation, and Clinical Vignette (RIV) poster competition in history, with nearly 1,300 abstracts submitted for judging.
- Plenary sessions from patient safety guru Peter Pronovost, MD, PhD, FCCM; hospital medicine pioneer Robert Wachter, MD, MHM; and Maureen Bisognano, president and CEO of the Institute for Healthcare Improvement.
With all of that to choose from, Dr. Manjarrez chatted with The Hospitalist about what he thinks of the annual meeting.
Question: How important is it to bring new people into the meeting, not just attendees, but also those who are driving and shaping the content of the meeting?
Answer: We want to make sure that we’ve got a diversity of faculty that is representative of the SHM membership. There are well-established people within SHM who have performed very well at the annual meeting. At the same time, we have to make sure that we’re opening the pipeline for new talent to come through; just as SHM rotates people in and out of the board, as well as all of the committees, it does the same thing with the annual meeting.

Q: Engaging the next generation of hospitalists seems to be a recent focus, as well as an important one. How do you view that?
A: The person who lit my fire on this was [SHM President] Eric Howell. So, as the annual meeting committee was doing its due diligence, we saw that other specialty societies like the ACP [American College of Physicians] and the American College of Emergency Physicians also had course content in the main meeting to pull in the next generation of general internists and emergency physicians. We thought that the time was right for SHM to do the exact same thing. And, of course, we were meeting our past president’s mission in doing this.
Q: How much do you enjoy the RIV competition? Why is the RIV such an important piece of the meeting?
A: The research and innovation piece allows [interaction for] every single grade of hospitalist, whether you’re an established superstar like a Sanjay Saint, or whether you’re a medical student or resident who’s just getting your feet wet and you have a passion for hospital medicine. It sort of levels the playing field, because when you have that competition and you’ve got that poster session, everybody’s on a first-name basis. That’s where you’re able to network and create more research and innovation within our field. I myself submitted three abstracts, two of which were with my learners.
Q: Congratulations on that.
A: Thanks, and I expect to take at least one learner with me to the annual meeting. To piggyback on that, we’re asking every single clinician educator coming to the meeting to bring at least one learner with you, one medical student or resident with you, to feel the passion for HM15, and hopefully to present a poster.
Q: Why do you want them to bring someone?
A: We view the society as pulling in the next generation of hospitalists, not hoping that the next generation finds us. This is our way to actively increase our membership and pull people into our great profession.
Q: How important is it to have healthcare leaders as keynote addresses, as opposed to just HM leaders?
A: Having somebody like these individuals who are at the forefront of patient safety and quality improvement, No. 1, speaking to us, but No. 2, they have the opportunity to see our passion as well when they come to our sessions, when they come to our posters, and they’re going to see that this profession is on fire. They’re going to get to see that firsthand. So I think it’s a two-way street: We get to see them, but they get to see us, and I wouldn’t discount that second point one bit.
Richard Quinn is a freelance writer in New Jersey.
Efren Manjarrez, MD, SFHM, exudes excitement for HM15.
As the chair of SHM’s Annual Meeting Committee and course director for the four-day assembly (March 29-April 1) at the Gaylord National Resort and Convention Center in National Harbor, Md., he just can’t help but sound like a proud papa.
“There’s no greater source of information about our profession, period,” Dr. Manjarrez boasts. “This annual meeting is chock full of the best speakers, the most up-to-date information—and let’s not forget that this is just the greatest opportunity for networking that we have annually as a profession.”
This year’s meeting is on pace to draw at least 2,500 attendees, a tally that tops even the 2014 meeting in Las Vegas. Dr. Manjarrez says there’s plenty to keep a few thousand of his colleagues busy. Highlights this year will include:
- Seven pre-courses on March 29, all of which can be applied toward CME credits. A new offering this year, “Enhancing Communication Skills to Improve the Patient and Provider Experience,” aims to give participants hands-on lessons.
- A new “Young Hospitalists” educational track on March 30 features sessions on “Career Pathways in Hospital Medicine” and “Making the Most of Your Mentoring Relationships.”
- The largest Research, Innovation, and Clinical Vignette (RIV) poster competition in history, with nearly 1,300 abstracts submitted for judging.
- Plenary sessions from patient safety guru Peter Pronovost, MD, PhD, FCCM; hospital medicine pioneer Robert Wachter, MD, MHM; and Maureen Bisognano, president and CEO of the Institute for Healthcare Improvement.
With all of that to choose from, Dr. Manjarrez chatted with The Hospitalist about what he thinks of the annual meeting.
Question: How important is it to bring new people into the meeting, not just attendees, but also those who are driving and shaping the content of the meeting?
Answer: We want to make sure that we’ve got a diversity of faculty that is representative of the SHM membership. There are well-established people within SHM who have performed very well at the annual meeting. At the same time, we have to make sure that we’re opening the pipeline for new talent to come through; just as SHM rotates people in and out of the board, as well as all of the committees, it does the same thing with the annual meeting.
Q: Engaging the next generation of hospitalists seems to be a recent focus, as well as an important one. How do you view that?
A: The person who lit my fire on this was [SHM President] Eric Howell. So, as the annual meeting committee was doing its due diligence, we saw that other specialty societies like the ACP [American College of Physicians] and the American College of Emergency Physicians also had course content in the main meeting to pull in the next generation of general internists and emergency physicians. We thought that the time was right for SHM to do the exact same thing. And, of course, we were meeting our past president’s mission in doing this.
Q: How much do you enjoy the RIV competition? Why is the RIV such an important piece of the meeting?
A: The research and innovation piece allows [interaction for] every single grade of hospitalist, whether you’re an established superstar like a Sanjay Saint, or whether you’re a medical student or resident who’s just getting your feet wet and you have a passion for hospital medicine. It sort of levels the playing field, because when you have that competition and you’ve got that poster session, everybody’s on a first-name basis. That’s where you’re able to network and create more research and innovation within our field. I myself submitted three abstracts, two of which were with my learners.
Q: Congratulations on that.
A: Thanks, and I expect to take at least one learner with me to the annual meeting. To piggyback on that, we’re asking every single clinician educator coming to the meeting to bring at least one learner with you, one medical student or resident with you, to feel the passion for HM15, and hopefully to present a poster.
Q: Why do you want them to bring someone?
A: We view the society as pulling in the next generation of hospitalists, not hoping that the next generation finds us. This is our way to actively increase our membership and pull people into our great profession.
Q: How important is it to have healthcare leaders as keynote addresses, as opposed to just HM leaders?
A: Having somebody like these individuals who are at the forefront of patient safety and quality improvement, No. 1, speaking to us, but No. 2, they have the opportunity to see our passion as well when they come to our sessions, when they come to our posters, and they’re going to see that this profession is on fire. They’re going to get to see that firsthand. So I think it’s a two-way street: We get to see them, but they get to see us, and I wouldn’t discount that second point one bit.
Richard Quinn is a freelance writer in New Jersey.
CLINICAL POSTER HIGHLIGHTS: Advances in Treatment of Psoriasis Vulgaris and Actinic Keratosis
CLINICAL POSTER HIGHLIGHTS: Advances in Treatment of Psoriasis Vulgaris and Actinic Keratosis
A poster review supplement to Dermatology News.
CLINICAL POSTER HIGHLIGHTS: Advances in Treatment of Psoriasis Vulgaris and Actinic Keratosis
A poster review supplement to Dermatology News.
CLINICAL POSTER HIGHLIGHTS: Advances in Treatment of Psoriasis Vulgaris and Actinic Keratosis
A poster review supplement to Dermatology News.
Pregnancy outcomes similar in kidney transplant patients, despite age
Pregnancy outcomes were similar for women who underwent kidney transplants in childhood and those who received transplants as adults, according to findings published Feb. 2 in JAMA Pediatrics.
Live births occurred in 76% of pregnancies in women who received kidney transplants as children, compared with 77% of pregnancies among women who received transplants as adults, wrote Melanie L. Wyld and her colleagues from Sydney Medical School in Australia.

The study examined a total of 101 pregnancies in 66 women who received transplants before age 18 years, and 626 pregnancies in 401 women who were adults at the time of transplant.
Mean gestational age and prematurity incidence were also similar in the two groups, with child-transplant recipients having a mean gestational age of 35 weeks, and adult-transplant recipients having a mean gestational age of 36 weeks.
Incidence of prematurity was 45% in child-transplant mothers and 53% in adult-transplant mothers, the researchers reported.
“To our knowledge, this study is the first to look at pregnancy outcomes for women who received a kidney transplant as a child,” the researchers wrote. These results should “provide comfort to such mothers and their physicians that their early onset of kidney failure and longer period of posttransplant exposure to immunosuppression do not adversely affect their pregnancy outcomes,” they added.
Read the full article at: JAMA Pediatr. 2015;169(2):e143626. (doi:10.1001/jamapediatrics.2014.3626).
Pregnancy outcomes were similar for women who underwent kidney transplants in childhood and those who received transplants as adults, according to findings published Feb. 2 in JAMA Pediatrics.
Live births occurred in 76% of pregnancies in women who received kidney transplants as children, compared with 77% of pregnancies among women who received transplants as adults, wrote Melanie L. Wyld and her colleagues from Sydney Medical School in Australia.
The study examined a total of 101 pregnancies in 66 women who received transplants before age 18 years, and 626 pregnancies in 401 women who were adults at the time of transplant.
Mean gestational age and prematurity incidence were also similar in the two groups, with child-transplant recipients having a mean gestational age of 35 weeks, and adult-transplant recipients having a mean gestational age of 36 weeks.
Incidence of prematurity was 45% in child-transplant mothers and 53% in adult-transplant mothers, the researchers reported.
“To our knowledge, this study is the first to look at pregnancy outcomes for women who received a kidney transplant as a child,” the researchers wrote. These results should “provide comfort to such mothers and their physicians that their early onset of kidney failure and longer period of posttransplant exposure to immunosuppression do not adversely affect their pregnancy outcomes,” they added.
Read the full article at: JAMA Pediatr. 2015;169(2):e143626. (doi:10.1001/jamapediatrics.2014.3626).

Outcomes still dismal in PTCL, project shows
SAN FRANCISCO—Outcomes remain dismal for the majority of patients with peripheral T-cell lymphoma (PTCL), according to a speaker at the 7th Annual T-cell Lymphoma Forum.
Massimo Federico, MD, of the Università di Modena e Reggio Emilia in Italy, presented an analysis of the first 1000 patients enrolled in the prospective T-Cell Project.
The data showed no improvements in survival for these patients compared to patients included in the retrospective International Peripheral T-Cell Lymphoma
Project.
The International Peripheral T-Cell Lymphoma Project included PTCL patients treated at various institutions between 1990 and 2002.
The T-Cell Project was designed to complement this retrospective analysis, providing prospective international data on PTCL patients.
“The main aim was to verify if a prospective collection of data would allow for more accurate information to better define prognosis of the most frequent subtypes of PTCL—PTCL not otherwise specified (NOS) and angioimmunoblastic T-cell lymphoma (AITL)—and improve our knowledge of clinical and biological characteristics and outcomes of the more uncommon subtypes of PTCL,” Dr Federico said.
He reported that, as of January 12, 2015, 73 institutions were recruiting patients for the project, and 6 institutions were active but not yet recruiting.
Of the 1308 patients registered at that point, 46% were from European countries (Italy, UK, Switzerland, Slovakia, Spain, and France), 20% were from the US, 20% were from South America (Argentina, Brazil, Chile, and Uruguay), and 14% were from the Middle East or Far East (South Korea, Hong Kong, and Israel).
Dr Federico went on to present data from the first 1000 patients registered in the project. The final analysis actually included 943 patients, as some patients withdrew consent, some did not have baseline data available, and some diagnoses could not be confirmed.
So of the 943 patients, 37% had PTCL-NOS, 17% had AITL, 15% had ALK-negative anaplastic large-cell lymphoma (ALCL), 7% had ALK-positive ALCL, 11% had natural killer/T-cell lymphoma (NKTCL), 8% had T-cell receptor γδ T-cell lymphoma, and 5% had other histologies.
The patients’ median age was 56 (range, 18-89), and 61% were male. Twenty-four percent of patients had an ECOG status greater than 1, 48% had B symptoms, and 71% had disease-related discomfort. Sixty-seven percent of patients had stage III-IV disease, 27% had nodal-only disease, 6% had bulky disease, 29% had more than 1 extranodal site, and 19% had bone marrow involvement.
The median follow-up was 41 months (range, 1-91). The 5-year overall survival (OS) was 44%, and the median OS was 39 months.
The 5-year OS was 35% for patients with PTCL-NOS, 42% for those with AITL, 45% for those with ALK-negative ALCL, 80% for those with ALK-positive ALCL, 48% for those with NKTCL (56% for nasal and 33% for extranasal), and 39% for those with T-cell receptor γδ T-cell lymphoma.
In comparison, the International Peripheral T-Cell Lymphoma Project showed a 5-year OS of 32% for patients with PTCL-NOS, 70% for patients with ALK-positive ALCL, and 49% for patients with ALK-negative ALCL (K. Savage et al. Blood 2008). The 5-year OS was 40% for patients with nasal NKTCL and 15% for those with extranasal NKTCL (W. Au et al. Blood 2008).
“[T]he outcome of PTCL continues to be dismal in the majority of cases, [with] no improvement in overall survival compared to older series,” Dr Federico summarized. “Treatment remains challenging, and new therapies are welcome.”
He added that the next steps for the T-Cell Project are to continue registration (with the goal of reaching 2000 assessable cases), extend the network to additional sites (particularly in under-represented areas such as Japan, China, India, and Oceania), and expand the collection of tissue.
“In particular, we intend to create an international tissue catalogue—including paraffin-embedded samples and, if possible, frozen ones—accessible to research groups with a solid reputation in investigating PTCLs at the molecular and translation level.” ![]()
Distribution of PTCL subtypes varies by race/ethnicity
SAN FRANCISCO—The distribution of peripheral T-cell lymphoma (PTCL) subtypes in the US varies greatly according to race and ethnicity, new research suggests.
The retrospective study showed that the overall incidence of PTCL and its subtypes is lower in American Indians and Alaskan Natives than in other ethnic groups.
And the black population has a significantly higher incidence of PTCL—and the most common subtype, PTCL-not otherwise specified (NOS)—than other populations.
Andrei Shustov, MD, of the University of Washington Medical Center in Seattle, presented these and other findings at the 7th Annual T-cell Lymphoma Forum.
The findings were derived from data collected by the Surveillance, Epidemiology, and End Results (SEER) Cancer Registries, which cover 28% of the US population. The data included patients older than 15 years of age who were treated at 18 centers from 2000 through 2011.
Of all cancer patients registered over the 12-year period, 60% were non-Hispanic whites (n=470,864,199), 17% were Hispanic whites (n=134,464,006), 12% were black (n=92,294,395), 10% were Asian/Pacific Islanders (n=74,973,831), and 1% were American Indian/Alaskan Natives (n=10,802,898).
The overall incidence of PTCL was highest in blacks—2.11 per 100,000 persons per year, compared to 1.63 in non-Hispanic whites, 1.53 in Hispanic whites, 1.46 in Asian/Pacific Islanders, and 0.97 in American Indian/Alaskan Natives.
Although American Indian/Alaskan Natives appear to have the lowest overall rate of PTCLs, some cases may have been misclassified, Dr Shustov noted.
“The data collected for ethnicity in the SEER registry are self-reported, and a lot of American Indian/Alaskan Natives misreport their ethnic background,” he said.
Subtype analyses
PTCL-NOS was the most common subtype among all the racial/ethnic groups. The highest rate of PTCL-NOS (per 100,000 persons per year) was in blacks—at 0.77, compared to 0.47 in non-Hispanic whites, 0.46 in Hispanic whites, 0.45 in Asian/Pacific Islanders, and 0.28 in American Indian/Alaskan Natives.
The proportion of PTCL-NOS cases was 29.5% in non-Hispanic whites, 35.7% in blacks, 29.8% in Asian/Pacific Islanders, 27% in Hispanic whites, and 23.1% in American Indian/Alaskan Natives.
The proportion of angioimmunoblastic T-cell lymphoma cases was 9.9% in non-Hispanic whites, 5.2% in blacks, 15.3% in Asian/Pacific Islanders, 9.9% in Hispanic whites, and 2.6% in American Indian/Alaskan Natives.
The proportion of anaplastic large-cell lymphoma cases was 17.6% in non-Hispanic whites, 17.3% in blacks, 12.4% in Asian/Pacific Islanders, 21.2% in Hispanic whites, and 28.2% in American Indian/Alaskan Natives.
And the proportion of NK/T-cell lymphoma cases was 3.4% in non-Hispanic whites, 2.0% in blacks, 13.9% in Asian/Pacific Islanders, 14.6% in Hispanic whites, and 14.1% in American Indian/Alaskan Natives.
“That data indicates that, given the overall incidence of T-cell lymphoma in Natives is lower than in whites, if you’re a Native American/Alaskan Native [with] T-cell lymphoma, you’re 4 times more likely to have nasal NK-cell lymphoma than non-Hispanic whites,” Dr Shustov said.
He then showed a pairwise comparison of the percentage of PTCL subtypes. All of the racial/ethnic groups were significantly different from one another (P<0.001), except when Hispanic whites were compared to American Indian/Alaskan Natives (P=0.14).
Dr Shustov said this might be explained by the fact that these two groups have similar genetic backgrounds. ![]()
Prepackaged toddler foods often contain too much salt and sugar
Need another reason to make your toddler dinner instead of feeding him a prepackaged meal? New research shows a large number of dinners, snacks, and desserts sold in the United States that are designed for toddlers contain added sugar and salt, leaving them at risk for developing hypertension and diabetes later on in life.
Fortunately, commercial foods made for infants (vegetables, dinners, plain fruit without grains, dry cereals) sold in the United States tend to have little sugar and sodium added. But parents should still try to limit salty snacks, sweet desserts, and juice drinks, because they often contain more salt and sugar than kids need.
Approximately 79% of U.S. children aged 1-3 years eat more sodium than is recommended by the Institute of Medicine, noted Mary E. Cogswell, DrPH, a researcher from the Centers for Disease Control and Prevention in a study published in Pediatrics.
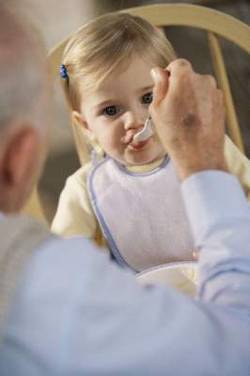
Dr. Cogswell and her team of researchers looked at package information for 1,074 food products sold in the United States in 2012 that was marketed to infants, toddlers, or both.
Seventy-two percent of toddler dinners examined contained added sodium, and 32% percent of toddler dinners contained added sugar; 52% of ready-to-serve mixed grains and fruits contained too much added sugar. The majority of dairy-based desserts (70%) and fruit juices (88%) intended for both infant and toddler consumption also contained added sugar.
Limiting how much sugar and salt your children are exposed to can go a long way in preventing obesity and high blood pressure, so parents should look carefully at labels when selecting what foods to buy for toddlers.
“Key advice for parents includes limiting juice and avoiding sugar-sweetened beverages and energy-dense, nutrient-poor snacks; if purchasing commercial toddler foods, the labels should be checked for sodium and added sugar,” the authors wrote.
Need another reason to make your toddler dinner instead of feeding him a prepackaged meal? New research shows a large number of dinners, snacks, and desserts sold in the United States that are designed for toddlers contain added sugar and salt, leaving them at risk for developing hypertension and diabetes later on in life.
Fortunately, commercial foods made for infants (vegetables, dinners, plain fruit without grains, dry cereals) sold in the United States tend to have little sugar and sodium added. But parents should still try to limit salty snacks, sweet desserts, and juice drinks, because they often contain more salt and sugar than kids need.
Approximately 79% of U.S. children aged 1-3 years eat more sodium than is recommended by the Institute of Medicine, noted Mary E. Cogswell, DrPH, a researcher from the Centers for Disease Control and Prevention in a study published in Pediatrics.
Dr. Cogswell and her team of researchers looked at package information for 1,074 food products sold in the United States in 2012 that was marketed to infants, toddlers, or both.
Seventy-two percent of toddler dinners examined contained added sodium, and 32% percent of toddler dinners contained added sugar; 52% of ready-to-serve mixed grains and fruits contained too much added sugar. The majority of dairy-based desserts (70%) and fruit juices (88%) intended for both infant and toddler consumption also contained added sugar.
Limiting how much sugar and salt your children are exposed to can go a long way in preventing obesity and high blood pressure, so parents should look carefully at labels when selecting what foods to buy for toddlers.
“Key advice for parents includes limiting juice and avoiding sugar-sweetened beverages and energy-dense, nutrient-poor snacks; if purchasing commercial toddler foods, the labels should be checked for sodium and added sugar,” the authors wrote.
