User login
Society of Hospital Medicine Connects Physicians in Training with Specialty
SHM is introducing the Student Hospitalist Scholar Grant, an award of $500 a week for the summer to cover salary support for a student project related to patient safety/quality improvement or other areas relevant to the field of hospital medicine.
For medical students, residents, and physicians early in their careers, there has never been a better time to explore a career as a hospitalist. For details, check out SHM’s new website for physicians in training.
The demand for hospitalists continues to be high across the country, and job opportunities abound. SHM is helping to connect physicians in training with the fastest-growing medical specialty in healthcare. Here’s how:
- Local events nationwide. Together with the leading medical schools in the country and its local chapters, SHM is organizing events to introduce hospital medicine to medical students and residents. Scheduled locations in 2015 include Philadelphia, Chicago, and Los Angeles, and the list will be updated throughout the year. Events in 2014 were made possible by TeamHealth, Sound Physicians, and Cogent Healthcare.
- Special tracks at HM15. For the first time, SHM’s annual meeting includes an entire track dedicated to the topics that matter the most to young physicians and physicians-to-be, including working with mentors effectively, optimizing quality improvement, and making the most of your CV.
- Student Hospitalist Scholar Grant. SHM is introducing the Student Hospitalist Scholar Grant, an award of $500 a week for the summer to cover salary support for a student project related to patient safety/quality improvement or other areas relevant to the field of hospital medicine. The project should be conducted during the summer between the first/second years (or second/third, if possible) of medical school. The deadline for applications is Feb. 15.
Leaders in Hospital Medicine, Quality Improvement, Clinical Care to Attend HM15
Last year was a banner year for the hospital medicine movement: Hospitalist Vivek Murthy, MD, was confirmed as the U.S. Surgeon General, hospitalists across the country were recognized for their leadership of quality improvement, and a record number of hospitalists came together in Las Vegas to share successes, challenges, and knowledge at HM14, SHM’s annual conference.

This year, you can be part of the action from the very beginning. Hospital Medicine 2015 (HM15) will feature the nation’s leaders in hospital medicine, quality improvement, and clinical care.
In addition to the specialty’s leading content and experts, hospitalists flock to HM15 for the energy. The connections made—both personal and professional—empower thousands of hospitalists to bring a new enthusiasm to their hospitals and their colleagues.
Register today at www.hospitalmedicine2015.org.
Last year was a banner year for the hospital medicine movement: Hospitalist Vivek Murthy, MD, was confirmed as the U.S. Surgeon General, hospitalists across the country were recognized for their leadership of quality improvement, and a record number of hospitalists came together in Las Vegas to share successes, challenges, and knowledge at HM14, SHM’s annual conference.
This year, you can be part of the action from the very beginning. Hospital Medicine 2015 (HM15) will feature the nation’s leaders in hospital medicine, quality improvement, and clinical care.
In addition to the specialty’s leading content and experts, hospitalists flock to HM15 for the energy. The connections made—both personal and professional—empower thousands of hospitalists to bring a new enthusiasm to their hospitals and their colleagues.
Register today at www.hospitalmedicine2015.org.
Society of Hospital Medicine Offers Quality Improvement Tools for Hospitals
Whether you excel in the hospital room, the conference room, or the classroom, SHM’s quality improvement initiatives offer new tools featuring expertise from leaders in healthcare:
- Project BOOST: SHM is moving Project BOOST from an annual registration model to a rolling program, enabling hospitalists to get involved at any time of the year. As hospitals get serious about reducing readmissions and improving discharge processes, Project BOOST is a great way for hospitalists to take charge.
- Pain management and glycemic control programs: Almost every hospitalist encounters patients dealing with pain or glycemic control issues. In March, new toolkits will be available that help hospitalists lead efforts to improve the care of these patients.
- Post-Acute Care Toolbox: Managing the transition from an acute care hospital to an inpatient rehabilitation facility, long-term acute care hospital, or skilled nursing facility can be difficult. SHM’s new Post-Acute Care Toolbox enables hospitalists to go forth with confidence.
To download and share SHM’s quality improvement tools, visit www.hospitalmedicine.org/qi.
HM15 At Hand Mobile App Helps Hospitalists Plan for Annual Meeting
Hospitalists are a mobile bunch. Many were early adopters of smartphones and tablet technology. That’s why SHM is once again offering an interactive conference experience at its annual meeting. “HM15 at Hand,” the conference app for HM15, offers an interactive agenda, presentation materials, exhibitor information, maps, and more.
Be among the first to know when and where to access HM15 At Hand. Visit hm15athand to receive an email alert when the app launches on Feb. 26.
Reimbursement of Advance Care Planning by Medicare Has Support of Hospitalists
On Oct. 31, 2014, the Centers for Medicare and Medicaid Services (CMS) published the 2015 Medicare Physician Fee Schedule (MPFS) Proposed Rule. Included in the rule was an interesting discussion about the potential for Medicare to begin paying for advance care planning services.
CMS describes these services as “the explanation and discussion of advance directives, such as standard forms [with completion of such forms, when performed], by the physician or other qualified healthcare professional; face-to-face with the patient, family member[s], and/or surrogate.”
To enable billing for these services, CMS suggested the use of two new AMA-created CPT codes (99497 and 99498), which allow providers to be reimbursed for their consultation in end-of-life care conversations and also encourage the conversations to occur prior to their being clinically necessary. The codes are designed to cover substantive discussions about goals of care, treatment options, values, and preferences when it comes to end-of-life care planning.
This development was welcome news for many hospitalists who, too often, are called upon to participate in end-of-life care conversations that are long overdue. Hospitalists know these conversations help to ensure that patient wishes are respected at the end of life and also prevent the use of unwanted treatments or interventions.
In the best scenario, not only will Medicare payment for these codes encourage physicians to start these conversations prior to a stressful inpatient stay, but reimbursement also allows hospitalists and other relevant specialists to provide patients with the proper time, space, and expertise these important conversations require.
Disappointingly, CMS did not agree to start reimbursing the advance care planning codes for 2015; however, they did signal openness to the idea of reimbursing them in the future, leaving this aspect of an otherwise final rule open for further comment.
For its part, SHM responded with follow-up comments that both express disappointment with the CMS decision and further elaborate on the value of these codes for both hospitalists and patients.
Moving forward, hospitalists can be assured this is not a one-off issue for SHM.
For well over a year, SHM’s Public Policy Committee has been actively supporting legislation introduced by Rep. Earl Blumenauer (D-Ore.). The Personalize Your Care Act (H.R. 1173), similar to the CMS proposal, would establish Medicare reimbursement for voluntary advance care planning consultations, along with other beneficial treatment of advance care plans.
Nearly 200 members of SHM’s Grassroots Network have supported these efforts by sending letters to their own representatives in favor of Rep. Blumenauer’s bill. Moving into the new year and the 114th Congress, continued pressure will be placed on CMS, and plans are in motion to continue SHM support for a reintroduced Personalize Your Care Act.
Hospitalists wishing to assist in these efforts need only join SHM’s Grassroots Network and keep their eyes open for opportunities to help—they will be forthcoming.
To get involved today, visit www.hospitalmedicine.org/advocacy.
Josh Boswell is SHM’s director of government relations.
How Hospitalist Groups Make Time for Leadership
Negotiating salaries. Improving patient flow. Increasing patient satisfaction. Reducing readmissions. Championing quality improvement efforts. Planning strategically. Handling schedule issues. Dealing with coverage issues. Working on Ebola preparation. Being on call 24 hours a day for an urgent concern from hospital administration or a hospitalist.
Hospitalist group leaders often feel they are pulled in multiple directions all at once and find that a day off really is not a day off. Leaders often are asked to take on additional responsibilities and might wonder whether they are given sufficient protected time. Leaders of larger HM groups might ask whether adding an associate chief would help cover the administrative workload. Or they may be asking whether hospitalist group leaders should receive a premium in salary, above that of other hospitalists in the group.
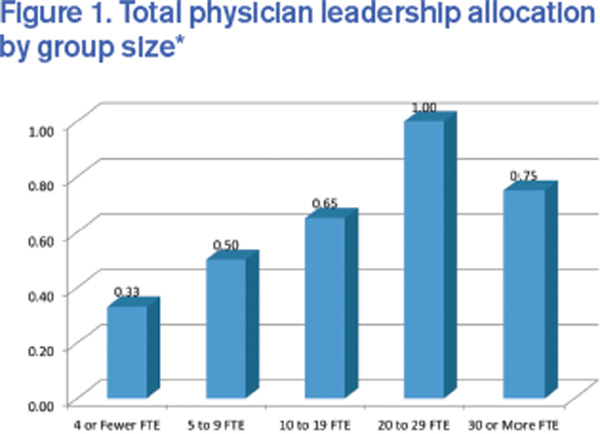
These are questions the State of Hospital Medicine Report (SOHM) attempts to answer. Although there is significant variation that is dependent on many factors (i.e., group size, academic status, and whether or not the practice is part of a larger multi-site group), the 2014 SOHM found that the median total full-time equivalent (FTE) allocation for physician administration/leadership for HMGs serving adults was just 0.60. The highest-ranking physician leader most commonly had 0.25 to 0.35 FTE protected for administrative responsibilities. And the median compensation premium for group leaders was 15%.
One leadership challenge is that administrative work never stops. Group leaders often find themselves having to come in for meetings before or after night shifts. Leaders sometimes feel that the 0.30 FTE allocated for administrative responsibilities actually requires the workload of a full-time position. Yet, like other hospitalists, leaders typically work a significant number of consecutive clinical shifts to ensure continuity of care for patients, which can make juggling administrative work challenging.
Additionally, group leaders often carry a significant clinical workload. (Read about Team Hospitalist’s newest member and her split leadership-clinical roles) I would argue that this is a good thing, important for many reasons, including maintaining clinical skills, understanding the nature of work and challenges on the front lines, and being able to facilitate quality improvement efforts. Further, group leaders often are perceived to be team players by other hospitalists when they work a wide variety of shifts on all days of the week. Many programs face staffing challenges, and leaders might work extra shifts when other hospitalists are unable to fill them.
Certainly group leaders face significant challenges, but the position also comes with many rewards. Satisfaction comes from improving the program for all hospitalists in a group, from gains in hospital efficiency or flow, from systems improvements to ensure patient safety or improve patient outcomes, and from being respected by hospital administration as well as other hospitalists in the group. With a good understanding of hospital finances and patient flow, some hospitalist group leaders advance to other roles in hospital administration, such as CMO or CEO.
Although there may be no one-size-fits-all answer for the right amount of protected time or salary for group leaders, leaders clearly play a challenging but essential role in bringing value to both hospitals and hospitalist groups.
For more data from the 2014 State of Hospital Medicine Report, visit www.hospitalmedicine.org/survey.

Dr. Huang is associate chief of the division of hospital medicine and associate clinical professor at the University of California San Diego. He is a member of SHM’s Practice Analysis Committee.
Negotiating salaries. Improving patient flow. Increasing patient satisfaction. Reducing readmissions. Championing quality improvement efforts. Planning strategically. Handling schedule issues. Dealing with coverage issues. Working on Ebola preparation. Being on call 24 hours a day for an urgent concern from hospital administration or a hospitalist.
Hospitalist group leaders often feel they are pulled in multiple directions all at once and find that a day off really is not a day off. Leaders often are asked to take on additional responsibilities and might wonder whether they are given sufficient protected time. Leaders of larger HM groups might ask whether adding an associate chief would help cover the administrative workload. Or they may be asking whether hospitalist group leaders should receive a premium in salary, above that of other hospitalists in the group.
These are questions the State of Hospital Medicine Report (SOHM) attempts to answer. Although there is significant variation that is dependent on many factors (i.e., group size, academic status, and whether or not the practice is part of a larger multi-site group), the 2014 SOHM found that the median total full-time equivalent (FTE) allocation for physician administration/leadership for HMGs serving adults was just 0.60. The highest-ranking physician leader most commonly had 0.25 to 0.35 FTE protected for administrative responsibilities. And the median compensation premium for group leaders was 15%.
One leadership challenge is that administrative work never stops. Group leaders often find themselves having to come in for meetings before or after night shifts. Leaders sometimes feel that the 0.30 FTE allocated for administrative responsibilities actually requires the workload of a full-time position. Yet, like other hospitalists, leaders typically work a significant number of consecutive clinical shifts to ensure continuity of care for patients, which can make juggling administrative work challenging.
Additionally, group leaders often carry a significant clinical workload. (Read about Team Hospitalist’s newest member and her split leadership-clinical roles) I would argue that this is a good thing, important for many reasons, including maintaining clinical skills, understanding the nature of work and challenges on the front lines, and being able to facilitate quality improvement efforts. Further, group leaders often are perceived to be team players by other hospitalists when they work a wide variety of shifts on all days of the week. Many programs face staffing challenges, and leaders might work extra shifts when other hospitalists are unable to fill them.
Certainly group leaders face significant challenges, but the position also comes with many rewards. Satisfaction comes from improving the program for all hospitalists in a group, from gains in hospital efficiency or flow, from systems improvements to ensure patient safety or improve patient outcomes, and from being respected by hospital administration as well as other hospitalists in the group. With a good understanding of hospital finances and patient flow, some hospitalist group leaders advance to other roles in hospital administration, such as CMO or CEO.
Although there may be no one-size-fits-all answer for the right amount of protected time or salary for group leaders, leaders clearly play a challenging but essential role in bringing value to both hospitals and hospitalist groups.
For more data from the 2014 State of Hospital Medicine Report, visit www.hospitalmedicine.org/survey.
Dr. Huang is associate chief of the division of hospital medicine and associate clinical professor at the University of California San Diego. He is a member of SHM’s Practice Analysis Committee.
Continuing Medical Education Opportunities at SHM Learning Portal, Leadership and Educators' Academy

- SHM Learning Portal: Members can sharpen their skills and earn CME from the comfort of their own homes, using devices of their choosing to access SHM’s CME-accredited Learning Portal for a variety of systems and conditions that hospitalists deal with every day.
- Educating on quality: Focusing on teaching quality improvement in 2015? There is still time to register for SHM’s Quality and Safety Educators Academy in May. At QSEA, hospitalist educators will learn the leading tools and techniques for empowering the next generation of hospitalists to make care delivery better.
- Coding: There’s no such thing as the perfect approach to coding, but CODE-H, SHM’s online educational tool for optimizing coding, is a great way to get your hospitalists trained on the best approaches, gleaned from the experts in the field. The first webinars begin this month.
- Focused Practice in Hospital Medicine: Plan now to take the Focused Practice in Hospital Medicine exam this year. Later this month, the American Board of Internal Medicine (ABIM) will issue online applications for its Fall 2015 program.
- Leadership Academy: In 2014, SHM’s Leadership Academy was booked to capacity, so now is the time to enroll for 2015. Leadership Academy provides hospitalists with all the leadership, management, and financial skills skipped in medical school.
Impact of Peri-Operative Beta Blockers on Cardiovascular Morbidity, Mortality
Clinical question: What is the impact of peri-operative beta blockers on cardiovascular morbidity and mortality in patients undergoing surgery under general anesthesia?
Background: Studies evaluating the effects of peri-operative beta blockers on cardiovascular outcomes have yielded conflicting results.
Study design: Systematic review.
Setting: Varied.
Synopsis: This review included 89 randomized controlled trials (RCTs) of peri-operative beta blocker administration for patients undergoing surgery under general anesthesia. For noncardiac surgery (36 trials), beta blockers were associated with an increase in all-cause mortality (RR 1.24, 95% CI 0.99 to 1.54) and cerebrovascular events (RR 1.59, 95% CI 0.93 to 2.71). Beta blockers significantly increased the occurrence of hypotension (RR 1.50, 95% CI 1.38 to 1.64) and bradycardia (RR 2.24, 95% CI 1.49 to 3.35). In noncardiac surgery, beta blockers significantly reduced occurrence of acute myocardial infarction (AMI) (RR 0.73, 95% CI 0.61 to 0.87), myocardial ischemia (RR 0.43, 95% CI 0.27 to 0.70), and supraventricular arrhythmias (RR 0.72, 95% CI 0.56 to 0.92). No effect was found on ventricular arrhythmias, congestive heart failure, or length of hospital stay.
For cardiac surgery (53 trials), peri-operative beta blockers were associated with a significant reduction in ventricular arrhythmias (RR 0.37, 95% CI 0.24 to 0.58), supraventricular arrhythmias (RR 0.44, 95% CI 0.36 to 0.53), and length of hospital stay (by 0.54 days, 95% CI -0.90 to -0.19). No effect was found on all-cause mortality, AMI, myocardial ischemia, cerebrovascular events, hypotension, bradycardia, or congestive heart failure.
These results do not provide sufficient evidence to change recommendations from current ACC/AHA guidelines for peri-operative beta blocker administration.
Bottom line: For noncardiac surgeries, beta blockers might increase all-cause mortality and stroke while reducing supraventricular arrhythmias and acute myocardial infarctions. Because much of the evidence is from low- to moderate-quality trials, there is not sufficient evidence to modify current recommendations regarding the use of peri-operative beta blockers.
Resident Handoff Program Associated with Improved Inpatient Outcomes
Clinical question: Does the implementation of a handoff program lead to improved patient safety?
Background: Communication failure at the time of handoff of patient care from one resident to another is a significant cause of medical errors. Programs to improve the quality of handoffs have been created to reduce such errors, but few have been rigorously evaluated.
Study design: Prospective cohort study.
Setting: Inpatient units at nine pediatric residency programs in the United States and Canada.
Synopsis: The study team evaluated the impact of the I-PASS Handoff Bundle (illness severity, patient summary, action items, situation awareness and contingency planning, and synthesis by receiver) from January 2011 through May 2013. Compared with the pre-intervention period, there was a 23% reduction in medical errors in the post-intervention period (24.5 vs. 18.8 per 100 admissions; P<0.001), a 30% reduction in preventable adverse events (4.7 vs. 3.3 events per 100 admissions; P<0.001), and a significant increase in the inclusion of all key elements of handoff communication. There were no significant changes in duration of handoffs or resident workflow.
Given the emphasis placed on teaching reliable communication to trainees, many residency programs are developing curricula on proper handoff practices. Although the pre-post nature of this study prevents a causal relationship from being established, the outcomes provide evidence in support of this particular handoff improvement program.
Bottom line: The I-PASS Handoff Bundle might reduce preventable adverse events and medical errors without significant impact on handoff duration or resident workflow.
Automated Early Warning, Response System Could Improve Sepsis Outcomes
Clinical question: Does implementation of an electronic sepsis detection and response system improve patient outcomes?
Background: It is known that interventions such as goal-directed resuscitation and antibiotics can reduce sepsis mortality, but their effectiveness depends on early administration. This fact has increased interest in developing an effective, automated system to improve the timeliness of sepsis detection.
Study design: Pre-implementation/post-implementation with multivariable analysis.
Setting: Urban, academic, multi-hospital healthcare system.
Synopsis: Using the electronic health record (EHR) at the University of Pennsylvania Health System, an automated early warning and response system (EWRS) was developed and implemented to detect patients at risk of clinical deterioration and progression to severe sepsis. The EWRS monitored vital signs and key laboratory results in real time.
Multivariable analysis compared a pre-implementation cohort of adult non-ICU acute care patients admitted from June 6, 2012, to September 4, 2012, to a post-implementation cohort of patients admitted from June 6, 2013, to September 4, 2013.
Hospital and ICU length of stay were similar in both cohorts, and no difference was seen in the proportion of patients transferred to the ICU following the alert; however, transfer to the ICU within six hours became statistically significant after adjustment. All mortality measures were lower in the post-implementation period, but none reached statistical significance. Discharge to home and sepsis documentation were statistically higher in the post-implementation period, but discharge to home lost statistical significance after adjustment.
Although these data are encouraging, the findings are limited, because none of the mortality measures reached statistical significance. Further studies are required before large-scale implementation of such a system can be considered.
Bottom line: An automated prediction tool identified at-risk patients and prompted bedside evaluation resulting in more timely sepsis care, improved documentation, and a trend toward reduced mortality.