User login
Platelet transfusions ineffective for TBI
![]()
Platelet transfusions may not be appropriate treatment for patients with traumatic brain injury (TBI), new research suggests.
More than 1.7 million people in the US suffer a TBI every year, and as many as half of them experience progression of bleeding inside or around the brain, which is associated with an increased risk of death.
Platelet transfusions and desmopressin (DDAVP) are commonly used to prevent bleeding—and therefore death—in these patients.
But a new study published in the Journal of Neurotrauma suggests neither treatment is effective.
“Previous studies of platelet transfusion have looked only at mortality, and few studies have addressed the effect of DDAVP on bleeding in patients with TBI,” said study author Dennis Yong Kim, MD, of LA BioMed in Los Angeles, California.
“Our study found that the administration of platelets and DDAVP is no more effective in preventing progression of hemorrhage or death than was the use of none of these medications, irrespective of whether or not patients were on antiplatelet medications, such as aspirin, prior to their TBI.”
“Given the limited availability and potential for complications associated with transfusion of blood products like platelets, we believe that physicians should take a step back and re-think the necessity and efficacy of such treatments in patients with TBI.”
Dr Kim and his colleagues conducted a 3-year retrospective study of patients admitted to a Level 1 trauma center with TBI between January 1, 2010, and December 31, 2012. Of 408 patients, 126 received platelet transfusions and DDAVP, and 282 did not.
Overall, 37% of the patients demonstrated progression of traumatic intracranial hemorrhage within 4 hours of admission.
The researchers compared outcomes for the patients who received platelet transfusions and DDAVP to patients who did not receive the therapies.
A univariate analysis showed no difference in the incidence of hemorrhage progression, which occurred in 43.7% of patients who received transfusions and DDAVP and 34.2% of patients who received neither treatment (P=0.07).
And multivariate analyses showed that platelet transfusions and DDAVP were not associated with a decreased risk of hemorrhage progression (odds ratio=1.40, P=0.2) or mortality (odds ratio=1.50, P=0.4). ![]()
NICE gives conditional support for eculizumab
Credit: Globovision
The UK’s National Institute for Health and Care Excellence (NICE) has issued a final guidance recommending eculizumab (Soliris) as a treatment for atypical hemolytic uremic syndrome (aHUS), but only if certain conditions are met.
The guidance is the first to be produced as part of NICE’s highly specialized technologies program to evaluate treatments for very rare conditions.
aHUS affects around 200 people in England, with 20 to 30 new patients diagnosed with the condition each year.
The condition causes inflammation of blood vessels and thrombus formation throughout the body. So aHUS patients are at constant risk of sudden and progressive damage to, and failure of, vital organs.
“aHUS is a very distressing condition that imposes a significant burden both on those with the condition and their carers and families,” said NICE Chief Executive Sir Andrew Dillon.
“[A committee advising NICE] accepted that eculizumab is a step change in the management of aHUS and can be considered a significant innovation for a disease with a high unmet clinical need. It offers people with aHUS the possibility of avoiding end-stage renal failure, dialysis, and kidney transplantation, as well as other organ damage.”
“The drug is, however, very expensive. The committee felt that the budget impact of eculizumab would be lower if the potential for adjusting the dose of the drug and stopping treatment was explored. This is reflected in the guidance, which recommends eculizumab should be funded only if important conditions are met, including the development of rules for starting and stopping treatment for clinical reasons. In the meantime, NHS England and the company should consider what opportunities might exist to reduce the cost of eculizumab to the NHS.”
The conditions for funding eculizumab are as follows:
- Use of the drug must be coordinated through an expert center.
- Monitoring systems must record the number of people with aHUS, the number who receive eculizumab, and the dose and duration of treatment.
- A national protocol must be developed for starting and stopping eculizumab for clinical reasons.
- A research program is needed with robust methods to evaluate when stopping treatment or dose adjustment might occur.
Eculizumab usage and costs
Eculizumab is given intravenously in adults as initial treatment at a dose of 900 mg for 4 weeks, then as maintenance treatment at a dose of 1200 mg on week 5 and then every 12 to 16 days.
The summary of product characteristics for eculizumab states that “treatment is recommended to continue for a patient’s lifetime, unless discontinuation of treatment is clinically indicated.” Eculizumab costs £3150 per 30 mL vial (excluding tax).
The net budget impact of eculizumab is confidential. However, NICE has prepared an illustration of the possible budget impact of eculizumab for aHUS, using information that is available in the public domain.
This is based on a treatment cost of £340,200 per adult patient in the first year (based on the acquisition cost of the drug and the recommended dosing for an adult) and assumes a patient cohort of 170, as estimated by NHS England.
If it is assumed that all of these adults with aHUS are treated with eculizumab, the budget impact for the first year would be £57.8 million.
If an additional 20 new patients are treated the following year (based on a worldwide incidence of 0.4 per million), the budget impact will rise to £62.5 million in year 2, assuming all new patients are treated and all existing patients continue to be treated at the maintenance cost of £327,600 per year.
Using the same assumptions, the budget impact will rise to £69 million in year 3 (190 existing and 20 new patients), £75 million in year 4 (210 existing and 20 new patients), and £82 million in year 5 (230 existing and 20 new patients).
NHS England has indicated that the amount of the budget allocated for highly specialized services in 2013/14 was £544 million, and the money spent on high-cost drugs was £156 million.
The committee acknowledged that the estimate of the incremental cost of eculizumab made by Alexion Pharmaceuticals (the company developing eculizumab) compared with standard care was considerable. And incremental costs estimated by the evidence review group were higher still (although results are confidential).
Alexion estimated that eculizumab produced 25.22 additional quality-adjusted life-years (QALYs) per patient compared with standard care. Although the QALYs estimated in the evidence review group’s analysis were markedly lower than those calculated by the company, the advisory committee said both analyses produced substantial QALY gains of a magnitude that is rarely seen for any new drug.
For more information, see the guidance on the NICE website. ![]()
Thiamine Prescribing Practices
Thiamine pyrophosphate, the biologically active form of thiamine (vitamin B1), is an essential cofactor for the aerobic breakdown of glucose, with daily requirements related to total caloric intake and the proportion of calories provided as carbohydrates. Patients presenting to the hospital are at risk of thiamine deficiency due to a preponderance of factors including baseline poor nutritional status,[1, 2, 3] diminished intake (associated with illness prodrome), increased metabolic demand (eg, occurring with sepsis, malignancy, surgery, pregnancy), and resuscitation with intravenous glucose‐containing fluids. Without thiamine pyrophosphate, glucose is metabolized through less‐efficient anaerobic pathways, producing lactic acid as a by‐product. The brain uses glucose as its main source of energy and is susceptible to injury due to acute thiamine deficiency. Petechial hemorrhage and demyelination within periventricular structures (thalami, mammillary bodies, ocular motor nuclei, and cerebellar vermis) account for the classical triad of Wernicke's encephalopathy (WE), including confusion/encephalopathy, ophthalmoplegia, and ataxia.[4, 5, 6, 7] Additional symptoms and signs are reported in WE, implicating more widespread consequences of thiamine deficiency.[6, 7, 8, 9]
Wernicke's encephalopathy remains an historically well‐documented illness,[4, 5] of continued relevance to hospitalist practice. Pathologic changes diagnostic of WE are reported in 1.9% to 2.8% of all patients at autopsy,[6, 10] and in as many as 20% of hospitalized patients following unexplained death.[11, 12] In cases of alcohol‐related death, the incidence may be as high as 59%.[13] Most troubling is the observation that the diagnosis is frequently missed in clinical settings,[14, 15, 16, 17, 18, 19] with devastating results. Case series report mortality in upward of 20% of patients with untreated or undertreated WE, with 85% of survivors developing Korsakoff syndromethe chronic form of WE.[8, 20, 21] The clinical diagnosis may be missed in as many as 94% of nonalcoholic patients, including patients admitted to surgical (ie, postgastrointestinal surgery), obstetrical (ie, hyperemesis gravidarum), psychiatric (ie, eating disorders), general internal medicine (ie, cancer‐associated cachexia and related complications), and subspecialty services (ie, dialysis and renal diseases).[15]
Recognition of WE is critical, as effective intervention and treatment is possible. For hospitalized patients, intervention should prioritize parenteral administration of thiamine[22, 23] to circumvent problems with oral absorption common in the medically ill, and to maximize serum thiamine concentrations, promoting passive (concentration‐dependent) movement of thiamine across the blood brain barrier. In lieu of evidence from randomized controlled trials supporting specific doses and schedules for thiamine administration,[24, 25] this recommendation relies on ample experiential evidence emphasizing the importance of higher doses of parenteral thiamine (in excess of 200 mg provided 3 times daily) for the prevention/treatment of WE.[12, 15, 20, 26, 27]
It remains to be determined whether the evidence emphasizing parenteral prescribing has affected current practice within inpatient populations. To address this need, we sought to quantify thiamine‐prescribing practices within Canadian university‐affiliated hospitals across a 2‐year period. We hypothesized that thiamine would be prescribed more frequently via the parenteral route, in line with published guidelines promoting parenteral administration of thiamine.[15, 20]
METHODS
Study Design and Recruitment
A retrospective observational study was used to evaluate thiamine prescribing within Canadian academic hospitals between January 2010 and December 2011. University‐affiliated institutions with English‐speaking postgraduate (ie, residency) adult medicine programs were eligible to participate. Participating centers all utilized computerized pharmacy information systems, allowing anonymized retrospective data to be reported for participants. Study objectives, methods, and procedures were approved by institutional research ethics boards at participating centers.
Data were extracted for the study period from computerized pharmacy information systems recording prescriptions processed by centralized hospital pharmacies. Thiamine prescribed as part of total parenteral nutrition was excluded from analysis, as prescribing was automated in most centers. Participants were assigned a randomized study number linked to prescription information specifying the prescribed dose of thiamine, route of administration (oral: per os, nasogastric tube, orogastric tube, gastric tube; versus parenteral: intravenous, intramuscular), frequency of dosing (eg, daily, twice daily, 3 times daily), and start/end dates. Complete data were available from 12 hospitals (12/14, 85.7%). One hospital was missing data concerning the frequency of prescribing. One hospital provided only summary data, specifying the number of prescriptions issued by route and dose. Information concerning the prescribing service was captured within records from 7 hospitals (7/14, 50.0%), allowing prescriptions to be stratified by prescribing services. Subspecialty designations were simplified to emergency department, intensive care unit (ICU) (including medical, surgical, and trauma ICUs), medical subspecialty (ie, cardiology, endocrinology, gastroenterology, medical oncology, rheumatology), general internal medicine, neurology, psychiatry, and surgical (ie, general surgery, cardiac surgery, neurosurgery, orthopedics, gynecology) services.
Statistical Analysis
Prescriptions for thiamine were summarized across each center specifying the route of administration (all prescriptions and initial prescription). Prescribing behaviors across centers were summarized using descriptive statistics. Differences in parenteral versus oral prescribing were evaluated using the z test for the difference between weighted averages, assuming a null hypothesis of equal prescribing (ie, 50% parenteral and 50% oral) within categories (i.e., all prescriptions, initial prescriptions, total doses).
Factors that may affect rates of parenteral prescribing were considered across centers. Hospitals were stratified based upon the presence of protocols promoting parenteral thiamine prescribing for the treatment of patients at risk of deficiency. The effect of protocols on prescribing behaviors was evaluated by comparing prescribing practices in centers with and without protocols using the z test for the difference between proportions. Forward linear regression was used to evaluate the correlation between the number of prescriptions and/or doses prescribed within centers, and the rates of parenteral prescribing. Rates of parenteral prescribing across hospital services were compared using pairwise comparisons.
Statistical analyses were completed using IBM SPSS Statistics 20 (IBM Corp., Armonk, NY). Significance was defined as P<0.05, using P values corrected for the total number of comparisons (Bonferroni correction), equivalent to a single‐comparison P value<0.001.
RESULTS
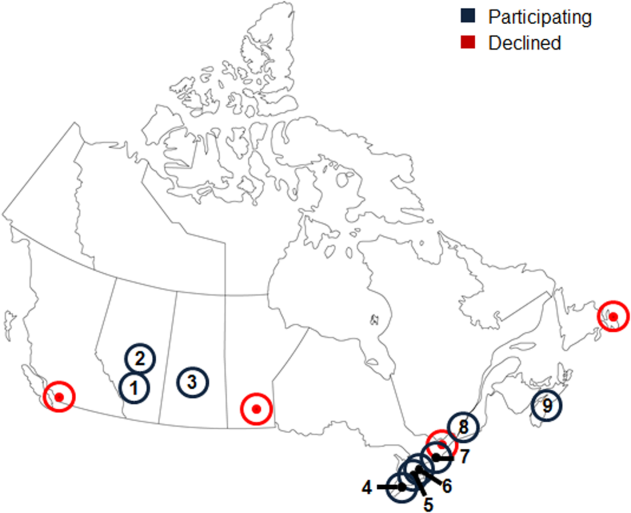
Thirteen university‐affiliated academic centers met inclusion criterion and were invited to participate. Data were obtained from 9 organizations (9/13, 69%), encompassing 14 geographically distributed academic hospitals (Figure 1). Centers that declined to participate cited a lack of comprehensive electronic databases tracking prescriptions as the main barrier. One of the 14 participating hospitals represented a network of affiliated health centers (site 2), rendering it an outlier in terms of total number of doses prescribed (>3 standard deviations above the mean). This affiliated network was unable to provide prescribing data separated by hospital and was excluded from analyses.
In total, data were collected corresponding to 48,806 prescriptions for 209,762 doses of thiamine, provided to 32,213 patients (Table 1). Prescriptions were divided by route of administration (parenteral vs oral) and prescribing practices summarized across centers. Rates of parenteral prescribing varied widely between centers (maximum=82.0%, minimum=33.9%). Overall, however, parenteral thiamine was prescribed more frequently than oral thiamine, accounting for 57.6% of all prescriptions (z=33.59, P<0.001) and 59.2% of initial prescriptions issued to patients (z=168.93, P<0.001). Oral thiamine constituted a significant majority of the total doses prescribed (68.4%, z=168.9; P<0.001).
| All Prescriptions | First Prescriptions | Doses | ||||||||
|---|---|---|---|---|---|---|---|---|---|---|
| Hospital | Total | Parenteral % | Oral % | Total | Parenteral % | Oral % | Total | Parenteral % | Oral % | |
| ||||||||||
| 1A* | 7,499 | 66.42 | 33.58 | 6,189 | 66.41 | 33.59 | 36,032 | 26.60 | 73.40 | |
| 1B* | 4,372 | 70.38 | 29.62 | 2,314 | 78.69 | 21.31 | 17,133 | 27.61 | 72.39 | |
| 1C* | 5,805 | 57.64 | 42.36 | 4,742 | 58.10 | 41.90 | 30,910 | 17.12 | 82.88 | |
| 3* | 3,519 | 45.27 | 54.73 | 2,236 | 59.57 | 40.43 | 8,037 | 52.37 | 47.63 | |
| 4* | 5,322 | 60.50 | 39.50 | 2,900 | 57.83 | 42.17 | 22,159 | 44.49 | 55.51 | |
| 5 | 3,857 | 46.85 | 53.15 | 2,858 | 56.37 | 43.63 | 16,035 | 33.51 | 66.49 | |
| 6A* | 6,105 | 55.46 | 44.54 | 2,907 | 55.04 | 44.96 | 15,947 | 44.22 | 55.78 | |
| 6B | 3,127 | 55.39 | 44.61 | 1,710 | 64.62 | 35.38 | 9,048 | 45.11 | 54.89 | |
| 6C* | 2,134 | 55.62 | 44.38 | 1,499 | 56.24 | 43.76 | 10,327 | 32.33 | 67.67 | |
| 6D | 617 | 35.82 | 64.18 | 505 | 34.65 | 65.35 | 2,647 | 35.70 | 64.30 | |
| 7* | 2,467 | 82.00 | 18.00 | 1,373 | 87.40 | 12.60 | 9,924 | 59.06 | 40.94 | |
| 8 | 1,122 | 50.98 | 49.02 | 694 | 58.79 | 41.21 | 3,048 | 64.73 | 35.27 | |
| 9 | 2,860 | 33.85 | 66.15 | 2,286 | 19.34 | 80.66 | 28,515 | 14.73 | 85.27 | |
| Total | 48,806 | 57.60 | 42.40 | 32,213 | 59.23 | 40.77 | 209,762 | 31.56 | 68.44 | |
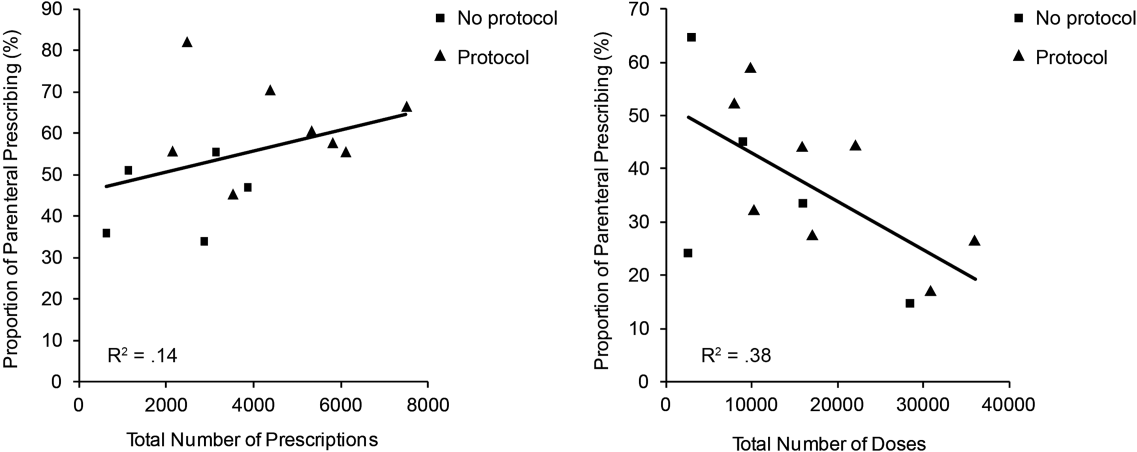
The factors associated with higher rates of parenteral prescribing were further considered. Rates of parenteral prescribing were compared between centers with and without published guidelines governing thiamine usage. Eight of 13 hospitals (61.5%) had hospital‐wide protocols that promoted initial administration of thiamine via the parenteral route in patients at risk of deficiency. The presence of a protocol was associated with significantly higher overall rates of parenteral prescribing (61.3% with protocol, 45.7% without protocol; z=29.5; P<0.001). Linear regression revealed no predictive relationship between the number of prescriptions issued and the proportion of parenteral thiamine prescribed across centers (total prescriptions, standard 0.38, P=0.20; Figure 2). A negative correlation was observed between the proportion of doses prescribed via the parenteral route and the number of total doses prescribed (standard =0.61, P=0.03), suggesting that centers prescribing the greatest numbers of doses were less likely to prescribe parenteral thiamine.
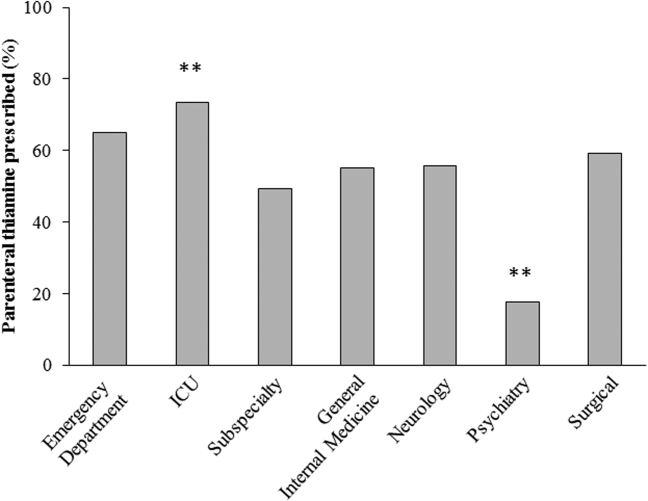
The effect of the inpatient practice environment on prescribing behavior was considered across the 7 centers for which service‐specific prescribing data were provided (Figure 3). Patients receiving care within emergency departments or intensive care, general medical or surgical units were more likely to be prescribed parenteral thiamine (z>3.0, P<0.001), whereas patients admitted to psychiatry units were more likely to be prescribed thiamine via the oral route (z=23.7, P<0.001). No differences were observed between rates of parenteral and oral prescribing for patients admitted under medical subspecialty (z=0.6, P=not significant) and neurology services (z=3.1, P=not significant). Pair‐wise comparisons for means confirmed that patients admitted to the ICU were significantly more likely to be prescribed parenteral thiamine than patients admitted to any other service; psychiatry inpatients were the least likely to be prescribed parenteral thiamine (P<0.001).
A post hoc analysis was used to determine the service‐specific effect of hospital‐wide protocols promoting parenteral prescribing. Protocols were associated with significantly higher rates of parenteral prescribing for patients receiving care under all services (ICU, z=3.76; medical subspecialties, z=16.07; general medicine, z=15.40; neurology, z=7.02; surgery, z=13.19; P<0.001), except psychiatry (z=2.0, P=not significant) and those within emergency departments (z=2.05, P=not significant).
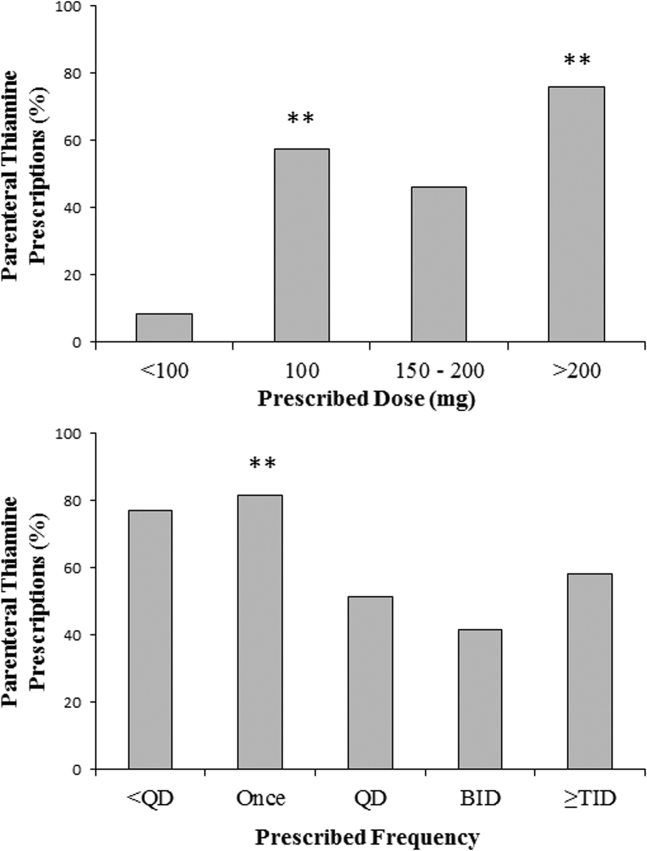
In contrast to the differences in the rates of parenteral prescribing across centers, quantitative review of the doses and schedule of thiamine administration revealed a near‐universal approach to prescribing. Overall, 92.7% (45,266/48,806) of prescriptions were for 100 mg of thiamine (z=188.8, P<0.001); 74.6% (33,551/44,948) of prescriptions were ordered once daily (z=104.5, P<0.001). Thiamine was more likely to be prescribed via the parenteral route when prescribed in doses of 100 mg (57.6%, z=32.5, P<0.001) or >200 mg (76.1%, z=25.51, P<0.001), or when ordered as single doses (81.5%, z=64.86, P<0.001) (Figure 4).
DISCUSSION
The causal relationship between thiamine deficiency and WE has been recognized since 1941,[28] with the importance of parenteral thiamine replacement in vulnerable populations emphasized in numerous case series,[29, 30] population‐based studies,[14, 31, 32] and consensus guidelines.[15, 20] Consistent with guideline recommendations, thiamine was significantly more likely to be prescribed via the parenteral route across a large network of geographically distributed Canadian academic healthcare centers. Somewhat surprisingly, however, oral thiamine accounted for 42.4% of all prescriptions, and a significant majority of doses prescribed to the over 30,000 patients studied. These findings confirm that oral thiamine continues to be prescribed to inpatients within Canadian academic hospitals.
The critical importance of parenteral thiamine administration for the treatment and prevention of WE is supported by an understanding of the pathophysiology of this disease. Wernicke's encephalopathy results from brain‐thiamine deficiency, leading to a cellular energy deficit, focal acidosis, regional increases in glutamate, and cell death.[20, 33, 34] Serum thiamine crosses the blood brain barrier through active (transporter‐mediated) and passive (concentration‐dependent) means.[20] It is therefore possible to drive thiamine into the central nervous system by establishing high serum thiamine levels. Interestingly, forward linear regression suggested that the centers prescribing the largest number of doses were less likely to prescribe parenteral thiamine. This may reflect a misguided preference for the use of prolonged/frequent courses of oral thiamine for the prevention and/or treatment of thiamine deficiency in hospitalized patients. Oral absorption of thiamine occurs within the duodenum by a rate‐limited process, with maximum absorption of 4.5 mg per dose.[20] This rate may be higher in healthy individuals, arguing for passive and active transport across enterocytes.[35] In sick individuals, however, oral absorption cannot be relied upon to attain the high serum thiamine levels necessary to reverse the effects of deficiency, exemplifying the importance of parenteral administration in hospitalized patients.
Protocols promoting parenteral administration of thiamine were associated with higher rates of parenteral prescribing across centers, and may represent an effective and convenient means of effecting prescriber behaviors. Efforts must be made, however, to identify additional barriers limiting parenteral thiamine prescribing within hospitals. One such barrier relates to the identification of at‐risk individuals. Despite advances in biochemical measures quantifying thiamine deficiency[36] and neuroimaging studies confirming changes within the brains of affected patients,[37] WE remains a clinical diagnosis. As such, clinical criteria have been proposed to identify those at risk of deficiency, with an emphasis on detection of WE in patients with alcohol‐use disorders. Specifically, guidelines from the Royal College of Physicians advocate that WE be considered in patients with evidence of alcohol misuse, and 1 of the following: (1) acute confusion, (2) decreased consciousness, (3) ataxia, (4) ophthalmoplegia, (5) memory disturbances, and (6) hypothermia with hypotension.[20] The European Federation of Neurological Sciences broadens the clinical criteria to include patients with and without alcohol‐use disorders, encouraging diagnosis and treatment in individuals with any 2 of the following: (1) dietary deficiencies, (2) oculomotor abnormalities, (3) cerebellar dysfunction, and (4) altered mental status or mild memory impairment.[15] Once identified, it remains imperative that patients receive appropriate therapies to reverse thiamine deficiency. To this end, the results of the present study may be used to identify potential inpatient populations at risk of undertreatment.
Psychiatric patients were the least likely to be prescribed parenteral thiamine, regardless of whether protocols promoting parenteral prescribing were in place within the study hospital. This observation is concerning, as psychiatric inpatients may be at risk of thiamine deficiency due to a confluence of factors related to mental illness (ie, malnutrition associated with eating disorders, substance abuse)[21, 38] and increased rates of comorbid physical illnesses.[39] Low rates of parenteral prescribing may reflect a number of service‐specific (ie, decreased ease of administration of parenteral medications) and patient‐specific factors (ie, challenges of maintaining intravenous catheter access in acutely ill psychiatric patients) that are not adequately addressed by hospital‐wide protocols. Alternatively, lower rates of parenteral prescribing may reflect a systematic preference for the use of oral thiamine in a patient population perceived to be at lower risk of thiamine deficiency. Although oral thiamine has been shown to be effective in correcting thiamine deficiency in a group of community‐dwelling elderly patients without clinical symptoms or signs suggesting WE (ie, subclinical thiamine deficiency),[40] it remains to be determined whether a similar treatment strategy can be endorsed in select inpatients with subclinical deficiency, in whom oral absorption and compliance can be reasonably assured.
Randomized control trial evidence supporting specific doses and schedules for administration of parenteral thiamine is not available.[24, 25] Accordingly, uncertainty exists concerning the doses and frequency of administration of thiamine required to prevent or reverse suspected WE. Despite this uncertainty, the dose and schedule of thiamine prescribed in our study population was remarkably uniform, with thiamine most commonly prescribed in 100‐mg doses once daily. Similar findings were reported in a retrospective study considering thiamine prescribing to 217 patients with alcohol‐use disorders admitted to an urban US teaching hospital: 76.9% of inpatients were prescribed 100‐mg daily doses of thiamine.[19] Interestingly, no differences in prescribing behaviors were noted when high‐risk patients presenting with alcohol intoxication, withdrawal, or delirium tremens were considered separately, suggesting that patient‐specific factors had little impact on the dosing strategy endorsed by clinicians.[19]
Although pervasive, the provision of 100 mg of thiamine daily is not supported by biochemical or clinical studies.[27] On the contrary, clinical‐pathological studies suggest that doses of thiamine between 50 and 100 mg per day may not be sufficient to reverse clinical signs or prevent death in patients with WE, whereas doses up to 250 mg may not reverse the biochemical abnormalities associated with clinically significant deficiency.[12, 41, 42] Such rationale is cited in support of consensus recommendations promoting administration of high doses of parenteral thiamine for the treatment of WE (200 or 500 mg, provided 3 times daily).[15, 20] As this project illustrates, however, rational, well‐justified guidelines are not enough to transform clinical practice.
The limitations of consensus guidelines and hospital‐specific protocols promoting thiamine prescribing have been explored in other specialty[43] and hospital environments.[44, 45] These studies offer several insights into the factors that may contribute to the disparity between recommended and real‐world practices, including continued under‐recognition of malnourished hospitalized patients at risk of thiamine deficiency,[1, 45, 46, 47] variations in consensus‐based guidelines governing thiamine prescribing,[15, 20] and challenges in communication of protocol rationales and recommendations.[44, 48] Together, these findings exemplify the need for additional strategies aimed at improving parenteral prescribing in vulnerable hospitalized populations. The proliferation of computerized physician order entry and clinical decision support systems may offer the opportunity to effect prescribing behaviors, with the possibility of specifying routes and doses of thiamine administration in accordance with guidelines,[49] without the requirement for dedicated monitoring and personnel‐driven interventions.
Limitations
By design, our study was limited to the assessment of thiamine‐prescribing data obtained directly from computerized pharmacy information systems. Consequently, only the minimum details required to safely prescribe a medication were captured. As a result, we were unable to evaluate the potential effect of patient‐specific factors (including clinical diagnosis) on prescriber behaviors. Thus, it remains possible that prescribing behaviors varied according to perceived patient risks in our study population. An additional limitation relates to the generalizability of results beyond academic hospitals in Canada. We suggest, however, that potential concerns relating to generalizability are counterbalanced by 2 advantages inherent within our study population. The first is that the majority of community‐based clinicians are trained within university‐affiliated hospitals. As a result, prescribing behaviors measured in these training centers should reflect optimal behaviors within downstream networks of community hospitals. The second is that the recruitment of hospitals funded by a universal single‐payer served to minimize variability in prescribing behaviors attributable to prescriber and patient concerns regarding reimbursement, thus providing a more accurate assessment of prescriber behaviors based on clinical evidence, independent of financial factors.
Acknowledging these limitations, we assert that parenteral administration of thiamine remains the best means of rapidly correcting thiamine deficiency, and should be considered for the treatment of clinically relevant thiamine deficiency in hospitalized patients. This recommendation effectively balances the potentially deleterious consequences of undertreatment of thiamine deficiency, with the favorable risk‐ and cost‐profile associated with the administration of parenteral thiamine.[15, 20, 23, 27, 50, 51]
CLINICAL AND RESEARCH IMPLICATIONS
In an era of overuse of vitamin supplementation,[52] it is increasingly important for healthcare providers to recognize not only when vitamin supplementation is required, but also how replacement therapies should be delivered. As shown in this study, protocols promoting the use of parenteral thiamine may improve overall compliance with recommendations. However, additional strategies are required to further improve rates of parenteral prescribing to hospitalized patients at risk of thiamine deficiency.
Acknowledgements
The authors are grateful for the contributions of support staff within local hospital pharmacy and information technology departments who made collection of these data possible. Dr. David F. Tang‐Wai reviewed an earlier draft of the manuscript and provided useful comments for which we are grateful.
Disclosures: G. S. Day developed the study concept and methods for implementation, and was primarily responsible for acquisition, analysis, and interpretation of data, as well as drafting, revision, and finalization of the manuscript. G. S. Day had full access to all study data, and takes responsibility for the integrity of the data and the accuracy of the analysis and interpretation. S. Ladak participated in the development of methods, acquisition of data, and revision and finalization of the manuscript. K. Curley participated in the development of methods, acquisition of data, and revision and finalization of the manuscript. N. A. S. Farb participated in analysis of data, and revision and finalization of the manuscript. P. Masiowski participated in acquisition of data, and revision and finalization of the manuscript. T. Pringsheim participated in acquisition of data, and revision and finalization of the manuscript. M. Ritchie participated in acquisition of data, and revision and finalization of the manuscript. A. Cheung participated in acquisition of data, and revision and finalization of the manuscript. S. Jansen participated in acquisition of data, and revision and finalization of the manuscript. L. Methot participated in acquisition of data, and revision and finalization of the manuscript. H. L. Neville participated in acquisition of data, and revision and finalization of the manuscript. D. Bates participated in acquisition of data, and revision and finalization of the manuscript. D. Lowe participated in acquisition of data, and revision and finalization of the manuscript. N. Fernandes participated in acquisition of data, and revision and finalization of the manuscript. A. Ferland participated in acquisition of data, and revision and finalization of the manuscript. C. M. del Campo acted as primary supervisor for this project, and approved study design and methods. He assisted with interpretation of data, and revision and finalization of the manuscript. Preliminary data were reported in abstract form at the 2013 Annual Meeting of the American Academy of Neurology (March 2013, San Diego, CA) and the 2014 Annual Meeting of the Canadian Neurological Sciences Foundation (June 2014, Banff, AB, Canada). No sources of funding are reported for this study. The authors report no conflicts of interest.
- , , , , . Nutrition in the hospitalized patient. J Hosp Med. 2013;8(1):52–58.
- , . The impact of malnutrition on morbidity, mortality, length of hospital stay and costs evaluated through a multivariate model analysis. Clin Nutr. 2003;22(3):235–239.
- , , , et al. Prevalence of malnutrition on admission to four hospitals in England. The Malnutrition Prevalence Group. Clin Nutr. 2000;19(3):191–195.
- . Die akute haemorrhagische polioencephalitis superior: Kassel, Germany; Fisher; 1881.
- . Diseases of the Nervous System. 5th ed. London: Oxford University Press; 1955.
- , , . Wernicke's encephalopathy. A clinical and pathological study of 28 autopsied cases. Arch Neurol. 1961;4:510–519.
- , , , . Diagnosis by treatment. J Hosp Med. 2011;6(9):546–549.
- , , . The Wernicke‐Korsakoff syndrome. A clinical and pathological study of 245 patients, 82 with post‐mortem examinations. Contemp Neurol Ser. 1971;7:1–206.
- , , , . Operational criteria for the classification of chronic alcoholics: identification of Wernicke's encephalopathy. J Neurol Neurosurg Psychiatry. 1997;62(1):51–60.
- . The incidence of Wernicke's encephalopathy in Australia–a neuropathological study of 131 cases. J Neurol Neurosurg Psychiatry. 1983;46(7):593–598.
- . Wernicke's encephalopathy: a more common disease than realised. A neuropathological study of 51 cases. J Neurol Neurosurg Psychiatry. 1979;42:226–231.
- , , . Clinical signs in the Wernicke‐Korsakoff complex: a retrospective analysis of 131 cases diagnosed at necropsy. J Neurol Neurosurg Psychiatry. 1986;49:341–345.
- , , . Autopsy prevalence of Wernicke's encephalopathy in alcohol‐related disease. S Afr Med J. 1996;86(9):1110–1112.
- , . Increasing incidence of Korsakoff's psychosis in the east end of Glasgow. Alcohol Alcohol. 1997;32(3):281–285.
- , , , et al. EFNS guidelines for diagnosis, therapy and prevention of Wernicke encephalopathy. Eur J Neurol. 2010;17(12):1408–1418.
- , , . A survey of the current clinical practice of psychiatrists and accident and emergency specialists in the United Kingdom concerning vitamin supplementation for chronic alcohol misusers. Alcohol Alcohol. 1999;34(6):862–867.
- , , . Thiamine deficiency in head injury: a missed insult? Alcohol Alcohol. 1997;32(4):493–500.
- . Thiamine (vitamin B1) deficiency and associated brain damage is still common throughout the world and prevention is simple and safe! Eur J Neurol. 2006;13(10):1078–1082.
- , , . Prescribing thiamine to inpatients with alcohol use disorders: how well are we doing? J Addict Med. 2014;8(1):1–5.
- , , , ; Royal College of Physicians, London. The Royal College of Physicians report on alcohol: guidelines for managing Wernicke's encephalopathy in the accident and Emergency Department. Alcohol Alcohol. 2002;37(6):513–521.
- , , . B Vitamin deficiency and neuropsychiatric syndromes in alcohol misuse. Alcohol Alcohol. 1998;33(4):317–336.
- , . Five things to know about Wernicke's Encephalopathy: a medical emergency. CMAJ. 2013;186(8):E295.
- , , . Wernicke‐Korsakoff‐syndrome: under‐recognized and under‐treated. Psychosomatics. 2012;53(6):507–516.
- , , , , . Thiamine for Wernicke‐Korsakoff Syndrome in people at risk from alcohol abuse. Cochrane Database Syst Rev. 2004;(1):CD004033.
- , , , , . Thiamine for prevention and treatment of Wernicke‐Korsakoff Syndrome in people who abuse alcohol. Cochrane Database Syst Rev. 2013;7:CD004033.
- , , . Thiamine Treatment and working memory function of alcohol‐dependent people: preliminary findings. Alcohol Clin Exp Res. 2001;25(1):112–116.
- , , , . Myths and misconceptions of Wernicke's encephalopathy: what every emergency physician should know. Ann Emerg Med. 2007;50(6):715–721.
- , . Wernicke's Encephalopathy: The clinical features and their probable relationship to vitamin B deficiency. Q J Med. 1941;10:(37):41–64.
- , , . Patterns of 35S‐thiamine hydrochloride absorption in the malnourished alcoholic patient. J Lab Clin Med. 1970;76(1):34–45.
- , , , . Thiamine propyl disulfide: absorption and utilization. Ann Intern Med. 1971;74(4):529–534.
- , . Parenteral thiamine and Wernicke's encephalopathy: the balance of risks and perception of concern. Alcohol Alcohol. 1997;32(3):207–209.
- , , , et al. Efficacy of vitamin supplementation in chronic alcoholics undergoing detoxification. Alcohol Alcohol Suppl. 1983;18:157–166.
- , , . Mechanisms of neuronal cell death in Wernicke's encephalopathy. Metab Brain Dis. 1998;13(2):97–122.
- , , , . Brain lactate synthesis in thiamine deficiency: a re‐evaluation using 1H‐13C nuclear magnetic resonance spectroscopy. J Neurosci Res. 2005;79(1‐2):33–41.
- , , . Pharmacokinetics of high‐dose oral thiamine hydrochloride in healthy subjects. BMC Clin Pharmacol. 2012;12(4):4.
- , , , et al. Simultaneous liquid chromatographic assessment of thiamine, thiamine monophosphate and thiamine diphosphate in human erythrocytes: a study on alcoholics. J Chromatogr B Analyt Technol Biomed Life Sci. 2003;789(2):355–363.
- , . Neuroimaging findings in acute Wernicke's encephalopathy: review of the literature. AJR Am J Roentgenol. 2009;192(2):501–508.
- , , , , . Beyond alcoholism: Wernicke‐Korsakoff syndrome in patients with psychiatric disorders. Cogn Behav Neurol. 2011;24(4):209–216.
- , , , , . Mental health status and gender as risk factors for onset of physical illness over 10 years. J Epidemiol Community Health. 2014;68(1):64–70.
- , , , , . The response to treatment of subclinical thiamine deficiency in the elderly. Am J Clin Nutr. 1997;66(4):925–928.
- , , . Thiamin and thiamin phosphate ester deficiency assessed by high performance liquid chromatography in four clinical cases of Wernicke's encephalopathy. Alcohol Clin Exp Res. 1993;17:712–716.
- . Prevention and treatment of Wernicke‐Korsakoff syndrome. Alcohol Alcohol Suppl. 2000;35(1):19–20.
- , , . Pabrinex prescribing in Scottish Emergency Departments. Poster presented at: Inaugural Scientific Conference of the College of Emergency Medicine; May 14–16, 2008; London, United Kingdom.
- , , , , , . Pharmacy‐based intervention in Wernicke's encephalopathy. Psychiatrist. 2010;34(6):234–238.
- , , . Time to act on the inadequate management of Wernicke's encephalopathy in the UK. Alcohol alcohol. Jan‐Feb 2013;48(1):4–8.
- , , , , . Malnutrition is prevalent in hospitalized medical patients: are housestaff identifying the malnourished patient? Nutrition. Apr 2006;22(4):350–354.
- , , , . Malnutrition among Hospitalized‐Patients ‐ a Problem of Physician Awareness. Archives of Internal Medicine. Aug 1987;147(8):1462–1465.
- , . BNF recommendations for the treatment of Wernicke's encephalopathy: lost in translation? Alcohol Alcohol. 2013;48(4):514–515.
- , , , , , . Reduction in medication errors in hospitals due to adoption of computerized provider order entry systems. J Am Med Inform Assoc. 2013;20(3):470–476.
- , . Is intravenous thiamine safe? Am J Emerg Med. 1992;10(2):165.
- , , . A toxicity study of parenteral thiamine hydrochloride. Ann Emerg Med. 1989;18(8):867–870.
- , , , , . Enough is enough: Stop wasting money on vitamin and mineral supplements. Ann Intern Med. 2013;159:850–851.
Thiamine pyrophosphate, the biologically active form of thiamine (vitamin B1), is an essential cofactor for the aerobic breakdown of glucose, with daily requirements related to total caloric intake and the proportion of calories provided as carbohydrates. Patients presenting to the hospital are at risk of thiamine deficiency due to a preponderance of factors including baseline poor nutritional status,[1, 2, 3] diminished intake (associated with illness prodrome), increased metabolic demand (eg, occurring with sepsis, malignancy, surgery, pregnancy), and resuscitation with intravenous glucose‐containing fluids. Without thiamine pyrophosphate, glucose is metabolized through less‐efficient anaerobic pathways, producing lactic acid as a by‐product. The brain uses glucose as its main source of energy and is susceptible to injury due to acute thiamine deficiency. Petechial hemorrhage and demyelination within periventricular structures (thalami, mammillary bodies, ocular motor nuclei, and cerebellar vermis) account for the classical triad of Wernicke's encephalopathy (WE), including confusion/encephalopathy, ophthalmoplegia, and ataxia.[4, 5, 6, 7] Additional symptoms and signs are reported in WE, implicating more widespread consequences of thiamine deficiency.[6, 7, 8, 9]
Wernicke's encephalopathy remains an historically well‐documented illness,[4, 5] of continued relevance to hospitalist practice. Pathologic changes diagnostic of WE are reported in 1.9% to 2.8% of all patients at autopsy,[6, 10] and in as many as 20% of hospitalized patients following unexplained death.[11, 12] In cases of alcohol‐related death, the incidence may be as high as 59%.[13] Most troubling is the observation that the diagnosis is frequently missed in clinical settings,[14, 15, 16, 17, 18, 19] with devastating results. Case series report mortality in upward of 20% of patients with untreated or undertreated WE, with 85% of survivors developing Korsakoff syndromethe chronic form of WE.[8, 20, 21] The clinical diagnosis may be missed in as many as 94% of nonalcoholic patients, including patients admitted to surgical (ie, postgastrointestinal surgery), obstetrical (ie, hyperemesis gravidarum), psychiatric (ie, eating disorders), general internal medicine (ie, cancer‐associated cachexia and related complications), and subspecialty services (ie, dialysis and renal diseases).[15]
Recognition of WE is critical, as effective intervention and treatment is possible. For hospitalized patients, intervention should prioritize parenteral administration of thiamine[22, 23] to circumvent problems with oral absorption common in the medically ill, and to maximize serum thiamine concentrations, promoting passive (concentration‐dependent) movement of thiamine across the blood brain barrier. In lieu of evidence from randomized controlled trials supporting specific doses and schedules for thiamine administration,[24, 25] this recommendation relies on ample experiential evidence emphasizing the importance of higher doses of parenteral thiamine (in excess of 200 mg provided 3 times daily) for the prevention/treatment of WE.[12, 15, 20, 26, 27]
It remains to be determined whether the evidence emphasizing parenteral prescribing has affected current practice within inpatient populations. To address this need, we sought to quantify thiamine‐prescribing practices within Canadian university‐affiliated hospitals across a 2‐year period. We hypothesized that thiamine would be prescribed more frequently via the parenteral route, in line with published guidelines promoting parenteral administration of thiamine.[15, 20]
METHODS
Study Design and Recruitment
A retrospective observational study was used to evaluate thiamine prescribing within Canadian academic hospitals between January 2010 and December 2011. University‐affiliated institutions with English‐speaking postgraduate (ie, residency) adult medicine programs were eligible to participate. Participating centers all utilized computerized pharmacy information systems, allowing anonymized retrospective data to be reported for participants. Study objectives, methods, and procedures were approved by institutional research ethics boards at participating centers.
Data were extracted for the study period from computerized pharmacy information systems recording prescriptions processed by centralized hospital pharmacies. Thiamine prescribed as part of total parenteral nutrition was excluded from analysis, as prescribing was automated in most centers. Participants were assigned a randomized study number linked to prescription information specifying the prescribed dose of thiamine, route of administration (oral: per os, nasogastric tube, orogastric tube, gastric tube; versus parenteral: intravenous, intramuscular), frequency of dosing (eg, daily, twice daily, 3 times daily), and start/end dates. Complete data were available from 12 hospitals (12/14, 85.7%). One hospital was missing data concerning the frequency of prescribing. One hospital provided only summary data, specifying the number of prescriptions issued by route and dose. Information concerning the prescribing service was captured within records from 7 hospitals (7/14, 50.0%), allowing prescriptions to be stratified by prescribing services. Subspecialty designations were simplified to emergency department, intensive care unit (ICU) (including medical, surgical, and trauma ICUs), medical subspecialty (ie, cardiology, endocrinology, gastroenterology, medical oncology, rheumatology), general internal medicine, neurology, psychiatry, and surgical (ie, general surgery, cardiac surgery, neurosurgery, orthopedics, gynecology) services.
Statistical Analysis
Prescriptions for thiamine were summarized across each center specifying the route of administration (all prescriptions and initial prescription). Prescribing behaviors across centers were summarized using descriptive statistics. Differences in parenteral versus oral prescribing were evaluated using the z test for the difference between weighted averages, assuming a null hypothesis of equal prescribing (ie, 50% parenteral and 50% oral) within categories (i.e., all prescriptions, initial prescriptions, total doses).
Factors that may affect rates of parenteral prescribing were considered across centers. Hospitals were stratified based upon the presence of protocols promoting parenteral thiamine prescribing for the treatment of patients at risk of deficiency. The effect of protocols on prescribing behaviors was evaluated by comparing prescribing practices in centers with and without protocols using the z test for the difference between proportions. Forward linear regression was used to evaluate the correlation between the number of prescriptions and/or doses prescribed within centers, and the rates of parenteral prescribing. Rates of parenteral prescribing across hospital services were compared using pairwise comparisons.
Statistical analyses were completed using IBM SPSS Statistics 20 (IBM Corp., Armonk, NY). Significance was defined as P<0.05, using P values corrected for the total number of comparisons (Bonferroni correction), equivalent to a single‐comparison P value<0.001.
RESULTS
Thirteen university‐affiliated academic centers met inclusion criterion and were invited to participate. Data were obtained from 9 organizations (9/13, 69%), encompassing 14 geographically distributed academic hospitals (Figure 1). Centers that declined to participate cited a lack of comprehensive electronic databases tracking prescriptions as the main barrier. One of the 14 participating hospitals represented a network of affiliated health centers (site 2), rendering it an outlier in terms of total number of doses prescribed (>3 standard deviations above the mean). This affiliated network was unable to provide prescribing data separated by hospital and was excluded from analyses.
In total, data were collected corresponding to 48,806 prescriptions for 209,762 doses of thiamine, provided to 32,213 patients (Table 1). Prescriptions were divided by route of administration (parenteral vs oral) and prescribing practices summarized across centers. Rates of parenteral prescribing varied widely between centers (maximum=82.0%, minimum=33.9%). Overall, however, parenteral thiamine was prescribed more frequently than oral thiamine, accounting for 57.6% of all prescriptions (z=33.59, P<0.001) and 59.2% of initial prescriptions issued to patients (z=168.93, P<0.001). Oral thiamine constituted a significant majority of the total doses prescribed (68.4%, z=168.9; P<0.001).
| All Prescriptions | First Prescriptions | Doses | ||||||||
|---|---|---|---|---|---|---|---|---|---|---|
| Hospital | Total | Parenteral % | Oral % | Total | Parenteral % | Oral % | Total | Parenteral % | Oral % | |
| ||||||||||
| 1A* | 7,499 | 66.42 | 33.58 | 6,189 | 66.41 | 33.59 | 36,032 | 26.60 | 73.40 | |
| 1B* | 4,372 | 70.38 | 29.62 | 2,314 | 78.69 | 21.31 | 17,133 | 27.61 | 72.39 | |
| 1C* | 5,805 | 57.64 | 42.36 | 4,742 | 58.10 | 41.90 | 30,910 | 17.12 | 82.88 | |
| 3* | 3,519 | 45.27 | 54.73 | 2,236 | 59.57 | 40.43 | 8,037 | 52.37 | 47.63 | |
| 4* | 5,322 | 60.50 | 39.50 | 2,900 | 57.83 | 42.17 | 22,159 | 44.49 | 55.51 | |
| 5 | 3,857 | 46.85 | 53.15 | 2,858 | 56.37 | 43.63 | 16,035 | 33.51 | 66.49 | |
| 6A* | 6,105 | 55.46 | 44.54 | 2,907 | 55.04 | 44.96 | 15,947 | 44.22 | 55.78 | |
| 6B | 3,127 | 55.39 | 44.61 | 1,710 | 64.62 | 35.38 | 9,048 | 45.11 | 54.89 | |
| 6C* | 2,134 | 55.62 | 44.38 | 1,499 | 56.24 | 43.76 | 10,327 | 32.33 | 67.67 | |
| 6D | 617 | 35.82 | 64.18 | 505 | 34.65 | 65.35 | 2,647 | 35.70 | 64.30 | |
| 7* | 2,467 | 82.00 | 18.00 | 1,373 | 87.40 | 12.60 | 9,924 | 59.06 | 40.94 | |
| 8 | 1,122 | 50.98 | 49.02 | 694 | 58.79 | 41.21 | 3,048 | 64.73 | 35.27 | |
| 9 | 2,860 | 33.85 | 66.15 | 2,286 | 19.34 | 80.66 | 28,515 | 14.73 | 85.27 | |
| Total | 48,806 | 57.60 | 42.40 | 32,213 | 59.23 | 40.77 | 209,762 | 31.56 | 68.44 | |
The factors associated with higher rates of parenteral prescribing were further considered. Rates of parenteral prescribing were compared between centers with and without published guidelines governing thiamine usage. Eight of 13 hospitals (61.5%) had hospital‐wide protocols that promoted initial administration of thiamine via the parenteral route in patients at risk of deficiency. The presence of a protocol was associated with significantly higher overall rates of parenteral prescribing (61.3% with protocol, 45.7% without protocol; z=29.5; P<0.001). Linear regression revealed no predictive relationship between the number of prescriptions issued and the proportion of parenteral thiamine prescribed across centers (total prescriptions, standard 0.38, P=0.20; Figure 2). A negative correlation was observed between the proportion of doses prescribed via the parenteral route and the number of total doses prescribed (standard =0.61, P=0.03), suggesting that centers prescribing the greatest numbers of doses were less likely to prescribe parenteral thiamine.
The effect of the inpatient practice environment on prescribing behavior was considered across the 7 centers for which service‐specific prescribing data were provided (Figure 3). Patients receiving care within emergency departments or intensive care, general medical or surgical units were more likely to be prescribed parenteral thiamine (z>3.0, P<0.001), whereas patients admitted to psychiatry units were more likely to be prescribed thiamine via the oral route (z=23.7, P<0.001). No differences were observed between rates of parenteral and oral prescribing for patients admitted under medical subspecialty (z=0.6, P=not significant) and neurology services (z=3.1, P=not significant). Pair‐wise comparisons for means confirmed that patients admitted to the ICU were significantly more likely to be prescribed parenteral thiamine than patients admitted to any other service; psychiatry inpatients were the least likely to be prescribed parenteral thiamine (P<0.001).
A post hoc analysis was used to determine the service‐specific effect of hospital‐wide protocols promoting parenteral prescribing. Protocols were associated with significantly higher rates of parenteral prescribing for patients receiving care under all services (ICU, z=3.76; medical subspecialties, z=16.07; general medicine, z=15.40; neurology, z=7.02; surgery, z=13.19; P<0.001), except psychiatry (z=2.0, P=not significant) and those within emergency departments (z=2.05, P=not significant).
In contrast to the differences in the rates of parenteral prescribing across centers, quantitative review of the doses and schedule of thiamine administration revealed a near‐universal approach to prescribing. Overall, 92.7% (45,266/48,806) of prescriptions were for 100 mg of thiamine (z=188.8, P<0.001); 74.6% (33,551/44,948) of prescriptions were ordered once daily (z=104.5, P<0.001). Thiamine was more likely to be prescribed via the parenteral route when prescribed in doses of 100 mg (57.6%, z=32.5, P<0.001) or >200 mg (76.1%, z=25.51, P<0.001), or when ordered as single doses (81.5%, z=64.86, P<0.001) (Figure 4).
DISCUSSION
The causal relationship between thiamine deficiency and WE has been recognized since 1941,[28] with the importance of parenteral thiamine replacement in vulnerable populations emphasized in numerous case series,[29, 30] population‐based studies,[14, 31, 32] and consensus guidelines.[15, 20] Consistent with guideline recommendations, thiamine was significantly more likely to be prescribed via the parenteral route across a large network of geographically distributed Canadian academic healthcare centers. Somewhat surprisingly, however, oral thiamine accounted for 42.4% of all prescriptions, and a significant majority of doses prescribed to the over 30,000 patients studied. These findings confirm that oral thiamine continues to be prescribed to inpatients within Canadian academic hospitals.
The critical importance of parenteral thiamine administration for the treatment and prevention of WE is supported by an understanding of the pathophysiology of this disease. Wernicke's encephalopathy results from brain‐thiamine deficiency, leading to a cellular energy deficit, focal acidosis, regional increases in glutamate, and cell death.[20, 33, 34] Serum thiamine crosses the blood brain barrier through active (transporter‐mediated) and passive (concentration‐dependent) means.[20] It is therefore possible to drive thiamine into the central nervous system by establishing high serum thiamine levels. Interestingly, forward linear regression suggested that the centers prescribing the largest number of doses were less likely to prescribe parenteral thiamine. This may reflect a misguided preference for the use of prolonged/frequent courses of oral thiamine for the prevention and/or treatment of thiamine deficiency in hospitalized patients. Oral absorption of thiamine occurs within the duodenum by a rate‐limited process, with maximum absorption of 4.5 mg per dose.[20] This rate may be higher in healthy individuals, arguing for passive and active transport across enterocytes.[35] In sick individuals, however, oral absorption cannot be relied upon to attain the high serum thiamine levels necessary to reverse the effects of deficiency, exemplifying the importance of parenteral administration in hospitalized patients.
Protocols promoting parenteral administration of thiamine were associated with higher rates of parenteral prescribing across centers, and may represent an effective and convenient means of effecting prescriber behaviors. Efforts must be made, however, to identify additional barriers limiting parenteral thiamine prescribing within hospitals. One such barrier relates to the identification of at‐risk individuals. Despite advances in biochemical measures quantifying thiamine deficiency[36] and neuroimaging studies confirming changes within the brains of affected patients,[37] WE remains a clinical diagnosis. As such, clinical criteria have been proposed to identify those at risk of deficiency, with an emphasis on detection of WE in patients with alcohol‐use disorders. Specifically, guidelines from the Royal College of Physicians advocate that WE be considered in patients with evidence of alcohol misuse, and 1 of the following: (1) acute confusion, (2) decreased consciousness, (3) ataxia, (4) ophthalmoplegia, (5) memory disturbances, and (6) hypothermia with hypotension.[20] The European Federation of Neurological Sciences broadens the clinical criteria to include patients with and without alcohol‐use disorders, encouraging diagnosis and treatment in individuals with any 2 of the following: (1) dietary deficiencies, (2) oculomotor abnormalities, (3) cerebellar dysfunction, and (4) altered mental status or mild memory impairment.[15] Once identified, it remains imperative that patients receive appropriate therapies to reverse thiamine deficiency. To this end, the results of the present study may be used to identify potential inpatient populations at risk of undertreatment.
Psychiatric patients were the least likely to be prescribed parenteral thiamine, regardless of whether protocols promoting parenteral prescribing were in place within the study hospital. This observation is concerning, as psychiatric inpatients may be at risk of thiamine deficiency due to a confluence of factors related to mental illness (ie, malnutrition associated with eating disorders, substance abuse)[21, 38] and increased rates of comorbid physical illnesses.[39] Low rates of parenteral prescribing may reflect a number of service‐specific (ie, decreased ease of administration of parenteral medications) and patient‐specific factors (ie, challenges of maintaining intravenous catheter access in acutely ill psychiatric patients) that are not adequately addressed by hospital‐wide protocols. Alternatively, lower rates of parenteral prescribing may reflect a systematic preference for the use of oral thiamine in a patient population perceived to be at lower risk of thiamine deficiency. Although oral thiamine has been shown to be effective in correcting thiamine deficiency in a group of community‐dwelling elderly patients without clinical symptoms or signs suggesting WE (ie, subclinical thiamine deficiency),[40] it remains to be determined whether a similar treatment strategy can be endorsed in select inpatients with subclinical deficiency, in whom oral absorption and compliance can be reasonably assured.
Randomized control trial evidence supporting specific doses and schedules for administration of parenteral thiamine is not available.[24, 25] Accordingly, uncertainty exists concerning the doses and frequency of administration of thiamine required to prevent or reverse suspected WE. Despite this uncertainty, the dose and schedule of thiamine prescribed in our study population was remarkably uniform, with thiamine most commonly prescribed in 100‐mg doses once daily. Similar findings were reported in a retrospective study considering thiamine prescribing to 217 patients with alcohol‐use disorders admitted to an urban US teaching hospital: 76.9% of inpatients were prescribed 100‐mg daily doses of thiamine.[19] Interestingly, no differences in prescribing behaviors were noted when high‐risk patients presenting with alcohol intoxication, withdrawal, or delirium tremens were considered separately, suggesting that patient‐specific factors had little impact on the dosing strategy endorsed by clinicians.[19]
Although pervasive, the provision of 100 mg of thiamine daily is not supported by biochemical or clinical studies.[27] On the contrary, clinical‐pathological studies suggest that doses of thiamine between 50 and 100 mg per day may not be sufficient to reverse clinical signs or prevent death in patients with WE, whereas doses up to 250 mg may not reverse the biochemical abnormalities associated with clinically significant deficiency.[12, 41, 42] Such rationale is cited in support of consensus recommendations promoting administration of high doses of parenteral thiamine for the treatment of WE (200 or 500 mg, provided 3 times daily).[15, 20] As this project illustrates, however, rational, well‐justified guidelines are not enough to transform clinical practice.
The limitations of consensus guidelines and hospital‐specific protocols promoting thiamine prescribing have been explored in other specialty[43] and hospital environments.[44, 45] These studies offer several insights into the factors that may contribute to the disparity between recommended and real‐world practices, including continued under‐recognition of malnourished hospitalized patients at risk of thiamine deficiency,[1, 45, 46, 47] variations in consensus‐based guidelines governing thiamine prescribing,[15, 20] and challenges in communication of protocol rationales and recommendations.[44, 48] Together, these findings exemplify the need for additional strategies aimed at improving parenteral prescribing in vulnerable hospitalized populations. The proliferation of computerized physician order entry and clinical decision support systems may offer the opportunity to effect prescribing behaviors, with the possibility of specifying routes and doses of thiamine administration in accordance with guidelines,[49] without the requirement for dedicated monitoring and personnel‐driven interventions.
Limitations
By design, our study was limited to the assessment of thiamine‐prescribing data obtained directly from computerized pharmacy information systems. Consequently, only the minimum details required to safely prescribe a medication were captured. As a result, we were unable to evaluate the potential effect of patient‐specific factors (including clinical diagnosis) on prescriber behaviors. Thus, it remains possible that prescribing behaviors varied according to perceived patient risks in our study population. An additional limitation relates to the generalizability of results beyond academic hospitals in Canada. We suggest, however, that potential concerns relating to generalizability are counterbalanced by 2 advantages inherent within our study population. The first is that the majority of community‐based clinicians are trained within university‐affiliated hospitals. As a result, prescribing behaviors measured in these training centers should reflect optimal behaviors within downstream networks of community hospitals. The second is that the recruitment of hospitals funded by a universal single‐payer served to minimize variability in prescribing behaviors attributable to prescriber and patient concerns regarding reimbursement, thus providing a more accurate assessment of prescriber behaviors based on clinical evidence, independent of financial factors.
Acknowledging these limitations, we assert that parenteral administration of thiamine remains the best means of rapidly correcting thiamine deficiency, and should be considered for the treatment of clinically relevant thiamine deficiency in hospitalized patients. This recommendation effectively balances the potentially deleterious consequences of undertreatment of thiamine deficiency, with the favorable risk‐ and cost‐profile associated with the administration of parenteral thiamine.[15, 20, 23, 27, 50, 51]
CLINICAL AND RESEARCH IMPLICATIONS
In an era of overuse of vitamin supplementation,[52] it is increasingly important for healthcare providers to recognize not only when vitamin supplementation is required, but also how replacement therapies should be delivered. As shown in this study, protocols promoting the use of parenteral thiamine may improve overall compliance with recommendations. However, additional strategies are required to further improve rates of parenteral prescribing to hospitalized patients at risk of thiamine deficiency.
Acknowledgements
The authors are grateful for the contributions of support staff within local hospital pharmacy and information technology departments who made collection of these data possible. Dr. David F. Tang‐Wai reviewed an earlier draft of the manuscript and provided useful comments for which we are grateful.
Disclosures: G. S. Day developed the study concept and methods for implementation, and was primarily responsible for acquisition, analysis, and interpretation of data, as well as drafting, revision, and finalization of the manuscript. G. S. Day had full access to all study data, and takes responsibility for the integrity of the data and the accuracy of the analysis and interpretation. S. Ladak participated in the development of methods, acquisition of data, and revision and finalization of the manuscript. K. Curley participated in the development of methods, acquisition of data, and revision and finalization of the manuscript. N. A. S. Farb participated in analysis of data, and revision and finalization of the manuscript. P. Masiowski participated in acquisition of data, and revision and finalization of the manuscript. T. Pringsheim participated in acquisition of data, and revision and finalization of the manuscript. M. Ritchie participated in acquisition of data, and revision and finalization of the manuscript. A. Cheung participated in acquisition of data, and revision and finalization of the manuscript. S. Jansen participated in acquisition of data, and revision and finalization of the manuscript. L. Methot participated in acquisition of data, and revision and finalization of the manuscript. H. L. Neville participated in acquisition of data, and revision and finalization of the manuscript. D. Bates participated in acquisition of data, and revision and finalization of the manuscript. D. Lowe participated in acquisition of data, and revision and finalization of the manuscript. N. Fernandes participated in acquisition of data, and revision and finalization of the manuscript. A. Ferland participated in acquisition of data, and revision and finalization of the manuscript. C. M. del Campo acted as primary supervisor for this project, and approved study design and methods. He assisted with interpretation of data, and revision and finalization of the manuscript. Preliminary data were reported in abstract form at the 2013 Annual Meeting of the American Academy of Neurology (March 2013, San Diego, CA) and the 2014 Annual Meeting of the Canadian Neurological Sciences Foundation (June 2014, Banff, AB, Canada). No sources of funding are reported for this study. The authors report no conflicts of interest.
- , , , , . Nutrition in the hospitalized patient. J Hosp Med. 2013;8(1):52–58.
- , . The impact of malnutrition on morbidity, mortality, length of hospital stay and costs evaluated through a multivariate model analysis. Clin Nutr. 2003;22(3):235–239.
- , , , et al. Prevalence of malnutrition on admission to four hospitals in England. The Malnutrition Prevalence Group. Clin Nutr. 2000;19(3):191–195.
- . Die akute haemorrhagische polioencephalitis superior: Kassel, Germany; Fisher; 1881.
- . Diseases of the Nervous System. 5th ed. London: Oxford University Press; 1955.
- , , . Wernicke's encephalopathy. A clinical and pathological study of 28 autopsied cases. Arch Neurol. 1961;4:510–519.
- , , , . Diagnosis by treatment. J Hosp Med. 2011;6(9):546–549.
- , , . The Wernicke‐Korsakoff syndrome. A clinical and pathological study of 245 patients, 82 with post‐mortem examinations. Contemp Neurol Ser. 1971;7:1–206.
- , , , . Operational criteria for the classification of chronic alcoholics: identification of Wernicke's encephalopathy. J Neurol Neurosurg Psychiatry. 1997;62(1):51–60.
- . The incidence of Wernicke's encephalopathy in Australia–a neuropathological study of 131 cases. J Neurol Neurosurg Psychiatry. 1983;46(7):593–598.
- . Wernicke's encephalopathy: a more common disease than realised. A neuropathological study of 51 cases. J Neurol Neurosurg Psychiatry. 1979;42:226–231.
- , , . Clinical signs in the Wernicke‐Korsakoff complex: a retrospective analysis of 131 cases diagnosed at necropsy. J Neurol Neurosurg Psychiatry. 1986;49:341–345.
- , , . Autopsy prevalence of Wernicke's encephalopathy in alcohol‐related disease. S Afr Med J. 1996;86(9):1110–1112.
- , . Increasing incidence of Korsakoff's psychosis in the east end of Glasgow. Alcohol Alcohol. 1997;32(3):281–285.
- , , , et al. EFNS guidelines for diagnosis, therapy and prevention of Wernicke encephalopathy. Eur J Neurol. 2010;17(12):1408–1418.
- , , . A survey of the current clinical practice of psychiatrists and accident and emergency specialists in the United Kingdom concerning vitamin supplementation for chronic alcohol misusers. Alcohol Alcohol. 1999;34(6):862–867.
- , , . Thiamine deficiency in head injury: a missed insult? Alcohol Alcohol. 1997;32(4):493–500.
- . Thiamine (vitamin B1) deficiency and associated brain damage is still common throughout the world and prevention is simple and safe! Eur J Neurol. 2006;13(10):1078–1082.
- , , . Prescribing thiamine to inpatients with alcohol use disorders: how well are we doing? J Addict Med. 2014;8(1):1–5.
- , , , ; Royal College of Physicians, London. The Royal College of Physicians report on alcohol: guidelines for managing Wernicke's encephalopathy in the accident and Emergency Department. Alcohol Alcohol. 2002;37(6):513–521.
- , , . B Vitamin deficiency and neuropsychiatric syndromes in alcohol misuse. Alcohol Alcohol. 1998;33(4):317–336.
- , . Five things to know about Wernicke's Encephalopathy: a medical emergency. CMAJ. 2013;186(8):E295.
- , , . Wernicke‐Korsakoff‐syndrome: under‐recognized and under‐treated. Psychosomatics. 2012;53(6):507–516.
- , , , , . Thiamine for Wernicke‐Korsakoff Syndrome in people at risk from alcohol abuse. Cochrane Database Syst Rev. 2004;(1):CD004033.
- , , , , . Thiamine for prevention and treatment of Wernicke‐Korsakoff Syndrome in people who abuse alcohol. Cochrane Database Syst Rev. 2013;7:CD004033.
- , , . Thiamine Treatment and working memory function of alcohol‐dependent people: preliminary findings. Alcohol Clin Exp Res. 2001;25(1):112–116.
- , , , . Myths and misconceptions of Wernicke's encephalopathy: what every emergency physician should know. Ann Emerg Med. 2007;50(6):715–721.
- , . Wernicke's Encephalopathy: The clinical features and their probable relationship to vitamin B deficiency. Q J Med. 1941;10:(37):41–64.
- , , . Patterns of 35S‐thiamine hydrochloride absorption in the malnourished alcoholic patient. J Lab Clin Med. 1970;76(1):34–45.
- , , , . Thiamine propyl disulfide: absorption and utilization. Ann Intern Med. 1971;74(4):529–534.
- , . Parenteral thiamine and Wernicke's encephalopathy: the balance of risks and perception of concern. Alcohol Alcohol. 1997;32(3):207–209.
- , , , et al. Efficacy of vitamin supplementation in chronic alcoholics undergoing detoxification. Alcohol Alcohol Suppl. 1983;18:157–166.
- , , . Mechanisms of neuronal cell death in Wernicke's encephalopathy. Metab Brain Dis. 1998;13(2):97–122.
- , , , . Brain lactate synthesis in thiamine deficiency: a re‐evaluation using 1H‐13C nuclear magnetic resonance spectroscopy. J Neurosci Res. 2005;79(1‐2):33–41.
- , , . Pharmacokinetics of high‐dose oral thiamine hydrochloride in healthy subjects. BMC Clin Pharmacol. 2012;12(4):4.
- , , , et al. Simultaneous liquid chromatographic assessment of thiamine, thiamine monophosphate and thiamine diphosphate in human erythrocytes: a study on alcoholics. J Chromatogr B Analyt Technol Biomed Life Sci. 2003;789(2):355–363.
- , . Neuroimaging findings in acute Wernicke's encephalopathy: review of the literature. AJR Am J Roentgenol. 2009;192(2):501–508.
- , , , , . Beyond alcoholism: Wernicke‐Korsakoff syndrome in patients with psychiatric disorders. Cogn Behav Neurol. 2011;24(4):209–216.
- , , , , . Mental health status and gender as risk factors for onset of physical illness over 10 years. J Epidemiol Community Health. 2014;68(1):64–70.
- , , , , . The response to treatment of subclinical thiamine deficiency in the elderly. Am J Clin Nutr. 1997;66(4):925–928.
- , , . Thiamin and thiamin phosphate ester deficiency assessed by high performance liquid chromatography in four clinical cases of Wernicke's encephalopathy. Alcohol Clin Exp Res. 1993;17:712–716.
- . Prevention and treatment of Wernicke‐Korsakoff syndrome. Alcohol Alcohol Suppl. 2000;35(1):19–20.
- , , . Pabrinex prescribing in Scottish Emergency Departments. Poster presented at: Inaugural Scientific Conference of the College of Emergency Medicine; May 14–16, 2008; London, United Kingdom.
- , , , , , . Pharmacy‐based intervention in Wernicke's encephalopathy. Psychiatrist. 2010;34(6):234–238.
- , , . Time to act on the inadequate management of Wernicke's encephalopathy in the UK. Alcohol alcohol. Jan‐Feb 2013;48(1):4–8.
- , , , , . Malnutrition is prevalent in hospitalized medical patients: are housestaff identifying the malnourished patient? Nutrition. Apr 2006;22(4):350–354.
- , , , . Malnutrition among Hospitalized‐Patients ‐ a Problem of Physician Awareness. Archives of Internal Medicine. Aug 1987;147(8):1462–1465.
- , . BNF recommendations for the treatment of Wernicke's encephalopathy: lost in translation? Alcohol Alcohol. 2013;48(4):514–515.
- , , , , , . Reduction in medication errors in hospitals due to adoption of computerized provider order entry systems. J Am Med Inform Assoc. 2013;20(3):470–476.
- , . Is intravenous thiamine safe? Am J Emerg Med. 1992;10(2):165.
- , , . A toxicity study of parenteral thiamine hydrochloride. Ann Emerg Med. 1989;18(8):867–870.
- , , , , . Enough is enough: Stop wasting money on vitamin and mineral supplements. Ann Intern Med. 2013;159:850–851.
© 2015 Society of Hospital Medicine

Not a Textbook Case
A 25‐year‐old male presented to the emergency department with a 3‐day history of fever, chills, nausea, vomiting, diarrhea, and myalgias.
The acute onset, combination of vomiting and diarrhea, and systemic symptoms are most characteristic of an acute gastrointestinal infection, such as viral gastroenteritis (eg, Norovirus or Rotavirus) or bacterial enteritis (eg, nontyphoidal Salmonella, Campylobacter jejuni, or Escherichia coli). A careful exposure history, taking into account travel, diet, sick contacts, and living situation, can help prioritize the likelihood of a given pathogen, although treatment is generally supportive in the absence of severe dehydration, abdominal pain, or vital sign abnormalities. Vomiting and diarrhea can also be nonspecific responses to severe, nongastrointestinal infections, such as influenza or staphylococcal bacteremia. A drug or toxin could prompt an allergic or inflammatory response similar to the syndrome observed here. Due to the acuity, other categories of disease, such as autoimmunity, metabolic derangement, or malignancy, seem unlikely at this point.
Aside from being treated for Trichomonas vaginalis urethritis 2 months prior, the patient had been in good health and took no medications until the onset of these symptoms. Upon review of systems, he complained of a sore throat and odynophagia but denied cough or rhinorrhea. On examination, he appeared comfortable. His temperature was 39.2C, blood pressure 137/64 mm Hg, heart rate 92 beats per minute, and respiratory rate 16 breaths per minute. His arterial oxygen saturation was 97% while breathing ambient air. The posterior oropharynx was erythematous without exudates. There was no cervical lymphadenopathy. He was tender in the epigastric region without rebound or guarding. The white blood cell count was 6800/mm3, hemoglobin 10.0 g/dL with a mean corpuscular volume of 81 fL, and platelet count 224,000/mm3. The aspartate aminotransferase (AST) was 60 U/L (reference range 045 U/L), and the total bilirubin was 3.6 mg/dL; electrolytes, alanine aminotransferase, alkaline phosphatase, albumin, and the international normalized ratio were normal. Rapid antigen testing for influenza A and B were negative, and a rapid test for group A Streptococcal (GAS) antigen was positive.
Vomiting and abdominal tenderness are less typical in adults than in children with routine GAS pharyngitis. His odynophagia could reflect a retropharyngeal or peritonsillar abscess. Influenza assays have limited sensitivity and cannot reliably exclude acute infection, especially when the prevalence is high during influenza season. Epstein‐Barr virus (EBV)‐associated mononucleosis and acute human immunodeficiency virus (HIV) can cause acute pharyngitis and hepatitis, but the lymphadenopathy that is characteristic of both infections was absent. His recent trichomonas infection indicates that he may be at risk for sexually transmitted diseases, including HIV, gonorrhea, and syphilis.
His elevated bilirubin and AST along with vomiting, epigastric tenderness, and fevers raise the possibility of cholecystitis or cholangitis, which should be explored further with abdominal imaging. Mild AST elevation alone could be explained by muscle damage (given his myalgias), viral or bacterial invasion of the liver, or alcohol or other toxins, including acetaminophen, which he may be taking to treat his pain and fever.
The combination of anemia and hyperbilirubinemia should prompt consideration of hemolysis, but the anemia could also be explained by an underlying chronic disease (eg, HIV or hematologic malignancy), preexisting iron deficiency, or thalassemia.
He was given intravenous ceftriaxone in the emergency department. Penicillin, ondansetron, and omeprazole were prescribed, and he was discharged home. He never took the penicillin because a family member told him that his throat swelled up in the past when he took it. He continued to have malaise, diarrhea, myalgias, fatigue, and fevers to 38.9C. He returned to the emergency department 2 days later. His temperature was 38.6C, and his remaining vital signs were normal. His posterior oropharynx was erythematous and his sclerae icteric; his abdomen was soft, nontender, and nondistended, without hepatosplenomegaly. His hemoglobin was 8.8 g/dL, bilirubin 3.6 mg/dL without conjugated bilirubin present, lactate dehydrogenase (LDH) 3077 U/L (reference range 325750 U/L), and AST 126 U/L; blood urea nitrogen and creatinine were normal. He was admitted to the hospital.
The progression of his systemic symptoms for an additional 2 days in the absence of directed treatment for acute pharyngitis is not unusual. However, his anemia is progressive, with features highly suggestive of hemolysis, including indirect hyperbilirubinemia, elevated LDH, and elevated AST. The single dose of ceftriaxone is unlikely to have triggered drug‐induced immune hemolysis, and his anemia predates the antibiotic regardless. Fever can accompany hemolysis when a malignancy (eg, lymphoma) or autoimmune condition (eg, systemic lupus erythematosus) triggers immune‐mediated hemolytic anemia. Microangiopathic processes (eg, thrombotic thrombocytopenic purpura and disseminated intravascular coagulation) can be associated with fever because of the underlying mechanism or an untreated infection, respectively. Some pathogens, such as Plasmodium, Babesia, and Clostridium species, directly invade erythrocytes, leading to their destruction. He may have an underlying predisposition for hemolysis (eg, glucose‐6‐phosphate dehydrogenase [G6PD] deficiency) that has been unmasked in the setting of acute infection.
At admission, intravenous azithromycin was administered for GAS infection; peripheral blood cultures were sterile. His hemoglobin decreased to 7.3 g/dL. The reticulocyte count was 1.2%, and the direct antiglobulin test (DAT) was negative. A normochromic, normocytic anemia with blister and bite cells, rare microspherocytes, and echinocytes was seen on the peripheral blood smear (Figure 1). A chest radiograph was normal, and polymerase chain reaction (PCR) tests for parvovirus and EBV DNA in peripheral blood were negative. Neither parvovirus IgM antibodies nor HIV antibodies were present. The ferritin level was >33,000 ng/mL (reference range 20300 ng/mL), serum iron 87 g/dL (reference range 35180 g/dL), iron binding capacity 200 g/dL (reference range 240430 g/dL), and iron saturation index 44% (reference range 15%46%).

His ongoing fevers suggest an untreated infection, autoimmune condition, or malignancy. The depressed reticulocyte count is unexpected in the setting of hemolysis in a young and previously healthy patient, raising the prospect of his bone marrow harboring a hematologic malignancy or infection (eg, mycobacterial, fungal, or viral). Alternatively, an immune or infectious process may be impeding erythropoiesis (eg, pure red cell aplasia or parvovirus infection). Hyperferritinemia is nonspecific and suggests systemic inflammation, but is also associated with Still's disease, histoplasmosis, hemochromatosis, and hemophagocytic syndromes. Still's disease causes high fevers and pharyngitis but typically features leukocytosis and arthralgias, both of which are absent. Hemophagocytosis in adults is typically due to a hyperinflammatory response to an underlying infection or malignancy caused by uncontrolled proliferation of activated lymphocytes and macrophages secreting large amounts of inflammatory cytokines.
The peripheral blood smear does not demonstrate a leukoerythroblastic profile seen with an infiltrated marrow and similarly does not reveal schistocytes that would suggest a microangiopathic hemolytic anemia. Echinocytes are generally seen in uremic states, although they can occasionally be seen in hemolysis as well. The presence of microspherocytes suggests autoimmune hemolytic anemia but a negative DAT suggests the hemolysis is not immune‐mediated. Vitamin B12 deficiency can cause marked intramedullary hemolysis with hypoproliferation, and thus the vitamin B12 level should be checked, even though macrocytosis and neurologic abnormalities are absent. The blister and bite cells present on the peripheral blood smear signal oxidative hemolysis. Testing for G6PD deficiency should be performed, and if negative, should be repeated in the convalescent phase once red cells of all ages are again present.
Cytomegalovirus and HIV‐1 viral loads were undetectable in the blood by PCR testing. The vitamin B12 level was 456 pg/mL (reference range >210 pg/mL). A Heinz body preparation (Figure 2) showed Heinz bodies in 6% of erythrocytes. A bone marrow biopsy (Figure 3) showed a cellularity of 80% to 90% with erythroid and megakaryocytic hyperplasia, left‐shifted erythropoiesis, and complete trilineage maturation without evidence of hemophagocytosis or excess blasts. Blood cultures remained sterile, and the patient defervesced 30 hours after receiving his first dose of azithromycin.
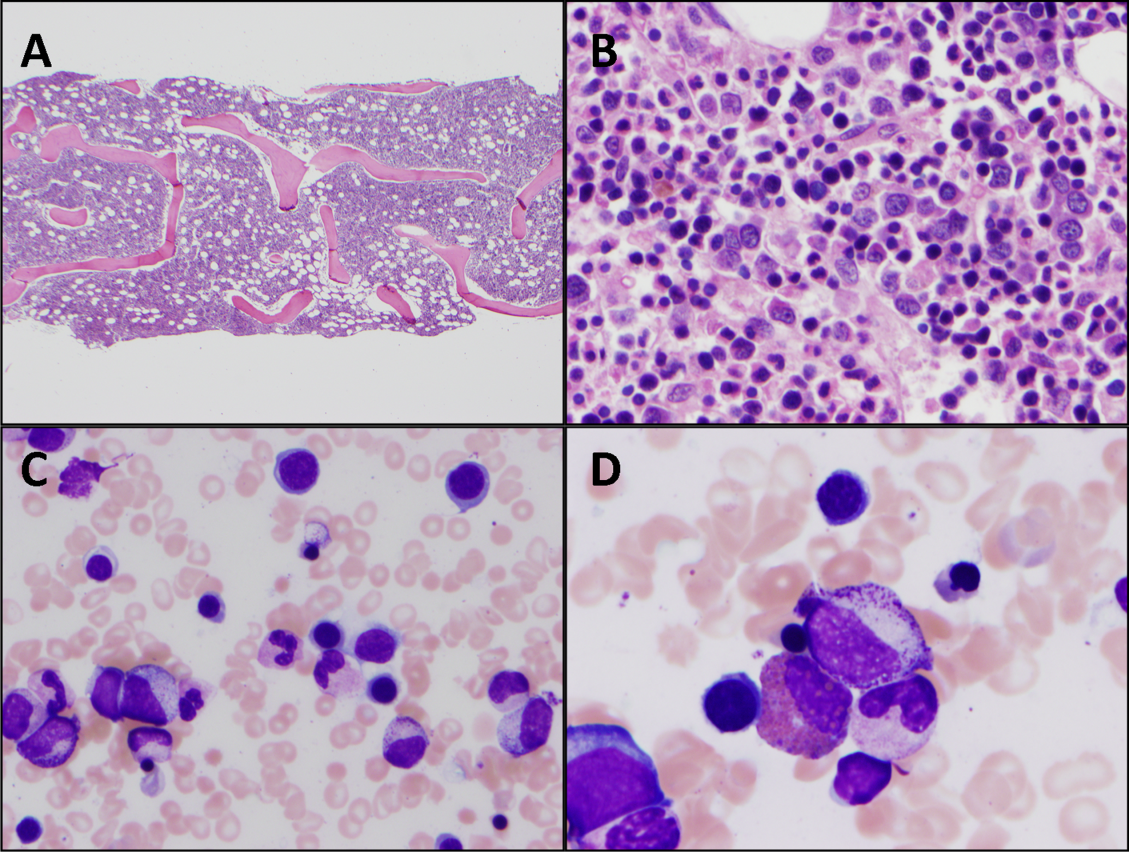
The vitamin B12 level is close to the lower limit of the normal range, and in light of the low reticulocyte count, warrants confirmation with methylmalonic acid and homocysteine measurement. The absence of macrocytic erythrocytes on his blood smear and megaloblastic changes in erythroid and myeloid precursors in the bone marrow make that nutritional deficiency less likely.
His marrow cellularity is high but near the upper range of normal given his age. Although his reticulocyte count is low, it appears that his bone marrow is starting to respond to his anemia, given the erythroid hyperplasia and left‐shifted erythropoiesis. The reticulocyte count should be repeated in 3 to 7 days, when it should be much higher.
Heinz bodies, which represent denatured hemoglobin, suggest that some erythrocytes have sustained oxidative stress that they could not defend against, typically because of a low G6PD level. Unstable hemoglobin variants are also vulnerable to oxidation. In addition, nonimmune causes of drug‐ and toxin‐induced hemolysis (eg, lead poisoning; Wilson's disease; or bites from insects, spiders, or snakes) should be considered.
It is possible that streptococcal pharyngitis triggered G6PD deficiency‐mediated hemolysis. Neither lymphoma nor hemophagocytosis was detected on the initial review of the bone marrow.
The hemoglobin decreased to 6.8 g/dL. One unit of packed red blood cells was transfused, and the next day the hemoglobin level was 7.8 g/dL. The family history was revisited, and the patient reported that a maternal uncle had G6PD deficiency. The G6PD activity was 3.2 U/g hemoglobin (reference range 7.020.5 U/g hemoglobin). One week later, the reticulocyte count was 16%, although the hemoglobin level remained relatively unchanged at 7.9 g/dL. The soluble interleukin‐2 receptor (sIL‐2R) level (sent to a reference laboratory during his hospitalization) was 1911 U/mL (reference range 451105 U/mL). At the 2‐week follow‐up appointment, his hemoglobin was 11.5 g/dL, LDH was 467 U/L, and ferritin was 277 ng/mL. Three months after his hospitalization, his hemolytic anemia had not recurred.
DISCUSSION
G6PD deficiency is the most common enzyme deficiency in humans, affecting more than 400 million people worldwide, with highest prevalence among Asian, African, and Mediterranean populations.[1] Oftentimes the characterization of an anemia as hemolytic and the identification of G6PD deficiency are straightforward. In this case, a more extensive evaluation was pursued on the basis of 2 conventional associations: reticulocytosis as an indicator of bone marrow response and the association of marked hyperferritinemia with a select group of diseases. More nuanced interpretation of these test results may have spared the patient a bone marrow biopsy and led to a less costly, more expeditious diagnosis.
One approach to anemia differentiates hypoproliferative anemias with an inappropriately low number of circulating reticulocytes for the degree of anemia (reflecting an inadequate bone marrow response) from regenerative anemias that have an appropriately elevated number of reticulocytes in circulation (reflecting adequate bone marrow response). This delineation can be a useful guide, but the variability of reticulocyte production, because of the presence of antibodies that inhibit erythroid colony forming units in the bone marrow,[2] viral infections,[3] or ineffective erythropoiesis,[4] can lead to misleading assumptions about the state of the bone marrow. In patients with G6PD deficiency, an increase in reticulocytes is often absent in the peripheral blood until 5 days after the acute onset of hemolysis and is not maximal until 7 to 10 days later.[5] Similarly, in a case series of patients with autoimmune hemolytic anemia, 37% of patients had an initial reticulocyte production index (RPI) 2, indicating hypoproliferation.[6] Of the 53% of these patients who underwent bone marrow examination, a majority (76%) showed erythroid hyperplasia despite the low RPI.[4] Malaria, the most prevalent worldwide cause of hemolytic anemia, can also present with relative reticulocytopenia. In 1 study, 75% of children with malaria‐related anemia had a reticulocyte production index 2.[7] These studies illustrate how classification of a patient's anemia solely on the basis of the reticulocyte count can lead to misdiagnosis.
In this case, the clinicians interpreted the low reticulocyte count as an indicator of a primary bone marrow disorder. The bone marrow biopsy instead demonstrated a brisk erythropoietic response that was not yet reflected in the peripheral blood. Given the absence of other cytopenias or myelophthisic findings on the peripheral smear and a strong suspicion of hemolysis, a reasonable approach would have been to instead repeat the reticulocyte count a few days into the evaluation to account for the transient lag in the bone marrow response to an acute episode of hemolysis. If the reticulocyte count remained suppressed 1 week later, it would have been appropriate to pursue a bone marrow biopsy at that time to investigate for a malignant, infectious, or nutritional etiology.
Iron studies revealed hyperferritinemia. This finding led the clinicians to consider HLH, a rare cause of multisystem organ failure and pancytopenia.[8] An elevated ferritin level (often in excess of 5000 ng/mL but at least >500 ng/mL) is a diagnostic criterion for HLH. However, the low probability of this rare condition is not meaningfully modified by hyperferritinemia, which has very limited specificity. In a case series of 23 patients with markedly elevated levels of serum ferritin (>10,000 ng/mL), malignancy, infection, liver disease, and chronic transfusions were common causes; there was 1 case of Still's disease and no cases of HLH.[9] In this case, the elevated ferritin and elevated sIL‐2R level, which was sent in response to the elevated ferritin to examine the remote possibility of HLH, reflected the inflammatory response to his GAS pharyngitis and acute hemolytic episode, not HLH.
G6PD deficiency leads to hemolysis due to an inability of the erythrocyte to resist oxidative stress. Drugs, including antimalarial, antibacterial, and other medications, are commonly considered major precipitants of G6PD deficiency‐mediated hemolysis.[1] However, a case series of patients with G6PD deficiency‐related hemolysis showed that most episodes were related to infection alone (53%, most commonly pneumonia) or to infection and drug therapy in combination (15%). Drug therapy alone accounted for only 32% of cases.[10] Another case series found infection caused nearly all cases of G6PD deficiency‐related hemolysis in children.[11] These findings suggest that clinicians should not implicate drugs as the cause of G6PD deficiency‐associated hemolysis unless infection has been excluded. One study demonstrated that infection with Streptococcus pneumoniae can lead to G6PD‐related hemolysis due to oxidative damage of red blood cells from binding of immune complexes to the red blood cell membrane.[12] An association between ‐hemolytic streptococcal pharyngitis and G6PD‐mediated hemolysis has been reported.[13] In this patient, G6PD‐related hemolysis was likely precipitated by his exaggerated inflammatory response to GAS pharyngitis.
Illness scripts are cognitive structures that allow clinicians to organize information about diseases into a useful framework for making clinical decisions.[14] Illness scripts are initially formed through our introduction to textbook cases, but they require constant revision throughout our careers to avoid reliance on outdated, incorrect, or biased information. Revision of illness scriptsthrough thoughtful reflection on patient casescreates more nuanced profiles of diseases and conditions that can be brought to bear on future cases. Through analysis of this case, clinicians will have the opportunity to update their illness scripts for anemia, reticulocytosis, hyperferritinemia, and G6PD‐associated hemolysis. When faced with similar cases, they will be better equipped to characterize anemia and avoid unnecessary testing (eg, sIL‐2R, bone marrow biopsy). This case reminds us that continual revision of our illness scripts is a cornerstone of delivering higher quality and less costly care for future patients.
TEACHING POINTS
- The reticulocyte count takes 7 to 10 days to peak in response to anemia. Classification of anemia solely based on an early reticulocyte count may lead to misdiagnosis.
- Hyperferritinemia in adults is most commonly seen in patients with malignancy, chronic transfusions, infection, and liver disease, and seldom signals a rare condition such as HLH or Still's disease.
- Infections are the most common triggers for G6PD‐related hemolysis and should be excluded diligently before ascribing the hemolysis to a drug.
Acknowledgements
The authors thank Wesley J. Miller, MD, for his review of an earlier version of the manuscript.
Disclosure: Nothing to report.
- . Glucose‐6‐phosphate dehydrogenase deficiency: a historical perspective. Blood. 2008;111(1):16–24.
- , , , , . Demonstration of two distinct antibodies in autoimmune hemolytic anemia with reticulocytopenia and red cell aplasia. Exp Hematol. 1984;12(10):788–793.
- , , . The acute and transient nature of idiopathic immune hemolytic anemia in childhood. J Pediatr. 1976;88(5):780–783.
- , , . Variability of the erythropoietic response in autoimmune hemolytic anemia: analysis of 109 cases. Blood. 1987;69(3):820–826.
- , , , , , . Mitigation of the haemolytic effect of primaquine and enhancement of its action against exoerythrocytic forms of the Chesson strain of Piasmodium vivax by intermittent regimens of drug administration: a preliminary report. Bull World Health Organ. 1960;22:621–631.
- . Characteristics of marrow production and reticulocyte maturation in normal man in response to anemia. J Clin Invest. 1969;48(3):443–453.
- , , , et al. Clinical predictors of severe malarial anaemia in a holoendemic Plasmodium falciparum transmission area. Br J Haematol. 2010;149(5):711–721.
- , , , et al. HLH‐2004: Diagnostic and therapeutic guidelines for hemophagocytic lymphohistiocytosis. Pediatr Blood Cancer 2007;48(2):124–131.
- , . Extreme hyperferritinaemia; clinical causes. J Clin Pathol. 2013;66(5):438–440.
- . Clinical spectrum of hemolytic anemia associated with glucose‐6‐phosphate dehydrogenase deficiency. Ann Intern Med. 1966;64(4):817.
- , . Severe hemolytic anemia in black children with glucose‐6‐phosphate dehydrogenase deficiency. Pediatrics. 1982;70(3):364–369.
- , , . G6PD‐deficiency infectious haemolysis: a complement dependent innocent bystander phenomenon. Br J Haematol. 1986;63(1):85–91.
- . Anemia during acute infections. Arch Intern Med. 1967;119(3):287.
- , , . Scripts and medical diagnostic knowledge: theory and applications for clinical reasoning instruction and research. Acad Med. 2000;75(2):182–190.
A 25‐year‐old male presented to the emergency department with a 3‐day history of fever, chills, nausea, vomiting, diarrhea, and myalgias.
The acute onset, combination of vomiting and diarrhea, and systemic symptoms are most characteristic of an acute gastrointestinal infection, such as viral gastroenteritis (eg, Norovirus or Rotavirus) or bacterial enteritis (eg, nontyphoidal Salmonella, Campylobacter jejuni, or Escherichia coli). A careful exposure history, taking into account travel, diet, sick contacts, and living situation, can help prioritize the likelihood of a given pathogen, although treatment is generally supportive in the absence of severe dehydration, abdominal pain, or vital sign abnormalities. Vomiting and diarrhea can also be nonspecific responses to severe, nongastrointestinal infections, such as influenza or staphylococcal bacteremia. A drug or toxin could prompt an allergic or inflammatory response similar to the syndrome observed here. Due to the acuity, other categories of disease, such as autoimmunity, metabolic derangement, or malignancy, seem unlikely at this point.
Aside from being treated for Trichomonas vaginalis urethritis 2 months prior, the patient had been in good health and took no medications until the onset of these symptoms. Upon review of systems, he complained of a sore throat and odynophagia but denied cough or rhinorrhea. On examination, he appeared comfortable. His temperature was 39.2C, blood pressure 137/64 mm Hg, heart rate 92 beats per minute, and respiratory rate 16 breaths per minute. His arterial oxygen saturation was 97% while breathing ambient air. The posterior oropharynx was erythematous without exudates. There was no cervical lymphadenopathy. He was tender in the epigastric region without rebound or guarding. The white blood cell count was 6800/mm3, hemoglobin 10.0 g/dL with a mean corpuscular volume of 81 fL, and platelet count 224,000/mm3. The aspartate aminotransferase (AST) was 60 U/L (reference range 045 U/L), and the total bilirubin was 3.6 mg/dL; electrolytes, alanine aminotransferase, alkaline phosphatase, albumin, and the international normalized ratio were normal. Rapid antigen testing for influenza A and B were negative, and a rapid test for group A Streptococcal (GAS) antigen was positive.
Vomiting and abdominal tenderness are less typical in adults than in children with routine GAS pharyngitis. His odynophagia could reflect a retropharyngeal or peritonsillar abscess. Influenza assays have limited sensitivity and cannot reliably exclude acute infection, especially when the prevalence is high during influenza season. Epstein‐Barr virus (EBV)‐associated mononucleosis and acute human immunodeficiency virus (HIV) can cause acute pharyngitis and hepatitis, but the lymphadenopathy that is characteristic of both infections was absent. His recent trichomonas infection indicates that he may be at risk for sexually transmitted diseases, including HIV, gonorrhea, and syphilis.
His elevated bilirubin and AST along with vomiting, epigastric tenderness, and fevers raise the possibility of cholecystitis or cholangitis, which should be explored further with abdominal imaging. Mild AST elevation alone could be explained by muscle damage (given his myalgias), viral or bacterial invasion of the liver, or alcohol or other toxins, including acetaminophen, which he may be taking to treat his pain and fever.
The combination of anemia and hyperbilirubinemia should prompt consideration of hemolysis, but the anemia could also be explained by an underlying chronic disease (eg, HIV or hematologic malignancy), preexisting iron deficiency, or thalassemia.
He was given intravenous ceftriaxone in the emergency department. Penicillin, ondansetron, and omeprazole were prescribed, and he was discharged home. He never took the penicillin because a family member told him that his throat swelled up in the past when he took it. He continued to have malaise, diarrhea, myalgias, fatigue, and fevers to 38.9C. He returned to the emergency department 2 days later. His temperature was 38.6C, and his remaining vital signs were normal. His posterior oropharynx was erythematous and his sclerae icteric; his abdomen was soft, nontender, and nondistended, without hepatosplenomegaly. His hemoglobin was 8.8 g/dL, bilirubin 3.6 mg/dL without conjugated bilirubin present, lactate dehydrogenase (LDH) 3077 U/L (reference range 325750 U/L), and AST 126 U/L; blood urea nitrogen and creatinine were normal. He was admitted to the hospital.
The progression of his systemic symptoms for an additional 2 days in the absence of directed treatment for acute pharyngitis is not unusual. However, his anemia is progressive, with features highly suggestive of hemolysis, including indirect hyperbilirubinemia, elevated LDH, and elevated AST. The single dose of ceftriaxone is unlikely to have triggered drug‐induced immune hemolysis, and his anemia predates the antibiotic regardless. Fever can accompany hemolysis when a malignancy (eg, lymphoma) or autoimmune condition (eg, systemic lupus erythematosus) triggers immune‐mediated hemolytic anemia. Microangiopathic processes (eg, thrombotic thrombocytopenic purpura and disseminated intravascular coagulation) can be associated with fever because of the underlying mechanism or an untreated infection, respectively. Some pathogens, such as Plasmodium, Babesia, and Clostridium species, directly invade erythrocytes, leading to their destruction. He may have an underlying predisposition for hemolysis (eg, glucose‐6‐phosphate dehydrogenase [G6PD] deficiency) that has been unmasked in the setting of acute infection.
At admission, intravenous azithromycin was administered for GAS infection; peripheral blood cultures were sterile. His hemoglobin decreased to 7.3 g/dL. The reticulocyte count was 1.2%, and the direct antiglobulin test (DAT) was negative. A normochromic, normocytic anemia with blister and bite cells, rare microspherocytes, and echinocytes was seen on the peripheral blood smear (Figure 1). A chest radiograph was normal, and polymerase chain reaction (PCR) tests for parvovirus and EBV DNA in peripheral blood were negative. Neither parvovirus IgM antibodies nor HIV antibodies were present. The ferritin level was >33,000 ng/mL (reference range 20300 ng/mL), serum iron 87 g/dL (reference range 35180 g/dL), iron binding capacity 200 g/dL (reference range 240430 g/dL), and iron saturation index 44% (reference range 15%46%).
His ongoing fevers suggest an untreated infection, autoimmune condition, or malignancy. The depressed reticulocyte count is unexpected in the setting of hemolysis in a young and previously healthy patient, raising the prospect of his bone marrow harboring a hematologic malignancy or infection (eg, mycobacterial, fungal, or viral). Alternatively, an immune or infectious process may be impeding erythropoiesis (eg, pure red cell aplasia or parvovirus infection). Hyperferritinemia is nonspecific and suggests systemic inflammation, but is also associated with Still's disease, histoplasmosis, hemochromatosis, and hemophagocytic syndromes. Still's disease causes high fevers and pharyngitis but typically features leukocytosis and arthralgias, both of which are absent. Hemophagocytosis in adults is typically due to a hyperinflammatory response to an underlying infection or malignancy caused by uncontrolled proliferation of activated lymphocytes and macrophages secreting large amounts of inflammatory cytokines.
The peripheral blood smear does not demonstrate a leukoerythroblastic profile seen with an infiltrated marrow and similarly does not reveal schistocytes that would suggest a microangiopathic hemolytic anemia. Echinocytes are generally seen in uremic states, although they can occasionally be seen in hemolysis as well. The presence of microspherocytes suggests autoimmune hemolytic anemia but a negative DAT suggests the hemolysis is not immune‐mediated. Vitamin B12 deficiency can cause marked intramedullary hemolysis with hypoproliferation, and thus the vitamin B12 level should be checked, even though macrocytosis and neurologic abnormalities are absent. The blister and bite cells present on the peripheral blood smear signal oxidative hemolysis. Testing for G6PD deficiency should be performed, and if negative, should be repeated in the convalescent phase once red cells of all ages are again present.
Cytomegalovirus and HIV‐1 viral loads were undetectable in the blood by PCR testing. The vitamin B12 level was 456 pg/mL (reference range >210 pg/mL). A Heinz body preparation (Figure 2) showed Heinz bodies in 6% of erythrocytes. A bone marrow biopsy (Figure 3) showed a cellularity of 80% to 90% with erythroid and megakaryocytic hyperplasia, left‐shifted erythropoiesis, and complete trilineage maturation without evidence of hemophagocytosis or excess blasts. Blood cultures remained sterile, and the patient defervesced 30 hours after receiving his first dose of azithromycin.
The vitamin B12 level is close to the lower limit of the normal range, and in light of the low reticulocyte count, warrants confirmation with methylmalonic acid and homocysteine measurement. The absence of macrocytic erythrocytes on his blood smear and megaloblastic changes in erythroid and myeloid precursors in the bone marrow make that nutritional deficiency less likely.
His marrow cellularity is high but near the upper range of normal given his age. Although his reticulocyte count is low, it appears that his bone marrow is starting to respond to his anemia, given the erythroid hyperplasia and left‐shifted erythropoiesis. The reticulocyte count should be repeated in 3 to 7 days, when it should be much higher.
Heinz bodies, which represent denatured hemoglobin, suggest that some erythrocytes have sustained oxidative stress that they could not defend against, typically because of a low G6PD level. Unstable hemoglobin variants are also vulnerable to oxidation. In addition, nonimmune causes of drug‐ and toxin‐induced hemolysis (eg, lead poisoning; Wilson's disease; or bites from insects, spiders, or snakes) should be considered.
It is possible that streptococcal pharyngitis triggered G6PD deficiency‐mediated hemolysis. Neither lymphoma nor hemophagocytosis was detected on the initial review of the bone marrow.
The hemoglobin decreased to 6.8 g/dL. One unit of packed red blood cells was transfused, and the next day the hemoglobin level was 7.8 g/dL. The family history was revisited, and the patient reported that a maternal uncle had G6PD deficiency. The G6PD activity was 3.2 U/g hemoglobin (reference range 7.020.5 U/g hemoglobin). One week later, the reticulocyte count was 16%, although the hemoglobin level remained relatively unchanged at 7.9 g/dL. The soluble interleukin‐2 receptor (sIL‐2R) level (sent to a reference laboratory during his hospitalization) was 1911 U/mL (reference range 451105 U/mL). At the 2‐week follow‐up appointment, his hemoglobin was 11.5 g/dL, LDH was 467 U/L, and ferritin was 277 ng/mL. Three months after his hospitalization, his hemolytic anemia had not recurred.
DISCUSSION
G6PD deficiency is the most common enzyme deficiency in humans, affecting more than 400 million people worldwide, with highest prevalence among Asian, African, and Mediterranean populations.[1] Oftentimes the characterization of an anemia as hemolytic and the identification of G6PD deficiency are straightforward. In this case, a more extensive evaluation was pursued on the basis of 2 conventional associations: reticulocytosis as an indicator of bone marrow response and the association of marked hyperferritinemia with a select group of diseases. More nuanced interpretation of these test results may have spared the patient a bone marrow biopsy and led to a less costly, more expeditious diagnosis.
One approach to anemia differentiates hypoproliferative anemias with an inappropriately low number of circulating reticulocytes for the degree of anemia (reflecting an inadequate bone marrow response) from regenerative anemias that have an appropriately elevated number of reticulocytes in circulation (reflecting adequate bone marrow response). This delineation can be a useful guide, but the variability of reticulocyte production, because of the presence of antibodies that inhibit erythroid colony forming units in the bone marrow,[2] viral infections,[3] or ineffective erythropoiesis,[4] can lead to misleading assumptions about the state of the bone marrow. In patients with G6PD deficiency, an increase in reticulocytes is often absent in the peripheral blood until 5 days after the acute onset of hemolysis and is not maximal until 7 to 10 days later.[5] Similarly, in a case series of patients with autoimmune hemolytic anemia, 37% of patients had an initial reticulocyte production index (RPI) 2, indicating hypoproliferation.[6] Of the 53% of these patients who underwent bone marrow examination, a majority (76%) showed erythroid hyperplasia despite the low RPI.[4] Malaria, the most prevalent worldwide cause of hemolytic anemia, can also present with relative reticulocytopenia. In 1 study, 75% of children with malaria‐related anemia had a reticulocyte production index 2.[7] These studies illustrate how classification of a patient's anemia solely on the basis of the reticulocyte count can lead to misdiagnosis.
In this case, the clinicians interpreted the low reticulocyte count as an indicator of a primary bone marrow disorder. The bone marrow biopsy instead demonstrated a brisk erythropoietic response that was not yet reflected in the peripheral blood. Given the absence of other cytopenias or myelophthisic findings on the peripheral smear and a strong suspicion of hemolysis, a reasonable approach would have been to instead repeat the reticulocyte count a few days into the evaluation to account for the transient lag in the bone marrow response to an acute episode of hemolysis. If the reticulocyte count remained suppressed 1 week later, it would have been appropriate to pursue a bone marrow biopsy at that time to investigate for a malignant, infectious, or nutritional etiology.
Iron studies revealed hyperferritinemia. This finding led the clinicians to consider HLH, a rare cause of multisystem organ failure and pancytopenia.[8] An elevated ferritin level (often in excess of 5000 ng/mL but at least >500 ng/mL) is a diagnostic criterion for HLH. However, the low probability of this rare condition is not meaningfully modified by hyperferritinemia, which has very limited specificity. In a case series of 23 patients with markedly elevated levels of serum ferritin (>10,000 ng/mL), malignancy, infection, liver disease, and chronic transfusions were common causes; there was 1 case of Still's disease and no cases of HLH.[9] In this case, the elevated ferritin and elevated sIL‐2R level, which was sent in response to the elevated ferritin to examine the remote possibility of HLH, reflected the inflammatory response to his GAS pharyngitis and acute hemolytic episode, not HLH.
G6PD deficiency leads to hemolysis due to an inability of the erythrocyte to resist oxidative stress. Drugs, including antimalarial, antibacterial, and other medications, are commonly considered major precipitants of G6PD deficiency‐mediated hemolysis.[1] However, a case series of patients with G6PD deficiency‐related hemolysis showed that most episodes were related to infection alone (53%, most commonly pneumonia) or to infection and drug therapy in combination (15%). Drug therapy alone accounted for only 32% of cases.[10] Another case series found infection caused nearly all cases of G6PD deficiency‐related hemolysis in children.[11] These findings suggest that clinicians should not implicate drugs as the cause of G6PD deficiency‐associated hemolysis unless infection has been excluded. One study demonstrated that infection with Streptococcus pneumoniae can lead to G6PD‐related hemolysis due to oxidative damage of red blood cells from binding of immune complexes to the red blood cell membrane.[12] An association between ‐hemolytic streptococcal pharyngitis and G6PD‐mediated hemolysis has been reported.[13] In this patient, G6PD‐related hemolysis was likely precipitated by his exaggerated inflammatory response to GAS pharyngitis.
Illness scripts are cognitive structures that allow clinicians to organize information about diseases into a useful framework for making clinical decisions.[14] Illness scripts are initially formed through our introduction to textbook cases, but they require constant revision throughout our careers to avoid reliance on outdated, incorrect, or biased information. Revision of illness scriptsthrough thoughtful reflection on patient casescreates more nuanced profiles of diseases and conditions that can be brought to bear on future cases. Through analysis of this case, clinicians will have the opportunity to update their illness scripts for anemia, reticulocytosis, hyperferritinemia, and G6PD‐associated hemolysis. When faced with similar cases, they will be better equipped to characterize anemia and avoid unnecessary testing (eg, sIL‐2R, bone marrow biopsy). This case reminds us that continual revision of our illness scripts is a cornerstone of delivering higher quality and less costly care for future patients.
TEACHING POINTS
- The reticulocyte count takes 7 to 10 days to peak in response to anemia. Classification of anemia solely based on an early reticulocyte count may lead to misdiagnosis.
- Hyperferritinemia in adults is most commonly seen in patients with malignancy, chronic transfusions, infection, and liver disease, and seldom signals a rare condition such as HLH or Still's disease.
- Infections are the most common triggers for G6PD‐related hemolysis and should be excluded diligently before ascribing the hemolysis to a drug.
Acknowledgements
The authors thank Wesley J. Miller, MD, for his review of an earlier version of the manuscript.
Disclosure: Nothing to report.
- . Glucose‐6‐phosphate dehydrogenase deficiency: a historical perspective. Blood. 2008;111(1):16–24.
- , , , , . Demonstration of two distinct antibodies in autoimmune hemolytic anemia with reticulocytopenia and red cell aplasia. Exp Hematol. 1984;12(10):788–793.
- , , . The acute and transient nature of idiopathic immune hemolytic anemia in childhood. J Pediatr. 1976;88(5):780–783.
- , , . Variability of the erythropoietic response in autoimmune hemolytic anemia: analysis of 109 cases. Blood. 1987;69(3):820–826.
- , , , , , . Mitigation of the haemolytic effect of primaquine and enhancement of its action against exoerythrocytic forms of the Chesson strain of Piasmodium vivax by intermittent regimens of drug administration: a preliminary report. Bull World Health Organ. 1960;22:621–631.
- . Characteristics of marrow production and reticulocyte maturation in normal man in response to anemia. J Clin Invest. 1969;48(3):443–453.
- , , , et al. Clinical predictors of severe malarial anaemia in a holoendemic Plasmodium falciparum transmission area. Br J Haematol. 2010;149(5):711–721.
- , , , et al. HLH‐2004: Diagnostic and therapeutic guidelines for hemophagocytic lymphohistiocytosis. Pediatr Blood Cancer 2007;48(2):124–131.
- , . Extreme hyperferritinaemia; clinical causes. J Clin Pathol. 2013;66(5):438–440.
- . Clinical spectrum of hemolytic anemia associated with glucose‐6‐phosphate dehydrogenase deficiency. Ann Intern Med. 1966;64(4):817.
- , . Severe hemolytic anemia in black children with glucose‐6‐phosphate dehydrogenase deficiency. Pediatrics. 1982;70(3):364–369.
- , , . G6PD‐deficiency infectious haemolysis: a complement dependent innocent bystander phenomenon. Br J Haematol. 1986;63(1):85–91.
- . Anemia during acute infections. Arch Intern Med. 1967;119(3):287.
- , , . Scripts and medical diagnostic knowledge: theory and applications for clinical reasoning instruction and research. Acad Med. 2000;75(2):182–190.
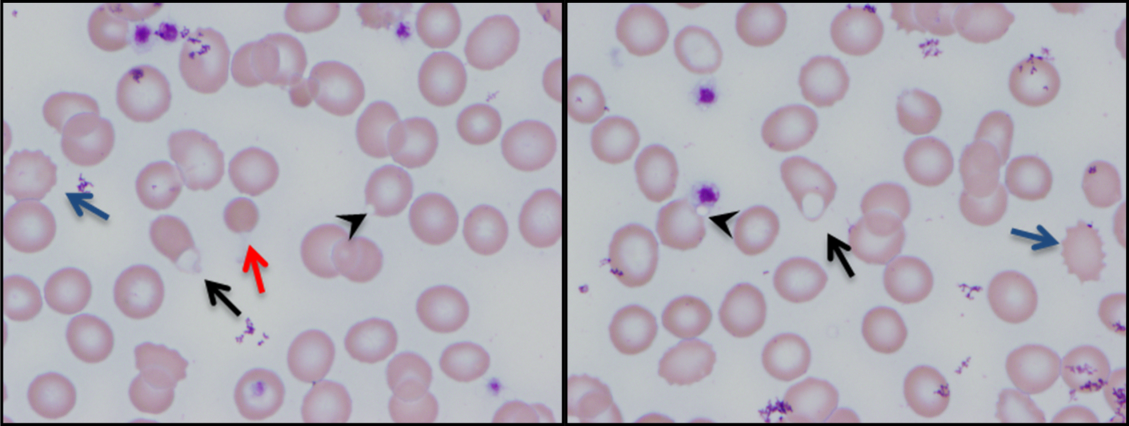
Regionalized trauma care trims 30-day mortality
LAKE BUENA VISTA, FLA. – Regionalized trauma care significantly reduces long-term mortality and maintains similar functional outcomes in patients with severe traumatic brain injury, a study showed.
Regionalization of trauma care is a health care strategy that attempts to improve outcomes for trauma patients by setting up a tiered, integrated system that aims to match the injured patient with the appropriate health care facility in a timely fashion. The Northern Ohio Trauma System (NOTS) was created in 2010 to manage trauma patients using the regionalization model.
In this study of outcomes in NOTS patients, longer-term follow-up of 3,496 severe traumatic brain injury (TBI) admissions showed 30-day mortality fell from 21% to 16% after regionalization (24% relative reduction; P value < .0001) and 6-month mortality declined from 24% to 20% (17% relative reduction; P = .004).

Multivariable logistic regression only strengthened the effect of regionalization on the primary outcome, lead study author Dr. Michael Kelly said at the annual scientific assembly of the Eastern Association for the Surgery of Trauma (EAST).
The odds ratio for 30-day mortality was 0.74, representing a 26% relative mortality reduction, and 0.82 for 6-month mortality, representing an 18% relative reduction.
At last year’s EAST meeting, Dr. Kelly and his colleagues reported that hospital mortality declined from 19% (262/1,359 patients) to 14% (302/2,137) in patients with severe TBI after the creation of the NOTS in 2010.
Despite bucking the current trend of rising mortality in hospitalized TBI patients, particularly those with severe brain injuries, their previous results were criticized by some as incomplete because hospital mortality was used without functional status measures or long-term mortality, he said.
To bridge the knowledge gap, the investigators identified all TBI patients older than 14 years with a Head Abbreviated Injury Scale (AIS) ≥ 3 from 2008 to 2012 in the NOTS database and matched them to the Ohio death index and the regional TBI rehabilitation database. Overall Functional Independence Measure (FIM) scores and FIM score gains were compared in 414 patients who were discharged to the regional TBI rehabilitation unit.
As a general rule of thumb, an overall FIM score of 60 is equivalent to 4 hours of personal care assistance in a nursing facility–type setting, a score of 80 equals 2 hours of personalized care in a nursing facility, more than 80 means the patient is able to receive family care at home, and ≥ 100 means minimal burdens in personal care, said Dr. Kelly of the MetroHealth Medical Center, Cleveland, and Cleveland Clinic.
A gain of 22 points is considered a minimal clinically important difference (MCID) for the overall FIM score. The MCID is 17 points for a FIM motor subscale gain, 3 for a FIM cognitive subscale gain, and has not been established for the FIM social subscale.
Overall FIM scores were similar before and after regionalization of trauma care (RT) at admission (54 vs. 48; P = .2) and at discharge (92 vs. 89; P = .1), he said.
FIM scores were similar in both groups at admission and discharge on the cognitive and social subscale domains, but were significantly lower post RT on the motor subscale at admission (38 vs. 31; P = .02) and discharge (68 vs. 65; P = .03). These differences were not clinically significant, according to Dr. Kelly and senior study author Dr. Jeffrey Claridge, NOTS medical director.
Pre- and post-RT patients had similar overall FIM score gains (37 vs. 36; P = .6), motor subscale gains (both groups 29), and social subscale gains (both groups 1). FIM cognitive subscale gains were significantly lower post RT (6 vs. 5; P = .01), but this difference was also not clinically significant.
Notably, discharges to regional TBI rehabilitation increased from 9% before RT to 14% after RT, Dr. Kelly said. The percentage of patients who were discharged to a skilled nurse facility or long-term care facility remained stable at about 30%, as did the percentage discharged home at about 40%.
“Regionalization improves long-term survival and maintains similar functional outcomes for patients with severe traumatic brain injury,” he concluded.

Discussant Dr. Jeffrey Coughenour of the University of Missouri Health System in Columbia said it appears regionalization is working, but added, “While we are saving more lives, what kind of lives are we saving? A question that has ever increasing implications for patients and payers evaluating the care we provide.”
He praised the investigators for using the FIM scale rather than the Glasgow Outcome Scale to try and answer this question, but said more information is needed on whether FIM scores improved in more challenging patients such as those with an AIS score of 4 or 5 or those entering rehabilitation after discharge to a skilled nursing or long-term care facility.
Data were not broken down for these more challenging subsets, Dr. Kelly said. The question of quality of life post regionalization was asked after the first study and that functional status was shown to be maintained in TBI patients in the follow-up study.
“Since no major changes in the hospital-based care or rehabilitation care of these TBI patients occurred, we weren’t surprised to see that functional outcomes did not improve,” he said in an interview. “The regionalization protocols were designed primarily to improve survival.”
During a discussion of the results, audience members questioned whether the investigators could be certain the results could be attributed to regionalization and not improvements in treatment of concurrent injuries or improvements in TBI treatment already underway at the time of policy change.
For the most part, these patients had isolated TBIs and no major changes in personnel or TBI care occurred during the study period, Dr. Kelly said.
Under NOTS, region-wide initiatives included use of the Centers for Disease Control and Prevention guidelines for field triage, a transfer line and transfer protocols, and a research database shared between two large hospital systems comprising the level I MetroHealth Medical Center trauma center, two level II trauma centers, and 12 nontrauma hospitals.
Dr. Kelly, his coauthors, and Dr. Coughenour reported no financial disclosures.
LAKE BUENA VISTA, FLA. – Regionalized trauma care significantly reduces long-term mortality and maintains similar functional outcomes in patients with severe traumatic brain injury, a study showed.
Regionalization of trauma care is a health care strategy that attempts to improve outcomes for trauma patients by setting up a tiered, integrated system that aims to match the injured patient with the appropriate health care facility in a timely fashion. The Northern Ohio Trauma System (NOTS) was created in 2010 to manage trauma patients using the regionalization model.
In this study of outcomes in NOTS patients, longer-term follow-up of 3,496 severe traumatic brain injury (TBI) admissions showed 30-day mortality fell from 21% to 16% after regionalization (24% relative reduction; P value < .0001) and 6-month mortality declined from 24% to 20% (17% relative reduction; P = .004).
Multivariable logistic regression only strengthened the effect of regionalization on the primary outcome, lead study author Dr. Michael Kelly said at the annual scientific assembly of the Eastern Association for the Surgery of Trauma (EAST).
The odds ratio for 30-day mortality was 0.74, representing a 26% relative mortality reduction, and 0.82 for 6-month mortality, representing an 18% relative reduction.
At last year’s EAST meeting, Dr. Kelly and his colleagues reported that hospital mortality declined from 19% (262/1,359 patients) to 14% (302/2,137) in patients with severe TBI after the creation of the NOTS in 2010.
Despite bucking the current trend of rising mortality in hospitalized TBI patients, particularly those with severe brain injuries, their previous results were criticized by some as incomplete because hospital mortality was used without functional status measures or long-term mortality, he said.
To bridge the knowledge gap, the investigators identified all TBI patients older than 14 years with a Head Abbreviated Injury Scale (AIS) ≥ 3 from 2008 to 2012 in the NOTS database and matched them to the Ohio death index and the regional TBI rehabilitation database. Overall Functional Independence Measure (FIM) scores and FIM score gains were compared in 414 patients who were discharged to the regional TBI rehabilitation unit.
As a general rule of thumb, an overall FIM score of 60 is equivalent to 4 hours of personal care assistance in a nursing facility–type setting, a score of 80 equals 2 hours of personalized care in a nursing facility, more than 80 means the patient is able to receive family care at home, and ≥ 100 means minimal burdens in personal care, said Dr. Kelly of the MetroHealth Medical Center, Cleveland, and Cleveland Clinic.
A gain of 22 points is considered a minimal clinically important difference (MCID) for the overall FIM score. The MCID is 17 points for a FIM motor subscale gain, 3 for a FIM cognitive subscale gain, and has not been established for the FIM social subscale.
Overall FIM scores were similar before and after regionalization of trauma care (RT) at admission (54 vs. 48; P = .2) and at discharge (92 vs. 89; P = .1), he said.
FIM scores were similar in both groups at admission and discharge on the cognitive and social subscale domains, but were significantly lower post RT on the motor subscale at admission (38 vs. 31; P = .02) and discharge (68 vs. 65; P = .03). These differences were not clinically significant, according to Dr. Kelly and senior study author Dr. Jeffrey Claridge, NOTS medical director.
Pre- and post-RT patients had similar overall FIM score gains (37 vs. 36; P = .6), motor subscale gains (both groups 29), and social subscale gains (both groups 1). FIM cognitive subscale gains were significantly lower post RT (6 vs. 5; P = .01), but this difference was also not clinically significant.
Notably, discharges to regional TBI rehabilitation increased from 9% before RT to 14% after RT, Dr. Kelly said. The percentage of patients who were discharged to a skilled nurse facility or long-term care facility remained stable at about 30%, as did the percentage discharged home at about 40%.
“Regionalization improves long-term survival and maintains similar functional outcomes for patients with severe traumatic brain injury,” he concluded.
Discussant Dr. Jeffrey Coughenour of the University of Missouri Health System in Columbia said it appears regionalization is working, but added, “While we are saving more lives, what kind of lives are we saving? A question that has ever increasing implications for patients and payers evaluating the care we provide.”
He praised the investigators for using the FIM scale rather than the Glasgow Outcome Scale to try and answer this question, but said more information is needed on whether FIM scores improved in more challenging patients such as those with an AIS score of 4 or 5 or those entering rehabilitation after discharge to a skilled nursing or long-term care facility.
Data were not broken down for these more challenging subsets, Dr. Kelly said. The question of quality of life post regionalization was asked after the first study and that functional status was shown to be maintained in TBI patients in the follow-up study.
“Since no major changes in the hospital-based care or rehabilitation care of these TBI patients occurred, we weren’t surprised to see that functional outcomes did not improve,” he said in an interview. “The regionalization protocols were designed primarily to improve survival.”
During a discussion of the results, audience members questioned whether the investigators could be certain the results could be attributed to regionalization and not improvements in treatment of concurrent injuries or improvements in TBI treatment already underway at the time of policy change.
For the most part, these patients had isolated TBIs and no major changes in personnel or TBI care occurred during the study period, Dr. Kelly said.
Under NOTS, region-wide initiatives included use of the Centers for Disease Control and Prevention guidelines for field triage, a transfer line and transfer protocols, and a research database shared between two large hospital systems comprising the level I MetroHealth Medical Center trauma center, two level II trauma centers, and 12 nontrauma hospitals.
Dr. Kelly, his coauthors, and Dr. Coughenour reported no financial disclosures.
AT THE EAST SCIENTIFIC ASSEMBLY
Key clinical point: Regionalized trauma care reduces long-term mortality and maintains functional outcomes in patients with severe TBI.
Major finding: RT reduced 30-day mortality from 21% to 16% (P < .0001) and 6-month mortality from 24% to 20% (P = .004).
Data source: Analysis of 3,496 patients with severe TBI.
Disclosures: Dr. Kelly, his coauthors, and Dr. Coughenour reported no financial disclosures.

Guideline clarifies first-line treatment for allergic rhinitis
First-line treatment for allergic rhinitis should include intranasal steroids, as well as less-sedating second-generation oral antihistamines for patients whose primary complaints are sneezing and itching, according to a new clinical practice guideline published online Feb. 2 in Otolaryngology–Head and Neck Surgery.
In contrast, sinonasal imaging should not be routine when patients first present with symptoms consistent with allergic rhinitis, and oral leukotriene receptor antagonists are not recommended as first-line therapy, said Dr. Michael D. Seidman of Henry Ford West Bloomfield (Mich.) Hospital and chair of the guideline working group, and his associates.

Dr. Seidman and a panel of 20 experts in otolaryngology, allergy and immunology, internal medicine, family medicine, pediatrics, sleep medicine, advanced practice nursing, complementary and alternative medicine, and consumer advocacy developed the new practice guideline to enable clinicians in all settings to improve patient care and reduce harmful or unnecessary variations in care for allergic rhinitis.
“The guideline is intended to focus on a limited number of quality improvement opportunities deemed most important by the working group and is not intended to be a comprehensive reference for diagnosing and managing allergic rhinitis,” the authors noted.
During the course of 1 year, the working group reviewed 1,605 randomized, controlled trials, 31 existing clinical practice guidelines, and 390 systematic reviews of the literature regarding allergic rhinitis in adults and children older than age 2 years. They then compiled 14 key recommendations that underwent extensive peer review, which have been published online and as a supplement to the February issue (Otolaryngol. Head Neck Surg. 2015;152:S1-S43).
In addition to the recommendations noted above, the guideline advises:
* Clinicians should diagnose allergic rhinitis when patients present with a history and physical exam consistent with the disorder (including clear rhinorrhea, nasal congestion, pale discoloration of the nasal mucosa, and red, watery eyes) plus symptoms of nasal congestion, runny nose, itchy nose, or sneezing.
* Clinicians should perform and interpret (or refer patients for) specific IgE allergy testing for allergic rhinitis that doesn’t respond to empiric treatment, or when the diagnosis is uncertain, or when identifying the specific causative allergen would allow targeted therapy.
* Clinicians should assess diagnosed patients for associated conditions such as asthma, atopic dermatitis, sleep-disordered breathing, conjunctivitis, rhinosinusitis, and otitis media, and should document that in the medical record.
* Clinicians should offer (or refer patients for) sublingual or subcutaneous immunotherapy when allergic rhinitis doesn’t respond adequately to pharmacologic therapy.
* Clinicians may advise avoidance of known allergens or controlling the patient’s environment by such measures as removing pets, using air filtration systems, using dust-mite–reducing covers for bedding, and using acaricides.
* Clinicians may offer intranasal antihistamines for patients with seasonal, perennial or episodic allergic rhinitis.*
* Clinicians may offer (or refer patients for) reduction of the inferior turbinates for patients who have nasal airway obstruction or enlarged turbinates.
* Clinicians may offer (or refer patient for) acupuncture if they are interested in nonpharmacologic therapy.
*Clinicians may offer combination pharmacologic therapy in patients with allergic rhinitis who have inadequate response to pharmacologic monotherapy.
The working group offered no recommendations concerning herbal therapy for allergic rhinitis, because of the limited literature on those substances and concern about their safety.
The full text of the guideline and its supporting data are available free of charge at www.entnet.org. In addition, an algorithm of the guideline’s action statements and a table of common allergic rhinitis clinical scenarios are available as quick reference guides for clinicians.
The American Academy of Otolaryngology–Head and Neck Surgery Foundation funded the guideline. Dr. Seidman reported being medical director of the Scientific Advisory Board of Visalus, founder of the Body Language Vitamin, and holder of six patents related to dietary supplements, aircraft, and middle ear and brain implants. His associates reported ties to Acclarent/Johnson/Johnson, FirstLine Medical, GlaxoSmithKline, Intersect, MEDA, Medtronic, Merck, Mylan, Novartis, TEVA, Transit of Venus, Sanofi, Sunovion Pharmaceuticals, and WellPoint.
*Correction, 2/18/2015: An earlier version of this story misstated the guideline for the use of intranasal antihistamines.
First-line treatment for allergic rhinitis should include intranasal steroids, as well as less-sedating second-generation oral antihistamines for patients whose primary complaints are sneezing and itching, according to a new clinical practice guideline published online Feb. 2 in Otolaryngology–Head and Neck Surgery.
In contrast, sinonasal imaging should not be routine when patients first present with symptoms consistent with allergic rhinitis, and oral leukotriene receptor antagonists are not recommended as first-line therapy, said Dr. Michael D. Seidman of Henry Ford West Bloomfield (Mich.) Hospital and chair of the guideline working group, and his associates.
Dr. Seidman and a panel of 20 experts in otolaryngology, allergy and immunology, internal medicine, family medicine, pediatrics, sleep medicine, advanced practice nursing, complementary and alternative medicine, and consumer advocacy developed the new practice guideline to enable clinicians in all settings to improve patient care and reduce harmful or unnecessary variations in care for allergic rhinitis.
“The guideline is intended to focus on a limited number of quality improvement opportunities deemed most important by the working group and is not intended to be a comprehensive reference for diagnosing and managing allergic rhinitis,” the authors noted.
During the course of 1 year, the working group reviewed 1,605 randomized, controlled trials, 31 existing clinical practice guidelines, and 390 systematic reviews of the literature regarding allergic rhinitis in adults and children older than age 2 years. They then compiled 14 key recommendations that underwent extensive peer review, which have been published online and as a supplement to the February issue (Otolaryngol. Head Neck Surg. 2015;152:S1-S43).
In addition to the recommendations noted above, the guideline advises:
* Clinicians should diagnose allergic rhinitis when patients present with a history and physical exam consistent with the disorder (including clear rhinorrhea, nasal congestion, pale discoloration of the nasal mucosa, and red, watery eyes) plus symptoms of nasal congestion, runny nose, itchy nose, or sneezing.
* Clinicians should perform and interpret (or refer patients for) specific IgE allergy testing for allergic rhinitis that doesn’t respond to empiric treatment, or when the diagnosis is uncertain, or when identifying the specific causative allergen would allow targeted therapy.
* Clinicians should assess diagnosed patients for associated conditions such as asthma, atopic dermatitis, sleep-disordered breathing, conjunctivitis, rhinosinusitis, and otitis media, and should document that in the medical record.
* Clinicians should offer (or refer patients for) sublingual or subcutaneous immunotherapy when allergic rhinitis doesn’t respond adequately to pharmacologic therapy.
* Clinicians may advise avoidance of known allergens or controlling the patient’s environment by such measures as removing pets, using air filtration systems, using dust-mite–reducing covers for bedding, and using acaricides.
* Clinicians may offer intranasal antihistamines for patients with seasonal, perennial or episodic allergic rhinitis.*
* Clinicians may offer (or refer patients for) reduction of the inferior turbinates for patients who have nasal airway obstruction or enlarged turbinates.
* Clinicians may offer (or refer patient for) acupuncture if they are interested in nonpharmacologic therapy.
*Clinicians may offer combination pharmacologic therapy in patients with allergic rhinitis who have inadequate response to pharmacologic monotherapy.
The working group offered no recommendations concerning herbal therapy for allergic rhinitis, because of the limited literature on those substances and concern about their safety.
The full text of the guideline and its supporting data are available free of charge at www.entnet.org. In addition, an algorithm of the guideline’s action statements and a table of common allergic rhinitis clinical scenarios are available as quick reference guides for clinicians.
The American Academy of Otolaryngology–Head and Neck Surgery Foundation funded the guideline. Dr. Seidman reported being medical director of the Scientific Advisory Board of Visalus, founder of the Body Language Vitamin, and holder of six patents related to dietary supplements, aircraft, and middle ear and brain implants. His associates reported ties to Acclarent/Johnson/Johnson, FirstLine Medical, GlaxoSmithKline, Intersect, MEDA, Medtronic, Merck, Mylan, Novartis, TEVA, Transit of Venus, Sanofi, Sunovion Pharmaceuticals, and WellPoint.
*Correction, 2/18/2015: An earlier version of this story misstated the guideline for the use of intranasal antihistamines.
FROM OTOLARYNGOLOGY–HEAD AND NECK SURGERY
Key clinical point: First-line treatment for allergic rhinitis should include intranasal steroids and second-generation oral antihistamines, and should not include leukotriene receptor antagonists or sinonasal imaging studies.
Major finding: A panel of 20 experts took 1 year to review the literature and develop action items focusing on a limited number of quality improvement opportunities they deemed most important to improve patient care.
Data source: A review of 1,605 randomized, controlled trials, 31 sets of practice guidelines, and 390 systematic reviews regarding allergic rhinitis, and a compilation of 14 recommendations for managing the disorder.
Disclosures: The American Academy of Otolaryngology–Head and Neck Surgery Foundation funded the guideline. Dr. Seidman reported being medical director of the Scientific Advisory Board of Visalus, founder of the Body Language Vitamin, and holder of six patents related to dietary supplements, aircraft, and middle ear and brain implants. His associates reported ties to Acclarent/Johnson/Johnson, FirstLine Medical, GlaxoSmithKline, Intersect, MEDA, Medtronic, Merck, Mylan, Novartis, TEVA, Transit of Venus, Sanofi, Sunovion Pharmaceuticals, and WellPoint.

LISTEN NOW: Highlights of the February 2015 Issue of The Hospitalist
[audio mp3="http://www.the-hospitalist.org/wp-content/uploads/2015/01/2015-February-Hospitalist-Highlights.mp3"][/audio]
[audio mp3="http://www.the-hospitalist.org/wp-content/uploads/2015/01/2015-February-Hospitalist-Highlights.mp3"][/audio]
[audio mp3="http://www.the-hospitalist.org/wp-content/uploads/2015/01/2015-February-Hospitalist-Highlights.mp3"][/audio]
Society of Hospital Medicine's 2015 Annual Meeting Preview

And, naturally, SHM is planning hundreds of meetings with legislators and their staffers to spread the gospel of hospital medicine.
“I’ll be honest. I’m exhausted when I get back,” says course director Efren Manjarrez, MD, SFHM, but “it’s the most uplifting exhaustion you could ever have.”
Richard Quinn is a freelance writer in New Jersey.

Much Ado about Hospital Quality
I have reported previously on major incentive programs under Medicare and the Affordable Care Act that affect hospitals and, by extension, their affiliated hospitalists. I’d like to provide you with an update on these programs. The bad news is that hospitals have more revenue than ever that is at risk based on performance. The good news is that such risk, and its mitigation, centers on performance measures in the sweet spot of hospitalists and the teams they work with to improve patient care.

Hospital-Acquired Conditions
On Dec. 17, 2014, the Centers for Medicare and Medicaid Services (CMS) announced that 724 U.S. hospitals—the lowest quartile—will have 1% of their reimbursement docked effective Oct. 1, 2014, as part of the Hospital-Acquired Condition Reduction Program (HACRP). The HACRP is divided into the following domains:
- 35%, Agency for Healthcare Research and Quality Patient Safety Indicators (PSI-90). This is a composite of eight claims-based harm measures.
- 65%, CDC National Health Safety Network measures. These are clinically derived metrics, currently central line-associated blood stream infection (CLABSI) and catheter-associated urinary tract infection (CAUTI).
The HACRP program, which debuted in October 2014, will continue at least through 2020. The 65% weight domain will change in FY16 with the addition of surgical site infections (colon, hysterectomy) and in FY17 with the addition of MRSA and Clostridium difficile infections.
The full list of U.S. hospitals and their performance in the HACRP and the Hospital Value-Based Purchasing (VBP) program is available at www.modernhealthcare.com/article/20141108/INFO/141109959.
Just two weeks prior to the CMS announcement, AHRQ announced some major accomplishments in efforts to address patient safety at U.S. hospitals. The agency reported that the number of hospital-acquired conditions in the Partnership for Patients (PfP) program in the U.S. declined 9% over a one-year period (2012 to 2013) and 17% over a three-year period (2010 to 2013). Hospital-acquired conditions are defined somewhat differently in the PfP than in the HACRP, with PfP targeting certain hospital-acquired infections, pressure ulcers, falls, and adverse drug effects.
The report noted that reductions in adverse drug events and pressure ulcers were the largest contributors to a reported 50,000 fewer in-hospital deaths over the 2010-2013 period.
Hospital Value-Based Purchasing
The Hospital VBP program continues to evolve. See Table 1 for a breakdown of the program for the next two years.
Unlike the HACRP and the Hospital Readmissions Reduction Program, which are pure penalty programs, VBP has hospitals at risk for 1.5% (for 2015) of Medicare payments, but they may earn back some, all, or an amount in excess of the 1.5% based on performance. For the years noted above, the VBP program metrics are as follows:
- Clinical Process: selected heart failure (HF), pneumonia (PN), myocardial infarction (MI), and surgical care measures.
- Patient Experience: a subset of the Hospital Consumer Assessment of Healthcare Providers and Systems (HCAHPS) survey questions.
- Outcomes: HF, PN, MI, 30-day mortality, CLABSI, and PSI-90.
- Efficiency: Medicare spending per beneficiary (spending from three days prior to an inpatient hospital admission through 30 days after discharge)
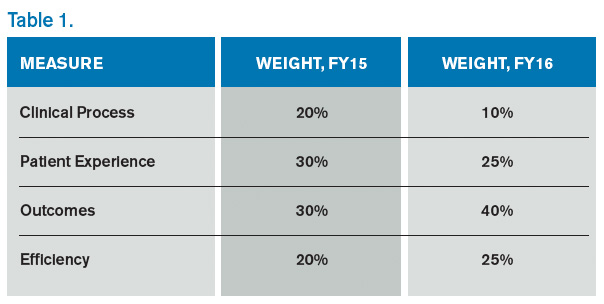
Readmission Penalties
CMS announced that in the latest round of the Hospital Readmissions Reduction Program, 2,610 hospitals were penalized in total, while 39 hospitals will receive the largest penalty allowed. For FY15, the program added chronic obstructive pulmonary disease and hip and knee arthroplasty to HF, PN, and MI as the conditions counting toward excess readmissions.
For FY15, the number of hospitals penalized and the amount of the penalty are expected to increase. In addition, 1% of hospitals are anticipated to receive the maximum penalty, while 77% are expected to have some penalty, and 22% will likely have no penalty. The maximum penalty has topped out at 3% of Medicare inpatient payments.
HCAHPS Star Ratings
The CMS Hospital Compare website will debut ‘star ratings’ in April 2015 to make it easier for consumers to decipher the site’s information. In a format similar to the one used by Nursing Home Compare, the website will use a five-star rating system based on the 11 publicly reported HCAHPS measures. The initial ratings will be based on discharges during the period ranging from July 2013 through June 2014.
What’s a Hospitalist to Do?
The latest version of CMS incentive programs should serve to reinforce your hospital medicine group’s strategy to be agents of collaboration and change. Link up with your quality department to align priorities, and make sure you have hospitalist representatives on key patient safety, patient experience, and quality improvement committees.
Because dollars are at stake for your hospital, have a clear understanding of the value your hospitalist group brings to the table, so you can secure the appropriate financial support for the time and work expended on these initiatives.
And don’t forget to keep the patient at the center of your efforts.

I have reported previously on major incentive programs under Medicare and the Affordable Care Act that affect hospitals and, by extension, their affiliated hospitalists. I’d like to provide you with an update on these programs. The bad news is that hospitals have more revenue than ever that is at risk based on performance. The good news is that such risk, and its mitigation, centers on performance measures in the sweet spot of hospitalists and the teams they work with to improve patient care.
Hospital-Acquired Conditions
On Dec. 17, 2014, the Centers for Medicare and Medicaid Services (CMS) announced that 724 U.S. hospitals—the lowest quartile—will have 1% of their reimbursement docked effective Oct. 1, 2014, as part of the Hospital-Acquired Condition Reduction Program (HACRP). The HACRP is divided into the following domains:
- 35%, Agency for Healthcare Research and Quality Patient Safety Indicators (PSI-90). This is a composite of eight claims-based harm measures.
- 65%, CDC National Health Safety Network measures. These are clinically derived metrics, currently central line-associated blood stream infection (CLABSI) and catheter-associated urinary tract infection (CAUTI).
The HACRP program, which debuted in October 2014, will continue at least through 2020. The 65% weight domain will change in FY16 with the addition of surgical site infections (colon, hysterectomy) and in FY17 with the addition of MRSA and Clostridium difficile infections.
The full list of U.S. hospitals and their performance in the HACRP and the Hospital Value-Based Purchasing (VBP) program is available at www.modernhealthcare.com/article/20141108/INFO/141109959.
Just two weeks prior to the CMS announcement, AHRQ announced some major accomplishments in efforts to address patient safety at U.S. hospitals. The agency reported that the number of hospital-acquired conditions in the Partnership for Patients (PfP) program in the U.S. declined 9% over a one-year period (2012 to 2013) and 17% over a three-year period (2010 to 2013). Hospital-acquired conditions are defined somewhat differently in the PfP than in the HACRP, with PfP targeting certain hospital-acquired infections, pressure ulcers, falls, and adverse drug effects.
The report noted that reductions in adverse drug events and pressure ulcers were the largest contributors to a reported 50,000 fewer in-hospital deaths over the 2010-2013 period.
Hospital Value-Based Purchasing
The Hospital VBP program continues to evolve. See Table 1 for a breakdown of the program for the next two years.
Unlike the HACRP and the Hospital Readmissions Reduction Program, which are pure penalty programs, VBP has hospitals at risk for 1.5% (for 2015) of Medicare payments, but they may earn back some, all, or an amount in excess of the 1.5% based on performance. For the years noted above, the VBP program metrics are as follows:
- Clinical Process: selected heart failure (HF), pneumonia (PN), myocardial infarction (MI), and surgical care measures.
- Patient Experience: a subset of the Hospital Consumer Assessment of Healthcare Providers and Systems (HCAHPS) survey questions.
- Outcomes: HF, PN, MI, 30-day mortality, CLABSI, and PSI-90.
- Efficiency: Medicare spending per beneficiary (spending from three days prior to an inpatient hospital admission through 30 days after discharge)
Readmission Penalties
CMS announced that in the latest round of the Hospital Readmissions Reduction Program, 2,610 hospitals were penalized in total, while 39 hospitals will receive the largest penalty allowed. For FY15, the program added chronic obstructive pulmonary disease and hip and knee arthroplasty to HF, PN, and MI as the conditions counting toward excess readmissions.
For FY15, the number of hospitals penalized and the amount of the penalty are expected to increase. In addition, 1% of hospitals are anticipated to receive the maximum penalty, while 77% are expected to have some penalty, and 22% will likely have no penalty. The maximum penalty has topped out at 3% of Medicare inpatient payments.
HCAHPS Star Ratings
The CMS Hospital Compare website will debut ‘star ratings’ in April 2015 to make it easier for consumers to decipher the site’s information. In a format similar to the one used by Nursing Home Compare, the website will use a five-star rating system based on the 11 publicly reported HCAHPS measures. The initial ratings will be based on discharges during the period ranging from July 2013 through June 2014.
What’s a Hospitalist to Do?
The latest version of CMS incentive programs should serve to reinforce your hospital medicine group’s strategy to be agents of collaboration and change. Link up with your quality department to align priorities, and make sure you have hospitalist representatives on key patient safety, patient experience, and quality improvement committees.
Because dollars are at stake for your hospital, have a clear understanding of the value your hospitalist group brings to the table, so you can secure the appropriate financial support for the time and work expended on these initiatives.
And don’t forget to keep the patient at the center of your efforts.
Hospitalists Lead Efforts To Reduce Care Costs, Improve Patient Care
In 2015, reimbursement for physicians in large groups is subject to a value modifier that takes into account the cost and quality of services performed under the Medicare Physician Fee Schedule. By 2017, the modifier will apply to all physicians participating in fee-for-service Medicare.
It’s one more way the Centers for Medicare and Medicaid Services (CMS) and the federal government are attempting to tip the scales on skyrocketing healthcare costs. Their end goal is a focus on better efficiency and less waste in the healthcare system.
But in an environment of top-down measures, hospitalists on the front lines are leading the charge to reduce overuse and overtreatment, slow cost growth, and improve both the quality of care and outcomes for their patients.
“I think the hospitalist movement has prided itself on quality improvement and patient safety in the hospital,” says Chris Moriates, MD, assistant clinical professor in the division of hospital medicine at the University of California San Francisco (UCSF) and co-creator of the cost awareness curriculum for UCSF’s internal medicine residents. “Over the last few years…they are more focused and enthusiastic about looking at value.”
Dr. Moriates leads the UCSF hospitalist division’s High Value Care Committee and is director of implementation initiatives at Costs of Care. He’s also part of a UCSF program that invites all employees to submit ideas for cutting waste in the hospital while maintaining or improving patient care quality. Last year, the winning project tackled unnecessary blood transfusions and at the same time realized $1 million in savings due to lower transfusion rates. This year, the hospital will focus on decreasing money spent on surgical supplies, potentially saving millions of dollars, he says.
A 2012 article in the Journal of the American Medical Association (JAMA) estimates wasteful spending costs the U.S. healthcare system at least $600 billion and potentially more than a trillion dollars annually due to such issues as care coordination and care delivery failures and overtreatment.1 Numerous studies also indicate overtreatment can lead to patient harm.2
“Say a patient gets a prophylactic scan for abdominal pain,” says Vineet Arora, MD, MAPP, a hospitalist on faculty in the University of Chicago’s department of medicine and director of education initiatives for Costs of Care. “The patient gets better, but an incidental finding of the scan is a renal mass. Now, there is a work-up of that mass, the patient gets a biopsy, and they have a bleed. A lot of testing leads to more testing, and more testing can lead to harm.”
—LeRoi S. Hicks, MD, MPH
Doing less is often better, says John Bulger, DO, MBA, SFHM, chief quality officer for the Geisinger Health System in Danville, Pa. Dr. Bulger, who has led SHM’s participation in the Choosing Wisely campaign, cites a September 2014 study in JAMA Internal Medicine, in which Christiana Care Health System—an 1,100-bed tertiary care center in northern Delaware—built best practice telemetry guidelines into its electronic ordering system to help physicians determine when monitoring was appropriate.3 The health system also assembled multidisciplinary teams, which identified when medications warranted telemetry, and equipped nurses with tools to determine when telemetry should be stopped.
Appropriate use of telemetry is one of SHM’s five Choosing Wisely recommendations for adult patient care.
In addition to an overall 70% reduction in telemetry use without negative impact to patient safety, Christiana Care saved $4.8 million. Throughout its inpatient units, Christiana Care utilizes a multidisciplinary team approach to coordinate patient care. Daily rounds are attended by hospitalists, nurses, pharmacists, case managers, social workers, and others to ensure timely and appropriate patient care. The health system’s Value Institute evaluates hospital efforts and assesses process design to improve efficiency and, ultimately, outcomes.
“This is preparing for war in a time of peace, essentially,” says LeRoi S. Hicks, MD, MPH, a hospitalist, researcher, and educator at Christiana Care. “The goal will be, as we move to bundled payment and population health approaches, to minimize the time patients spend in the hospitals and limit the growth curve in spending on the hospital side. We are doing this and not taking on financial risk.”
Dr. Hicks adds that in its most simple form the project “reduces variation in the care we deliver” while improving efficiency and outcomes.
For many physicians, the best way to start is to begin a dialogue with patients who might also be at risk of financial harm due to unnecessary care, Dr. Arora says. “Patients are willing to change their minds and go with the more affordable and more evidence-based treatment and forgo expensive ones if they have that conversation,” she says.
Many resources exist for physicians interested in driving the frontline charge to improve healthcare quality and value. The Costs of Care curriculum provides training and tools for physicians at teachingvalue.org, as do SHM’s Center for Quality Innovation and the Institute for Healthcare Improvement. Dr. Moriates and Dr. Arora also have co-authored a book, along with Neel Shah, MD, founder and executive director of Costs of Care, called “Understanding Value Based Healthcare.” The book will be available this spring.
“We shouldn’t sit by the side of the road waiting for things to pass by,” Dr. Arora says. “I think the key is, we know the needle is shifting in Washington, we know system innovation models are being tested. It would be silly for us to say we’re going to continue the status quo and not look at ways to contribute as physicians.”
Kelly April Tyrrell is a freelance writer in Madison, Wis.
References
- Berwick DM, Hackbarth AD. Eliminating waste in US health care. JAMA. 2012;307(14):1513-1516.
- Morgan DJ, Wright SM, Dhruva S. Update on medical overuse. JAMA Intern Med. 2015;175(1):120-124.
- Dressler R, Dryer MM, Coletti C, Mahoney D, Doorey AJ. Altering overuse of cardiac telemetry in non-intensive care unit settings by hardwiring the use of American Heart Association guidelines. JAMA Intern Med. 2014;174(11):1852-1854.