User login
Hospitalists Raise Healthcare Issues on Capitol Hill
NATIONAL HARBOR, Md.—Armed with blue folders chockablock with agendas, talking points, and fact sheets, about 100 hospitalists boarded three charter buses and descended on Capitol Hill last month like a swarm of erudite high schoolers on a class trip.
Clad in state-themed ties, suits, and dresses, the group’s goal was singular: Introduce the concept of hospital medicine to every senator, representative, and Congressional staffer who would take the time to meet them, and let those folks know that SHM and its members stand at the ready to serve as a resource for politicians.
“We don’t go to Washington and say, ‘You need to pay hospitalists more money,’” says SHM CEO Larry Wellikson, MD, MHM. “We go and we say, ‘You have a problem. We have a solution. Why don’t we work together to create the future?’ This is what people need to hear. This is a breath of fresh air, and that’s why we get invited back and we’re part of the discussion.”
This year’s discussion was formally titled Hospitalists on the Hill, version 2015. The turnout always improves when the annual meeting is just across the Potomac River at the Gaylord National Resort & Convention Center, as it has been for three of the past six years. The society ferried hospitalists to the offices of Washington power players with three goals this year:
- Push for support for the Improving Access to Medicare Coverage Act of 2015 (H.R. 1571 and S. 843), as it would adjust Medicare rules to allow observation status to be counted toward the three-day inpatient rule for coverage of care in skilled nursing facilities.
- Ask for support for the Personalize Your Care Act, a soon-to-be-reintroduced bill from U.S. Rep. Earl Blumenauer (D-Ore.) authorizing Medicare to pay for end-of-life care discussions and building in opportunities for patients to participate in their long-term care planning.
- Push for Congress to repeal the sustainable growth rate (SGR) formula and create a “pathway towards payment models that reward quality and efficiency.” This legislative “ask,” to use lobbying parlance, is an evergreen that has been an SHM priority for years.
Jodi Strong, director of operations at Novant Health, a 12-hospital group based in Charlotte, N.C., says that she joined this year’s advocacy pilgrimage for the first time because, in a time of generational upheaval in the American healthcare system, every voice should be heard.
“One vote does make a difference, and I want to be a part of that process,” she says, adding, “Hospitalists are very instrumental in the patient, the care that they receive, where they go after they’ve had a hospital visit, how they connect with the patient’s primary care physician.”
The trick of lobbying is getting those in power to see the world as those in practice do. It helps when the two are friends. H.E. “Chip” Walpole Jr., MS, MD, regional medical director of Select Medical of Greenville, S.C., has known U.S. Rep. Trey Gowdy (R-S.C.) for years. When they talk about medical issues, it helps the congressman get a stethoscope-on-the-ground view.

—H.E. “Chip” Walpole, Jr., MS, MD
“He’ll say, ‘I know I can trust Chip and he’ll give me a straight answer for a problem,’” Dr. Walpole says. “Then it’s about inviting them, to say ‘Hey, come and see. You want to learn a little bit more about what we do in the hospital? Come and see our facility.’”
And, while many first-time Hill Day attendees get nervous about trying to impress the Beltway, Dr. Walpole views it from the flip side.
“Any time you get to have face-to-face time with one of your Congressional leaders, whether it be a representative or senator, you talk to the people that actually directly influence and impact not only the work that we do, but the work that we do for our patients,” he says. “In that regard, we represent a voice for them, to explain to them who we are and what we do and what our patients’ needs are.
“They depend on us.”
That’s the message that Stephanie Vance, who founded Washington-based Advocacy Associates LLC, pushed as she prepped the laymen lobbyists for more than an hour before sending them off to their meetings. Vance, a 25-year veteran of the political scene, reminded hospitalists during the breakfast prep session that those in Congress are elected to serve—and that means they’re elected to listen.
Hospitalist Gordon Johnson, MD, FACP, FHM, got the message. He’s president of the SHM’s Oregon Chapter, but he had never done a lobbying trip like this before. The appeal was simple and effective to him.
“The more of us that are involved, the more meaningful it is,” he says. “When [members of Congress and their staffs] have people coming from their constituency, that carries a message. It does carry a stronger message.”
But, as with patient discharge, the message is always strongest with good follow-up. Vance, known to many as “the advocacy guru,” urged hospitalists to follow up after their meetings—an occasional phone call or e-mail to let the person know that, should they have any questions, a hospitalist is standing by to provide answers. To Dr. Walpole, a connection like that can be worth more than hiring a white-shoed lobbying firm.
“When you put a face with someone—‘Oh, I know Chip, I know Richard from back home,’—they make a connection with someone that is real and personal to them,” he says. “And, ultimately, that can probably make a bigger difference in influencing how they represent us than anything else.”
Richard Quinn is a freelance writer in New Jersey.
NATIONAL HARBOR, Md.—Armed with blue folders chockablock with agendas, talking points, and fact sheets, about 100 hospitalists boarded three charter buses and descended on Capitol Hill last month like a swarm of erudite high schoolers on a class trip.
Clad in state-themed ties, suits, and dresses, the group’s goal was singular: Introduce the concept of hospital medicine to every senator, representative, and Congressional staffer who would take the time to meet them, and let those folks know that SHM and its members stand at the ready to serve as a resource for politicians.
“We don’t go to Washington and say, ‘You need to pay hospitalists more money,’” says SHM CEO Larry Wellikson, MD, MHM. “We go and we say, ‘You have a problem. We have a solution. Why don’t we work together to create the future?’ This is what people need to hear. This is a breath of fresh air, and that’s why we get invited back and we’re part of the discussion.”
This year’s discussion was formally titled Hospitalists on the Hill, version 2015. The turnout always improves when the annual meeting is just across the Potomac River at the Gaylord National Resort & Convention Center, as it has been for three of the past six years. The society ferried hospitalists to the offices of Washington power players with three goals this year:
- Push for support for the Improving Access to Medicare Coverage Act of 2015 (H.R. 1571 and S. 843), as it would adjust Medicare rules to allow observation status to be counted toward the three-day inpatient rule for coverage of care in skilled nursing facilities.
- Ask for support for the Personalize Your Care Act, a soon-to-be-reintroduced bill from U.S. Rep. Earl Blumenauer (D-Ore.) authorizing Medicare to pay for end-of-life care discussions and building in opportunities for patients to participate in their long-term care planning.
- Push for Congress to repeal the sustainable growth rate (SGR) formula and create a “pathway towards payment models that reward quality and efficiency.” This legislative “ask,” to use lobbying parlance, is an evergreen that has been an SHM priority for years.
Jodi Strong, director of operations at Novant Health, a 12-hospital group based in Charlotte, N.C., says that she joined this year’s advocacy pilgrimage for the first time because, in a time of generational upheaval in the American healthcare system, every voice should be heard.
“One vote does make a difference, and I want to be a part of that process,” she says, adding, “Hospitalists are very instrumental in the patient, the care that they receive, where they go after they’ve had a hospital visit, how they connect with the patient’s primary care physician.”
The trick of lobbying is getting those in power to see the world as those in practice do. It helps when the two are friends. H.E. “Chip” Walpole Jr., MS, MD, regional medical director of Select Medical of Greenville, S.C., has known U.S. Rep. Trey Gowdy (R-S.C.) for years. When they talk about medical issues, it helps the congressman get a stethoscope-on-the-ground view.
—H.E. “Chip” Walpole, Jr., MS, MD
“He’ll say, ‘I know I can trust Chip and he’ll give me a straight answer for a problem,’” Dr. Walpole says. “Then it’s about inviting them, to say ‘Hey, come and see. You want to learn a little bit more about what we do in the hospital? Come and see our facility.’”
And, while many first-time Hill Day attendees get nervous about trying to impress the Beltway, Dr. Walpole views it from the flip side.
“Any time you get to have face-to-face time with one of your Congressional leaders, whether it be a representative or senator, you talk to the people that actually directly influence and impact not only the work that we do, but the work that we do for our patients,” he says. “In that regard, we represent a voice for them, to explain to them who we are and what we do and what our patients’ needs are.
“They depend on us.”
That’s the message that Stephanie Vance, who founded Washington-based Advocacy Associates LLC, pushed as she prepped the laymen lobbyists for more than an hour before sending them off to their meetings. Vance, a 25-year veteran of the political scene, reminded hospitalists during the breakfast prep session that those in Congress are elected to serve—and that means they’re elected to listen.
Hospitalist Gordon Johnson, MD, FACP, FHM, got the message. He’s president of the SHM’s Oregon Chapter, but he had never done a lobbying trip like this before. The appeal was simple and effective to him.
“The more of us that are involved, the more meaningful it is,” he says. “When [members of Congress and their staffs] have people coming from their constituency, that carries a message. It does carry a stronger message.”
But, as with patient discharge, the message is always strongest with good follow-up. Vance, known to many as “the advocacy guru,” urged hospitalists to follow up after their meetings—an occasional phone call or e-mail to let the person know that, should they have any questions, a hospitalist is standing by to provide answers. To Dr. Walpole, a connection like that can be worth more than hiring a white-shoed lobbying firm.
“When you put a face with someone—‘Oh, I know Chip, I know Richard from back home,’—they make a connection with someone that is real and personal to them,” he says. “And, ultimately, that can probably make a bigger difference in influencing how they represent us than anything else.”
Richard Quinn is a freelance writer in New Jersey.
Society of Hospital Medicine’s RIV Poster Contest Draws Best, Brightest
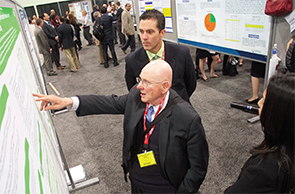
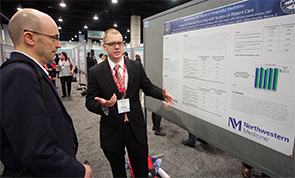
NATIONAL HARBOR, Md.—On one end of the cavernous exhibit hall space at HM15 stood Brendan Sullivan, OMS-II, a second-year medical student, practically grinning as he showcased his poster on the effects of bedside rounds with nurses. On the other side stood Donald Tashkin, MD, a pulmonologist who began his training in the 1960s and was talking like a younger man about his poster on drug therapies for exacerbated cases of COPD.
Both men were first-time presenters at SHM’s annual Research, Innovations, and Clinical Vignettes (RIV) poster competition. The contest has become one of the meeting’s most popular rites, growing so big it now spans two of the conference’s four days. This year’s competition drew a record 1,297 abstracts, topping the prior record of 1,132 and fully double the 634 abstracts submitted for HM10, according to SHM.
What makes the contest popular is that its posters are as varied as the presenters’ motives.
Take Sullivan, a student at Midwestern University Chicago College of Osteopathic Medicine in Downers Grove, Ill. His poster, “Examining the Future of Hospitalist Medicine: Impact of Bedside Rounding with Nurses on Patient Care,” served as his introduction to the specialty.
“You can see the tangible results [hospitalists] have,” he says. “Working with the nurses, the nurses recognize [hospitalists] as a continuous part of hospital life. It just seems like, as a field, there’s definitely a lot of opportunity for medical students like me, who want to go into internal medicine but [are] not really sure what aspect of internal medicine. Hospital medicine is definitely a very viable career option.”
Sullivan’s project came about because of work with his faculty mentor, a second-year hospitalist. At HM15, with the titans of the field walking around him, Sullivan showed his work off proudly but respectfully.
“It’s definitely a learning experience for me,” he says. “I’m just taking a backseat and soaking it all in. I realize that being one of the youngest and more inexperienced members here, I have a lot to learn .… I spent eight weeks in a field they’ve been doing for 20 years.”
But experience doesn’t mean a poster presenter has been here before. Dr. Tashkin, a veteran pulmonologist at UCLA’s David Geffen School of Medicine in Los Angeles, had never been to an SHM annual meeting. He presented two related posters on COPD drug therapies.
Where Sullivan was awed by the experience, Dr. Tashkin was in it for the academic stimulation that comes with bouncing medical ideas off of medical minds.
“It’s an intellectual enjoyment,” he says. “You can learn things when you talk to people, because they give you certain insights that you never thought of before. It’s not about ego; I’ll tell you that.”
Poster presenters say that a lot. The sharing of projects isn’t about adulation, they say. It’s about finding fellow hospitalists who are dealing with the kinds of issues that plague all hospital medicine groups. That’s why Greta Boynton, MD, SFHM, enjoys the RIV sessions.
“When you walk around and see all the great work that other people have done, most people are working on very similar things, like readmission rates or quality or [patient] satisfaction,” says Dr. Boynton, division chief of hospital medicine for Baystate Health in Springfield, Mass. “You get a lot of practical suggestions for things that you could implement in your own group.”
Dr. Boynton, regional medical director for the Northeast for Sound Physicians, has thought that for years, but this year she took the added step of presenting her first two posters. While showcasing one titled “Unit Medical Director as Career Development for Young Hospitalist,” she said years of seeing work similar to her own left her wondering why she didn’t present.
“I’ve done a lot of practice management and process improvement initiatives over the years, and I have not brought them forward here,” she says. “Then when you see other people working on similar things, you kind of kick yourself for not showing how you did it.”
So she did it. And now she’s glad she did.
“I feel proud of my hospitalist team,” Dr. Boynton says. “The fact that people are interested in it, the fact that they’re asking questions—practical questions on how it might look on a smaller team—very rewarding.”
Rehan Qayyum, MBBS, medical director of the academic hospitalist program at University of Tennessee College of Medicine in Chattanooga, Tenn., has found one reward particularly useful: peer review.
Over the course of roughly 10 posters presented over the years, he has used the comments of passersby to hone his writing skills. He is now transforming his poster, “Effect of HCAHPS Reporting Patient Satisfaction with Physicians,” into a paper he plans to publish.
The RIV session is free editing.
“They’re talking about what they think about how I should be looking at things that are not very clear, or things they may have interest in,” Dr. Qayyum says. “When I’m writing the discussion part or when I’m writing the methods and results part, I may focus on those [comments], add those parts, maybe. Or highlight those things in discussion where people show interest.
“I may be more focused in what I’m doing and may lose what may be important for other people. But being here and letting other people see my work and discuss it with me … that helps a lot.”
Richard Quinn is a freelance writer in New Jersey.
Just-In-Time CPR Training Studied in Pediatric Cardiopulmonary Arrest
Clinical question: Does the use of “just-in-time” (JIT) CPR training, with or without visual feedback (VisF), improve the quality of CPR in simulated pediatric cardiopulmonary arrest (CPA)?
Background: Rates of survival to discharge after in-hospital pediatric CPA range from 25%-50%, with three-quarters of survivors having good neurological outcomes.1 The quality of basic life support interventions has been found to be a critical factor influencing survival outcomes.1 Traditional basic life support (BLS) training has not been found to significantly increase compliance with 2010 AHA BLS Guidelines, however.2 Two recent advances have been found to improve the ability of CPR providers to estimate chest compression (CC) depth:
- JIT CPR training, where learners are given video-based training immediately before simulated CPA and
- real-time VisF, where learners are given feedback during CPR regarding rate and depth of CC by a small electronic device.
Visual CPR feedback devices used in recent studies are small (credit card-sized), are placed in the middle of the chest, and use accelerometer technology to provide real-time data regarding CC rate and depth. Prior studies utilizing VisF technology have found learners overestimate their compliance with target CC depth and rate.3
Study design: Prospective, randomized, 2 x 2 factorial-design trial.
Setting: Ten tertiary care teaching hospitals in the U.S. and Canada.
Synopsis: Researchers recruited participants from 10 tertiary care teaching hospitals that are part of the International Network for Simulation-Based Pediatric Innovation, Research, and Education (INSPIRE). Participants included medical students, resident/fellow physicians, nurses, and nurse practitioners. Participants were organized into teams of three, with one participant designated as team leader and two others assigned to perform CCs. Teams were then randomized into four arms as follows:
- Arm 1: No JIT / no VisF
- Arm 2: No JIT / + VisF
- Arm 3: + JIT / no VisF
- Arm 4: + JIT / + VisF
All participants watched a standard video orientation to the study, practiced CPR for two minutes, and participated in a pediatric septic shock simulation scenario (to minimize the Hawthorne effect of being videotaped). Depending on randomization, some teams received JIT CPR training prior to a simulated pediatric CPA scenario. Randomization also determined which teams would utilize a VisF device during CPR to give feedback regarding rate and depth of CCs. Actors were used to play roles of respiratory therapist and medication nurse, and all sites used standardized locations of defibrillator and medication cart.
Overall, quality of CPR was poor, but the JIT CPR training and VisF real-time feedback did result in improvement in CC depth and rate compliance:
- JIT CPR training resulted in a 20% absolute increase in CC depth compliance and a 12% increase in CC rate compliance;
- Real-time VisF resulted in a 15% absolute increase in CC depth compliance and a 40% absolute increase in CC rate compliance; and
- Use of both JIT CPR training and real-time VisF during CPA resulted in the highest rates of CC depth and rate compliance, but no significant interaction effect was observed.
Bottom line: Use of JIT CPR training prior to pediatric CPA and a real-time visual feedback device during CPR improves compliance with CC rate and depth guidelines during simulated pediatric CPA.
Citation: Cheng A, Brown LL, Duff JP. Improving cardiopulmonary resuscitation with a CPR feedback device and refresher simulations (CPR CARES study): a randomized clinical trial. JAMA Pediatr. 2015;169(2):137-144.

References
- Topjian AA, Nadkarni VM, Berg RA. Cardiopulmonary resuscitation in children. Curr Opin Crit Care. 2009;15(3):203-208.
- Sutton RM, Wolfe H, Nishisaki A. Pushing harder, pushing faster, minimizing interruptions but falling short of 2010 cardiopulmonary resuscitation targets during in-hospital pediatric and adolescent resuscitation. Resuscitation. 2013;84(12):1680-1684.
- Cheng A, Overly F, Kessler D, et al. Perception of CPR quality: influence of CPR feedback, Just-in-Time CPR training and provider role. Resuscitation. 2015;87: 44-50.
Clinical question: Does the use of “just-in-time” (JIT) CPR training, with or without visual feedback (VisF), improve the quality of CPR in simulated pediatric cardiopulmonary arrest (CPA)?
Background: Rates of survival to discharge after in-hospital pediatric CPA range from 25%-50%, with three-quarters of survivors having good neurological outcomes.1 The quality of basic life support interventions has been found to be a critical factor influencing survival outcomes.1 Traditional basic life support (BLS) training has not been found to significantly increase compliance with 2010 AHA BLS Guidelines, however.2 Two recent advances have been found to improve the ability of CPR providers to estimate chest compression (CC) depth:
- JIT CPR training, where learners are given video-based training immediately before simulated CPA and
- real-time VisF, where learners are given feedback during CPR regarding rate and depth of CC by a small electronic device.
Visual CPR feedback devices used in recent studies are small (credit card-sized), are placed in the middle of the chest, and use accelerometer technology to provide real-time data regarding CC rate and depth. Prior studies utilizing VisF technology have found learners overestimate their compliance with target CC depth and rate.3
Study design: Prospective, randomized, 2 x 2 factorial-design trial.
Setting: Ten tertiary care teaching hospitals in the U.S. and Canada.
Synopsis: Researchers recruited participants from 10 tertiary care teaching hospitals that are part of the International Network for Simulation-Based Pediatric Innovation, Research, and Education (INSPIRE). Participants included medical students, resident/fellow physicians, nurses, and nurse practitioners. Participants were organized into teams of three, with one participant designated as team leader and two others assigned to perform CCs. Teams were then randomized into four arms as follows:
- Arm 1: No JIT / no VisF
- Arm 2: No JIT / + VisF
- Arm 3: + JIT / no VisF
- Arm 4: + JIT / + VisF
All participants watched a standard video orientation to the study, practiced CPR for two minutes, and participated in a pediatric septic shock simulation scenario (to minimize the Hawthorne effect of being videotaped). Depending on randomization, some teams received JIT CPR training prior to a simulated pediatric CPA scenario. Randomization also determined which teams would utilize a VisF device during CPR to give feedback regarding rate and depth of CCs. Actors were used to play roles of respiratory therapist and medication nurse, and all sites used standardized locations of defibrillator and medication cart.
Overall, quality of CPR was poor, but the JIT CPR training and VisF real-time feedback did result in improvement in CC depth and rate compliance:
- JIT CPR training resulted in a 20% absolute increase in CC depth compliance and a 12% increase in CC rate compliance;
- Real-time VisF resulted in a 15% absolute increase in CC depth compliance and a 40% absolute increase in CC rate compliance; and
- Use of both JIT CPR training and real-time VisF during CPA resulted in the highest rates of CC depth and rate compliance, but no significant interaction effect was observed.
Bottom line: Use of JIT CPR training prior to pediatric CPA and a real-time visual feedback device during CPR improves compliance with CC rate and depth guidelines during simulated pediatric CPA.
Citation: Cheng A, Brown LL, Duff JP. Improving cardiopulmonary resuscitation with a CPR feedback device and refresher simulations (CPR CARES study): a randomized clinical trial. JAMA Pediatr. 2015;169(2):137-144.
References
- Topjian AA, Nadkarni VM, Berg RA. Cardiopulmonary resuscitation in children. Curr Opin Crit Care. 2009;15(3):203-208.
- Sutton RM, Wolfe H, Nishisaki A. Pushing harder, pushing faster, minimizing interruptions but falling short of 2010 cardiopulmonary resuscitation targets during in-hospital pediatric and adolescent resuscitation. Resuscitation. 2013;84(12):1680-1684.
- Cheng A, Overly F, Kessler D, et al. Perception of CPR quality: influence of CPR feedback, Just-in-Time CPR training and provider role. Resuscitation. 2015;87: 44-50.
Tips for Hospitalists to Understand, Promote Patient Satisfaction

Patient satisfaction—“the patient experience”—is given great weight by hospitals and the public alike. Physicians have always aspired to take excellent care of patients. What has changed is that assessments of the patient experience are now being used to measure and report the quality of our care. Although there are many venues for patients to share their opinions, including reviews and online ratings, only the HCAHPS (Hospital Consumer Assessment of Healthcare Providers and Systems) survey is standardized and allows for comparisons nationwide.
Given that HCAHPS is the standard by which hospitals, health systems, and individual hospitalists are judged, it is vital for us to understand the core drivers of measured patient experience—especially the factors within our control. Armed with this knowledge, we can more effectively promote a positive experience within our daily patient care.
Understanding HCAHPS
HCAHPS (H-caps) is a national, standardized, and publicly reported survey of patients’ experiences in the hospital. The Centers for Medicare and Medicaid Services (CMS) and the Agency for Healthcare Research and Quality (AHRQ) developed and piloted the survey in 2002 and launched it in October 2006, with results first published in March 2008 on the Hospital Compare website.
The survey must be administered to a random sample of hospital inpatients 48 hours to six weeks after discharge, and it is offered in multiple languages, either by phone or mail. Twenty-one core questions cover seven composites (communication with doctors, communication with nurses, responsiveness of hospital staff, pain control, communication about new medications, discharge information and planning, and cleanliness/quietness) and two global items (patients’ overall rating of the hospital and likelihood to recommend it to family and friends). There are several additional questions adjusting for patient mix between hospitals, as well as any supplementary questions desired by individual hospitals.1
With the exception of the two global items, all core HCAHPS questions ask “how often” a patient experienced a particular aspect of hospital care. Possible answers are “Always,” “Usually,” “Sometimes,” or “Never”; credit is given to the hospital only for a “top box” score of “Always.” The three questions that are most applicable to hospitalists make up the “communication with doctors” composite; they focus on the quality of physician-patient communication:
- During this hospital stay, how often did doctors treat you with courtesy and respect?
- During this hospital stay, how often did doctors listen carefully to you?
- During this hospital stay, how often did doctors explain things in a way you could understand?
Importance to Hospitalists
A tremendous amount is tied to HCAHPS scores: hospital reimbursement from CMS (through value-based purchasing), hospital rating and “brand,” patients’ choice of hospital, and, in some cases, hospitalist performance bonuses. Hospitals and health systems therefore emphasize HCAHPS heavily. This emphasis has sparked some controversy, particularly surrounding the risk that inappropriate medical decisions (e.g. prescribing antimicrobials or pain medications when not indicated) will be made in order to generate higher patient satisfaction scores. Given the evidence that physicians’ biomedical skill and interpersonal qualities are equally important in determining patient satisfaction, however, we can remain optimistic that time spent explaining the rationale for appropriate medical care is highly valued by patients.2,3
The more satisfied patients are with the care they receive, the more likely they are to continue to seek care from the same provider, hospital, and/or clinic. Improved continuity can help increase adherence, improve patient safety, and decrease healthcare costs. Positive healthcare experiences are also correlated with improved patient compliance with treatment regimens and medical advice, which will lead to better outcomes.
We must also recognize that both the patient experience and physician-patient communication impact clinical care. First, a positive patient experience is linked to higher continuity of care.4 The more satisfied patients are with the care they receive, the more likely they are to continue to seek care from the same provider, hospital, and/or clinic. Improved continuity can help increase adherence, improve patient safety, and decrease healthcare costs. Positive healthcare experiences are also correlated with improved patient compliance with treatment regimens and medical advice, which will lead to better outcomes.5,6
Additionally, higher patient satisfaction is associated with decreased readmission rates. An analysis of more than 2,500 hospitals demonstrated a statistically significant correlation between lower 30-day risk-standardized readmission rates, higher patient satisfaction with discharge planning, and higher overall patient satisfaction with care.7
Furthermore, high quality physician-patient communication has been linked to improved health outcomes. A meta-analysis of 21 separate studies evaluating the effect of communication on health outcomes demonstrated a direct positive correlation with five outcome measures—emotional health, symptom resolution, functional status, physiologic measures (blood pressure and glycemic control), and pain control.8
Finally, higher patient satisfaction and improved physician-patient communication are inversely correlated with medical malpractice risk.9,10
Current data regarding the effect of patient satisfaction on mortality and healthcare utilization/expenditures are conflicting. Jaipaul and Rosenthal found that higher patient satisfaction was associated with decreased mortality.11 Conversely, Fenton and colleagues found an association between high patient satisfaction and both increased mortality and higher healthcare utilization/costs.12 More long-term data will be helpful in clarifying this question.
For hospitalists, the importance of patient satisfaction might reach beyond its clinical impact. Both new residency graduates and more seasoned hospitalists will find that their personal HCAHPS scores can either be highlighted as a strength or work to their detriment when they apply for new positions. Many physicians find that they are asked about their patient satisfaction scores during job interviews. Being knowledgeable about both the patient experience and whether your patients perceive you positively can be an asset.
What Influences Patient Satisfaction, and How Do We Promote It?
Studies show that excellent medical care and strong interpersonal qualities are equally important influences on patients’ satisfaction with physicians.2,3 Having a high quality interaction with their doctor—during which patients feel that they are valued and listened to, that their opinions are taken into consideration, and that they have received a clear explanation—is more important to patients than having a lengthy visit with their provider.13
Consequently, interventions that focus on improving the humanistic aspects of our care and enhancing the quality of our communication will be the most effective strategies for improving patient satisfaction. Remembering to practice empathy for our patients in the midst of our very busy and stressful workdays is an excellent start. We can also utilize the following proven practices for enhancing physician-patient communication:
- Sit down at the bedside;
- Use patient-centered communication techniques, such as asking open-ended questions, using the teach-back method and shared decision-making, and avoiding jargon;
- Clearly outline the plan for the day and explain how it fits into the overall goal of the hospitalization;
- Invite questions; and
- Utilize patient whiteboards.
In addition, demonstrating to patients that we collaborate and effectively communicate with the rest of the healthcare team can also enhance their experience.
Final Thoughts
Ultimately, patient satisfaction should not be regarded as an extraneous amenity for our patients or as a necessary evil to placate hospital administrators. Instead, improving our patients’ hospital experience can help improve their overall care and health.
Strong physician-patient partnerships and high patient satisfaction increase continuity of care and adherence to treatment, while also resulting in better health outcomes and decreased hospital readmission rates. Furthermore, if hospitalists emphasize a positive patient experience by fostering effective communication and positive relationships, they can also decrease their malpractice risk.
We must therefore find ways to foster patient satisfaction while maintaining safe, effective, quality-driven patient care. Emphasizing humanism and communication, while providing safe and high quality care, is the optimal way to promote patient satisfaction. In this way, we can improve not only the patient experience but also health outcomes.
Dr. Bergin is an academic hospitalist for the internal medicine residency program at Banner-University Medical Center Phoenix in Arizona and a clinical assistant professor at the University of Arizona College of Medicine. Dr. O’Malley is the internal medicine residency program director at Banner and an assistant professor of medicine at the University of Arizona College of Medicine. She currently serves as SHM’s representative on the Alliance for Academic Internal Medicine’s Internal Medicine Education Redesign Advisory Board. Dr. Donahue is assistant professor of medicine at the University of Massachusetts Medical School in Worcester.
References
- Agency for Healthcare Research and Quality. HCAHPS Fact Sheet (CAHPS Hospital Survey) – August 2013. Available at: http://www.hcahpsonline.org/files/August_2013_HCAHPS_Fact_Sheet3.pdf. Accessed April 9, 2015.
- Matthews DA, Sledge WH, Lieberman PB. Evaluation of intern performance by medical inpatients. Am J Med. 1987;83(5):938-944.
- Matthews DA, Feinstein AR. A new instrument for patients’ ratings of physician performance in the hospital setting. J Gen Intern Med. 1989;4(1):14-22.
- Safran DG, Montgomery JE, Change H, Murphy J, Rogers WH. Switching doctors: Predictors of voluntary disenrollment from a primary physician’s practice. J Fam Pract. 2001;50(2):130-136.
- DeMatteo MR. Enhancing patient adherence to medical recommendations. JAMA. 1994:271(1):79, 83.
- Safran DG, Taira DA, Rogers WH, Kosinski M, Ware JE, Tarlov AR. Linking primary care performance to outcomes of care. J Fam Pract. 1998;47(3):213-220.
- Boulding W, Glickman SW, Manary MP, Schulman KA, Staelin R. Relationship between patient satisfaction with inpatient care and hospital readmission within 30 days. Am J Manag Care. 2011;17(1):41-48.
- Stewart MA. Effective physician-patient communication and health outcomes: a review. CMAJ. 1995;152(9):1423-1433.
- Tan SY. Issues in medical malpractice IX. Doctors most prone to lawsuits. Hawaii Med J. 2007;66(3):78-79.
- Beckman HB, Markakis KM, Suchman AL, Frankel RM. The doctor-patient relationship and malpractice: Lessons from plaintiff depositions. Arch Intern Med. 1994;154(12):1365-1370.
- Jaipaul CK, Rosenthal GE. Do hospitals with lower mortality have higher patient satisfaction? A regional analysis of patients with medical diagnoses. Am J Med Qual. 2003;18(2):59-65.
- Fenton JJ, Jerant AF, Bertakis KD, Franks P. The cost of satisfaction: a national study of patient satisfaction, health care utilization, expenditures, and mortality. Arch Intern Med. 2012;172(5):405-411.
- Blanden AR, Rohr RE. Cognitive interview techniques reveal specific behaviors and issues that could affect patient satisfaction relative to hospitalists. J Hosp Med. 2009;4(9):E1-6.
Pediatric Physicians React to Bronchiolitis Clinical Practice Guideline
Reading posts from multiple listservs is much like Cold War-era CIA monitoring of Russian phone calls—you have to scan through a lot of unrewarding material to find a nugget of interesting material. But that nugget, once found, can be a revelation.
Recently, the American Academy of Pediatrics (AAP) released an update to its clinical practice guideline (CPG) for bronchiolitis in Pediatrics. The 2011 incarnation had made concessions to the “do something” crowd, allowing for a “carefully monitored” trial of either albuterol or epinephrine, but the 2014 version quashed all hopes of pharmacologic intervention by eradicating that possibility.1 The AAPHOSPMED listserv, which goes out to the members of the AAP Section on Hospital Medicine, predictably bloomed with a flurry of entries opining about the 2014 guidelines, many of them from academic leaders in pediatric hospital medicine (PHM). But one entry, submitted by Scott Krugman, MD, chairman of pediatrics at MedStar Franklin Square Medical Center in Baltimore, caught my eye:
While the hospitalist medicine group celebrates, I’d thought I’d let you all in on the reaction from the Peds EM list serve (2 emails follow with redacted names….):
-----Original Message-----
Date: Thu, 30 Oct 2014 15:17:57 -0700
Subject: My name is Dr. Indigo Montoya, You Killed Albuterol…
...prepare to die.
In face of the recent AAP Guideline on the management of bronchiolitis, I am recruiting other Peds ED centers who will be endorsing this set of practices to serve as the treatment group in my non-randomized observational study. Our center will serve as the ‘out-of-control’ group and we will be initiating a new clinical pathway entitled... ‘Empiric therapy for the treatment of undifferentiated respiratory distress in infants.’
It is my hypothesis that our group’s admission and bounce-back rates will be the same as last year.
I anxiously await the data from the centers who adopt the AAP approach!
-----Original Message-----
Subject: Re: My name is Dr. Indigo Montoya, You Killed Albuterol…
From:
Reply-To:
Date: Thu, 30 Oct 2014 20:07:51 -0400
I am pretty sure it is Inigo Montoya.
Best movie ever.
How about this:
Trial of Duoneb
If you see a positive clinical response, great, if not...well...don’t give it anymore. If a very strong positive clinical response, consider steroids in addition. Can you believe I said that? I understand the studies for “traditional” bronchiolitis, I also understand there is a subset of these patients that I see that have a very favorable response to this treatment. I also see some variation to the response year by year. Have also heard and (think I have, as we have no rapid test for this) seen very good response with EV D68 to Albuterol + steroids.
Just Sayin...
At first read, I was surprised by the evident mastery of satirical humor manifested by our peds ED physician colleagues. Then it began to dawn on me that perhaps these comments were not purely in jest. But, then again, this is not so terribly inconceivable to any pediatric hospitalist—the ED is the last great bastion of nonstandardized medical practice (or maybe that’s the ICU). If any group of physicians were to thumb their noses at the AAP bronchiolitis CPGs, clearly they would be ED docs.
As I was vacillating between horror and indignant vexation, I began to realize that our peds ED colleagues are perhaps more intelligent than we give them credit for. Just the prior month, in the September 2014 issue of Journal of Pediatrics, a group of researchers, led by Vineeta Mittal, MD, associate professor of pediatrics at UT Southwestern in Dallas, had found that, despite the scholarly, evidence-based implementation of bronchiolitis guidelines across 28 U.S. children’s hospitals, these CPGs had not significantly moved the needle on ordering nonrecommended therapies and diagnostics.2 My only comfort was that Dr. Mittal had at least been able to lower the ordering of chest radiographs, bronchodilators, and steroids through the use of a bronchiolitis CPG at her own institution, Children’s Medical Center in Dallas, as described in the March 2014 issue of Pediatrics.3 Truly, Dr. Mittal, “you have a dizzying intellect!”
But the fact remains that PHM thought leaders, despite their best intentions and dedicated pursuit of research to improve bronchiolitis outcomes, have begun to alienate peds ED physicians and likely many pediatric hospitalists as well. In the Country of (Todd) Florin, MD, MSCE, otherwise known as Cincinnati Children’s Hospital ED, researchers led by Dr. Florin found that the release of the AAP bronchiolitis CPG in 2006 had not significantly changed the utilization of nonrecommended resources in bronchiolitis, despite the fact that use of these nonrecommended resources only increased length of stay without reducing readmission rates.4 Once again, we find that simply releasing high-minded CPGs without appropriate local multidisciplinary active implementation is as ill-fated as a land war in Asia.
Perhaps we shouldn’t be surprised that individuals trained for years to trust their gut feelings about the patient in front of them would begin to buck the tidal wave of regulation, oversight, and standardization that has begun to define how medicine is practiced in the 21st century. Many pediatric hospitalists and pediatric ED physicians would take issue with the outcomes cited by CPGs as not taking into account the therapeutic benefit of even short-term symptomatic improvements achieved through bronchodilators use. As Dr. Inigo Montoya might say, doctors have been in the thinking-independently business so long that, now that it’s over, they don’t know what to do with the rest of their lives.
Yet, is that really true? Have clinical pathways, practice guidelines, and high-minded academic pediatric hospitalists snuffed the life out of our quick-thinking, sword-wielding heroic physician?
Perhaps, but mostly dead is slightly alive.
I would posit, however, that our heroic physician, instead of viewing the local hospital’s creator of CPGs and clinical pathways as a condescending Prince Humperdinck, should consider him more of a Fezzik, who would do their heavy lifting for more mundane tasks, leading the charge against more worthy adversaries. Who wants to enter all those orders anyway?
For who could resist storming the castle of Kawasaki Disease? Hand-to-hand combat with metabolic defects? The Fire Swamp of PHM is still lurking with Diseases of Unusual Size that haven’t been tamed by AAP CPGs. Even our old nemesis, sepsis, has been found to be less susceptible to the arrows of early goal-directed therapy (EGDT) than we thought.5 By reporting in the October 16, 2014, issue of New England Journal of Medicine that EGDT may not reduce mortality in sepsis after all, fearless Aussie and Kiwi ARISE investigators may have opened a path for pediatric hospitalists and intensivists to follow in the battle against pediatric sepsis.
So, fear not, brave PHM warrior. There are still dragons to slay, ogres to battle, ED docs to debate as to whether to admit the kid with iocane poisoning. Do not worry about CPGs, and have fun storming the castle!
I would like to thank Drs. Scott Krugman, Jay Fisher, and Todd Zimmerman for giving their permission to reproduce their listserv posts, which inspired this column.
References
- Ralston SL, Lieberthal AS, Meissner HC, et al. Clinical practice guideline: the diagnosis, management, and prevention of bronchiolitis. Pediatrics. 2014;134(5):e1474-e1502.
- Mittal V, Hall M, Morse R, et al. Impact of inpatient bronchiolitis clinical practice guideline implementation on testing and treatment. J Pediatrics. 2014;165(3):570-576.e3.
- Mittal V, Darnell C, Walsh B, et al. Inpatient bronchiolitis guideline implementation and resource utilization. Pediatrics. 2014;133(3):e730-737.
- Florin TA, Byczkowski T, Ruddy RM, Zorc JJ, Test M, Shah SS. Variation in the management of infants hospitalized for bronchiolitis persists after the 2006 American Academy of Pediatrics bronchiolitis guidelines. J Pediatrics. 2014;165(4):786-792.e1.
- ARISE Investigators, ANZICS Clinical Trials Group, Peake SL, et al. Goal-directed resuscitation for patients with early septic shock. New Engl J Med. 2014;371(16):1496-1506.
HM15 Q&A: Why Is It Important That Hospitalists Be Agents of Change?
QUESTION: SHM CEO Larry Wellikson, MD, MHM, calls the country’s roughly 48,000 hospitalists “agents of change.” The Hospitalist asked HM15 why is it important that hospitalists be those people?

–Lorrie Saville, NP, assistant medical director, Carilion Roanoke Memorial Hospital, Roanoke, Va.

–Hospitalist Ahmed Farag, MD Rex Hospital, Raleigh, N.C.

–Hospitalist Zahra’a Salah, MD St. Mary Mercy Livonia Hospital, Livonia, Mich.

–Ajay Kumar, MD, MECP, FACP, SFHM, chief, Department of Medicine, Hartford Hospital, Hartford, Conn.
QUESTION: SHM CEO Larry Wellikson, MD, MHM, calls the country’s roughly 48,000 hospitalists “agents of change.” The Hospitalist asked HM15 why is it important that hospitalists be those people?
–Lorrie Saville, NP, assistant medical director, Carilion Roanoke Memorial Hospital, Roanoke, Va.
–Hospitalist Ahmed Farag, MD Rex Hospital, Raleigh, N.C.
–Hospitalist Zahra’a Salah, MD St. Mary Mercy Livonia Hospital, Livonia, Mich.
–Ajay Kumar, MD, MECP, FACP, SFHM, chief, Department of Medicine, Hartford Hospital, Hartford, Conn.
Mobile Apps Hot Topic for Technology-Minded Hospitalists
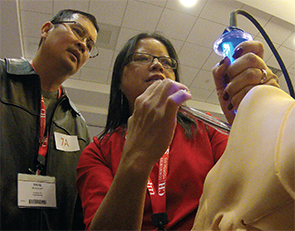
NATIONAL HARBOR, Md.—The conversation about hospitalists and technology can be pretty big. Rigmarole with rollout of an electronic health records (EHR) system is as much a rite of physician passage as Match Day. Administrators and C-suiters agonize over sprawling national initiatives (i.e., the Health Information Technology for Economic and Clinical Health [HITECH] Act of 2009) and the delayed implementation of the 10th revision of the International Statistical Classification of Diseases coding system (ICD-10). And there’s not an informatics officer in the country who doesn’t struggle with the term “meaningful use.”
Yet at HM15, one of the most interesting technology discussions wasn’t about the biggest of the big. In fact, it was about the smallest of the small: mobile applications, better known as apps. App usage on the ever-more-ubiquitous smartphones and tablets, used by patients and physicians alike, is a topic in its infancy. But hospitalist Roger Yu, MD, of Mayo Clinic in Rochester, Minn., says that hospitalists need to get ahead of the issue. He knows patients will soon start asking them more and more questions.
“Some of the older generation may not be savvy enough to utilize these apps themselves, but the next generation, who are these older patients’ caregivers, are savvy enough, and they are very facile with their use of mobile technology,” says Dr. Yu, who helped lead one of the annual meeting’s best attended workshops, “Dr. Hi Tech Hospitalist: Improving Quality and Value of Care Using Mobile Apps.”
“So we need to be able to advise them, because they will come to us as physicians thinking that we have expertise in this.”
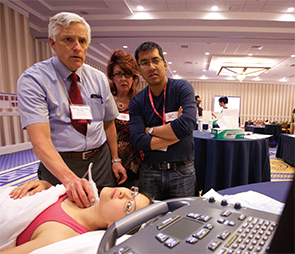
Anuj Dalal, MD, FHM, a hospitalist at Brigham and Women’s Hospital in Boston, says that one of the impediments to knowing the best apps is the pure size of the marketplace. There are some 44,000 applications related to healthcare. Although the bulk of those are consumer-related applications focused on diet, fitness, and personal health, many can be resources for hospitalists. But first, medical professionals need the marketplace to develop a reliable app certification process, Dr. Dalal says.
“They will provide [physicians’ board] certification, and patients will start relying on them for advice just as you would rely on Consumer Reports,” he says. “I think that will help individual providers and patients decide what is a good app and what is an effective app, which apps they should use and which apps they shouldn’t use.”
Of course, some physicians frustrated with regulation prefer to see the government stay out of technology in healthcare. The FDA currently reviews apps with direct ties to medical devices, but the remainder of the app marketplace is wide open for some entity to fill the certification void.
“I think there are a lot of people who are fearful of overregulation, but right now I think we’re at the point of underregulation,” Dr. Yu says. “There’s a sweet spot. I think if there is a standard that people can meet, companies can meet, technologies can meet, that’ll give a lot of structure and guidance to people who want to make their own apps.”
Part of the difficulty of vetting apps is what Cheng-Kai Kao, MD, medical director of informatics at the University of Chicago Medicine, calls the “hype cycle.”
“When it first shows up, there’s a lot of hype, there’s a lot of hope for the technology, and you [drill] down, and eventually you find what’s real,” he says. “We are looking for what are the things that we hope mobile apps can really do.”
Hospitalist Lisa Bonwell, MD, of Colorado Health Medical Group in Colorado Springs, sees discharge as one useful time to work with patients via applications. She believes many patients would find electronic instructions delivered through their smartphone or tablet more useful than the deluge of paperwork many now receive.
“When I discharge a patient from our system, they get a stack of papers,” she says. “I was recently a patient in the ER. I looked at that [stack of paperwork] and said, ‘There is nothing useful here. This is ridiculous.’
“I mean, it’s all this medical, legal stuff [patients] have to have, so I think that really turns off people. This would be much more usable to them.”
Richard Quinn is a freelance writer in New Jersey.
NATIONAL HARBOR, Md.—The conversation about hospitalists and technology can be pretty big. Rigmarole with rollout of an electronic health records (EHR) system is as much a rite of physician passage as Match Day. Administrators and C-suiters agonize over sprawling national initiatives (i.e., the Health Information Technology for Economic and Clinical Health [HITECH] Act of 2009) and the delayed implementation of the 10th revision of the International Statistical Classification of Diseases coding system (ICD-10). And there’s not an informatics officer in the country who doesn’t struggle with the term “meaningful use.”
Yet at HM15, one of the most interesting technology discussions wasn’t about the biggest of the big. In fact, it was about the smallest of the small: mobile applications, better known as apps. App usage on the ever-more-ubiquitous smartphones and tablets, used by patients and physicians alike, is a topic in its infancy. But hospitalist Roger Yu, MD, of Mayo Clinic in Rochester, Minn., says that hospitalists need to get ahead of the issue. He knows patients will soon start asking them more and more questions.
“Some of the older generation may not be savvy enough to utilize these apps themselves, but the next generation, who are these older patients’ caregivers, are savvy enough, and they are very facile with their use of mobile technology,” says Dr. Yu, who helped lead one of the annual meeting’s best attended workshops, “Dr. Hi Tech Hospitalist: Improving Quality and Value of Care Using Mobile Apps.”
“So we need to be able to advise them, because they will come to us as physicians thinking that we have expertise in this.”
Anuj Dalal, MD, FHM, a hospitalist at Brigham and Women’s Hospital in Boston, says that one of the impediments to knowing the best apps is the pure size of the marketplace. There are some 44,000 applications related to healthcare. Although the bulk of those are consumer-related applications focused on diet, fitness, and personal health, many can be resources for hospitalists. But first, medical professionals need the marketplace to develop a reliable app certification process, Dr. Dalal says.
“They will provide [physicians’ board] certification, and patients will start relying on them for advice just as you would rely on Consumer Reports,” he says. “I think that will help individual providers and patients decide what is a good app and what is an effective app, which apps they should use and which apps they shouldn’t use.”
Of course, some physicians frustrated with regulation prefer to see the government stay out of technology in healthcare. The FDA currently reviews apps with direct ties to medical devices, but the remainder of the app marketplace is wide open for some entity to fill the certification void.
“I think there are a lot of people who are fearful of overregulation, but right now I think we’re at the point of underregulation,” Dr. Yu says. “There’s a sweet spot. I think if there is a standard that people can meet, companies can meet, technologies can meet, that’ll give a lot of structure and guidance to people who want to make their own apps.”
Part of the difficulty of vetting apps is what Cheng-Kai Kao, MD, medical director of informatics at the University of Chicago Medicine, calls the “hype cycle.”
“When it first shows up, there’s a lot of hype, there’s a lot of hope for the technology, and you [drill] down, and eventually you find what’s real,” he says. “We are looking for what are the things that we hope mobile apps can really do.”
Hospitalist Lisa Bonwell, MD, of Colorado Health Medical Group in Colorado Springs, sees discharge as one useful time to work with patients via applications. She believes many patients would find electronic instructions delivered through their smartphone or tablet more useful than the deluge of paperwork many now receive.
“When I discharge a patient from our system, they get a stack of papers,” she says. “I was recently a patient in the ER. I looked at that [stack of paperwork] and said, ‘There is nothing useful here. This is ridiculous.’
“I mean, it’s all this medical, legal stuff [patients] have to have, so I think that really turns off people. This would be much more usable to them.”
Richard Quinn is a freelance writer in New Jersey.
Tips for Hospitalists on Finding, Working With Mentor
NATIONAL HARBOR, Md.—What do Harry Potter, Luke Skywalker, and Frodo Baggins have in common?
Vineet Arora, MD, MAPP, SFHM, said each of the big screen superstars had a great mentor. Dr. Arora’s HM15 session, “Making the Most of Your Mentoring Relationships,” looked at the qualities young hospitalists should seek out in a mentor. She also outlined skills and behaviors mentees should look to improve in themselves, in terms of connecting with a mentor and building relationships.
“You need to know yourself, your goals, your priorities,” said Dr. Arora, associate professor of medicine, assistant dean for scholarship and discovery, and director of the GME clinical learning environment innovation at the University of Chicago. “Mentorship is a partnership. If your mentor is always busy and traveling, and you need a lot of hand holding, that is not a great fit.”
Dr. Arora’s pep talk was part of a new educational track focused on young hospitalists that debuted at this year’s annual meeting. The track, coordinated by members of SHM’s Physicians in Training Committee, also included sessions on “How to Stand Out: Being the Best Applicant You Can Be,” “Getting to the Top of the Pile: Writing Your CV,” and “Quality and Safety for Residents and Students.”
The majority of the 100 or so in attendance at Dr. Arora’s talk were residents and academic hospitalists in the first few years of their career, but the crowd also included a few fellows and a handful of program directors.
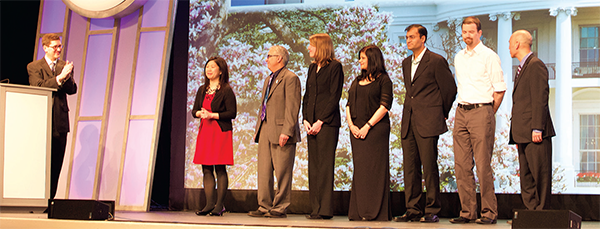
You Need a Hero
Using video clips featuring three of the most popular fictional characters of all time, Dr. Arora outlined some of the key characteristics young physicians should look for in mentors.
Yoda, for example, provided inspiration in “The Empire Strikes Back” by showing young Skywalker the impossible is possible. Yoda, the 500-year-old mentor, “used the force” to lift Skywalker’s X-Wing Fighter from the swamp. “He showed him that ‘this is doable,’” said Dr. Arora, a self-proclaimed movie buff. “That’s really half the battle, and it’s something you really want to think about.”
In a scene from “Harry Potter and the Prisoner of Azkaban,” veteran wizard Remus Lupin comforts the young sorcerer when he struggles to learn a new spell, the powerful Patronus charm. “I didn’t expect you to do it the first time,” Lupin told Potter. “That would have been remarkable.”
The teaching moment, Dr. Arora said, was that it is “OK to fail” and that good mentors are “going to pick you back up and help you.”
Mentors’ words—and how they say them—are important, too. At the end of the first “The Lord of the Rings” movie, little Frodo stood at the shore of a lake wondering if he could continue on his journey—“I wish the ring had never come to me; I wish none of this had happened,” he said. The next scene showed Frodo recalling the encouraging words of his friend and mentor, Gandalf: “So do all who have lived to see such times, but that is not for them to decide. All you will have to decide is what to do with the time that is given to you.”
“You thought your quality improvement project was bad? Talk to Frodo!” Dr. Arora quipped. “Support, empathy, easing the pain; these are very different mentoring functions than the technical quality of doing a project, or being capable.”
Comparing mentors to superheroes utilizing the acronym CAPE, Dr. Arora boiled it down to the qualities mentees should look for in their mentors:
- Capable: “If the mentor is not capable, they are not going to be a good mentor,” she said. “This is important; not everyone is capable of being a good mentor.”
- Available: “It’s easy to walk away from a project. A good mentor stays with you, show you how it works, and inspires you to work harder.”
- Project (or Passion): “You want to have a mentor who is going to teach you something you are interested in; otherwise you are not going to want to learn, and there is no inspiration.”
- Empathetic: “They must be empathetic, easy to get along with, able to ease the pain.”
Mentee Self-Assessment
Dr. Arora and her colleague, Valerie Press, MD, MPH, role-played a number of scenarios in which young hospitalists and trainees err in their relationships with mentors. These ranged from the dreaded “pop-in meeting” to e-mail etiquette to last-minute requests to review a CV or poster.
The scenarios rang true with Brandon Mauldin, MD, a third-year resident at Tulane University School of Medicine in New Orleans.
“I learned the errors of how I’ve approached my mentors in the past. I think I have been guilty of every one of the points she made,” said Dr. Mauldin, who attended the session to glean tips as he prepares for a career as an academic hospitalist. “Maybe not as much the drop-in meetings, but definitely the last-minute, ‘Hey, I have this poster due tomorrow. Can you help me edit it?’”
Dr. Mauldin’s mentor at Tulane, Deepa Bhatnagar, MD, also attended the session. In her fourth year as an academic hospitalist, Dr. Bhatnagar said she gleaned the most practical information from Dr. Arora’s final scenario, which focused on mentees doing their homework before selecting a mentor or joining a research project.
“Do not sign on the dotted line without consultation. Right? Do not buy a car without doing your homework,” Dr. Arora said. “Mentors want free labor, so beware.”
Dr. Arora said mentees should set reasonable expectations and focus broadly in selecting projects, as they “have their whole career to do the project you love; right now, do the project that works.” It was a tip that stuck.
“The successful project is a good takeaway: Find your interest, find a good mentor, but find a good project,” Dr. Bhatnagar said. “It’s better to zone in on a successful project, instead of taking on a project that might not be successful for you.”
Richard Quinn is a freelance writer in New Jersey.
NATIONAL HARBOR, Md.—What do Harry Potter, Luke Skywalker, and Frodo Baggins have in common?
Vineet Arora, MD, MAPP, SFHM, said each of the big screen superstars had a great mentor. Dr. Arora’s HM15 session, “Making the Most of Your Mentoring Relationships,” looked at the qualities young hospitalists should seek out in a mentor. She also outlined skills and behaviors mentees should look to improve in themselves, in terms of connecting with a mentor and building relationships.
“You need to know yourself, your goals, your priorities,” said Dr. Arora, associate professor of medicine, assistant dean for scholarship and discovery, and director of the GME clinical learning environment innovation at the University of Chicago. “Mentorship is a partnership. If your mentor is always busy and traveling, and you need a lot of hand holding, that is not a great fit.”
Dr. Arora’s pep talk was part of a new educational track focused on young hospitalists that debuted at this year’s annual meeting. The track, coordinated by members of SHM’s Physicians in Training Committee, also included sessions on “How to Stand Out: Being the Best Applicant You Can Be,” “Getting to the Top of the Pile: Writing Your CV,” and “Quality and Safety for Residents and Students.”
The majority of the 100 or so in attendance at Dr. Arora’s talk were residents and academic hospitalists in the first few years of their career, but the crowd also included a few fellows and a handful of program directors.
You Need a Hero
Using video clips featuring three of the most popular fictional characters of all time, Dr. Arora outlined some of the key characteristics young physicians should look for in mentors.
Yoda, for example, provided inspiration in “The Empire Strikes Back” by showing young Skywalker the impossible is possible. Yoda, the 500-year-old mentor, “used the force” to lift Skywalker’s X-Wing Fighter from the swamp. “He showed him that ‘this is doable,’” said Dr. Arora, a self-proclaimed movie buff. “That’s really half the battle, and it’s something you really want to think about.”
In a scene from “Harry Potter and the Prisoner of Azkaban,” veteran wizard Remus Lupin comforts the young sorcerer when he struggles to learn a new spell, the powerful Patronus charm. “I didn’t expect you to do it the first time,” Lupin told Potter. “That would have been remarkable.”
The teaching moment, Dr. Arora said, was that it is “OK to fail” and that good mentors are “going to pick you back up and help you.”
Mentors’ words—and how they say them—are important, too. At the end of the first “The Lord of the Rings” movie, little Frodo stood at the shore of a lake wondering if he could continue on his journey—“I wish the ring had never come to me; I wish none of this had happened,” he said. The next scene showed Frodo recalling the encouraging words of his friend and mentor, Gandalf: “So do all who have lived to see such times, but that is not for them to decide. All you will have to decide is what to do with the time that is given to you.”
“You thought your quality improvement project was bad? Talk to Frodo!” Dr. Arora quipped. “Support, empathy, easing the pain; these are very different mentoring functions than the technical quality of doing a project, or being capable.”
Comparing mentors to superheroes utilizing the acronym CAPE, Dr. Arora boiled it down to the qualities mentees should look for in their mentors:
- Capable: “If the mentor is not capable, they are not going to be a good mentor,” she said. “This is important; not everyone is capable of being a good mentor.”
- Available: “It’s easy to walk away from a project. A good mentor stays with you, show you how it works, and inspires you to work harder.”
- Project (or Passion): “You want to have a mentor who is going to teach you something you are interested in; otherwise you are not going to want to learn, and there is no inspiration.”
- Empathetic: “They must be empathetic, easy to get along with, able to ease the pain.”
Mentee Self-Assessment
Dr. Arora and her colleague, Valerie Press, MD, MPH, role-played a number of scenarios in which young hospitalists and trainees err in their relationships with mentors. These ranged from the dreaded “pop-in meeting” to e-mail etiquette to last-minute requests to review a CV or poster.
The scenarios rang true with Brandon Mauldin, MD, a third-year resident at Tulane University School of Medicine in New Orleans.
“I learned the errors of how I’ve approached my mentors in the past. I think I have been guilty of every one of the points she made,” said Dr. Mauldin, who attended the session to glean tips as he prepares for a career as an academic hospitalist. “Maybe not as much the drop-in meetings, but definitely the last-minute, ‘Hey, I have this poster due tomorrow. Can you help me edit it?’”
Dr. Mauldin’s mentor at Tulane, Deepa Bhatnagar, MD, also attended the session. In her fourth year as an academic hospitalist, Dr. Bhatnagar said she gleaned the most practical information from Dr. Arora’s final scenario, which focused on mentees doing their homework before selecting a mentor or joining a research project.
“Do not sign on the dotted line without consultation. Right? Do not buy a car without doing your homework,” Dr. Arora said. “Mentors want free labor, so beware.”
Dr. Arora said mentees should set reasonable expectations and focus broadly in selecting projects, as they “have their whole career to do the project you love; right now, do the project that works.” It was a tip that stuck.
“The successful project is a good takeaway: Find your interest, find a good mentor, but find a good project,” Dr. Bhatnagar said. “It’s better to zone in on a successful project, instead of taking on a project that might not be successful for you.”
Richard Quinn is a freelance writer in New Jersey.
Listen Now: Highlights of the May 2015 Issue of The Hospitalist
Highlights from the May 2015 issue of The Hospitalist, featuring new SHM President Dr. Robert Harrington on his mission for the next year, Dr. Win Whitcomb on sharing responsibility for outcomes, and Dr. David Weidig on multi-site outcome management.
[audio mp3="http://www.the-hospitalist.org/wp-content/uploads/2015/05/Hospitalist-Highlights-May-2015.mp3"][/audio]
HM15 Q&A: How Will You Make Healthcare Safer?
QUESTION: Quality improvement guru Peter Pronovost, MD, PhD, senior vice president for patient safety and quality at Johns Hopkins Medicine in Baltimore, challenged attendees at HM15 to finish this sentence about how they will make healthcare safer: “I will…” The Hospitalist talked to a few doctors who accepted the challenge.
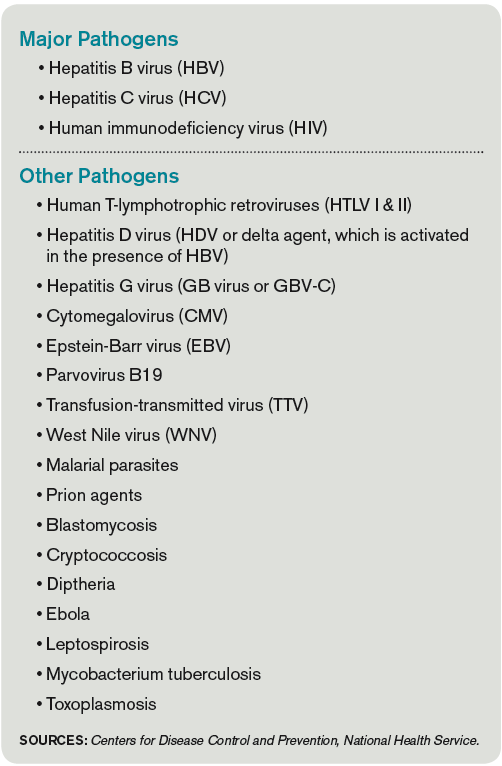
–Hospitalist Salah Mohageb, MD
Virtua Medical Group, Marlton, N.J.
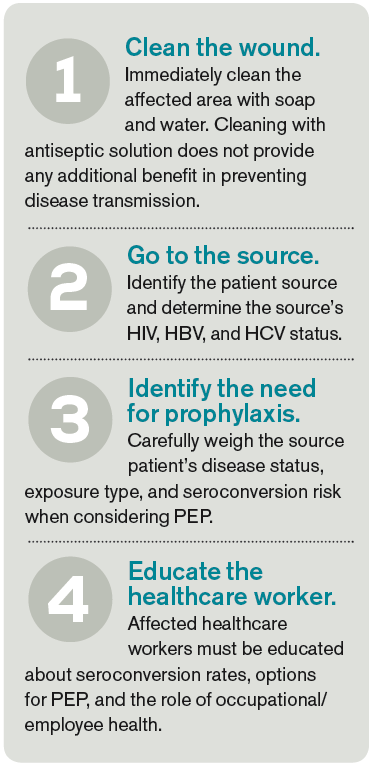
–Hospitalist Moncy Varughese, MD
Highland Park Hospital, NorthShore University
Health System, Chicago

–Timothy Farmer, MD, locums tenens hospitalist in North Carolina
QUESTION: Quality improvement guru Peter Pronovost, MD, PhD, senior vice president for patient safety and quality at Johns Hopkins Medicine in Baltimore, challenged attendees at HM15 to finish this sentence about how they will make healthcare safer: “I will…” The Hospitalist talked to a few doctors who accepted the challenge.
–Hospitalist Salah Mohageb, MD
Virtua Medical Group, Marlton, N.J.
–Hospitalist Moncy Varughese, MD
Highland Park Hospital, NorthShore University
Health System, Chicago
–Timothy Farmer, MD, locums tenens hospitalist in North Carolina