User login
Drug shows promise for lower-risk MDS
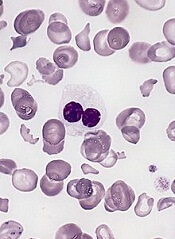
WASHINGTON, DC—An investigational drug can increase hemoglobin levels and eliminate transfusion dependence in patients with lower-risk myelodysplastic syndromes (MDS), results of a phase 2 trial suggest.
The drug, luspatercept, is a modified activin receptor type IIB fusion protein that acts as a ligand trap for members in the TGF-β superfamily involved in the late stages of erythropoiesis.
Luspatercept regulates late-stage erythrocyte precursor differentiation and maturation.
Uwe Platzbecker, MD, of the University Hospital in Dresden, Germany, presented results from an ongoing phase 2 study of luspatercept at the 13th International Symposium on Myelodysplastic Syndromes (abstract 53).
The trial is supported by Acceleron Pharma Inc. and Celgene Corporation, the companies developing luspatercept.
“We are excited by the results in lower-risk MDS patients, which confirm and extend our previous findings,” Dr Platzbecker said. “Luspatercept may be useful early in the treatment of lower-risk MDS patients, either as the initial treatment for anemia or in patients who do not respond or become refractory to treatment with erythropoiesis-stimulating agents.”
Patient and dosing details
The researchers enrolled 58 patients in this study. Twenty-seven have completed treatment as part of the dose-escalation cohort. These patients received luspatercept at 7 doses ranging from 0.125 mg/kg to 1.75 mg/kg.
Thirty-one patients are still receiving treatment in the expansion cohort. The starting dose in this cohort is 1.0 mg/kg, and patients are receiving individual dose titration up to 1.75 mg/kg. Seventeen patients from this cohort received at least 4 cycles of treatment or discontinued early and were included in the analysis presented at the meeting.
In all, Dr Platzbecker presented results in 44 patients. Their median age was 71 (range, 27-88), and 57% were male. The median time since diagnosis was 2.5 years (range, 0.2-13.6 years). Sixty-one percent of patients had received prior treatment with erythropoiesis-stimulating agents, and 21% had received lenalidomide.
Fifteen patients had a low transfusion burden (LTB), as they received less than 4 units of red blood cells (RBCs) over 8 weeks. For these patients, the median hemoglobin at baseline was 9.0 g/dL (range, 6.8-10.1), and the median number of RBCs transfused over 8 weeks was 2 (range, 2-2).
Twenty-nine patients had a high transfusion burden (HTB) and received 4 or more RBC units over 8 weeks. The median number of RBCs transfused in this group was 6 (range, 4-14).
Fifty percent of patients had low-risk MDS according to IPSS, 46% had intermediate-1-risk disease, and 4% had intermediate-2-risk MDS. Eighty-one percent of patients were positive for ring sideroblasts, and 58% had the SF3B1 splicing mutation.
Efficacy and safety
The study’s primary efficacy endpoint was an increase in hemoglobin and/or a reduction in transfusion use. For LTB patients, the endpoint was a hemoglobin increase of 1.5 g/dL or more for 2 weeks or longer. For HTB patients, it was decrease in transfusion of 4 or more RBC units or a 50% or greater reduction in transfusion over 8 weeks.
Among the 9 patients who received lower doses of luspatercept (0.125-0.5 mg/kg), 33% met the primary efficacy endpoint. And 63% of the 35 patients in the higher dose group (0.75-1.75 mg/kg) achieved the primary efficacy endpoint.
Twenty-two percent of patients in the lower dose group achieved the International Working Group (IWG) hematologic improvement-erythroid (HI-E) threshold of efficacy, as did 54% of patients in the higher dose group.
Fourteen percent of patients in the lower dose group achieved transfusion independence, as did 36% of patients in the higher dose group. In the higher dose group, this included 4 of 6 patients with LTB and 6 of 22 patients with HTB.
Among patients who were ring-sideroblast-positive and received higher doses of luspatercept, 39% achieved transfusion independence, and 63% achieved IWG HI-E.
The majority of adverse events (AEs) were mild to moderate (grade 1 or 2). AEs included nasopharyngitis (14%), diarrhea (14%), myalgia (11%), bone pain (9%), bronchitis (9%), headache (9%), and muscle spasms (9%).
There were 2 serious AEs—grade 3 muscle pain and grade 3 worsening of general condition—that were considered possibly related to treatment. One non-serious grade 3 AE of blast cell count increase was considered possibly treatment-related as well.
In closing, Dr Platzbecker said luspatercept was generally safe and well-tolerated, in addition to providing “robust hematologic improvement.” And these results support further study of the drug in patients with lower-risk MDS. ![]()
Whole blood better for cardiac surgery in young children
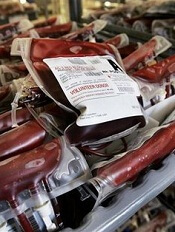
Photo by Elise Amendola
Using fresh whole blood (FWB) from single donors for cardiac procedures in children younger than 2 years of age is better than using component blood from multiple donors, researchers say.
FWB reduces the risk of getting transfusion-related illnesses by reducing donor exposures.
“Currently, whole blood is not generally made available to hospitals for use in pediatric heart surgery,” said David R. Jobes, MD, of The Children’s Hospital of Philadelphia in Pennsylvania.
“Blood centers separate donated blood into component parts, which are then stored for use in medical transfusions as needed.”
At The Children’s Hospital of Philadelphia, the standard preoperative blood order for elective pediatric heart surgery with cariopulmonary bypass is 2 units of FWB and 2 units of packed red blood cells. The FWB is to be used during and immediately after surgery and the components thereafter, if necessary.
The researchers set out to examine the effectiveness of this protocol. They conducted a retrospective study of patient records over a period of 15 years from a surgical registry and blood bank, comparing the cohort of 4111 patients to published reports.
The team defined donor exposures as transfusion requirements for the day of operation and the next postoperative day. All blood products issued were presumed to have been tranfused, and all aliquots from a single donor were counted as a single donor exposure.
Patients were a median age of 94 days and weighed a median of 4.4 kg.
Most (3836) patients received FWB, and 252 received components exclusively when no FWB was available. Twenty-three patients did not receive any blood products. A median of 2 whole blood units was transfused, for a total of 2 donor exposures for the entire cohort.
The researchers found that the youngest patients having complex procedures were exposed to the highest number of donors, while older patients having simpler procedures were exposed to fewer donors.
For example, 72 patients who were a median of 5 days old and underwent truncus arteriosus repair had a median of 4 donor exposures (range, 1-14). And 136 older patients who were a median of 610 days old and underwent fontan completion had a median of 1 donor exposure (range, 0-8).
The researchers concluded that the protocol resulted in fewer donor exposures compared with component use reported in the literature.
Dr Jobes said the risk for disease transmission in pediatric patients is essentially the same as the risk for adults, but it may be more costly for pediatric patients in the long run because infants and young children may live longer with chronic illness stemming from transfusion.
He added, “We hope that our research helps to re-examine current blood storage practice and make whole blood more readily available for pediatric patients.”
He and his colleagues described this research in The Annals of Thoracic Surgery. ![]()
Study shows importance of VTE screening

Image by Kevin MacKenzie
SEATTLE—Routine screening for venous thromboembolism (VTE) may decrease morbidity and mortality among patients undergoing pneumonectomy for benign or malignant indications, according to researchers.
The group conducted a study that showed the rate of VTE diagnosis was 3 times higher for patients who underwent routine VTE screening post-pneumonectomy than for patients who were tested for VTE only after they exhibited symptoms.
Siva Raja MD, PhD, of the Cleveland Clinic in Ohio, presented this finding at the 95th Annual Meeting of the American Association for Thoracic Surgery.
He and his colleagues analyzed 112 patients who underwent pneumonectomy for benign and malignant indications and were screened for VTE. The team compared the rate of VTE diagnosis in this group to the rate in a previously published group of 336 similar patients who did not undergo VTE screening.
The rate of in-hospital VTEs in the screened group was almost 3 times higher than the rate in patients who were not screened—8.9% and 3.0%, respectively (P=0.008).
Over the 30-day post-operative period, the rate of VTE for screened patients was more than double the rate for unscreened patients—13% and 5.1%, respectively (P=0.007).
In the screened group, 10 of 112 patients had VTE detected by screening just before discharge, and 4 additional patients developed symptomatic VTE within 30 days despite a negative pre-discharge screen. In all, 20 patients in this group developed a VTE.
In both the screened and unscreened cohorts, the risk of VTE peaked 6 days after surgery and plateaued after 30 days.
“We find that a large proportion (50%) of VTEs occurred prior to the time of discharge, and the risk of developing symptomatic VTE remained elevated for 30 days,” Dr Raja said. “It is possible that the prevalence of VTE may be even higher should a comprehensive serial screening program be initiated.”
Dr Raja also noted that VTEs are a particular problem after pneumonectomy, since these patients often have low pulmonary reserve to withstand the impact of pulmonary embolism.
Indeed, this study showed that post-pneumonectomy patients who developed VTE had worse long-term survival than patients who did not develop clots, although the difference was not statistically significant (hazard ratio=2.1, P=0.08).
Still, Dr Raja said these results suggest that patients undergoing pneumonectomy receive anticoagulants for a longer duration, as well as undergo repeat screening test for VTE even after hospital discharge. ![]()
FDA approves new drug for hemophilia B
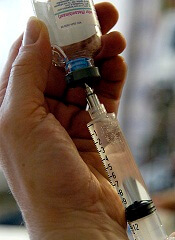
The US Food and Drug Administration (FDA) has approved an intravenous, recombinant, human coagulation factor IX product (Ixinity) for use in patients
with hemophilia B.
The drug is intended to control and prevent bleeding episodes and for perioperative management in adults and children age 12 and older.
Concurrent with the FDA’s approval, Emergent Biosolutions (the company developing Ixinity) launched the Ixinity IXperience Concierge. This resource, which consumers can access by calling 1-855-IXINITY, provides information on the drug.
About Ixinity
Ixinity contains trenonacog alfa, a purified, single-chain glycoprotein derived from Chinese hamster ovary (CHO) cells that has an amino acid sequence comparable to the Thr148 allelic form of plasma-derived factor IX.
No human or animal proteins are added during any stage of manufacturing or formulation of Ixinity. The recombinant factor IX is purified by a chromatography purification process.
The process includes 3 validated steps for virus inactivation and removal. It also includes a validated manufacturing step to reduce the presence of CHO proteins in the final drug product.
Ixinity is contraindicated in patients who have known hypersensitivity to the drug or its excipients, including CHO protein. Hypersensitivity reactions, including anaphylaxis, may occur following treatment with Ixinity. Patients who receive Ixinity are also at risk of developing nephrotic syndrome and thromboembolism.
Trial data
The FDA approved Ixinity based on results from a phase 1/3 trial of the drug in previously treated adults and children (age 12 and older) with severe to moderately severe (factor IX level < 2%) hemophilia B.
Seventy-seven patients received at least 1 dose of Ixinity. The drug was given as routine prophylaxis or on-demand treatment for bleeding episodes.
Fifty-five patients received treatment for more than 50 exposure days, and 45 received the drug for more than 100 exposure days. The median duration of treatment on study was 16.2 months (range, 2.4-39.6 months) for the routine treatment regimen and 14.1 months (range, 2.3-36.9 months) for the on-demand treatment regimen.
A total of 508 bleeding episodes were treated with Ixinity—286 bleeds for patients on routine treatment and 222 for patients receiving on-demand treatment. A majority of the bleeds (84%) were resolved by 1 or 2 infusions of the drug.
Patients rated hemostatic efficacy at the resolution of a bleed as “excellent” or “good” in 84% of all treated bleeding episodes. “Excellent” was defined as a dramatic response with abrupt pain relief and clear reduction in joint or hemorrhage site size. “Good” was defined as pain relief or reduction in hemorrhage site size that may have required an additional infusion for resolution.
Ixinity also induced hemostasis in patients who underwent major surgical procedures.
The drug exhibited similar pharmacokinetic behavior as nonacog alfa, another licensed recombinant coagulation factor IX product. There was no significant reduction in steady-state factor IX levels or alteration in pharmacokinetic behavior over time with Ixinity.
There were 14 adverse events reported in 6 patients. The most common event, observed in 2.6% of patients, was headache. Other adverse events were asthenia, apathy, depression, dysgeusia, influenza, injection site discomfort, lethargy, and skin rash.
None of the patients developed inhibitors to Ixinity, and there were no reports of thrombotic events or allergic reactions.
For more details on this research, see the full prescribing information for Ixinity, available at www.IXINITY.com. ![]()
Restrictive Transfusion Strategy No Benefit for Cardiac Surgery Patients
Clinical question: Does a restrictive transfusion strategy improve outcomes following nonemergent cardiac surgery?
Bottom line: For patients undergoing cardiac surgery, using a restrictive transfusion strategy with a hemoglobin threshold of 7.5 g/dL does not decrease serious infections or ischemic events and may lead to increased all-cause mortality at 90 days. (LOE = 1b)
Study design: Randomized controlled trial (single-blinded)
Funding source: Government
Allocation: Concealed
Setting: Inpatient (any location)
Synopsis
This is yet another study that compares restrictive and liberal transfusion strategies, this time in a cardiac surgery population. These investigators enrolled patients undergoing nonemergency cardiac surgery (mostly coronary artery bypass grafts or valvular procedures) who had a drop of hemoglobin level to below 9 g/dL following surgery.
Patients were randomized, using concealed allocation, to the restrictive transfusion threshold group (threshold hemoglobin 7.5 g/dL) or liberal transfusion threshold group (threshold hemoglobin 9 g/dL). Patients were masked but physicians and nurses were aware of the group assignments.
In the liberal group, patients received one unit of red cell transfusion immediately after randomization followed by an additional unit if the hemoglobin level remained below or dropped below 9 g/dL again during the hospitalization. In the restrictive group, patients received one unit of red cells only if the hemoglobin level dropped below 7.5 g/dL. An additional unit was then given if hemoglobin remained below or dropped below 7.5 g/dL again during the hospitalization. The 2 groups were similar at baseline and analysis was by intention to treat. Not surprisingly, more patients in the liberal strategy group received transfusions than did those in the restrictive strategy group (95% vs 64%).
For the primary outcome—a composite of sepsis, wound infection, stroke, myocardial infarction, gut infarction, or acute kidney injury within 3 months of randomization—there was no significant difference detected between the 2 groups. However, the restrictive group had a higher mortality rate than the liberal group (4.2% vs 2.6%; P = .045). Although this was a secondary outcome, it is possible that a restrictive strategy may be harmful in this cohort, given that they may have less cardiovascular reserve than the general patient population.
Dr. Kulkarni is an assistant professor of hospital medicine at Northwestern University in Chicago.
Endovascular Treatment for Acute Ischemic Stroke Decreases Mortality
Clinical question: Does endovascular treatment improve outcomes for patients with acute ischemic stroke?
Bottom line: For patients with acute ischemic stroke and imaging that suggests a proximal artery occlusion with evidence of good collateral circulation, the use of rapid endovascular treatment improves functional outcomes and reduces mortality. (LOE = 1b)
Study design: Randomized controlled trial (nonblinded)
Funding source: Industry
Allocation: Concealed
Setting: Inpatient (any location) with outpatient follow-up
Synopsis
The recent MR CLEAN study showed improved functional outcomes with the use of endovascular therapy for the treatment of acute ischemic stroke (N Engl J Med 2015;372:11-20).
In this study, investigators enrolled patients with acute disabling ischemic strokes and computed tomographic evidence of a small infarct core, an occluded proximal artery in the anterior circulation, and moderate-to-good collateral circulation. Patients were randomized, using concealed allocation, to receive either usual care or usual care plus rapid endovascular treatment with the use of mechanical thrombectomy and retrievable stents.
The 2 groups had similar baseline characteristics with a mean age of 70 years and a median National Institutes of Health Stroke Scale score of 16 to 17. The median time from stroke onset to reperfusion was 4 hours in the intervention group. The trial was stopped early because of the efficacy of the endovascular therapy. The primary outcome was a common odds ratio, indicating the odds of improvement by 1 point on the modified Rankin scale of 0 to 6 (0 = no symptoms, 1–2 = slight disability, 6 = death). This ratio favored the intervention (common odds ratio 2.6, 95% CI 1.7-3.8; P < .001).
Overall, at 90-day follow-up, the intervention group had a greater proportion of patients with a modified Rankin score of 0–2 (53% vs. 29%; P < .001), as well as decreased mortality (10% vs 19% in control group, P = .04). There was no difference between the 2 groups in the rate of symptomatic intracerebral bleeds.
Dr. Kulkarni is an assistant professor of hospital medicine at Northwestern University in Chicago.
NASPAG: Migraines don’t always preclude combined OCs
ORLANDO– Most adolescent girls who report having headaches – including some of those who report migraines with aura – can safely use combined oral contraceptive pills, according to Dr. Sari Kives.
The available literature suggests that there is some resistance to prescribing such contraception for adolescents with headaches, but most adolescents don’t have the types of headaches that are of concern, Dr. Kives of the University of Toronto said at the annual meeting of the North American Society for Pediatric and Adolescent Gynecology.

owever, it is important to get a good characterization of the headaches, keeping in mind that teens may have difficulty relating their symptoms, she said.
“It’s important to understand what the headache actually is. Is it a tension headache, which is by far the most common headache you will see in adolescents?” she said, noting that menstrual migraines and classical migraines are less common in adolescents.
Menstrual migraines account for about 7%-8% of migraines, occur 2-3 days before menses, can last throughout the period, don’t occur any other time of the month, and can be quite debilitating. They usually are secondary to estrogen withdrawal, Dr. Kives said, adding that a decade ago, add-back estrogen was commonly given during the week off of oral contraceptives in those with menstrual headaches.

Now it is common practice to use continuous pills or extended-cycle pills, she said, explaining that eliminating the estrogen fluctuation improves the headaches.
Classical migraines also occur commonly in adolescent girls. Some may include focal neurological symptoms that may be triggered by hormonal changes, stress, certain foods and beverages, certain scents or fumes, fatigue, hunger, or trauma.
It is important to ask about such symptoms, Dr. Kives said.
“And that’s probably the most important question you can ask. For me, a focal neurological symptom is, ‘I go blind in my left eye. I lose sensation in my right arm,’ ” she said, providing examples.
Some symptoms are characteristic of “atypical aura,” and some are associated with “typical aura” – an important distinction when determining whether combined OCs are safe for a given patient.
Atypical aura usually has sudden unilateral onset and lasts more than 30-60 minutes. Headache may or may not be present, and visual symptoms may include loss of vision, amaurosis fugax (painless transient monocular visual loss), and visual field anomaly. Sensory and motor symptoms can include lower limb anesthesia or hypoesthesia (decrease in sensation).
Typical aura has more progressive onset, lasts less than an hour, and precedes migraine. Patients may experience bilateral scintillating scotoma, fortification spectra, and blurred vision. These are usually limited to visual symptoms, Dr. Kives said, but sensory and motor symptoms can occur. They tend to occur in relation to the visual symptoms, and may affect the upper limbs, mouth, and tongue – causing tingling or pinching sensations.
Individuals who have migraine with aura account for only about 20% of those with migraine headaches, and the vast majority are going to have visual aura.
“They can have sensory and motor symptoms, but the visual ones are the ones where you have to be very specific,” she said, noting that in her experience, 99% of cases are visual.
“If it’s a short visual aura, less than an hour, and it’s not repetitive, I will consider an oral contraceptive pill in this group of patients, but you have to balance it against what their history sounds like,” she said.
Typically, combined OCs are contraindicated in patients with migraine with aura because of an increased risk of cerebrovascular accident, but in Canada, guidelines provide allowances for this “unique group of individuals with migraines with aura that are limited to visual symptoms and that last less than 1 hour,” she said.
Remember that photophobia, phonophobia, nausea and vomiting, visual blurring, and generalized visual spots/flashing lights do not constitute aura, she said.
This is important, because using too stringent a definition of “migraine with aura” will leave a substantial number of individuals with limited contraceptive options, particularly options that are effective and promote cycle control and compliance, she said.
Although there is a definite risk associated with combined OCs in those with migraine with aura – with an added risk in those who smoke, the risks are low in adolescents, compared with older patients.
“The adult women who walks in with hypertension, or who is a smoker who gets oral contraception – that is a very different patient than the 14-year-old who says, ‘I may get flashing lights before my headache, but not on a regular basis.’ Those are completely different entity patients, in my opinion,” Dr. Kives said.
If she does prescribe combined OCs for an adolescent with migraines, she advises the patient to stop the pills if the headaches get worse, she said. In many cases, however, headaches improve, because they were menstrual migraines and not classical migraines, she said, adding that “improvement in headaches is a reassuring sign.” The bottom line, Dr. Kives said, is that migraine without aura doesn’t preclude prescribing of any contraceptive options in adolescents, and that migraine with aura is a relative contraindication; low-dose combined oral contraceptive pills are safe for those with migraine with aura that primarily includes visual symptoms lasting less than an hour.
However, the risk of cerebrovascular accidents is increased in those with migraines, so other risk factors, such as family history, obesity, hypertension, and smoking, should be considered.
“If they have no other risk factors, their risk probably is quite low,” Dr. Kives said.
She reported having no relevant financial disclosures.
ORLANDO– Most adolescent girls who report having headaches – including some of those who report migraines with aura – can safely use combined oral contraceptive pills, according to Dr. Sari Kives.
The available literature suggests that there is some resistance to prescribing such contraception for adolescents with headaches, but most adolescents don’t have the types of headaches that are of concern, Dr. Kives of the University of Toronto said at the annual meeting of the North American Society for Pediatric and Adolescent Gynecology.
owever, it is important to get a good characterization of the headaches, keeping in mind that teens may have difficulty relating their symptoms, she said.
“It’s important to understand what the headache actually is. Is it a tension headache, which is by far the most common headache you will see in adolescents?” she said, noting that menstrual migraines and classical migraines are less common in adolescents.
Menstrual migraines account for about 7%-8% of migraines, occur 2-3 days before menses, can last throughout the period, don’t occur any other time of the month, and can be quite debilitating. They usually are secondary to estrogen withdrawal, Dr. Kives said, adding that a decade ago, add-back estrogen was commonly given during the week off of oral contraceptives in those with menstrual headaches.
Now it is common practice to use continuous pills or extended-cycle pills, she said, explaining that eliminating the estrogen fluctuation improves the headaches.
Classical migraines also occur commonly in adolescent girls. Some may include focal neurological symptoms that may be triggered by hormonal changes, stress, certain foods and beverages, certain scents or fumes, fatigue, hunger, or trauma.
It is important to ask about such symptoms, Dr. Kives said.
“And that’s probably the most important question you can ask. For me, a focal neurological symptom is, ‘I go blind in my left eye. I lose sensation in my right arm,’ ” she said, providing examples.
Some symptoms are characteristic of “atypical aura,” and some are associated with “typical aura” – an important distinction when determining whether combined OCs are safe for a given patient.
Atypical aura usually has sudden unilateral onset and lasts more than 30-60 minutes. Headache may or may not be present, and visual symptoms may include loss of vision, amaurosis fugax (painless transient monocular visual loss), and visual field anomaly. Sensory and motor symptoms can include lower limb anesthesia or hypoesthesia (decrease in sensation).
Typical aura has more progressive onset, lasts less than an hour, and precedes migraine. Patients may experience bilateral scintillating scotoma, fortification spectra, and blurred vision. These are usually limited to visual symptoms, Dr. Kives said, but sensory and motor symptoms can occur. They tend to occur in relation to the visual symptoms, and may affect the upper limbs, mouth, and tongue – causing tingling or pinching sensations.
Individuals who have migraine with aura account for only about 20% of those with migraine headaches, and the vast majority are going to have visual aura.
“They can have sensory and motor symptoms, but the visual ones are the ones where you have to be very specific,” she said, noting that in her experience, 99% of cases are visual.
“If it’s a short visual aura, less than an hour, and it’s not repetitive, I will consider an oral contraceptive pill in this group of patients, but you have to balance it against what their history sounds like,” she said.
Typically, combined OCs are contraindicated in patients with migraine with aura because of an increased risk of cerebrovascular accident, but in Canada, guidelines provide allowances for this “unique group of individuals with migraines with aura that are limited to visual symptoms and that last less than 1 hour,” she said.
Remember that photophobia, phonophobia, nausea and vomiting, visual blurring, and generalized visual spots/flashing lights do not constitute aura, she said.
This is important, because using too stringent a definition of “migraine with aura” will leave a substantial number of individuals with limited contraceptive options, particularly options that are effective and promote cycle control and compliance, she said.
Although there is a definite risk associated with combined OCs in those with migraine with aura – with an added risk in those who smoke, the risks are low in adolescents, compared with older patients.
“The adult women who walks in with hypertension, or who is a smoker who gets oral contraception – that is a very different patient than the 14-year-old who says, ‘I may get flashing lights before my headache, but not on a regular basis.’ Those are completely different entity patients, in my opinion,” Dr. Kives said.
If she does prescribe combined OCs for an adolescent with migraines, she advises the patient to stop the pills if the headaches get worse, she said. In many cases, however, headaches improve, because they were menstrual migraines and not classical migraines, she said, adding that “improvement in headaches is a reassuring sign.” The bottom line, Dr. Kives said, is that migraine without aura doesn’t preclude prescribing of any contraceptive options in adolescents, and that migraine with aura is a relative contraindication; low-dose combined oral contraceptive pills are safe for those with migraine with aura that primarily includes visual symptoms lasting less than an hour.
However, the risk of cerebrovascular accidents is increased in those with migraines, so other risk factors, such as family history, obesity, hypertension, and smoking, should be considered.
“If they have no other risk factors, their risk probably is quite low,” Dr. Kives said.
She reported having no relevant financial disclosures.
EXPERT ANALYSIS FROM THE NASPAG ANNUAL MEETING

No causal effect found between high uric acid concentrations and diabetes
Despite observed associations between uric acid concentrations and diabetes risk, the relationship has not been found to be causal, according to results published April 27 in the journal Diabetes.
Dr. Ivonne Sluijs of University Medical Center Utrecht (the Netherlands) and her associates performed a Mendelian randomization study in a cohort of 24,265 European patients using 24 uric acid loci.
Higher uric acid concentrations were associated with greater diabetes risk (hazard ratio, 1.20 per 59.48 μmol/L; 95% CI, 1.11-1.30), though this did not have a causal effect on diabetes, the authors reported (HR, 1.01; 95% CI, 0.87-1.16).
The findings suggest that “increased uric acid concentrations are a consequence of an adverse metabolic profile, rather than a cause of diabetes,” Dr. Sluijs and her associates wrote (Diabetes 2015 April 27 [doi:10.2337/db14-0742]). Thus, therapies that lower uric acid may not be effective in lowering diabetes risk, they said. “Uric acid has limited value as therapeutic target in preventing diabetes,” the investigators concluded.
Dr. Slujis and her associates did not disclose any conflicts of interest.
FROM DIABETES
Medicare at 50: Or, the end of fee-for-service
Few of my readers were around when Medicare was signed into law in 1965 by President Lyndon Johnson. Mr. Johnson was into his first elected term as president, having first taken the oath of office with the assassination of John F. Kennedy in November 1963.
Hardly a darling of the liberal left, he was maligned as the perpetrator, if not for the expansion, of the Vietnam War. He was elected with the largest presidential plurality in history, receiving 61% of the votes, and he carried with him a solid Democratic Congress bolstered by a large block of solid Southern Democrats, a firmament from which he had emerged. He can be credited for the most far-reaching social legislation of the 20th century, second only to Franklin Delano Roosevelt of the 1930s. Johnson was able to move the Civil Rights Act of 1964 and the Voting Rights Act and Medicare Act through Congress in 1965, the latter of which we celebrate this year.
At the time of passage of Medicare, 35% of Americans over 65 had no health insurance, either because they found insurance unaffordable or because of preexisting illness. Health insurance premiums for the elderly cost roughly three times more than did those for younger individuals. With many of the elderly living on Social Security alone, health insurance was an impossibility. If they needed care, they might find it at the emergency department of their local hospitals.
The battle for the passage of Medicare was formidable. In contrast to the passive role of the American Medical Association in the passage of the Affordable Care Act, Medicare was, to put it mildly, vigorously opposed by most doctors and by the AMA, which viewed it as the harbinger of long-anticipated socialized medicine. It ended up being far from it.
Medicare provided a pathway to an economic bonanza for the practicing physician and to hospitals that they could never have imagined. It immediately expanded the patient population and allowed enterprising and not-so-enterprising doctors and hospitals to run up the costs of health care by strengthening the fee-for-service style of medical care. Doctors, hospitals, and patients had no concern for cost: Medicare paid for everything.
Hospitals found Medicare a ready source of income. Doctor and hospital bills were based on the usual cost to each in their respective communities. Medical educators as well as house staff also saw their income lifted as a result of the federal government’s paying for a large part if not all of the cost of house staff education. Even the small number of physicians who opted out of Medicare, because of the red tape or to preserve their independence from the federal government, benefited. Their fees increased as the payment schedules of Medicare increased in their communities.
One of the by-products of Medicare was the end of hospital segregation. For those of you who were not around then, you can imagine what an impact that had on hospitals and doctors in both the North and the South.
Over time, Medicare expanded its footprint to include treatment of chronic kidney disease at any age, as well as drug coverage. I would guess that most Americans over 65 (this writer included) love Medicare. And doctors? Well, they still grumble about it.
With the recent readjustment of physicians’ Medicare reimbursement rates, the door has been opened to new initiatives based on quality of care. No matter what your political persuasion, it is clear that Americans cannot afford Medicare as we know it. Physicians undoubtedly will find their fee-for-service style of reimbursement curtailed as we learn the definition of “quality care standards.” Quality standards will not only define clinical performance, but will also include cost of rendering that care. So long to the world of fee-for-service reimbursement.
Dr. Goldstein, medical editor of Cardiology News, is professor of medicine at Wayne State University and division head emeritus of cardiovascular medicine at Henry Ford Hospital, both in Detroit. He is on data safety monitoring committees for the National Institutes of Health and several pharmaceutical companies.

Sports Purpura From Floorball, Indoor Climbing, and Archery
To the Editor:
Sports purpura can be broken down into different types including traumatic purpura,1 exercise-induced cutaneous vasculitis,2 occurrence of coincidental systemic purpura,3 and other conditions.4-6 Traumatic purpura results from brutal contact with an opponent, the court, the equipment, or the ball. Three cases of sports purpura related to equipment and balls are reported.
An otherwise healthy 27-year-old woman presented with multiple ecchymotic round patches on her legs. The largest patch was 70 mm and displayed a heterogeneous Swiss cheese–like pattern with discrete whiter round areas within the patch (Figure 1). She reported that she played as a defender in a second division floorball team weekly, acknowledging frequent body contacts and being hit on the legs with the sticks and balls. Purpura was diagnosed due to hits from the floorball.
A 32-year-old healthy man presented with purpuric petechiae of the left palm after indoor climbing. He had been regularly climbing indoors for 3 years and denied a history of similar eruptions. The lesions were painless, noninfiltrated, and did not disappear after pressure (Figure 2). Lesions presumably were due to repeated friction on the climbing hold. Petechiae took a transiently golden hue before resolving within a week.
| 
|
A 26-year-old right-handed woman injured the left forearm while practicing target archery. She was not wearing an arm guard at the time of the injury. Once released, the bowstring scraped the volar aspect of the forearm, causing a painful warm ecchymotic and swollen plaque. She denied neurologic or vascular symptoms. The hematoma rapidly evolved from red to blue (Figure 3) and spontaneously resolved within weeks.
|
|

Purpura related to the high-velocity impact of sport balls has been previously reported with ping-pong,7 paintball,8,9 racquetball, squash,10 and baseball. Floorball, one of the most popular team sports in Finland, is played indoors and resembles ice hockey. The players use graphite compound sticks and a light hollow plastic ball. Except for the goalkeeper, players do not wear specific protective gear. Accidental body contact, including a direct hit from the floorball stick or ball, are frequent.11 The ball weighs 23 g, measures 72 mm in diameter, and has 26 holes that are 11 mm in diameter. The fastest shot was recorded at 127 miles per hour.12 The cutaneous imprint from the ball impact on bare skin, as shown with patient 1, initially is annular,8-10 but the bruise later takes an unusual design due to the peculiar shape of the ball. This complication is no stranger to floorball players but has been rarely reported. The diagnosis is easy, the condition is benign and asymptomatic, and it resolves when the season is over; therefore, players commonly will not seek medical attention. Of note, lower limb injuries, including joint sprains, muscle strains, and soft-tissue contusions, are frequent in female athletes.11 Additional causes of purpura include collision with another player or with boards and stick hits.
Palmar petechiae from indoor climbing is similar to black palm from weight lifting.13 Although the typical black discoloration is absent, the mechanisms of friction and brutal trauma, clinical presentation, and evolution are similar.
Lastly, archery-induced hematomas are caused by the absence of an arm guard, which protects the wrist and forearm when the string snaps back.14 This complication is not often reported but is known by archers. Because archers usually wear protective gear, these injuries are expected to occur in novices or when safety measures are not respected.
1. Aguayo-Leiva I, Vano-Galvan S, Arrazola JM. A purpuric rash. Aust Fam Physician. 2009;38:889-890.
2. Ramelet AA. Exercise-induced vasculitis. J Eur Acad Dermatol Venereol. 2006;20:423-427.
3. Leonard JC, Rieger M. Idiopathic thrombocytopenic purpura presenting in a high school football player: a case report. J Athl Train. 1998;33:269-270.
4. Nordlind K, Bondesson L, Johansson SG, et al. Purpura provoked by cold exposure in a skier. Dermatologica. 1983;167:101-103.
5. Latenser BA, Hempstead RW. Exercise-associated solar purpura in an atypical location. Cutis. 1985;35:365-366.
6. Allan SJ, Humphreys F, Buxton PK. Annular purpura and step aerobics. Clin Exp Dermatol. 1994;19:418.
7. Scott MJ Jr, Scott MJ 3rd. Ping pong patches. Cutis. 1989;43:363-364.
8. Aboutalebi S, Stetson CL. Paintball purpura. J Am Acad Dermatol. 2005;53:901-902.
9. Levsky ME, Crowe M. What is your diagnosis? paintball purpura. Cutis. 2005;75:148, 157-158.
10. Barazi H, Adams BB. Sports purpura. Int J Dermatol. 2006;45:1443.
11. Pasanen K, Parkkari J, Kannus P, et al. Injury risk in female floorball: a prospective one-season follow-up [published online ahead of print May 9, 2007]. Scand J Med Sci Sports. 2008;18:49-54.
12. New world record. Floorball Central Web site. http://www.floorballcentral.com/2010/11/new-world -record.html. Published November 5, 2010. Accessed April 8, 2015.
13. Izumi AK. Letter: pigmented palmar petechiae (black palm). Arch Dermatol. 1974;109:261.
14. Rayan GM. Archery-related injuries of the hand, forearm, and elbow. South Med J. 1992;85:961-964.
To the Editor:
Sports purpura can be broken down into different types including traumatic purpura,1 exercise-induced cutaneous vasculitis,2 occurrence of coincidental systemic purpura,3 and other conditions.4-6 Traumatic purpura results from brutal contact with an opponent, the court, the equipment, or the ball. Three cases of sports purpura related to equipment and balls are reported.
An otherwise healthy 27-year-old woman presented with multiple ecchymotic round patches on her legs. The largest patch was 70 mm and displayed a heterogeneous Swiss cheese–like pattern with discrete whiter round areas within the patch (Figure 1). She reported that she played as a defender in a second division floorball team weekly, acknowledging frequent body contacts and being hit on the legs with the sticks and balls. Purpura was diagnosed due to hits from the floorball.
A 32-year-old healthy man presented with purpuric petechiae of the left palm after indoor climbing. He had been regularly climbing indoors for 3 years and denied a history of similar eruptions. The lesions were painless, noninfiltrated, and did not disappear after pressure (Figure 2). Lesions presumably were due to repeated friction on the climbing hold. Petechiae took a transiently golden hue before resolving within a week.
|
|
|
A 26-year-old right-handed woman injured the left forearm while practicing target archery. She was not wearing an arm guard at the time of the injury. Once released, the bowstring scraped the volar aspect of the forearm, causing a painful warm ecchymotic and swollen plaque. She denied neurologic or vascular symptoms. The hematoma rapidly evolved from red to blue (Figure 3) and spontaneously resolved within weeks.
|
|
Purpura related to the high-velocity impact of sport balls has been previously reported with ping-pong,7 paintball,8,9 racquetball, squash,10 and baseball. Floorball, one of the most popular team sports in Finland, is played indoors and resembles ice hockey. The players use graphite compound sticks and a light hollow plastic ball. Except for the goalkeeper, players do not wear specific protective gear. Accidental body contact, including a direct hit from the floorball stick or ball, are frequent.11 The ball weighs 23 g, measures 72 mm in diameter, and has 26 holes that are 11 mm in diameter. The fastest shot was recorded at 127 miles per hour.12 The cutaneous imprint from the ball impact on bare skin, as shown with patient 1, initially is annular,8-10 but the bruise later takes an unusual design due to the peculiar shape of the ball. This complication is no stranger to floorball players but has been rarely reported. The diagnosis is easy, the condition is benign and asymptomatic, and it resolves when the season is over; therefore, players commonly will not seek medical attention. Of note, lower limb injuries, including joint sprains, muscle strains, and soft-tissue contusions, are frequent in female athletes.11 Additional causes of purpura include collision with another player or with boards and stick hits.
Palmar petechiae from indoor climbing is similar to black palm from weight lifting.13 Although the typical black discoloration is absent, the mechanisms of friction and brutal trauma, clinical presentation, and evolution are similar.
Lastly, archery-induced hematomas are caused by the absence of an arm guard, which protects the wrist and forearm when the string snaps back.14 This complication is not often reported but is known by archers. Because archers usually wear protective gear, these injuries are expected to occur in novices or when safety measures are not respected.
1. Aguayo-Leiva I, Vano-Galvan S, Arrazola JM. A purpuric rash. Aust Fam Physician. 2009;38:889-890.
2. Ramelet AA. Exercise-induced vasculitis. J Eur Acad Dermatol Venereol. 2006;20:423-427.
3. Leonard JC, Rieger M. Idiopathic thrombocytopenic purpura presenting in a high school football player: a case report. J Athl Train. 1998;33:269-270.
4. Nordlind K, Bondesson L, Johansson SG, et al. Purpura provoked by cold exposure in a skier. Dermatologica. 1983;167:101-103.
5. Latenser BA, Hempstead RW. Exercise-associated solar purpura in an atypical location. Cutis. 1985;35:365-366.
6. Allan SJ, Humphreys F, Buxton PK. Annular purpura and step aerobics. Clin Exp Dermatol. 1994;19:418.
7. Scott MJ Jr, Scott MJ 3rd. Ping pong patches. Cutis. 1989;43:363-364.
8. Aboutalebi S, Stetson CL. Paintball purpura. J Am Acad Dermatol. 2005;53:901-902.
9. Levsky ME, Crowe M. What is your diagnosis? paintball purpura. Cutis. 2005;75:148, 157-158.
10. Barazi H, Adams BB. Sports purpura. Int J Dermatol. 2006;45:1443.
11. Pasanen K, Parkkari J, Kannus P, et al. Injury risk in female floorball: a prospective one-season follow-up [published online ahead of print May 9, 2007]. Scand J Med Sci Sports. 2008;18:49-54.
12. New world record. Floorball Central Web site. http://www.floorballcentral.com/2010/11/new-world -record.html. Published November 5, 2010. Accessed April 8, 2015.
13. Izumi AK. Letter: pigmented palmar petechiae (black palm). Arch Dermatol. 1974;109:261.
14. Rayan GM. Archery-related injuries of the hand, forearm, and elbow. South Med J. 1992;85:961-964.