User login
Piercing Regret: Correcting Earlobe Defects From Gauges
The use of gauges to expand or alter the shape of the earlobe is a relatively popular trend in this day and age. However, as with tattoos, patients sometimes request removal of this physical alteration out of regret or a change in lifestyle. Managing these patients poses a challenge for dermatologists due to the variable degree of tissue ptosis left behind.
Collins et al published a retrospective review in JAMA Facial Plastic Surgery (2015;17:144-148) of their last 20 patients treated for earlobe reconstruction that had at least 1 year of follow-up. The earlobe deformities were classified as small, medium, or large. Small defects were those that were small enough to be treated with an elliptical excision and primary closure. Medium defects were those that had a disruption of the natural curve of the inferior earlobe and a more distinct soft tissue loss of the lobule. A primary closure of this type of defect may cause an unnaturally long lobule. The authors suggested excising the opening and then using a posterior-based advancement flap to restore the natural earlobe contour while improving some of the soft tissue loss. Large defects were those with a lot of volume loss and tissue redundancy. These defects required a wedge excision of the elongated piercing site and a posterior-superior–based advancement flap with 2 arms to it.
Results showed that all 20 patients did well after at least 1 year without the need for further reconstruction or excisional scar revision. Two patients did undergo dermabrasion at 1 year to help blend the final scar.
What’s the issue?
Trends such as the placement of earlobe gauges may wane at some point, resulting in a number of patients seeking our help to repair their earlobes. The approach presented in this study tailors the method of repair to the size of the defect. By doing so, one can hope to restore the natural shape and volume to achieve a natural-appearing earlobe. Have you seen an increase in the number of patients seeking this type of repair?

Player-to-player contact, not ‘heading,’ is main source of soccer concussions
Head contact with other players, not with the ball, is the main source of concussions among high-school soccer players of both sexes, according to a report published online July 13 in JAMA Pediatrics.
Several studies have shown that “heading” the ball during soccer practices and games is responsible for many soccer-related concussions, and some have called for banning such heading, especially among children and adolescents, to make the sport safer. But until now, no large study has examined the exact mechanism of head injuries among school-aged soccer players, so such prevention efforts cannot be considered evidence based, said R. Dawn Comstock, Ph.D., an epidemiologist at the University of Colorado Denver, Aurora, and her associates.

The investigators performed a retrospective analysis of data from a large, Internet-based sports injury surveillance study, focusing on concussions sustained during soccer practices or games which required medical attention and restricted the athlete’s participation for 1 or more days. They assessed nationally representative samples of 100 high schools every year for a 9-year period. There were 627 concussions during 1,393,753 athletic exposures among girls (4.50 per 10,000 exposures) and 442 concussions during 1,592,238 athletic exposures among boys (2.78 per 10,000 exposures).
The most common mechanism of concussion was player-to-player contact among both boys (68.8% of concussions) and girls (51.3% of concussions). In contrast, contact with the ball accounted for 17% of concussions among boys and 29% among girls.
The number and types of concussion symptoms were the same, regardless of whether the concussion was caused by player-to-player contact or player-to-ball contact. However, symptom resolution time was slightly but significantly longer for both boys and girls when the concussion was caused by collision with a ball or goal post (JAMA Pediatr. 2015 July 13 [doi:10.1001/jamapediatrics.2015.1062]).
“We postulate that banning heading from soccer will have limited effectiveness as a primary prevention mechanism (i.e., in preventing concussion injuries) unless such a ban is combined with concurrent efforts to reduce athlete-athlete contact throughout the game,” Dr. Comstock and her associates said.
Moreover, “it may be culturally more tolerable to the soccer community to attempt to reduce athlete-athlete contact across all phases of play through better enforcement of existing rules, enhanced education of athletes on the rules of the game, and improved coaching of activities such as heading,” rather than simply banning heading, they added.
Head contact with other players, not with the ball, is the main source of concussions among high-school soccer players of both sexes, according to a report published online July 13 in JAMA Pediatrics.
Several studies have shown that “heading” the ball during soccer practices and games is responsible for many soccer-related concussions, and some have called for banning such heading, especially among children and adolescents, to make the sport safer. But until now, no large study has examined the exact mechanism of head injuries among school-aged soccer players, so such prevention efforts cannot be considered evidence based, said R. Dawn Comstock, Ph.D., an epidemiologist at the University of Colorado Denver, Aurora, and her associates.
The investigators performed a retrospective analysis of data from a large, Internet-based sports injury surveillance study, focusing on concussions sustained during soccer practices or games which required medical attention and restricted the athlete’s participation for 1 or more days. They assessed nationally representative samples of 100 high schools every year for a 9-year period. There were 627 concussions during 1,393,753 athletic exposures among girls (4.50 per 10,000 exposures) and 442 concussions during 1,592,238 athletic exposures among boys (2.78 per 10,000 exposures).
The most common mechanism of concussion was player-to-player contact among both boys (68.8% of concussions) and girls (51.3% of concussions). In contrast, contact with the ball accounted for 17% of concussions among boys and 29% among girls.
The number and types of concussion symptoms were the same, regardless of whether the concussion was caused by player-to-player contact or player-to-ball contact. However, symptom resolution time was slightly but significantly longer for both boys and girls when the concussion was caused by collision with a ball or goal post (JAMA Pediatr. 2015 July 13 [doi:10.1001/jamapediatrics.2015.1062]).
“We postulate that banning heading from soccer will have limited effectiveness as a primary prevention mechanism (i.e., in preventing concussion injuries) unless such a ban is combined with concurrent efforts to reduce athlete-athlete contact throughout the game,” Dr. Comstock and her associates said.
Moreover, “it may be culturally more tolerable to the soccer community to attempt to reduce athlete-athlete contact across all phases of play through better enforcement of existing rules, enhanced education of athletes on the rules of the game, and improved coaching of activities such as heading,” rather than simply banning heading, they added.
FROM JAMA PEDIATRICS
Key clinical point: Head contact with other players, not with the ball, is the main source of concussions in high-school soccer.
Major finding: The most common mechanism of concussion was player-to-player contact among both boys (68.8% of concussions) and girls (51.3% of concussions), while contact with the ball accounted for 17% of concussions among boys and 29% among girls.
Data source: A retrospective analysis of 9 years of surveillance data regarding soccer-related concussions in a nationally representative sample of high-school boys (442 concussions in nearly 1.6 million athletic exposures) and girls (627 concussions in nearly 1.4 million athletic exposures).
Disclosures: The Centers for Disease Control and Prevention, the National Federation of State High School Associations, the National Operating Committee on Standards for Athletic Equipment, DonJoy Orthotics, and EyeBlack funded the study. Dr. Comstock and her associates reported having no relevant financial disclosures.

Therapies to Improve the Cosmetic Symptoms of Rosacea
Rosacea is a commonly encountered chronic inflammatory skin disease that affects an estimated 16 million Americans and exhibits a particular predilection for the convexities of the central face (eg, forehead, cheeks, nose, chin).1,2 The pathophysiology of rosacea remains poorly understood despite the relatively high prevalence of the disease and substantial ongoing research.3 The current paradigm suggests a complex multifactorial interplay involving aberrations of the innate and adaptive immune system, neurovascular dysregulation, blood and lymphatic vessel changes, genetic predispositions, and overgrowth of commensal organisms such as Demodex.3 Additionally, a variety of external factors may exacerbate clinical symptoms (eg, UV radiation, heat exposure, spicy food, alcohol, stress).
The diagnosis of rosacea is made clinically and rarely requires histologic confirmation. Although rosacea can present with a wide range of clinical features that often wax and wane over time, a near universal finding is diffuse centrofacial erythema.4 This centrofacial redness may symptomatically worsen during a flare period, causing flushing, but it often persists nontransiently between flares as background erythema. Other variable findings of rosacea include the presence of telangiectases, edema, plaques, phymatous changes, dry skin, ocular manifestations, and inflammatory lesions in the form of papules and pustules.5 Patients also may report a stinging or burning sensation in affected areas. It is important to note that most patients will only exhibit some of these clinical features and that symptoms often vary in the timing of their emergence or regression.5 A classification system has been developed for rosacea that categorizes the disease into 4 subtypes (erythematotelangiectatic, papulopustular, phymatous, and ocular) and one variant (granulomatous).6 These categories are determined by the grouping of clinical features present, but it is not uncommon for patients to exhibit clinical manifestations of more than 1 subtype.7
The detrimental cosmetic effects of rosacea are obvious given its chronic nature and tendency to affect highly visible areas such as the face. As such, rosacea can have a devastating impact on patients’ quality of life.8 Patients with rosacea have been reported to have higher incidence rates of low self-esteem, embarrassment, social anxiety, and depression as compared to the rest of the population. Effective treatment, however, can improve cosmetic appearance and mitigate the negative psychosocial impacts of the disease.8
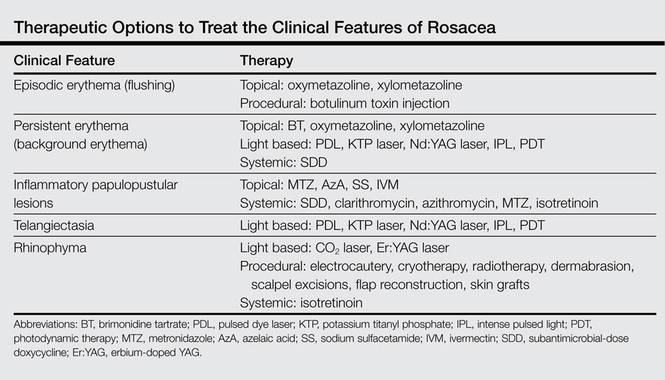
Treatment of rosacea focuses on relieving cosmetic symptoms, as no curative therapy currently exists. Treatment comes in a wide variety of forms, including topical medications, systemic pharmacologic therapies, light-based modalities, and procedural interventions. Choice of therapy should be determined on a case-by-case basis as guided by the clinical features present, and combination or sequential therapies often are required to achieve optimal cosmetic results. In this article, we review both existing and emerging treatments of rosacea and assess their ability to improve the cosmetic symptoms of rosacea (Table).
Skin Care
Proper skin care is an important aspect of treatment for all patients with rosacea and thus includes the use of over-the-counter cleansers, moisturizers, and sunscreens.9 The choice of skin care products is an important consideration given the often hypersensitive skin of rosacea patients. Moisturizers and cleansers should have an acidic to neutral pH, similar to normal skin. They should not contain emulsifiers that strip moisture from the skin or protective lipids and proteins from the stratum corneum.10 Moisturizers without irritants, abrasives, or allergens should be used following skin cleansing. Protection from UV radiation with sunscreen, ideally with a sun protection factor greater than 30, is particularly important, as it can prevent UV-induced rosacea flares as well as photodamage that can cause additional erythema and telangiectasia.4 Rosacea patients also may find green-tinted makeup to be useful in concealing areas of erythema.8
Topical Therapy
Currently, there are only 5 US Food and Drug Administration (FDA)–approved topical medications for the treatment of rosacea: metronidazole (MTZ) gel 0.75% and 1%, azelaic acid (AzA) gel 15%, sodium sulfacetamide (SS) 10%–sulfur 5% lotion and cream, brimonidine tartrate (BT) gel 0.5%, and the most recently approved ivermectin (IVM) cream 1%.7 Metronidazole, AzA, and SS primarily are used to treat the inflammatory papules and pustules of rosacea, while BT is used to treat persistent background erythema. The exact mechanisms of action by which MTZ, AzA, and SS treat rosacea are unclear, but they are thought to reduce inflammation and/or immune response. Metronidazole and AzA both have demonstrated favorable safety profiles and significant (P<.05) efficacy over vehicle in reducing inflammatory lesions in numerous well-controlled randomized clinical studies.4,11,12 There is some evidence that AzA may be more effective than MTZ; one 15-week multicenter, double-blind, randomized, parallel-group study demonstrated that twice-daily AzA gel 15% showed significant superiority (P=.02) over twice-daily MTZ gel 0.75% in improving the inflammatory lesions and erythema of rosacea.13 Sodium sulfacetamide also has shown good efficacy in the treatment of inflammatory lesions and performed significantly better (P=.04) than MTZ according to one multicenter, investigator-blinded, randomized, parallel-group study,14 but the overall evidence is not as strong as MTZ and AzA.4,11,15 The most common adverse effect for MTZ, AzA, and SS is application-site irritation, but overall most patients report good tolerance to these topical medications.4 Azelaic acid is unique in that patients may report stinging, tingling, or burning after application, but these effects are not associated with visible skin changes and usually are transient, generally remitting after 1 to 2 weeks.4
Brimonidine tartrate is a highly selective α2-adrenergic receptor agonist whose mechanism of action in the treatment of rosacea is thought to involve vasoconstriction of superficial skin vasculature and to a lesser extent anti-inflammatory effects.16 In a double-blind, randomized, vehicle-controlled phase 3 trial, application of BT gel 0.5% once daily for 4 weeks demonstrated significant efficacy over vehicle (P<.001) in treating persistent nontransient facial erythema in 553 adult patients with 2 or fewer papulopustular lesions as evaluated over 12 hours on days 1, 15, and 29.17 Notably, a substantial difference in cosmetic appearance was observed in another study as early as 30 minutes after the first gel application on day 1.18 The results of this phase 3 trial17 mirrored those of the phase 2 dose-optimization and safety studies of similar design.18 In addition to another long-term, 1-year, open-label study,19 both phase 2 and 3 studies have shown favorable safety profiles with no reports of tachyphylaxis, rebound erythema, or aggravation of other disease features such as telangiectases or inflammatory lesions.17,18 Recently, however, there have been some reports of considerable rebound erythema with BT use and thus patients should be made aware of this possibility.20,21 Case reports of successful treatment of background erythema and flushing with other topically applied adrenergic receptor modifiers such as oxymetazoline and xylometazoline have been published in the literature,22,23 but additional research will be necessary to validate these claims.
Ivermectin, a decades-old antiparasitic, has recently shown promising results as a treatment of rosacea patients with moderate to severe papulopustular lesions. Its therapeutic effect is believed to be mediated by its activity against Demodex, a natural skin mite that has been found at increased concentrations in a subset of patients with rosacea, as well as by its natural anti-inflammatory properties.24 In 2 identically designed, randomized, double-blind, controlled trials of IVM cream 1% applied once daily for 12 weeks, a significantly larger proportion of patients in the IVM groups achieved an investigator global assessment of clear or almost clear as compared to vehicle (IVM: 38.4% and 40.1%, respectively; vehicle: 11.6% and 18.8%, respectively; P<.001). Both trials also demonstrated that IVM was significantly superior to vehicle in the reduction of inflammatory lesion counts measured at week 12 as compared to baseline (IVM: 76.0% and 75.0%, respectively; vehicle: 50.0% and 50.0%, respectively; P<.001).24 An extension of these original trials demonstrated long-term safety with up to 52 weeks of topical IVM use and reported a low incidence rate of adverse effects, most commonly transient skin burning, pruritus, and dryness. Notably, the incidence rate of these adverse effects was lower than a comparison group receiving AzA gel 15% once daily.25 Once-daily application of IVM cream 1% also has recently demonstrated superiority over twice-daily MTZ cream 0.75% for 16 weeks in a phase 3 investigator-blinded, randomized, parallel-group study. The IVM group was significantly superior to MTZ in the reduction of inflammatory lesions as compared to baseline (83.0% vs 73.7%) and in the number of participants who achieved an investigator global assessment score of clear or almost clear (84.9% vs 75.4%)(both P<.001).26 There also is limited evidence for the use of other antiparasitic topical medications such as crotamiton 10% and permethrin 5%, but such agents frequently cause irritation and may not be well tolerated in rosacea patients.27-29
There are a variety of other non–FDA-approved topical medications that have been used with varying success in the literature, including cyclosporine, macrolides, benzoyl peroxide, retinoids, and calcineurin inhibitors such as tacrolimus and pimecrolimus. Evidence for the use of these medications generally is limited to a few studies with small numbers of patients and will not be discussed further in this article.4,11,30 These agents, however, may be useful in select cases when first-line regimens have failed and also may be good targets for future research.
Systemic Therapy
The mainstay of systemic treatment of rosacea centers around the tetracyclines, a group of antibiotics that have been used off label for rosacea since the 1950s.31 The therapeutic effects of tetracyclines in the treatment of rosacea are thought to revolve around their anti-inflammatory effects rather than their antibacterial properties.32 Currently, the only FDA-approved oral agent for treatment of the inflammatory lesions of rosacea is doxycycline 40-mg modified-release capsules taken once daily. These modified capsules allow for instant release of 30 mg and delayed release of 10 mg of doxycycline. This dosing is considered to be anti-inflammatory rather than antimicrobial, as it does not produce antibiotic selection pressure even with prolonged use.33 Efficacy of 40-mg subantimicrobial-dose doxycycline (SDD) has been demonstrated in 2 phase 3 multicenter, parallel-group, randomized, double-blind, placebo-controlled studies in which SDD demonstrated a significantly greater reduction in the number of total inflammatory lesions at week 16 compared to placebo (P<.001).34 Subantimicrobial-dose doxycycline also has been shown to be equally as efficacious in reducing inflammatory lesions as traditional-dose doxycycline.35 There also is some evidence for the efficacy of SDD in reducing overall erythema, as demonstrated by one open-label, community-based study in which SDD monotherapy resulted in clinician erythema assessment scores of mild or no erythema in 75% of patients with mild to severe rosacea at baseline after 12 weeks of therapy.35 Additionally, SDD is considered to be safe and well-tolerated and does not generally result in the adverse effects that may be seen in antibiotic-level doses of doxycycline (eg, gastrointestinal upset, vaginal candidiasis, photosensitivity).34,36,37 Other antibiotics such as clarithromycin, azithromycin, and MTZ also have been studied as treatments of papulopustular rosacea at antibiotic-level doses with good therapeutic effect.38-40 These therapies, however, generally are not used unless there are contraindications for use of tetracycline antibiotics, such as pregnancy or allergy, as the overall evidence is not as strong and there may be increased risks for serious adverse effects.30
Although it is not FDA approved, isotretinoin is an important therapeutic option for select rosacea patients, as it is the only pharmacologic agent that has shown efficacy for the phymatous changes of rosacea. Its efficacy, however, is limited to early-stage rhinophyma that has not yet progressed to the fibrotic or mucinous stages of disease in which it has been shown to reduce the size and number of cutaneous sebaceous glands.30,41 Isotretinoin at 0.3 mg/kg daily also has shown noninferiority in treatment of the inflammatory papules and pustules of rosacea as compared to antibiotic dosing of doxycycline in one large-scale, placebo-controlled, randomized, 12-week multicenter study.42 Unfortunately, recurrence is highly likely after isotretinoin therapy is discontinued.30,41 However, continuous “microdose” isotretinoin at 0.03 to 0.17 mg/kg daily has shown evidence for efficacy in treatment of recalcitrant papulopustular disease.43 Such dosing may have the added benefit of reduced risk for radiographic changes associated with long-term isotretinoin use.43
Light-Based Therapy
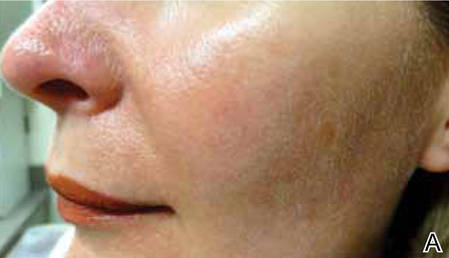
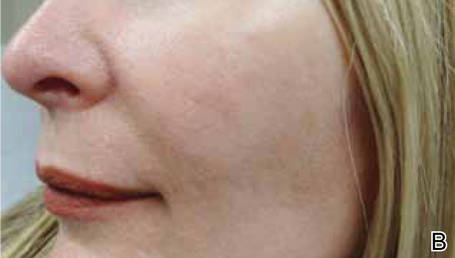
Light-based modalities are an important tool set in the management of rosacea symptoms, as they can treat telangiectases for which medical therapy is not generally effective.9 To a lesser extent, light-based modalities also can help alleviate background erythema. The most commonly used light-based modalities include the pulsed dye laser (PDL)(Figure), potassium titanyl phosphate (KTP) laser, Nd:YAG laser, intense pulsed light, photodynamic therapy, CO2 laser, and erbium-doped YAG (Er:YAG) laser. These treatments produce clinical results by targeting specific chromophores such as oxyhemoglobin, deoxyhemoglobin, methemoglobin, and clotted blood with light of specific wavelengths to induce thermolysis of vasculature while sparing collateral tissue.44 Generally, larger telangiectatic vessels are more amenable to therapy than smaller vessels, which usually require higher energy to be delivered in a shorter period of time, thus predisposing the patient to the development of purpura that may last for 1 to 2 weeks.44
|
Historically, PDL used a light wavelength of 577 nm and was classically associated with posttherapy purpura; however, modern PDLs use wavelengths of 585 or 595 nm and are associated with a reduced risk for purpura through the use of longer pulse durations (ie, 10–40 millisecond), multiple minipulses, multiple passes, and advanced epidermal cooling methods.9,44 In a small, prospective, randomized, controlled, nonblinded study, PDL therapy with fluence sufficiently high enough to induce purpura achieved an approximate 50% improvement in telangiectasia grading scores in most patients after a single treatment.45 Notably, PDL therapy at purpura-inducing settings was reported to be much more efficacious than settings that did not induce purpura (purpura free), especially in the treatment of thicker telangiectases.45
Potassium titanyl phosphate lasers make use of shorter wavelengths (532 nm) than PDL and thus are better able to target superficial vasculature, which translates into a reduced risk for purpura and faster healing times. However, KTP laser therapy typically is only reserved for patients with lighter skin types, as this wavelength of light is more likely to result in higher melanin absorption and possible postinflammatory hyperpigmentation.44 A split-face study comparing the KTP laser with PDL determined that the KTP laser was able to achieve 62% clearing after the first treatment and 85% clearance after the third treatment versus 49% and 75% for PDL treatment, respectively; however, the KTP laser had higher rates of posttherapy erythema lasting at least 1 day (58% vs 8%).46
Conversely, the Nd:YAG laser uses longer wavelengths (1064 nm) and can achieve deeper skin penetration, which may be effective for larger, recalcitrant, or deeper blue-tinted vessels. A split-face, double-blind, randomized, controlled trial found Nd:YAG laser therapy to be an effective treatment of facial erythema, though it was observed to be less effective than purpura-free PDL therapy in reducing redness after 4 treatments (34% vs 52% improvement, respectively); however, treatment with the Nd:YAG laser was found to be significantly (P=.0028) less painful.47
Intense pulsed light is unique from the previously discussed light-based therapies in that it uses noncoherent light with wavelengths between 500 and 1200 nm. Cutoff filters may be used to allow for more selective tissue damage depending on the depth of penetration desired. Intense pulsed light has been shown to be equally as efficacious as purpura-free PDL therapy in the treatment of erythema and telangiectasia in a randomized, controlled, single-blind, split-face trial.48 Additionally, a study of 200 patients with facial vascular lesions, of whom 74 patients had rosacea, showed that intense pulsed light therapy resulted in a 75% to 100% improvement of lesions in 174 of 188 (92.5%) patients who returned for follow-up. Treatment often required at least 2 sessions, but overall adverse effects were reported to be minimal.49
Photodynamic therapy is a well-studied and often utilized treatment of a variety of skin conditions, but there have only been a few studies regarding its use in rosacea. Photodynamic therapy involves the use of topically applied photosensitizing agents such as 5-aminolevulinic acid or methyl aminolevulinate before exposure to red or blue light. This process generates reactive oxygen species, though the exact mechanism of action through which patients achieve cosmetic improvement in rosacea is unclear. In one study of 17 patients with varying rosacea subtypes treated with methyl aminolevulinate and red light, drastic relief of symptoms was seen in 10 (58.8%) patients, marked improvement in 4 (23.5%) patients, and no response in 3 (17.6%) patients. Most patients report a transient irritant skin reaction at the site of therapy.50
Ablative lasers such as the CO2 (10,600 nm) and Er:YAG (2940 nm) lasers also have been shown to be useful in the treatment of rosacea, specifically for the management of rhinophymatous features. Excellent results have been achieved with these lasers given their ability to provide near-bloodless surgical fields. In a 13-year review of 124 patients with rhinophyma receiving a single CO2 laser treatment, good to excellent results were achieved in 118 (95.2%) of patients when evaluated at 3 months posttreatment.51 Patient satisfaction also is reported to be high with few adverse effects reported. The evidence for the Er:YAG laser is not as strong, but the current reports indicate efficacy and safety similar to that of the CO2 laser.52
Procedural Therapies
Procedural therapies in rosacea generally are reserved for management of rhinophyma and include electrocautery, cryotherapy, radiotherapy, dermabrasion, scalpel excisions, flap reconstruction, and skin grafts.30,53 The details and evidence for these methods is beyond the scope of this paper, but it is important to be aware of such modalities. As with most surgical procedures, operator skill and experience may affect treatment outcomes, and there also are definite risks for postprocedural scarring, swelling, erythema, and pigmentation changes. Recently, anecdotal evidence has shown that botulinum toxin injections may be effective for patients with refractory flushing and erythema, but larger studies will be necessary to better assess these claims.54,55
Conclusion
Although recent advances in pharmacology and laser technology have provided physicians with new and effective treatment modalities for rosacea, it remains a poorly understood disease without a definitive cure. The negative impact of rosacea on patients’ quality of life can be substantial, but effective management of cosmetic symptoms can minimize such deleterious effects. Therapy should be individualized and directed at treating the symptoms that are most bothersome to the patient. Additionally, effective treatment often will require a combination of modalities or sequential therapies to achieve optimal cosmetic outcomes.
1. Tan J, Berg M. Rosacea: current state of epidemiology. J Am Acad Dermatol. 2013;69(6 suppl 1):S27-S35.
2. Rosacea prevalence map. National Rosacea Society Web site. http://rosacea.org/press/prevalencemap. Accessed June 16, 2015.
3. Steinhoff M, Schauber J, Leyden JJ. New insights into rosacea pathophysiology: a review of recent findings. J Am Acad Dermatol. 2013;69(6 suppl 1):S15-S26.
4. Del Rosso JQ, Thiboutot D, Gallo R, et al. Consensus recommendations from the American Acne & Rosacea Society on the management of rosacea, part 1: a status report on the disease state, general measures, and adjunctive skin care. Cutis. 2013;92:234-240.
5. Wilkin J, Dahl M, Detmar M, et al. Standard grading system for rosacea: report of the National Rosacea Society Expert Committee on the classification and staging of rosacea. J Am Acad Dermatol. 2004;50:907-912.
6. Wilkin J, Dahl M, Detmar M, et al. Standard classification of rosacea: report of the National Rosacea Society expert committee on the classification and staging of rosacea. J Am Acad Dermatol. 2002;46:584-587.
7. Feldman SR, Huang WW, Huynh TT. Current drug therapies for rosacea: a chronic vascular and inflammatory skin disease. J Manag Care Spec Pharm. 2014;20:623-629.
8. Moustafa F, Lewallen RS, Feldman SR. The psychological impact of rosacea and the influence of current management options. J Am Acad Dermatol. 2014;71:973-980.
9. Mansouri Y, Goldenberg G. Devices and topical agents for rosacea management. Cutis. 2014;94:21-25.
10. Levin J, Miller R. A guide to the ingredients and potential benefits of over-the-counter cleansers and moisturizers for rosacea patients. J Clin Aesthet Dermatol. 2011;4:31-49.
11. van Zuuren EJ, Kramer S, Carter B, et al. Interventions for rosacea. Cochrane Database Syst Rev. 2011;3:CD003262.
12. Liu RH, Smith MK, Basta SA, et al. Azelaic acid in the treatment of papulopustular rosacea: a systematic review of randomized controlled trials. Arch Dermatol. 2006;142:1047-1052.
13. Elewski B, Fleischer AB Jr, Pariser DM. A comparison of 15% azelaic acid gel and 0.75% metronidazole gel in the topical treatment of papulopustular rosacea: results of a randomized trial. Arch Dermatol. 2003;139:1444-1450.
14. Torok HM, Webster G, Dunlap FE, et al. Combination sodium sulfacetamide 10% and sulfur 5% cream with sunscreens versus metronidazole 0.75% cream for rosacea. Cutis. 2005;75:357-363.
15. Trumbore MW, Goldstein JA, Gurge RM. Treatment of papulopustular rosacea with sodium sulfacetamide 10%/sulfur 5% emollient foam. J Drugs Dermatol. 2009;8:299-304.
16. Piwnica D, Rosignoli C, de Menonville ST, et al. Vasoconstriction and anti-inflammatory properties of the selective alpha-adrenergic receptor agonist brimonidine. J Dermatol Sci. 2014;75:49-54.
17. Fowler J Jr, Jackson M, Moore A, et al. Efficacy and safety of once-daily topical brimonidine tartrate gel 0.5% for the treatment of moderate to severe facial erythema of rosacea: results of two randomized, double-blind, and vehicle-controlled pivotal studies. J Drugs Dermatol. 2013;12:650-656.
18. Fowler J, Jarratt M, Moore A, et al. Once-daily topical brimonidine tartrate gel 0.5% is a novel treatment of moderate to severe facial erythema of rosacea: results of two multicenter, randomized and vehicle-controlled studies. Br J Dermatol. 2012;166:633-641.
19. Moore A, Kempers S, Murakawa G, et al. Long-term safety and efficacy of once-daily topical brimonidine tartrate gel 0.5% for the treatment of moderate to severe facial erythema of rosacea: results of a 1-year open-label study. J Drugs Dermatol. 2014;13:56-61.
20. Routt ET, Levitt JO. Rebound erythema and burning sensation from a new topical brimonidine tartrate gel 0.33%. J Am Acad Dermatol. 2014;70:e37-e38.
21. Ilkovitch D, Pomerantz RG. Brimonidine effective but may lead to significant rebound erythema. J Am Acad Dermatol. 2014;70:e109-e110.
22. Kim JH, Oh YS, Ji JH, et al. Rosacea (erythematotelangiectatic type) effectively improved by topical xylometazoline. J Dermatol. 2011;38:510-513.
23. Shanler SD, Ondo AL. Successful treatment of erythema and flushing of rosacea using a topically applied selective alpha1-adrenergic receptor antagonist, oxymetazoline. Arch Dermatol. 2007;143:1369-1371.
24. Stein-Gold L, Kircik L, Fowler J, et al. Efficacy and safety of ivermectin 1% cream in treatment of papulopustular rosacea: results of two randomized, double-blind, vehicle-controlled pivotal studies. J Drugs Dermatol. 2014;13:316-323.
25. Stein-Gold L, Kircik L, Fowler J, et al. Long-term safety of ivermectin 1% cream vs azelaic acid 15% gel in treating inflammatory lesions of rosacea: results of two 40-week controlled, investigator-blinded trials. J Drugs Dermatol. 2014;13:1380-1386.
26. Taieb A, Ortonne JP, Ruzicka T, et al. Superiority of ivermectin 1% cream over metronidazole 0.75% cream in treating inflammatory lesions of rosacea: a randomized, investigator-blinded trial. Br J Dermatol. 2015;172:1103-1110.
27. Koçak M, Ya˘gli S, Vahapo˘glu G, et al. Permethrin 5% cream versus metronidazole 0.75% gel for the treatment of papulopustular rosacea. a randomized double-blind placebo-controlled study. Dermatology (Basel). 2002;205:265-270.
28. Bikowski JB, Del Rosso JQ. Demodex dermatitis: a retrospective analysis of clinical diagnosis and successful treatment with topical crotamiton. J Clin Aesthet Dermatol. 2009;2:20-25.
29. Layton A, Thiboutot D. Emerging therapies in rosacea. J Am Acad Dermatol. 2013;69(6 suppl 1):S57-S65.
30. Pelle MT, Crawford GH, James WD. Rosacea: II. therapy. J Am Acad Dermatol. 2004;51:499-512, quiz 513-514.
31. Sapadin AN, Fleischmajer R. Tetracyclines: nonantibiotic properties and their clinical implications. J Am Acad Dermatol. 2006;54:258-265.
32. Korting HC, Schöllmann C. Tetracycline actions relevant to rosacea treatment. Skin Pharmacol Physiol. 2009;22:287-294.
33. Thomas J, Walker C, Bradshaw M. Long-term use of subantimicrobial dose doxycycline does not lead to changes in antimicrobial susceptibility. J Periodontol. 2000;71:1472-1483.
34. Del Rosso JQ, Webster GF, Jackson M, et al. Two randomized phase III clinical trials evaluating anti-inflammatory dose doxycycline (40-mg doxycycline, USP capsules) administered once daily for treatment of rosacea. J Am Acad Dermatol. 2007;56:791-802.
35. Webster GF. An open-label, community-based, 12-week assessment of the effectiveness and safety of monotherapy with doxycycline 40 mg (30-mg immediate-release and 10-mg delayed-release beads). Cutis. 2010;86(suppl 5):7-15.
36. Del Rosso JQ, Schlessinger J, Werschler P. Comparison of anti-inflammatory dose doxycycline versus doxycycline 100 mg in the treatment of rosacea. J Drugs Dermatol. 2008;7:573-576.
37. Del Rosso JQ, Thiboutot D, Gallo R, et al. Consensus recommendations from the American Acne & Rosacea Society on the management of rosacea, part 3: a status report on systemic therapies. Cutis. 2014;93:18-28.
38. Torresani C. Clarithromycin: a new perspective in rosacea treatment. Int J Dermatol. 1998;37:347-349.
39. Bakar O, Demircay Z, Gürbüz O. Therapeutic potential of azithromycin in rosacea. Int J Dermatol. 2004;43:151-154.
40. Saihan EM, Burton JL. A double-blind trial of metronidazole versus oxytetracycline therapy for rosacea. Br J Dermatol. 1980;102:443-445.
41. Park H, Del Rosso JQ. Use of oral isotretinoin in the management of rosacea. J Clin Aesthet Dermatol. 2011;4:54-61.
42. Gollnick H, Blume-Peytavi U, Szabo EL, et al. Systemic isotretinoin in the treatment of rosacea—doxycycline-and placebo-controlled, randomized clinical study. J Dtsch Dermatol Ges. 2010;8:505-515.
43. Hofer T. Continuous “microdose” isotretinoin in adult recalcitrant rosacea. Clin Exp Dermatol. 2004;29:204-205.
44. Tanghetti E, Del Rosso JQ, Thiboutot D, et al. Consensus recommendations from the American Acne & Rosacea Society on the management of rosacea, part 4: a status report on physical modalities and devices. Cutis. 2014;93:71-76.
45. Alam M, Dover JS, Arndt KA. Treatment of facial telangiectasia with variable-pulse high-fluence pulsed-dye laser: comparison of efficacy with fluences immediately above and below the purpura threshold. Dermatol Surg. 2003;29:681-684.
46. Uebelhoer NS, Bogle MA, Stewart B, et al. A split-face comparison study of pulsed 532-nm KTP laser and 595-nm pulsed dye laser in the treatment of facial telangiectasias and diffuse telangiectatic facial erythema. Dermatol Surg. 2007;33:441-448.
47. Alam M, Voravutinon N, Warycha M, et al. Comparative effectiveness of nonpurpuragenic 595-nm pulsed dye laser and microsecond 1064-nm neodymium:yttrium-aluminum-garnet laser for treatment of diffuse facial erythema: a double-blind randomized controlled trial. J Am Acad Dermatol. 2013;69:438-443.
48. Neuhaus IM, Zane LT, Tope WD. Comparative efficacy of nonpurpuragenic pulsed dye laser and intense pulsed light for erythematotelangiectatic rosacea. Dermatol Surg. 2009;35:920-928.
49. Angermeier MC. Treatment of facial vascular lesions with intense pulsed light. J Cutan Laser Ther. 1999;1:95-100.
50. Bryld LE, Jemec GB. Photodynamic therapy in a series of rosacea patients. J Eur Acad Dermatol Venereol. 2007;21:1199-1202.
51. Maden V, Ferguson JE, August PJ. Carbon dioxide laser treatment of rhinophyma: a review of 124 patients. Br J Dermatol. 2009;161:814-818.
52. Fincher EF, Gladstone HB. Use of a dual-mode erbium:YAG laser for the surgical correction of rhinophyma. Arch Facial Plast Surg. 2004;6:267-271.
53. Lloyd KM. Surgical correction of rhinophyma. Arch Dermatol. 1990;126:721-723.
54. Dayan SH, Pritzker RN, Arkins JP. A new treatment regimen for rosacea: onabotulinumtoxinA. J Drugs Dermatol. 2012;11:e76-e79.
55. Park KY, Hyun MY, Jeong SY, et al. Botulinum toxin for the treatment of refractory erythema and flushing of rosacea. Dermatology. 2015;230:299-301.
Rosacea is a commonly encountered chronic inflammatory skin disease that affects an estimated 16 million Americans and exhibits a particular predilection for the convexities of the central face (eg, forehead, cheeks, nose, chin).1,2 The pathophysiology of rosacea remains poorly understood despite the relatively high prevalence of the disease and substantial ongoing research.3 The current paradigm suggests a complex multifactorial interplay involving aberrations of the innate and adaptive immune system, neurovascular dysregulation, blood and lymphatic vessel changes, genetic predispositions, and overgrowth of commensal organisms such as Demodex.3 Additionally, a variety of external factors may exacerbate clinical symptoms (eg, UV radiation, heat exposure, spicy food, alcohol, stress).
The diagnosis of rosacea is made clinically and rarely requires histologic confirmation. Although rosacea can present with a wide range of clinical features that often wax and wane over time, a near universal finding is diffuse centrofacial erythema.4 This centrofacial redness may symptomatically worsen during a flare period, causing flushing, but it often persists nontransiently between flares as background erythema. Other variable findings of rosacea include the presence of telangiectases, edema, plaques, phymatous changes, dry skin, ocular manifestations, and inflammatory lesions in the form of papules and pustules.5 Patients also may report a stinging or burning sensation in affected areas. It is important to note that most patients will only exhibit some of these clinical features and that symptoms often vary in the timing of their emergence or regression.5 A classification system has been developed for rosacea that categorizes the disease into 4 subtypes (erythematotelangiectatic, papulopustular, phymatous, and ocular) and one variant (granulomatous).6 These categories are determined by the grouping of clinical features present, but it is not uncommon for patients to exhibit clinical manifestations of more than 1 subtype.7
The detrimental cosmetic effects of rosacea are obvious given its chronic nature and tendency to affect highly visible areas such as the face. As such, rosacea can have a devastating impact on patients’ quality of life.8 Patients with rosacea have been reported to have higher incidence rates of low self-esteem, embarrassment, social anxiety, and depression as compared to the rest of the population. Effective treatment, however, can improve cosmetic appearance and mitigate the negative psychosocial impacts of the disease.8
Treatment of rosacea focuses on relieving cosmetic symptoms, as no curative therapy currently exists. Treatment comes in a wide variety of forms, including topical medications, systemic pharmacologic therapies, light-based modalities, and procedural interventions. Choice of therapy should be determined on a case-by-case basis as guided by the clinical features present, and combination or sequential therapies often are required to achieve optimal cosmetic results. In this article, we review both existing and emerging treatments of rosacea and assess their ability to improve the cosmetic symptoms of rosacea (Table).
Skin Care
Proper skin care is an important aspect of treatment for all patients with rosacea and thus includes the use of over-the-counter cleansers, moisturizers, and sunscreens.9 The choice of skin care products is an important consideration given the often hypersensitive skin of rosacea patients. Moisturizers and cleansers should have an acidic to neutral pH, similar to normal skin. They should not contain emulsifiers that strip moisture from the skin or protective lipids and proteins from the stratum corneum.10 Moisturizers without irritants, abrasives, or allergens should be used following skin cleansing. Protection from UV radiation with sunscreen, ideally with a sun protection factor greater than 30, is particularly important, as it can prevent UV-induced rosacea flares as well as photodamage that can cause additional erythema and telangiectasia.4 Rosacea patients also may find green-tinted makeup to be useful in concealing areas of erythema.8
Topical Therapy
Currently, there are only 5 US Food and Drug Administration (FDA)–approved topical medications for the treatment of rosacea: metronidazole (MTZ) gel 0.75% and 1%, azelaic acid (AzA) gel 15%, sodium sulfacetamide (SS) 10%–sulfur 5% lotion and cream, brimonidine tartrate (BT) gel 0.5%, and the most recently approved ivermectin (IVM) cream 1%.7 Metronidazole, AzA, and SS primarily are used to treat the inflammatory papules and pustules of rosacea, while BT is used to treat persistent background erythema. The exact mechanisms of action by which MTZ, AzA, and SS treat rosacea are unclear, but they are thought to reduce inflammation and/or immune response. Metronidazole and AzA both have demonstrated favorable safety profiles and significant (P<.05) efficacy over vehicle in reducing inflammatory lesions in numerous well-controlled randomized clinical studies.4,11,12 There is some evidence that AzA may be more effective than MTZ; one 15-week multicenter, double-blind, randomized, parallel-group study demonstrated that twice-daily AzA gel 15% showed significant superiority (P=.02) over twice-daily MTZ gel 0.75% in improving the inflammatory lesions and erythema of rosacea.13 Sodium sulfacetamide also has shown good efficacy in the treatment of inflammatory lesions and performed significantly better (P=.04) than MTZ according to one multicenter, investigator-blinded, randomized, parallel-group study,14 but the overall evidence is not as strong as MTZ and AzA.4,11,15 The most common adverse effect for MTZ, AzA, and SS is application-site irritation, but overall most patients report good tolerance to these topical medications.4 Azelaic acid is unique in that patients may report stinging, tingling, or burning after application, but these effects are not associated with visible skin changes and usually are transient, generally remitting after 1 to 2 weeks.4
Brimonidine tartrate is a highly selective α2-adrenergic receptor agonist whose mechanism of action in the treatment of rosacea is thought to involve vasoconstriction of superficial skin vasculature and to a lesser extent anti-inflammatory effects.16 In a double-blind, randomized, vehicle-controlled phase 3 trial, application of BT gel 0.5% once daily for 4 weeks demonstrated significant efficacy over vehicle (P<.001) in treating persistent nontransient facial erythema in 553 adult patients with 2 or fewer papulopustular lesions as evaluated over 12 hours on days 1, 15, and 29.17 Notably, a substantial difference in cosmetic appearance was observed in another study as early as 30 minutes after the first gel application on day 1.18 The results of this phase 3 trial17 mirrored those of the phase 2 dose-optimization and safety studies of similar design.18 In addition to another long-term, 1-year, open-label study,19 both phase 2 and 3 studies have shown favorable safety profiles with no reports of tachyphylaxis, rebound erythema, or aggravation of other disease features such as telangiectases or inflammatory lesions.17,18 Recently, however, there have been some reports of considerable rebound erythema with BT use and thus patients should be made aware of this possibility.20,21 Case reports of successful treatment of background erythema and flushing with other topically applied adrenergic receptor modifiers such as oxymetazoline and xylometazoline have been published in the literature,22,23 but additional research will be necessary to validate these claims.
Ivermectin, a decades-old antiparasitic, has recently shown promising results as a treatment of rosacea patients with moderate to severe papulopustular lesions. Its therapeutic effect is believed to be mediated by its activity against Demodex, a natural skin mite that has been found at increased concentrations in a subset of patients with rosacea, as well as by its natural anti-inflammatory properties.24 In 2 identically designed, randomized, double-blind, controlled trials of IVM cream 1% applied once daily for 12 weeks, a significantly larger proportion of patients in the IVM groups achieved an investigator global assessment of clear or almost clear as compared to vehicle (IVM: 38.4% and 40.1%, respectively; vehicle: 11.6% and 18.8%, respectively; P<.001). Both trials also demonstrated that IVM was significantly superior to vehicle in the reduction of inflammatory lesion counts measured at week 12 as compared to baseline (IVM: 76.0% and 75.0%, respectively; vehicle: 50.0% and 50.0%, respectively; P<.001).24 An extension of these original trials demonstrated long-term safety with up to 52 weeks of topical IVM use and reported a low incidence rate of adverse effects, most commonly transient skin burning, pruritus, and dryness. Notably, the incidence rate of these adverse effects was lower than a comparison group receiving AzA gel 15% once daily.25 Once-daily application of IVM cream 1% also has recently demonstrated superiority over twice-daily MTZ cream 0.75% for 16 weeks in a phase 3 investigator-blinded, randomized, parallel-group study. The IVM group was significantly superior to MTZ in the reduction of inflammatory lesions as compared to baseline (83.0% vs 73.7%) and in the number of participants who achieved an investigator global assessment score of clear or almost clear (84.9% vs 75.4%)(both P<.001).26 There also is limited evidence for the use of other antiparasitic topical medications such as crotamiton 10% and permethrin 5%, but such agents frequently cause irritation and may not be well tolerated in rosacea patients.27-29
There are a variety of other non–FDA-approved topical medications that have been used with varying success in the literature, including cyclosporine, macrolides, benzoyl peroxide, retinoids, and calcineurin inhibitors such as tacrolimus and pimecrolimus. Evidence for the use of these medications generally is limited to a few studies with small numbers of patients and will not be discussed further in this article.4,11,30 These agents, however, may be useful in select cases when first-line regimens have failed and also may be good targets for future research.
Systemic Therapy
The mainstay of systemic treatment of rosacea centers around the tetracyclines, a group of antibiotics that have been used off label for rosacea since the 1950s.31 The therapeutic effects of tetracyclines in the treatment of rosacea are thought to revolve around their anti-inflammatory effects rather than their antibacterial properties.32 Currently, the only FDA-approved oral agent for treatment of the inflammatory lesions of rosacea is doxycycline 40-mg modified-release capsules taken once daily. These modified capsules allow for instant release of 30 mg and delayed release of 10 mg of doxycycline. This dosing is considered to be anti-inflammatory rather than antimicrobial, as it does not produce antibiotic selection pressure even with prolonged use.33 Efficacy of 40-mg subantimicrobial-dose doxycycline (SDD) has been demonstrated in 2 phase 3 multicenter, parallel-group, randomized, double-blind, placebo-controlled studies in which SDD demonstrated a significantly greater reduction in the number of total inflammatory lesions at week 16 compared to placebo (P<.001).34 Subantimicrobial-dose doxycycline also has been shown to be equally as efficacious in reducing inflammatory lesions as traditional-dose doxycycline.35 There also is some evidence for the efficacy of SDD in reducing overall erythema, as demonstrated by one open-label, community-based study in which SDD monotherapy resulted in clinician erythema assessment scores of mild or no erythema in 75% of patients with mild to severe rosacea at baseline after 12 weeks of therapy.35 Additionally, SDD is considered to be safe and well-tolerated and does not generally result in the adverse effects that may be seen in antibiotic-level doses of doxycycline (eg, gastrointestinal upset, vaginal candidiasis, photosensitivity).34,36,37 Other antibiotics such as clarithromycin, azithromycin, and MTZ also have been studied as treatments of papulopustular rosacea at antibiotic-level doses with good therapeutic effect.38-40 These therapies, however, generally are not used unless there are contraindications for use of tetracycline antibiotics, such as pregnancy or allergy, as the overall evidence is not as strong and there may be increased risks for serious adverse effects.30
Although it is not FDA approved, isotretinoin is an important therapeutic option for select rosacea patients, as it is the only pharmacologic agent that has shown efficacy for the phymatous changes of rosacea. Its efficacy, however, is limited to early-stage rhinophyma that has not yet progressed to the fibrotic or mucinous stages of disease in which it has been shown to reduce the size and number of cutaneous sebaceous glands.30,41 Isotretinoin at 0.3 mg/kg daily also has shown noninferiority in treatment of the inflammatory papules and pustules of rosacea as compared to antibiotic dosing of doxycycline in one large-scale, placebo-controlled, randomized, 12-week multicenter study.42 Unfortunately, recurrence is highly likely after isotretinoin therapy is discontinued.30,41 However, continuous “microdose” isotretinoin at 0.03 to 0.17 mg/kg daily has shown evidence for efficacy in treatment of recalcitrant papulopustular disease.43 Such dosing may have the added benefit of reduced risk for radiographic changes associated with long-term isotretinoin use.43
Light-Based Therapy
Light-based modalities are an important tool set in the management of rosacea symptoms, as they can treat telangiectases for which medical therapy is not generally effective.9 To a lesser extent, light-based modalities also can help alleviate background erythema. The most commonly used light-based modalities include the pulsed dye laser (PDL)(Figure), potassium titanyl phosphate (KTP) laser, Nd:YAG laser, intense pulsed light, photodynamic therapy, CO2 laser, and erbium-doped YAG (Er:YAG) laser. These treatments produce clinical results by targeting specific chromophores such as oxyhemoglobin, deoxyhemoglobin, methemoglobin, and clotted blood with light of specific wavelengths to induce thermolysis of vasculature while sparing collateral tissue.44 Generally, larger telangiectatic vessels are more amenable to therapy than smaller vessels, which usually require higher energy to be delivered in a shorter period of time, thus predisposing the patient to the development of purpura that may last for 1 to 2 weeks.44
|
|
Historically, PDL used a light wavelength of 577 nm and was classically associated with posttherapy purpura; however, modern PDLs use wavelengths of 585 or 595 nm and are associated with a reduced risk for purpura through the use of longer pulse durations (ie, 10–40 millisecond), multiple minipulses, multiple passes, and advanced epidermal cooling methods.9,44 In a small, prospective, randomized, controlled, nonblinded study, PDL therapy with fluence sufficiently high enough to induce purpura achieved an approximate 50% improvement in telangiectasia grading scores in most patients after a single treatment.45 Notably, PDL therapy at purpura-inducing settings was reported to be much more efficacious than settings that did not induce purpura (purpura free), especially in the treatment of thicker telangiectases.45
Potassium titanyl phosphate lasers make use of shorter wavelengths (532 nm) than PDL and thus are better able to target superficial vasculature, which translates into a reduced risk for purpura and faster healing times. However, KTP laser therapy typically is only reserved for patients with lighter skin types, as this wavelength of light is more likely to result in higher melanin absorption and possible postinflammatory hyperpigmentation.44 A split-face study comparing the KTP laser with PDL determined that the KTP laser was able to achieve 62% clearing after the first treatment and 85% clearance after the third treatment versus 49% and 75% for PDL treatment, respectively; however, the KTP laser had higher rates of posttherapy erythema lasting at least 1 day (58% vs 8%).46
Conversely, the Nd:YAG laser uses longer wavelengths (1064 nm) and can achieve deeper skin penetration, which may be effective for larger, recalcitrant, or deeper blue-tinted vessels. A split-face, double-blind, randomized, controlled trial found Nd:YAG laser therapy to be an effective treatment of facial erythema, though it was observed to be less effective than purpura-free PDL therapy in reducing redness after 4 treatments (34% vs 52% improvement, respectively); however, treatment with the Nd:YAG laser was found to be significantly (P=.0028) less painful.47
Intense pulsed light is unique from the previously discussed light-based therapies in that it uses noncoherent light with wavelengths between 500 and 1200 nm. Cutoff filters may be used to allow for more selective tissue damage depending on the depth of penetration desired. Intense pulsed light has been shown to be equally as efficacious as purpura-free PDL therapy in the treatment of erythema and telangiectasia in a randomized, controlled, single-blind, split-face trial.48 Additionally, a study of 200 patients with facial vascular lesions, of whom 74 patients had rosacea, showed that intense pulsed light therapy resulted in a 75% to 100% improvement of lesions in 174 of 188 (92.5%) patients who returned for follow-up. Treatment often required at least 2 sessions, but overall adverse effects were reported to be minimal.49
Photodynamic therapy is a well-studied and often utilized treatment of a variety of skin conditions, but there have only been a few studies regarding its use in rosacea. Photodynamic therapy involves the use of topically applied photosensitizing agents such as 5-aminolevulinic acid or methyl aminolevulinate before exposure to red or blue light. This process generates reactive oxygen species, though the exact mechanism of action through which patients achieve cosmetic improvement in rosacea is unclear. In one study of 17 patients with varying rosacea subtypes treated with methyl aminolevulinate and red light, drastic relief of symptoms was seen in 10 (58.8%) patients, marked improvement in 4 (23.5%) patients, and no response in 3 (17.6%) patients. Most patients report a transient irritant skin reaction at the site of therapy.50
Ablative lasers such as the CO2 (10,600 nm) and Er:YAG (2940 nm) lasers also have been shown to be useful in the treatment of rosacea, specifically for the management of rhinophymatous features. Excellent results have been achieved with these lasers given their ability to provide near-bloodless surgical fields. In a 13-year review of 124 patients with rhinophyma receiving a single CO2 laser treatment, good to excellent results were achieved in 118 (95.2%) of patients when evaluated at 3 months posttreatment.51 Patient satisfaction also is reported to be high with few adverse effects reported. The evidence for the Er:YAG laser is not as strong, but the current reports indicate efficacy and safety similar to that of the CO2 laser.52
Procedural Therapies
Procedural therapies in rosacea generally are reserved for management of rhinophyma and include electrocautery, cryotherapy, radiotherapy, dermabrasion, scalpel excisions, flap reconstruction, and skin grafts.30,53 The details and evidence for these methods is beyond the scope of this paper, but it is important to be aware of such modalities. As with most surgical procedures, operator skill and experience may affect treatment outcomes, and there also are definite risks for postprocedural scarring, swelling, erythema, and pigmentation changes. Recently, anecdotal evidence has shown that botulinum toxin injections may be effective for patients with refractory flushing and erythema, but larger studies will be necessary to better assess these claims.54,55
Conclusion
Although recent advances in pharmacology and laser technology have provided physicians with new and effective treatment modalities for rosacea, it remains a poorly understood disease without a definitive cure. The negative impact of rosacea on patients’ quality of life can be substantial, but effective management of cosmetic symptoms can minimize such deleterious effects. Therapy should be individualized and directed at treating the symptoms that are most bothersome to the patient. Additionally, effective treatment often will require a combination of modalities or sequential therapies to achieve optimal cosmetic outcomes.
1. Tan J, Berg M. Rosacea: current state of epidemiology. J Am Acad Dermatol. 2013;69(6 suppl 1):S27-S35.
2. Rosacea prevalence map. National Rosacea Society Web site. http://rosacea.org/press/prevalencemap. Accessed June 16, 2015.
3. Steinhoff M, Schauber J, Leyden JJ. New insights into rosacea pathophysiology: a review of recent findings. J Am Acad Dermatol. 2013;69(6 suppl 1):S15-S26.
4. Del Rosso JQ, Thiboutot D, Gallo R, et al. Consensus recommendations from the American Acne & Rosacea Society on the management of rosacea, part 1: a status report on the disease state, general measures, and adjunctive skin care. Cutis. 2013;92:234-240.
5. Wilkin J, Dahl M, Detmar M, et al. Standard grading system for rosacea: report of the National Rosacea Society Expert Committee on the classification and staging of rosacea. J Am Acad Dermatol. 2004;50:907-912.
6. Wilkin J, Dahl M, Detmar M, et al. Standard classification of rosacea: report of the National Rosacea Society expert committee on the classification and staging of rosacea. J Am Acad Dermatol. 2002;46:584-587.
7. Feldman SR, Huang WW, Huynh TT. Current drug therapies for rosacea: a chronic vascular and inflammatory skin disease. J Manag Care Spec Pharm. 2014;20:623-629.
8. Moustafa F, Lewallen RS, Feldman SR. The psychological impact of rosacea and the influence of current management options. J Am Acad Dermatol. 2014;71:973-980.
9. Mansouri Y, Goldenberg G. Devices and topical agents for rosacea management. Cutis. 2014;94:21-25.
10. Levin J, Miller R. A guide to the ingredients and potential benefits of over-the-counter cleansers and moisturizers for rosacea patients. J Clin Aesthet Dermatol. 2011;4:31-49.
11. van Zuuren EJ, Kramer S, Carter B, et al. Interventions for rosacea. Cochrane Database Syst Rev. 2011;3:CD003262.
12. Liu RH, Smith MK, Basta SA, et al. Azelaic acid in the treatment of papulopustular rosacea: a systematic review of randomized controlled trials. Arch Dermatol. 2006;142:1047-1052.
13. Elewski B, Fleischer AB Jr, Pariser DM. A comparison of 15% azelaic acid gel and 0.75% metronidazole gel in the topical treatment of papulopustular rosacea: results of a randomized trial. Arch Dermatol. 2003;139:1444-1450.
14. Torok HM, Webster G, Dunlap FE, et al. Combination sodium sulfacetamide 10% and sulfur 5% cream with sunscreens versus metronidazole 0.75% cream for rosacea. Cutis. 2005;75:357-363.
15. Trumbore MW, Goldstein JA, Gurge RM. Treatment of papulopustular rosacea with sodium sulfacetamide 10%/sulfur 5% emollient foam. J Drugs Dermatol. 2009;8:299-304.
16. Piwnica D, Rosignoli C, de Menonville ST, et al. Vasoconstriction and anti-inflammatory properties of the selective alpha-adrenergic receptor agonist brimonidine. J Dermatol Sci. 2014;75:49-54.
17. Fowler J Jr, Jackson M, Moore A, et al. Efficacy and safety of once-daily topical brimonidine tartrate gel 0.5% for the treatment of moderate to severe facial erythema of rosacea: results of two randomized, double-blind, and vehicle-controlled pivotal studies. J Drugs Dermatol. 2013;12:650-656.
18. Fowler J, Jarratt M, Moore A, et al. Once-daily topical brimonidine tartrate gel 0.5% is a novel treatment of moderate to severe facial erythema of rosacea: results of two multicenter, randomized and vehicle-controlled studies. Br J Dermatol. 2012;166:633-641.
19. Moore A, Kempers S, Murakawa G, et al. Long-term safety and efficacy of once-daily topical brimonidine tartrate gel 0.5% for the treatment of moderate to severe facial erythema of rosacea: results of a 1-year open-label study. J Drugs Dermatol. 2014;13:56-61.
20. Routt ET, Levitt JO. Rebound erythema and burning sensation from a new topical brimonidine tartrate gel 0.33%. J Am Acad Dermatol. 2014;70:e37-e38.
21. Ilkovitch D, Pomerantz RG. Brimonidine effective but may lead to significant rebound erythema. J Am Acad Dermatol. 2014;70:e109-e110.
22. Kim JH, Oh YS, Ji JH, et al. Rosacea (erythematotelangiectatic type) effectively improved by topical xylometazoline. J Dermatol. 2011;38:510-513.
23. Shanler SD, Ondo AL. Successful treatment of erythema and flushing of rosacea using a topically applied selective alpha1-adrenergic receptor antagonist, oxymetazoline. Arch Dermatol. 2007;143:1369-1371.
24. Stein-Gold L, Kircik L, Fowler J, et al. Efficacy and safety of ivermectin 1% cream in treatment of papulopustular rosacea: results of two randomized, double-blind, vehicle-controlled pivotal studies. J Drugs Dermatol. 2014;13:316-323.
25. Stein-Gold L, Kircik L, Fowler J, et al. Long-term safety of ivermectin 1% cream vs azelaic acid 15% gel in treating inflammatory lesions of rosacea: results of two 40-week controlled, investigator-blinded trials. J Drugs Dermatol. 2014;13:1380-1386.
26. Taieb A, Ortonne JP, Ruzicka T, et al. Superiority of ivermectin 1% cream over metronidazole 0.75% cream in treating inflammatory lesions of rosacea: a randomized, investigator-blinded trial. Br J Dermatol. 2015;172:1103-1110.
27. Koçak M, Ya˘gli S, Vahapo˘glu G, et al. Permethrin 5% cream versus metronidazole 0.75% gel for the treatment of papulopustular rosacea. a randomized double-blind placebo-controlled study. Dermatology (Basel). 2002;205:265-270.
28. Bikowski JB, Del Rosso JQ. Demodex dermatitis: a retrospective analysis of clinical diagnosis and successful treatment with topical crotamiton. J Clin Aesthet Dermatol. 2009;2:20-25.
29. Layton A, Thiboutot D. Emerging therapies in rosacea. J Am Acad Dermatol. 2013;69(6 suppl 1):S57-S65.
30. Pelle MT, Crawford GH, James WD. Rosacea: II. therapy. J Am Acad Dermatol. 2004;51:499-512, quiz 513-514.
31. Sapadin AN, Fleischmajer R. Tetracyclines: nonantibiotic properties and their clinical implications. J Am Acad Dermatol. 2006;54:258-265.
32. Korting HC, Schöllmann C. Tetracycline actions relevant to rosacea treatment. Skin Pharmacol Physiol. 2009;22:287-294.
33. Thomas J, Walker C, Bradshaw M. Long-term use of subantimicrobial dose doxycycline does not lead to changes in antimicrobial susceptibility. J Periodontol. 2000;71:1472-1483.
34. Del Rosso JQ, Webster GF, Jackson M, et al. Two randomized phase III clinical trials evaluating anti-inflammatory dose doxycycline (40-mg doxycycline, USP capsules) administered once daily for treatment of rosacea. J Am Acad Dermatol. 2007;56:791-802.
35. Webster GF. An open-label, community-based, 12-week assessment of the effectiveness and safety of monotherapy with doxycycline 40 mg (30-mg immediate-release and 10-mg delayed-release beads). Cutis. 2010;86(suppl 5):7-15.
36. Del Rosso JQ, Schlessinger J, Werschler P. Comparison of anti-inflammatory dose doxycycline versus doxycycline 100 mg in the treatment of rosacea. J Drugs Dermatol. 2008;7:573-576.
37. Del Rosso JQ, Thiboutot D, Gallo R, et al. Consensus recommendations from the American Acne & Rosacea Society on the management of rosacea, part 3: a status report on systemic therapies. Cutis. 2014;93:18-28.
38. Torresani C. Clarithromycin: a new perspective in rosacea treatment. Int J Dermatol. 1998;37:347-349.
39. Bakar O, Demircay Z, Gürbüz O. Therapeutic potential of azithromycin in rosacea. Int J Dermatol. 2004;43:151-154.
40. Saihan EM, Burton JL. A double-blind trial of metronidazole versus oxytetracycline therapy for rosacea. Br J Dermatol. 1980;102:443-445.
41. Park H, Del Rosso JQ. Use of oral isotretinoin in the management of rosacea. J Clin Aesthet Dermatol. 2011;4:54-61.
42. Gollnick H, Blume-Peytavi U, Szabo EL, et al. Systemic isotretinoin in the treatment of rosacea—doxycycline-and placebo-controlled, randomized clinical study. J Dtsch Dermatol Ges. 2010;8:505-515.
43. Hofer T. Continuous “microdose” isotretinoin in adult recalcitrant rosacea. Clin Exp Dermatol. 2004;29:204-205.
44. Tanghetti E, Del Rosso JQ, Thiboutot D, et al. Consensus recommendations from the American Acne & Rosacea Society on the management of rosacea, part 4: a status report on physical modalities and devices. Cutis. 2014;93:71-76.
45. Alam M, Dover JS, Arndt KA. Treatment of facial telangiectasia with variable-pulse high-fluence pulsed-dye laser: comparison of efficacy with fluences immediately above and below the purpura threshold. Dermatol Surg. 2003;29:681-684.
46. Uebelhoer NS, Bogle MA, Stewart B, et al. A split-face comparison study of pulsed 532-nm KTP laser and 595-nm pulsed dye laser in the treatment of facial telangiectasias and diffuse telangiectatic facial erythema. Dermatol Surg. 2007;33:441-448.
47. Alam M, Voravutinon N, Warycha M, et al. Comparative effectiveness of nonpurpuragenic 595-nm pulsed dye laser and microsecond 1064-nm neodymium:yttrium-aluminum-garnet laser for treatment of diffuse facial erythema: a double-blind randomized controlled trial. J Am Acad Dermatol. 2013;69:438-443.
48. Neuhaus IM, Zane LT, Tope WD. Comparative efficacy of nonpurpuragenic pulsed dye laser and intense pulsed light for erythematotelangiectatic rosacea. Dermatol Surg. 2009;35:920-928.
49. Angermeier MC. Treatment of facial vascular lesions with intense pulsed light. J Cutan Laser Ther. 1999;1:95-100.
50. Bryld LE, Jemec GB. Photodynamic therapy in a series of rosacea patients. J Eur Acad Dermatol Venereol. 2007;21:1199-1202.
51. Maden V, Ferguson JE, August PJ. Carbon dioxide laser treatment of rhinophyma: a review of 124 patients. Br J Dermatol. 2009;161:814-818.
52. Fincher EF, Gladstone HB. Use of a dual-mode erbium:YAG laser for the surgical correction of rhinophyma. Arch Facial Plast Surg. 2004;6:267-271.
53. Lloyd KM. Surgical correction of rhinophyma. Arch Dermatol. 1990;126:721-723.
54. Dayan SH, Pritzker RN, Arkins JP. A new treatment regimen for rosacea: onabotulinumtoxinA. J Drugs Dermatol. 2012;11:e76-e79.
55. Park KY, Hyun MY, Jeong SY, et al. Botulinum toxin for the treatment of refractory erythema and flushing of rosacea. Dermatology. 2015;230:299-301.
Practice Points
- As no definitive cure for rosacea exists, effective treatment is aimed at improving the cosmetic symptoms.
- Choice of therapy should be determined on a case-by-case basis as guided by the clinical features most bothersome to the patient.
- A combination of modalities and/or sequential therapy often is required to achieve optimal cosmetic outcomes.
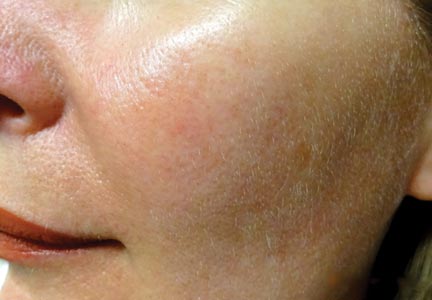
Erythematous Papules and Plaques on the Flank of a Child
The Diagnosis: Asymmetric Periflexural Exanthem of Childhood (Unilateral Laterothoracic Exanthem)
Asymmetric periflexural exanthem of childhood (APEC), also known as unilateral laterothoracic exanthem, is a self-limited eruptive dermatosis that occurs most frequently in infants and young children. The term unilateral laterothoracic exanthem was first coined by Bodemer and de Prost1 in 1992 due to its characteristic distribution. The eruption occurs in children aged 4 months to 10 years, with most cases presenting between 2 and 3 years of age.2 Isolated cases also have been reported in adults.3 It affects girls more often than boys (2:1), and the majority of reported cases have occurred in white individuals. The disease is seen throughout Europe and North America, and seasonal variation has been noted with most cases occurring in late winter and early spring.4,5
|
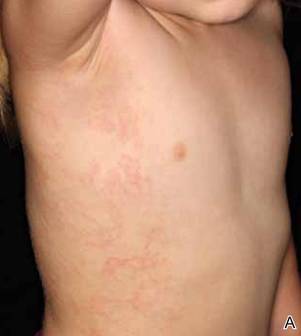
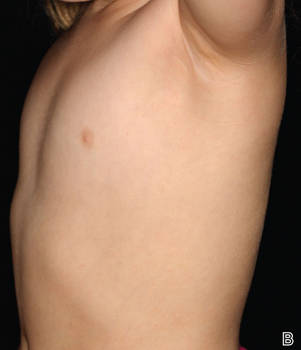
Clinically, APEC is characterized by its asymmetric localization and unilateral onset. In the majority of patients, the eruption presents as discrete erythematous papules that coalesce to form morbilliform plaques that may have reticular or annular configuration (Figure).4 The exanthem begins unilaterally near a flexural area, most commonly the axilla (75% of cases), and spreads centrifugally to the adjacent trunk and proximal extremity. There is no right or left dominance.4,6 There is eventual involvement of the contralateral side in 70% of cases, but a unilateral predominance is maintained throughout the disease course.4 Rarely, the eruption may involve the face, genitals, and palmoplantar surfaces. As in our case, up to three-quarters of affected children report symptoms of an upper respiratory tract or gastrointestinal prodrome, including mild fever, diarrhea, and rhinitis.4 Accompanying regional lymphadenopathy has been reported in the majority of cases, and mild to moderate pruritus is not uncommon. The syndrome is self-limited, with spontaneous resolution commonly occurring 3 to 6 weeks after onset. Although no treatment is required, systemic antihistamines and topical steroids have been used to alleviate pruritus in symptomatic patients. Our patient was treated with triamcinolone cream 0.1% twice daily as well as oral diphenhydramine 25 mg every 6 hours as needed for associated pruritus. The eruption spontaneously resolved over the following 4 weeks.
Although the cause of APEC remains unknown, an infectious etiology has been presumed. The seasonal pattern, lack of efficacy of broad-spectrum antibiotics, frequently reported prodromal symptoms, and reports of familial cases suggest a viral etiology.1 Additionally, the predilection to affect infants and young children as well as lack of recurrence in the same patient suggests that immunity may develop. Although no etiologic agent has been consistently detected, several reports have suggested a possible relationship to parvovirus B19.7,8 Parainfluenzavirus 2, parainfluenzavirus 3, and adenovirus also have been isolated but may represent incidental viral infection.2 An inoculation dermatosis from an arthropod bite also has been suggested, but this claim has not been substantiated.1
The diagnosis often can be made on clinical features alone, and histopathologic evaluation is not required. Histologic features are nonspecific and include a superficial perivascular infiltrate of lymphocytes, often involving the dermal eccrine ducts without involvement of the secretory coils.4,6 Mild lichenoid changes as well as spongiosis with exocytosis of lymphocytes into the acrosyringium also may be present.4 The clinical differential diagnosis of APEC includes allergic contact dermatitis, a nonspecific drug or viral eruption, atypical pityriasis rosea, miliaria, scabies, tinea corporis, and Gianotti-Crosti syndrome. Asymmetric periflexural exanthem of childhood lacks the peripheral scale present in tinea corporis or pityriasis rosea, but when an annular or reticular configuration predominates, a potassium hydroxide preparation of skin scrapings can exclude the presence of a dermatophyte. Similar to APEC, Gianotti-Crosti syndrome affects young children, is preceded by symptoms of a viral prodrome, and spontaneously resolves over several weeks. This condition is distinguished from APEC by the presence of papulovesicles located symmetrically on the face, buttocks, and extensor surface of the extremities, which largely spare the trunk.
Asymmetric periflexural exanthem of childhood is a unique morbilliform eruption of infants and young children characterized by a stereotypical distribution and self-limited course. The cause of this syndrome remains unclear, but most authors suggest a viral etiology. Recognition of this entity and an ability to distinguish it from other common pediatric dermatoses is required to provide reassurance to parents and avoid unnecessary diagnostic procedures and treatments.
1. Bodemer C, de Prost Y. Unilateral laterothoracic exanthem in children: a new disease? J Am Acad Dermatol. 1992;27(5, pt 1):693-696.
2. Nahm WK, Paiva C, Golomb C, et al. Asymmetric periflexural exanthema of childhood: a case involving a 4-month-old infant. Pediatr Dermatol. 2002;19:461-462.
3. Chan PK, To KF, Zawar V, et al. Asymmetric periflexural exanthema in an adult. Clin Exp Dermatol. 2004;29:320-321.
4. McCuaig CC, Russo P, Powell J, et al. Unilateral laterothoracic exanthem. a clinicopathologic study of forty-eight patients. J Am Acad Dermatol. 1996;34:979-984.
5. Taieb A, Megraud F, Legrain V, et al. Asymmetric periflexural exanthem of childhood. J Am Acad Dermatol. 1993;29:391-393.
6. Coustou D, Léauté-Labrèze C, Bioulac-Sage P, et al. Asymmetric periflexural exanthem of childhood. a clinical, pathologic, and epidemiologic prospective study. Arch Dermatol. 1999;135:799-803.
7. Guimerá-Martín-Neda F, Fagundo E, Rodríguez F, et al. Asymmetric periflexural exanthem of childhood: report of two cases with parvovirus B19. J Eur Acad Dermatol Venereol. 2006;20:461-462.
8. Pauluzzi P, Festini G, Gelmetti C. Asymmetric periflexural exanthem of childhood in an adult patient with parvovirus B19. J Eur Acad Dermatol Venereol. 2001;15:372-374.
The Diagnosis: Asymmetric Periflexural Exanthem of Childhood (Unilateral Laterothoracic Exanthem)
Asymmetric periflexural exanthem of childhood (APEC), also known as unilateral laterothoracic exanthem, is a self-limited eruptive dermatosis that occurs most frequently in infants and young children. The term unilateral laterothoracic exanthem was first coined by Bodemer and de Prost1 in 1992 due to its characteristic distribution. The eruption occurs in children aged 4 months to 10 years, with most cases presenting between 2 and 3 years of age.2 Isolated cases also have been reported in adults.3 It affects girls more often than boys (2:1), and the majority of reported cases have occurred in white individuals. The disease is seen throughout Europe and North America, and seasonal variation has been noted with most cases occurring in late winter and early spring.4,5
|
Clinically, APEC is characterized by its asymmetric localization and unilateral onset. In the majority of patients, the eruption presents as discrete erythematous papules that coalesce to form morbilliform plaques that may have reticular or annular configuration (Figure).4 The exanthem begins unilaterally near a flexural area, most commonly the axilla (75% of cases), and spreads centrifugally to the adjacent trunk and proximal extremity. There is no right or left dominance.4,6 There is eventual involvement of the contralateral side in 70% of cases, but a unilateral predominance is maintained throughout the disease course.4 Rarely, the eruption may involve the face, genitals, and palmoplantar surfaces. As in our case, up to three-quarters of affected children report symptoms of an upper respiratory tract or gastrointestinal prodrome, including mild fever, diarrhea, and rhinitis.4 Accompanying regional lymphadenopathy has been reported in the majority of cases, and mild to moderate pruritus is not uncommon. The syndrome is self-limited, with spontaneous resolution commonly occurring 3 to 6 weeks after onset. Although no treatment is required, systemic antihistamines and topical steroids have been used to alleviate pruritus in symptomatic patients. Our patient was treated with triamcinolone cream 0.1% twice daily as well as oral diphenhydramine 25 mg every 6 hours as needed for associated pruritus. The eruption spontaneously resolved over the following 4 weeks.
Although the cause of APEC remains unknown, an infectious etiology has been presumed. The seasonal pattern, lack of efficacy of broad-spectrum antibiotics, frequently reported prodromal symptoms, and reports of familial cases suggest a viral etiology.1 Additionally, the predilection to affect infants and young children as well as lack of recurrence in the same patient suggests that immunity may develop. Although no etiologic agent has been consistently detected, several reports have suggested a possible relationship to parvovirus B19.7,8 Parainfluenzavirus 2, parainfluenzavirus 3, and adenovirus also have been isolated but may represent incidental viral infection.2 An inoculation dermatosis from an arthropod bite also has been suggested, but this claim has not been substantiated.1
The diagnosis often can be made on clinical features alone, and histopathologic evaluation is not required. Histologic features are nonspecific and include a superficial perivascular infiltrate of lymphocytes, often involving the dermal eccrine ducts without involvement of the secretory coils.4,6 Mild lichenoid changes as well as spongiosis with exocytosis of lymphocytes into the acrosyringium also may be present.4 The clinical differential diagnosis of APEC includes allergic contact dermatitis, a nonspecific drug or viral eruption, atypical pityriasis rosea, miliaria, scabies, tinea corporis, and Gianotti-Crosti syndrome. Asymmetric periflexural exanthem of childhood lacks the peripheral scale present in tinea corporis or pityriasis rosea, but when an annular or reticular configuration predominates, a potassium hydroxide preparation of skin scrapings can exclude the presence of a dermatophyte. Similar to APEC, Gianotti-Crosti syndrome affects young children, is preceded by symptoms of a viral prodrome, and spontaneously resolves over several weeks. This condition is distinguished from APEC by the presence of papulovesicles located symmetrically on the face, buttocks, and extensor surface of the extremities, which largely spare the trunk.
Asymmetric periflexural exanthem of childhood is a unique morbilliform eruption of infants and young children characterized by a stereotypical distribution and self-limited course. The cause of this syndrome remains unclear, but most authors suggest a viral etiology. Recognition of this entity and an ability to distinguish it from other common pediatric dermatoses is required to provide reassurance to parents and avoid unnecessary diagnostic procedures and treatments.
1. Bodemer C, de Prost Y. Unilateral laterothoracic exanthem in children: a new disease? J Am Acad Dermatol. 1992;27(5, pt 1):693-696.
2. Nahm WK, Paiva C, Golomb C, et al. Asymmetric periflexural exanthema of childhood: a case involving a 4-month-old infant. Pediatr Dermatol. 2002;19:461-462.
3. Chan PK, To KF, Zawar V, et al. Asymmetric periflexural exanthema in an adult. Clin Exp Dermatol. 2004;29:320-321.
4. McCuaig CC, Russo P, Powell J, et al. Unilateral laterothoracic exanthem. a clinicopathologic study of forty-eight patients. J Am Acad Dermatol. 1996;34:979-984.
5. Taieb A, Megraud F, Legrain V, et al. Asymmetric periflexural exanthem of childhood. J Am Acad Dermatol. 1993;29:391-393.
6. Coustou D, Léauté-Labrèze C, Bioulac-Sage P, et al. Asymmetric periflexural exanthem of childhood. a clinical, pathologic, and epidemiologic prospective study. Arch Dermatol. 1999;135:799-803.
7. Guimerá-Martín-Neda F, Fagundo E, Rodríguez F, et al. Asymmetric periflexural exanthem of childhood: report of two cases with parvovirus B19. J Eur Acad Dermatol Venereol. 2006;20:461-462.
8. Pauluzzi P, Festini G, Gelmetti C. Asymmetric periflexural exanthem of childhood in an adult patient with parvovirus B19. J Eur Acad Dermatol Venereol. 2001;15:372-374.
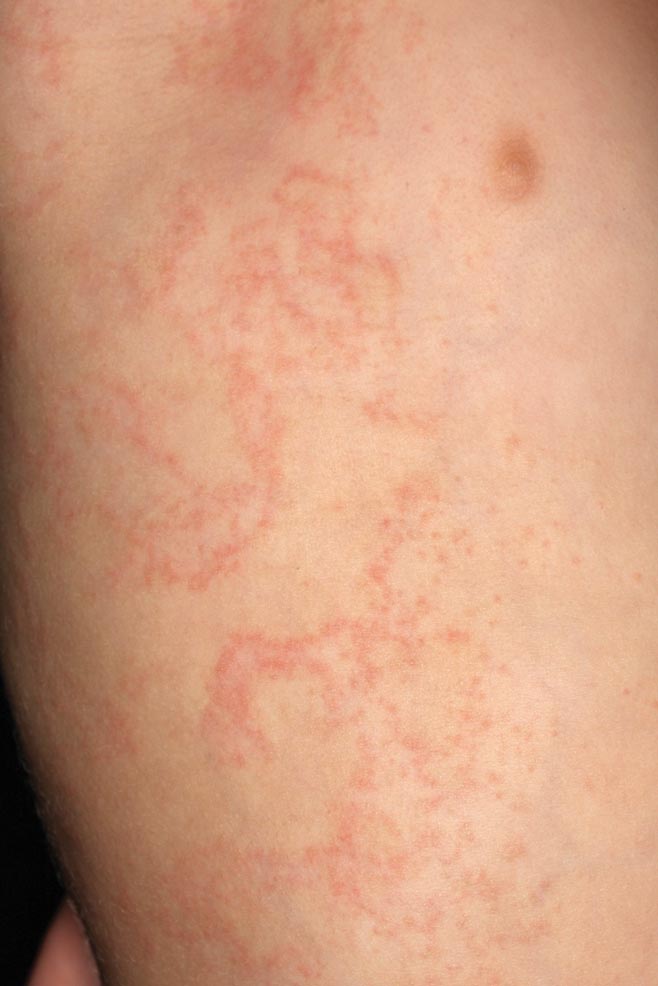
A 2-year-old girl presented with a mildly pruritic rash on the right flank and axilla of 3 weeks’ duration. Her pediatrician prescribed triamcinolone cream 0.1% daily, which was applied for the last week without much improvement. Her mother reported a history of upper respiratory tract infection approximately 1 to 2 weeks prior to onset of the rash.

Routine screening sufficient for detecting occult cancer in patients with VTE
TORONTO – The prevalence of occult cancer is low in patients with a first unprovoked venous thromboembolism, according to results from a multicenter, randomized study presented at the International Society on Thrombosis and Haemostasis congress.
In addition, routine screening with the addition of a comprehensive CT scan of the abdomen and pelvis was no better than routine screening alone in detecting occult cancer in this population.

Those are key findings that Dr. Marc Carrier of the University of Ottawa presented from the Screening for Occult Malignancy in Patients with Idiopathic Venous Thromboembolism (SOME) trial, a multicenter, open-label, randomized controlled trial that compared the efficacy of conventional screening with or without comprehensive CT of the abdomen/pelvis for detecting occult cancers in patients with unprovoked venous thromboembolism (VTE). The results of this study were published the same day as his presentation in the New England Journal of Medicine.
“It has been described that up to 10% of patients with unprovoked VTE are diagnosed with cancer in the year following their VTE diagnosis,” Dr. Carrier said. “Therefore, it’s appealing for clinicians to screen these patients for occult cancer but it has led to a lot of great diversity in practices. Some clinicians prefer to use a limited screening strategy that would include a history, physical examination, routine blood tests, and a chest X-ray. Other clinicians prefer to use the limited screening strategy in combination with additional tests. That could be CT of the abdomen and pelvis, ultrasound, or tumor marker, or [computed axial tomography] scan. It’s hard for a physician to know what to use.”
For the SOME trial, a total of 854 patients with unprovoked VTE were randomized to two groups: 431 to limited occult cancer screening (basic blood work, chest X-ray, and breast/cervical/prostate cancer screening) and 423 to limited screening in combination with a comprehensive CT of the abdomen/pelvis. The comprehensive CT included a virtual colonoscopy and gastroscopy, a biphasic enhanced CT, a parenchymal pancreatogram, and a uniphasic enhanced CT of distended bladder. The primary outcome was confirmed cancer that was missed by the screening strategy and detected by the end of the 1-year follow-up period.
Dr. Carrier reported that 33 patients (3.9%) had a new diagnosis of cancer in the interval between randomization and 1-year follow-up: 14 in the limited-screening group and 19 in the limited-screening-plus-CT group, a difference that was not statistically significant (P = .28). In addition, the number of occult cancers missed by the end of the 1-year follow-up period was similar between the two groups: four in the limited-screening group and five in the limited-screening-plus-CT group.
He and his associates also found no significant differences between the limited-screening group and the limited-screening-plus-CT group in the rate of detection of early cancers (0.23% vs. 0.71%, respectively; P = .37), in overall mortality (1.4% vs. 1.2%; P > 0.99), or in cancer-related mortality (1.4% vs. 0.95%; P = .75).
“Occult cancers are not nearly as common as we thought they were, which is reassuring for clinicians and patients because then we don’t have to do a lot of investigations to try and find them, and often scare patients and expose them to radiation and additional procedures,” Dr. Carrier said in an interview. “Limited screening alone, which is what is recommended in Canada and in the United States for age- and gender-specific screening, is more than reasonable for these patients.”
The SOME trial was funded by the Heart and Stroke Foundation of Canada. Dr. Carrier had no relevant financial conflicts to disclose.
Therese Borden contributed to this article.
TORONTO – The prevalence of occult cancer is low in patients with a first unprovoked venous thromboembolism, according to results from a multicenter, randomized study presented at the International Society on Thrombosis and Haemostasis congress.
In addition, routine screening with the addition of a comprehensive CT scan of the abdomen and pelvis was no better than routine screening alone in detecting occult cancer in this population.
Those are key findings that Dr. Marc Carrier of the University of Ottawa presented from the Screening for Occult Malignancy in Patients with Idiopathic Venous Thromboembolism (SOME) trial, a multicenter, open-label, randomized controlled trial that compared the efficacy of conventional screening with or without comprehensive CT of the abdomen/pelvis for detecting occult cancers in patients with unprovoked venous thromboembolism (VTE). The results of this study were published the same day as his presentation in the New England Journal of Medicine.
“It has been described that up to 10% of patients with unprovoked VTE are diagnosed with cancer in the year following their VTE diagnosis,” Dr. Carrier said. “Therefore, it’s appealing for clinicians to screen these patients for occult cancer but it has led to a lot of great diversity in practices. Some clinicians prefer to use a limited screening strategy that would include a history, physical examination, routine blood tests, and a chest X-ray. Other clinicians prefer to use the limited screening strategy in combination with additional tests. That could be CT of the abdomen and pelvis, ultrasound, or tumor marker, or [computed axial tomography] scan. It’s hard for a physician to know what to use.”
For the SOME trial, a total of 854 patients with unprovoked VTE were randomized to two groups: 431 to limited occult cancer screening (basic blood work, chest X-ray, and breast/cervical/prostate cancer screening) and 423 to limited screening in combination with a comprehensive CT of the abdomen/pelvis. The comprehensive CT included a virtual colonoscopy and gastroscopy, a biphasic enhanced CT, a parenchymal pancreatogram, and a uniphasic enhanced CT of distended bladder. The primary outcome was confirmed cancer that was missed by the screening strategy and detected by the end of the 1-year follow-up period.
Dr. Carrier reported that 33 patients (3.9%) had a new diagnosis of cancer in the interval between randomization and 1-year follow-up: 14 in the limited-screening group and 19 in the limited-screening-plus-CT group, a difference that was not statistically significant (P = .28). In addition, the number of occult cancers missed by the end of the 1-year follow-up period was similar between the two groups: four in the limited-screening group and five in the limited-screening-plus-CT group.
He and his associates also found no significant differences between the limited-screening group and the limited-screening-plus-CT group in the rate of detection of early cancers (0.23% vs. 0.71%, respectively; P = .37), in overall mortality (1.4% vs. 1.2%; P > 0.99), or in cancer-related mortality (1.4% vs. 0.95%; P = .75).
“Occult cancers are not nearly as common as we thought they were, which is reassuring for clinicians and patients because then we don’t have to do a lot of investigations to try and find them, and often scare patients and expose them to radiation and additional procedures,” Dr. Carrier said in an interview. “Limited screening alone, which is what is recommended in Canada and in the United States for age- and gender-specific screening, is more than reasonable for these patients.”
The SOME trial was funded by the Heart and Stroke Foundation of Canada. Dr. Carrier had no relevant financial conflicts to disclose.
Therese Borden contributed to this article.
AT THE 2015 ISTH CONGRESS
Key clinical point: Occult cancers in patients with a first unprovoked VTE are not nearly as common as previously thought, and limited screening for such cancers is appropriate.
Major finding: There were no significant differences between the limited-screening group and the limited-screening-plus-CT group in the rate of detection of early cancers (0.23% vs. 0.71%); in overall mortality (1.4% vs. 1.2%), or in cancer-related mortality (1.4% vs. 0.95%).
Data source: A multicenter, open-label, randomized controlled trial of 854 patients with unprovoked VTE.
Disclosures: The trial was funded by the Heart and Stroke Foundation of Canada. Dr. Carrier reported having no financial disclosures.

Drug worth pursuing as T-ALL therapy, researchers say

Photo courtesy of
Children’s Cancer Institute
A drug that previously fell short of expectations holds promise for treating T-cell acute lymphoblastic leukemia (T-ALL), according to researchers.
The drug, PR-104, was originally designed to target hypoxic cells in solid tumors, but it showed less activity than expected in clinical trials, and its development was suspended.
Now, preclinical research has shown that PR-104 can be activated by AKR1C3, an enzyme that is overexpressed in T-ALL.
The researchers described this work in Blood.
“We were so encouraged by our first results with PR-104 that we undertook additional studies which showed the drug to be preferentially active against T-ALL . . . ,” said study author Richard B. Lock, PhD, of the Children’s Cancer Institute in Sydney, New South Wales, Australia.
“We believe that PR-104 might be an effective drug for patients who have initially benefited from conventional treatment for T-ALL but who have subsequently relapsed.”
Developing PR-104: A rocky road
PR-104 is a phosphate ester of the nitrogen mustard prodrug PR-104A. It was invented by William R. Wilson, PhD, of the University of Auckland (UoA) in New Zealand, and licensed to a UoA start-up company called Proacta Inc.
In a phase 1 study of patients with solid tumor malignancies, PR-104 failed to produce responses. The drug did elicit responses in a phase 1/2 trial of patients with advanced ALL or acute myeloid leukemia, but results fell short of expectations, and Proacta suspended development of PR-104.
Another drug Proacta was developing, PR-610, also failed to meet expectations. Because of these setbacks, the company closed its doors.
“As a fragile start-up, [Proacta] could not survive two serial ‘failures’ in phase 1/2,” Dr Wilson said. “Arguably . . . , the failure was more to do with the attempt to develop these compounds without biomarker support . . . than lack of potential of the compounds. Interestingly, PR-610 has subsequently been licensed by UoA to Threshold Pharmaceuticals, who are continuing its development (with biomarker support) as TH-4000.”
“We have a more challenging problem with PR-104 because the original patents have lapsed thanks to the decision of the UoA to not maintain the national phase filings after Proacta pulled the plug. [However,] as a result of [Dr Lock’s] work, it is now clear that PR-104 has exciting potential in leukemias with high activity of
AKR1C3.”
Results in T-ALL
Dr Lock and his colleagues tested PR-104 in a panel of 7 patient-derived pediatric ALL xenografts. Two weekly doses of PR-104 at 200 mg/kg significantly delayed progression in both T-ALL (n=4) and B-cell-precursor (BCP) ALL (n=3) xenografts.
The delay ranged from 10.3 days to 59.2 days and was significantly longer for the T-ALL xenografts (P=0.03).
PR-104 produced objective responses in all 4 T-ALL xenografts, including 2 complete responses. The drug also produced complete responses in 2 of the 3 BCP-ALL xenografts, but the third exhibited progressive disease.
Additional experiments showed that AKR1C3 expression was significantly higher in T-ALL than BCP-ALL, and AKR1C3 was “a major determinant” of sensitivity to PR-104, both in vitro and in vivo.
The researchers confirmed this by overexpressing AKR1C3 in a resistant BCP-ALL xenograft. Once AKR1C3 was overexpressed, the team observed “dramatic sensitization” to PR-104.
The path ahead
Now, Dr Lock and his colleagues are trying to determine why T-ALL cells express high levels of AKR1C3.
“If we can work out what activates this enzyme in T cells, we might find a way of activating it in B cells, making the B-cell disease sensitive to the drug as well,” Dr Lock said. “Obviously, it would be ideal if we could extend this drug’s reach to include all acute lymphoblastic leukemia patients.”
“In the meantime, we can envisage using PR-104 to target highly aggressive T-ALLs that express high levels of AKR1C3. We are in the process of working with our clinician colleagues in Australia and the US to organize a clinical trial of PR-104 in T-ALL.”
Dr Wilson noted that finding a path forward for PR-104 will be challenging due to the lack of patent support.
“[But] there are two reasons that make me think it is worth trying to do so,” he said. “One is the proximate concern that there are kids with high-AKR1C3 leukemias (adults too) who could benefit from this opportunity. The other is that this problem links to a looming paradigm shift in drug development. As we dissect cancer based on molecular analysis . . . , the commercial model will have to change.”
“There will still be ‘blockbuster’ drugs from time to time that address very high numbers of cancers . . . , but my expectation is that most cancer control in the future will depend on understanding the peculiarities of individual tumors and matching these with drugs that exploit these features. PR-104 is currently stuck in the past but could be a poster child for that future.” ![]()
Adopting may be more difficult for cancer survivors

by Vera Kratochvil
Cancer survivors may face more challenges when trying to adopt a child than individuals without a history of cancer, according to a new study.
Investigators found the sizable upfront costs associated with adoption and requirements regarding a prospective parent’s health could work against cancer survivors trying to adopt.
However, the study also suggested that birth mothers might be receptive to cancer survivors as adoptive parents.
The research was published in Cancer.
Little is known about the rate at which cancer survivors successfully adopt a child or about their experiences during the adoption process. So Gwendolyn Quinn, PhD, of the Moffitt Cancer Center in Tampa, Florida, and her colleagues conducted a study to gain some insight.
The investigators asked oncology nurses who were participating in a training program to conduct interviews with adoption agencies. Seventy-seven nurses across 15 states provided summaries of their interviews.
The nurses reported that adoption fees ranged from $3000 to $75,000. They noted that the upfront costs of adoption could deter cancer survivors who already have “a huge financial burden” due to treatment costs.
Not all of the adoption agencies contacted kept records on whether prospective adoptive parents were cancer survivors. But agencies that did track this reported an average of 10 former cancer patients a year seeking adoption.
A few agencies reported that a cancer history in an adoptive parent could be discouraging for a birth mother. But most reported the opposite—that birth mothers might feel confident in choosing a parent who has overcome hardships and has an appreciation for life.
Agencies usually required prospective parents to provide a letter from a physician regarding their health and medical history. In some cases, agencies required cancer survivors to be disease-free for 5 years before they could adopt a child.
In addition, international adoptions had greater restrictions for prospective parents with a cancer history (compared to US adoptions).
Dr Quinn said these are potentially discriminatory practices akin to restricting employment opportunities for people with disabilities.
“[P]erhaps this data will bring to light the need for policy revisions in adoption processes . . . ,” she added. ![]()
In PCI, switching clopidogrel nonresponders to prasugrel halved 2-year cardiac mortality
PARIS – Clopidogrel nonresponsiveness is a modifiable cardiovascular risk factor in patients undergoing percutaneous coronary intervention, according to the results of the third Responsiveness to Clopidogrel and Stent-Related Events (RECLOSE-3) study.
High residual platelet activity following a loading dose of clopidogrel in patients undergoing PCI was shown in the earlier RECLOSE-2 study to be a potent predictor of an increased 2-year cardiovascular event rate (JAMA 2011;306:1215-23). This left open the question of whether switching to a different antiplatelet drug would reduce that elevated 2-year risk.

The new RECLOSE-3 study shows that this clopidogrel nonresponsiveness is indeed a modifiable risk factor. All that’s necessary is to identify affected patients via a commercially available in vitro assay, switch them to prasugrel, and their long-term cardiac outcomes become markedly better than if they stayed on clopidogrel, Dr. David Antoniucci reported at the annual congress of the European Association of Percutaneous Cardiovascular Interventions.
The prospective RECLOSE-3 study included 302 consecutive patients undergoing PCI who were determined to be clopidogrel nonresponders based upon residual platelet activity of 70% or more as measured by light transmittance aggregometry. All were switched to prasugrel and underwent repeat platelet activity measurement. The control group consisted of 248 clopidogrel nonresponders who stayed on the antiplatelet agent in RECLOSE-2.
It was necessary to rely on historical controls for ethical reasons; based upon the RECLOSE-2 results, it’s no longer appropriate to randomize clopidogrel nonresponders to continued use of clopidogrel, according to Dr. Antoniucci, head of the division of cardiology at Careggi Hospital in Florence, Italy.
Mean residual platelet reactivity improved from 78% in RECLOSE-3 participants on clopidogrel to 47% on prasugrel. All but 6% of clopidogrel nonresponders demonstrated acceptable suppression of platelet activity on prasugrel.
The primary study endpoint was 2-year cardiac mortality. With a follow-up rate of 99%, the rate was 4% in clopidogrel nonresponders switched to prasugrel, significantly better than the 9.7% in controls. Moreover, the rate of definite stent thrombosis – a key secondary endpoint – was 0.7% in the group switched to prasugrel, fourfold lower than in controls. Probable stent thrombosis was diagnosed in 1.6% of controls and none of the prasugrel group.
All patients in the control group from RECLOSE-2 had been admitted with an acute coronary syndrome. Restricting the analysis to the 126 RECLOSE-3 participants switched to prasugrel who had an acute coronary syndrome upon hospitalization, the 2-year cardiac death rate was 3.2%, still significantly lower than the 9.7% in controls.
In a multivariate analysis that controlled for potential confounders – including the more frequent use of drug-eluting stents and lower prevalence of a left ventricular ejection fraction of 40% or less in the RECLOSE-3 patients – switching clopidogrel nonresponders to prasugrel was associated with a highly significant 50% reduction in the risk of cardiac death at 2 years’ follow-up. The only other significant predictors were a baseline serum creatinine greater than 1.5 mg/dL and advanced age, both of which were associated with increased risk.
The RECLOSE-3 study was sponsored by the Italian Department of Health. Dr. Antoniucci reported having no financial conflicts.
PARIS – Clopidogrel nonresponsiveness is a modifiable cardiovascular risk factor in patients undergoing percutaneous coronary intervention, according to the results of the third Responsiveness to Clopidogrel and Stent-Related Events (RECLOSE-3) study.
High residual platelet activity following a loading dose of clopidogrel in patients undergoing PCI was shown in the earlier RECLOSE-2 study to be a potent predictor of an increased 2-year cardiovascular event rate (JAMA 2011;306:1215-23). This left open the question of whether switching to a different antiplatelet drug would reduce that elevated 2-year risk.
The new RECLOSE-3 study shows that this clopidogrel nonresponsiveness is indeed a modifiable risk factor. All that’s necessary is to identify affected patients via a commercially available in vitro assay, switch them to prasugrel, and their long-term cardiac outcomes become markedly better than if they stayed on clopidogrel, Dr. David Antoniucci reported at the annual congress of the European Association of Percutaneous Cardiovascular Interventions.
The prospective RECLOSE-3 study included 302 consecutive patients undergoing PCI who were determined to be clopidogrel nonresponders based upon residual platelet activity of 70% or more as measured by light transmittance aggregometry. All were switched to prasugrel and underwent repeat platelet activity measurement. The control group consisted of 248 clopidogrel nonresponders who stayed on the antiplatelet agent in RECLOSE-2.
It was necessary to rely on historical controls for ethical reasons; based upon the RECLOSE-2 results, it’s no longer appropriate to randomize clopidogrel nonresponders to continued use of clopidogrel, according to Dr. Antoniucci, head of the division of cardiology at Careggi Hospital in Florence, Italy.
Mean residual platelet reactivity improved from 78% in RECLOSE-3 participants on clopidogrel to 47% on prasugrel. All but 6% of clopidogrel nonresponders demonstrated acceptable suppression of platelet activity on prasugrel.
The primary study endpoint was 2-year cardiac mortality. With a follow-up rate of 99%, the rate was 4% in clopidogrel nonresponders switched to prasugrel, significantly better than the 9.7% in controls. Moreover, the rate of definite stent thrombosis – a key secondary endpoint – was 0.7% in the group switched to prasugrel, fourfold lower than in controls. Probable stent thrombosis was diagnosed in 1.6% of controls and none of the prasugrel group.
All patients in the control group from RECLOSE-2 had been admitted with an acute coronary syndrome. Restricting the analysis to the 126 RECLOSE-3 participants switched to prasugrel who had an acute coronary syndrome upon hospitalization, the 2-year cardiac death rate was 3.2%, still significantly lower than the 9.7% in controls.
In a multivariate analysis that controlled for potential confounders – including the more frequent use of drug-eluting stents and lower prevalence of a left ventricular ejection fraction of 40% or less in the RECLOSE-3 patients – switching clopidogrel nonresponders to prasugrel was associated with a highly significant 50% reduction in the risk of cardiac death at 2 years’ follow-up. The only other significant predictors were a baseline serum creatinine greater than 1.5 mg/dL and advanced age, both of which were associated with increased risk.
The RECLOSE-3 study was sponsored by the Italian Department of Health. Dr. Antoniucci reported having no financial conflicts.
AT EuroPCR 2015
Key clinical point: Switch clopidogrel nonresponders undergoing PCI to prasugrel in order to cut their 2-year cardiac mortality risk in half.
Major finding: Patients undergoing PCI who switch to prasugrel because they show high residual platelet activity after a loading dose of clopidogrel have a 2-year cardiac mortality half that of clopidogrel nonresponders who remain on the drug.
Data source: RECLOSE-3, a prospective study of 302 patients undergoing PCI who were switched to prasugrel upon being identified as clopidogrel nonresponders and a historical control group of 248 clopidogrel nonresponders who remained on the antiplatelet agent.
Disclosures: RECLOSE-3 was funded by the Italian Department of Health. The presenter reported having no financial conflicts.

Gene regulates HSPC frequency, function
Photo by Aaron Logan
A genome-wide association study conducted in mice has provided new insights regarding hematopoietic stem/progenitor cells (HSPCs).
Researchers screened more than 100 mouse strains and found great variation in the frequency of 3 HSPC subpopulations.
The team also showed that Hopx, a gene that was not known to influence HSPC biology, regulates the frequency and function of HSPCs.
The researchers recounted these findings in Stem Cell Reports.
Hooman Allayee, PhD, of the University of Southern California in Los Angeles, and his colleagues screened 108 strains of mice known as the hybrid mouse diversity panel.
The screen revealed 3 HSPC subpopulations whose frequency varied greatly among the different mouse strains. The frequency of these HSPCs—Lin-Sca-1+c-Kit+ (LSK) cells, LSKCD150-CD48- cells, and LSKCD150+CD48- cells—varied roughly 120-fold to 300-fold.
The researchers then found that these 3 cell populations were significantly correlated with each other and with certain hematologic parameters. There was a significant positive association between LSK cells and total white blood cell (P=0.005), monocyte (P<0.0001), and lymphocyte counts (P=0.04).
LSKCD150-CD48- cells had a significant negative correlation with lymphocyte (P=0.006) and monocyte counts (P=0.002) as well as a significant positive association with granulocyte counts (P=0.0002).
LSKCD150+CD48- cells had a significant positive correlation with total white blood cell count (P=0.02) and a significant negative association with mean corpuscular hemoglobin (P<0.001).
Additional experiments showed that the frequency and function of LSKCD150-CD48- cells were regulated by Hopx, but the gene did not appear to impact LSK or LSKCD150+CD48- cells.
Mice lacking the Hopx gene had significantly lower numbers of LSKCD150-CD48- cells than wild-type mice, but LSK and LSKCD150+CD48- counts were similar between Hopx-/- and wild-type mice.
The researchers also conducted competitive repopulation assays with HSCs from Hopx-/- and wild-type mice. HSCs from Hopx-/- mice had significantly impaired engraftment at 16 weeks after transplant, which extended to 24 weeks.
Dr Allayee and his colleagues said that identifying this new role for Hopx could have clinical implications, and this research suggests the hybrid mouse diversity panel can be used to find genes that would otherwise go unnoticed.
“This powerful genetics platform has the potential to reveal the genes underlying other stem cell populations or a wide range of diseases that would be difficult to study in humans,” Dr Allayee said. ![]()
Vilazodone significantly improved generalized anxiety disorder symptoms
MIAMI BEACH – Patients with generalized anxiety disorder (GAD) saw significant improvement in their work, family, and social lives when taking vilazodone, compared with placebo.
However, vilazodone was associated with more side effects, and men taking vilazodone experienced more sexual side effects than those on placebo, according to Dr. David Sheehan, distinguished university health professor emeritus at the University of South Florida, Tampa.
Dr. Sheehan and his collaborators from Forest Laboratories presented their findings during a poster session at a meeting of the American Society for Clinical Psychopharmacology, formerly known as the New Clinical Drug Evaluation Unit meeting.
Vilazodone is a selective serotonin reuptake inhibitor (SSRI) and a partial 5-HT1a receptor agonist. Already approved for the treatment of major depressive disorder (MDD), vilazodone showed anxiolytic properties in post hoc analyses of the MDD clinical trial data.
The randomized, double-blind, placebo-controlled trial enrolled 404 otherwise healthy men and women who met DSM-IV criteria for GAD, exhibiting physical and psychiatric symptoms as well as functional impairment from the persistent and pervasive worry that characterize GAD. Individuals with clinically significant depression or any suicide risk, previous lack of response to adequate trials of other SSRIs, and those with serious medical conditions were excluded from the study.
Enrollees underwent a 1-week screening period, followed by 8 weeks of treatment, ending with a 1-week, double-blinded period of tapering off the study drug or placebo. Patients with insufficient improvement were allowed to increase vilazodone dosing from 20 mg to 40 mg at the end of the second or fourth study week, with no increases permitted after week four of the study.
Overall, total scores on the Hamilton Rating Scale for Anxiety (HAM-A) improved significantly more for those taking vilazodone than for those on placebo (total HAM-A score difference -2.2, P = 0.005). The psychic, somatic, and anxiety subscales also showed significant improvement, compared with placebo, as did the anxious and tension items.
The results indicate “greater improvement in anxiety symptoms associated with GAD,” said Dr. Sheehan and collaborators.
Scores on the Sheehan Disability Scale, used to assess social, family, and work/school functioning, improved significantly more for those on vilazodone than placebo, both for total score and for all domain subscores (total SDS score difference -1.89, P = 0.02).
Scores on two clinician rating tools, the Clinical Global Impression–Global Improvement (CGI-I) and the Clinical Global Impression–Severity (CGI-S) also improved significantly by least squares mean when vilazodone was compared with placebo (P = 0.003 and P = 0.0003, respectively).
Men taking vilazodone were more likely than those taking placebo to report sexual function-related adverse events, though overall numbers were low, and they also saw a small mean decrease on a sexual functioning questionnaire. These differences were not seen for women taking vilazodone, who reported a small improvement in sexual function, as did both men and women taking placebo.
There were no deaths and no serious abnormalities in laboratory values or ECGs in either group. Of the 404 evenly divided patients included in the safety analysis, significantly more patients discontinued vilazodone (58 patients, 28.7%) than discontinued placebo (39 patients, 19.3%, P < 0.05). Further, 22 patients (10.9%) stopped taking vilazodone because of adverse events, compared with 4 patients (2.0%) taking placebo (P < 0.05).
The most common treatment-emergent adverse event for the vilazodone group was nausea, occurring in 60 patients (29.7%), compared with 26 (12.9%) of the placebo group.
Forest Laboratories, an affiliate of Actavis, funded the study. Dr. Sheehan reported multiple financial affiliations with pharmaceutical companies, including Actavis and Forest Laboratories. All other authors are employees of Forest Research Institute.
On Twitter @karioakes
AT THE ASCP Meeting
Key clinical point: Many symptoms of generalized anxiety disorder improved significantly for patients taking vilazodone, compared with placebo.
Major finding: Individuals with generalized anxiety disorder experienced a significant reduction in their symptoms and improvement in function when taking vilazodone, compared with placebo, though they experienced a higher rate of side effects.
Data source: Randomized, double-blind, placebo-controlled trial of 404 patients taking vilazodone or placebo.
Disclosures: Forest Laboratories, an affiliate of Actavis, funded the study. Dr. Sheehan reported multiple financial affiliations with pharmaceutical companies, including Actavis and Forest Laboratories. All other authors are employees of Forest Research Institute.