User login
Rosai-Dorfman Disease
Rosai-Dorfman disease (RDD), also known as sinus histiocytosis with massive lymphadenopathy, is a rare benign histioproliferative disorder of unknown etiology.1 Clinically, it is most frequently characterized by massive painless cervical lymphadenopathy with other systemic manifestations, including fever, night sweats, and weight loss. Accompanying laboratory findings include leukocytosis with neutrophilia, elevated erythrocyte sedimentation rate, and polyclonal hypergammaglobulinemia. Extranodal involvement has been noted in more than 40% of cases, and cutaneous lesions represent the most common form of extranodal disease.2 Cutaneous RDD is a distinct and rare entity limited to the skin without lymphadenopathy or other extracutaneous involvement.3 Patients with cutaneous RDD typically present with papules and plaques that can grow to form nodules with satellite lesions that resolve into fibrotic plaques before spontaneous regression.4
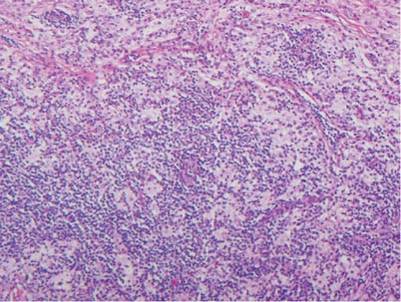
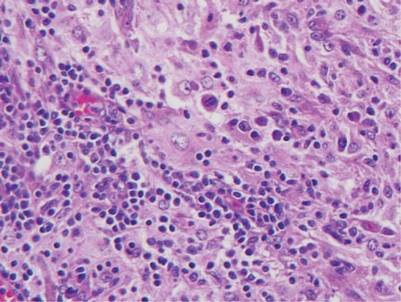
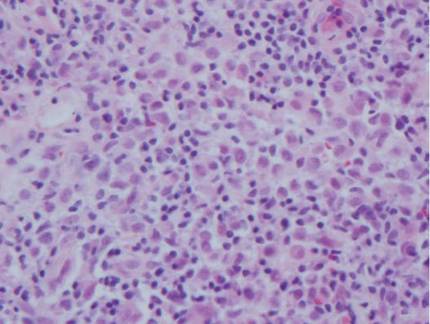
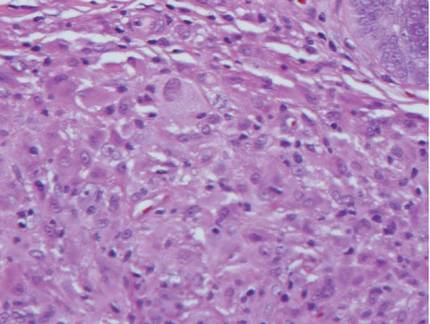
Histologic examination of cutaneous lesions of RDD reveals a dense nodular dermal and often subcutaneous infiltrate of characteristic large polygonal histiocytes termed Rosai-Dorfman cells, which feature abundant pale to eosinophilic cytoplasm, indistinct borders, and large vesicular nuclei with prominent nucleoli (Figure 1).4,5 Some multinucleate forms may be seen. These Rosai-Dorfman cells display positive staining for CD68 and S-100, and negative staining for CD1a on immunohistochemistry. Lymphocytes and plasma cells often are admixed with the Rosai-Dorfman cells, and neutrophils and eosinophils also may be present in the infiltrate.4 The histologic hallmark of RDD is emperipolesis, a phenomenon whereby inflammatory cells such as lymphocytes and plasma cells reside intact within the cytoplasm of histiocytes (Figure 2).5
| 
|
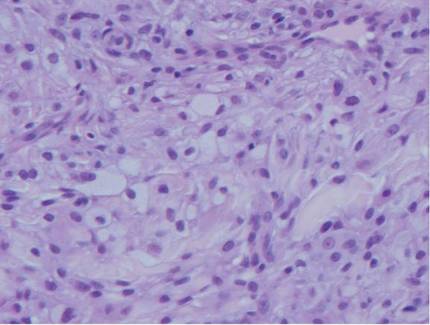
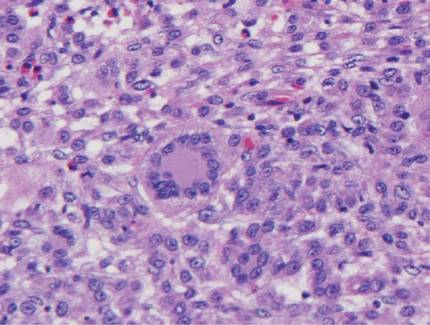
The histologic differential diagnosis of cutaneous lesions of RDD includes other histiocytic and xanthomatous diseases, including eruptive xanthoma, juvenile xanthogranuloma, Langerhans cell histiocytosis, and solitary reticulohistiocytoma, which should not display emperipolesis. Eruptive xanthomas display collections of foamy histiocytes in the dermis and typically contain extracellular lipid. They may contain infiltrates of lymphocytes (Figure 3). Juvenile xanthogranuloma also features a dense infiltrate of histiocytes in the papillary and reticular dermis but distinctly shows Touton giant cells and lipidization of histiocytes (Figure 4). Both eruptive xanthomas and juvenile xanthogranulomas typically stain negatively for S-100. Langerhans cell histiocytosis is histologically characterized by a dermal infiltrate of Langerhans cells that have their own distinctive morphologic features. They are uniformly ovoid with abundant eosinophilic cytoplasm. Their nuclei are smaller than those of Rosai-Dorfman cells and have a kidney bean shape with inconspicuous nucleoli (Figure 5). Epidermotropism of these cells can be observed. Immunohistochemically, Langerhans cell histiocytosis typically is S-100 positive, CD1a positive, and langerin positive. Reticulohistiocytoma features histiocytes that have a characteristic dusty rose or ground glass cytoplasm with two-toned darker and lighter areas (Figure 6). Reticulohistiocytoma cells stain positively for CD68 but typically stain negatively for both CD1a and S-100.
| 
| ||
| 
|
1. Rosai J, Dorfman RF. Sinus histiocytosis with massive lymphadenopathy. a newly recognized benign clinicopathological entity. Arch Pathol. 1969;87:63-70.
2. Foucar E, Rosai J, Dorfman RF. Sinus histiocytosis with massive lymphadenopathy (Rosai-Dorfman disease): a review of the entity. Semin Diagn Pathol. 1990;7:19-73.
3. Brenn T, Calonje E, Granter SR, et al. Cutaneous Rosai-Dorfman disease is a distinct clinical entity. Am J Dermatopathol. 2002;24:385-391.
4. Wang KH, Chen WY, Lie HN, et al. Cutaneous Rosai-Dorfman disease: clinicopathological profiles, spectrum and evolution of 21 lesions in six patients. Br J Dermatol. 2006;154:277-286.
5. Chu P, LeBoit PE. Histologic features of cutaneous sinus histiocytosis (Rosai-Dorfman disease): study of cases both with and without systemic involvement. J Cutan Pathol. 1992;19:201-206.
Rosai-Dorfman disease (RDD), also known as sinus histiocytosis with massive lymphadenopathy, is a rare benign histioproliferative disorder of unknown etiology.1 Clinically, it is most frequently characterized by massive painless cervical lymphadenopathy with other systemic manifestations, including fever, night sweats, and weight loss. Accompanying laboratory findings include leukocytosis with neutrophilia, elevated erythrocyte sedimentation rate, and polyclonal hypergammaglobulinemia. Extranodal involvement has been noted in more than 40% of cases, and cutaneous lesions represent the most common form of extranodal disease.2 Cutaneous RDD is a distinct and rare entity limited to the skin without lymphadenopathy or other extracutaneous involvement.3 Patients with cutaneous RDD typically present with papules and plaques that can grow to form nodules with satellite lesions that resolve into fibrotic plaques before spontaneous regression.4
Histologic examination of cutaneous lesions of RDD reveals a dense nodular dermal and often subcutaneous infiltrate of characteristic large polygonal histiocytes termed Rosai-Dorfman cells, which feature abundant pale to eosinophilic cytoplasm, indistinct borders, and large vesicular nuclei with prominent nucleoli (Figure 1).4,5 Some multinucleate forms may be seen. These Rosai-Dorfman cells display positive staining for CD68 and S-100, and negative staining for CD1a on immunohistochemistry. Lymphocytes and plasma cells often are admixed with the Rosai-Dorfman cells, and neutrophils and eosinophils also may be present in the infiltrate.4 The histologic hallmark of RDD is emperipolesis, a phenomenon whereby inflammatory cells such as lymphocytes and plasma cells reside intact within the cytoplasm of histiocytes (Figure 2).5
|
|
|
The histologic differential diagnosis of cutaneous lesions of RDD includes other histiocytic and xanthomatous diseases, including eruptive xanthoma, juvenile xanthogranuloma, Langerhans cell histiocytosis, and solitary reticulohistiocytoma, which should not display emperipolesis. Eruptive xanthomas display collections of foamy histiocytes in the dermis and typically contain extracellular lipid. They may contain infiltrates of lymphocytes (Figure 3). Juvenile xanthogranuloma also features a dense infiltrate of histiocytes in the papillary and reticular dermis but distinctly shows Touton giant cells and lipidization of histiocytes (Figure 4). Both eruptive xanthomas and juvenile xanthogranulomas typically stain negatively for S-100. Langerhans cell histiocytosis is histologically characterized by a dermal infiltrate of Langerhans cells that have their own distinctive morphologic features. They are uniformly ovoid with abundant eosinophilic cytoplasm. Their nuclei are smaller than those of Rosai-Dorfman cells and have a kidney bean shape with inconspicuous nucleoli (Figure 5). Epidermotropism of these cells can be observed. Immunohistochemically, Langerhans cell histiocytosis typically is S-100 positive, CD1a positive, and langerin positive. Reticulohistiocytoma features histiocytes that have a characteristic dusty rose or ground glass cytoplasm with two-toned darker and lighter areas (Figure 6). Reticulohistiocytoma cells stain positively for CD68 but typically stain negatively for both CD1a and S-100.
|
|
| ||
|
|
|
1. Rosai J, Dorfman RF. Sinus histiocytosis with massive lymphadenopathy. a newly recognized benign clinicopathological entity. Arch Pathol. 1969;87:63-70.
2. Foucar E, Rosai J, Dorfman RF. Sinus histiocytosis with massive lymphadenopathy (Rosai-Dorfman disease): a review of the entity. Semin Diagn Pathol. 1990;7:19-73.
3. Brenn T, Calonje E, Granter SR, et al. Cutaneous Rosai-Dorfman disease is a distinct clinical entity. Am J Dermatopathol. 2002;24:385-391.
4. Wang KH, Chen WY, Lie HN, et al. Cutaneous Rosai-Dorfman disease: clinicopathological profiles, spectrum and evolution of 21 lesions in six patients. Br J Dermatol. 2006;154:277-286.
5. Chu P, LeBoit PE. Histologic features of cutaneous sinus histiocytosis (Rosai-Dorfman disease): study of cases both with and without systemic involvement. J Cutan Pathol. 1992;19:201-206.
Sticks and stones: Navigating patient satisfaction scores
There is an old saying, “Sticks and stones may break my bones, but words will never hurt me.” When it comes to our patients’ impressions of us, nothing could be farther from the truth. As a matter of fact, their words, expressed in post-discharge patient satisfaction surveys, can play a tremendous role in the financial stability of our hospitals.
Throughout the years, hospitals have employed a wide variety of methods to evaluate their patients’ experiences, if only to improve their service and strengthen their brand. The Hospital Consumer Assessment of Healthcare Providers and Systems (HCAHPS) initiative has taken patient satisfaction to a new level by creating the first national, standardized survey tool to measure patients’ perspectives of the care they received while hospitalized. In addition, HCAHPS was designed to provide objective, meaningful comparisons of hospitals, and these comparisons are publicly reported, which increases transparency of the quality of care provided to hospitalized patients.
The survey is administered between 48 hours and 6 weeks post discharge to a random sample of adult patients by mail, telephone, mail and telephone, or Interactive Voice Response (IVR). Discharged patients are asked 27 questions about their recent hospitalization including communication with doctors and nurses, pain management, discharge information, communication about medication, overall hospital rating, and whether they would recommend the hospital to others.
Four times per year, the Centers for Medicaid & Medicare Services publishes HCAHPS scores of participating hospitals on the Hospital Compare website (www.hospitalcompare.hhs.gov), though the survey is not restricted to Medicare patients. Patients can pick and choose which hospitals they like, and which ones they would avoid like the plague.
Of course, it’s not realistic to think that we are going to please all of our patients all of the time, but this initiative does have the potential to create a new sense of accountability, as well as competitiveness for hospital systems and providers alike. No one wants to be at the bottom of the pack.
So, how do we increase our scores? Many models and companies claim to help improve patient satisfaction. Just do an Internet search. Keep in mind, what works well for one group may be ineffective for another.
For instance, 5-minute per patient multidisciplinary bedside rounding – including the provider, nurse, pharmacist, and case manager – may be easy to implement and skyrocket patient satisfaction in some institutions. In others, getting appropriate staffing may be prohibitive. Regardless of the approach that may be right for your group, it is important to keep in mind that the tide of health care is ever changing. Patients are demanding, and receiving, a bigger role in their health care. We all want to be in the forefront, not at the tail end, of that tide.
Dr. Hester is a hospitalist at Baltimore-Washington Medical Center in Glen Burnie, Md. She is the creator of the Patient Whiz, a patient-engagement app for iOS. Reach her at [email protected].

What Is Your Diagnosis? Eosinophilic Fasciitis
|
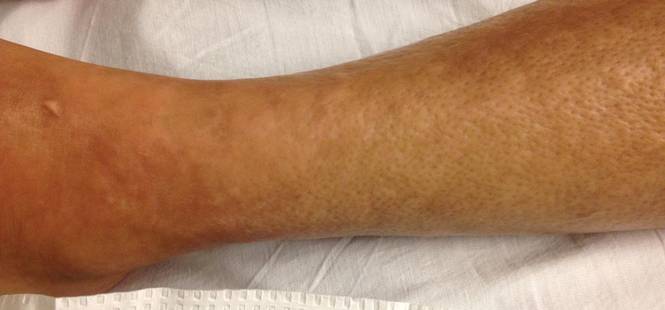
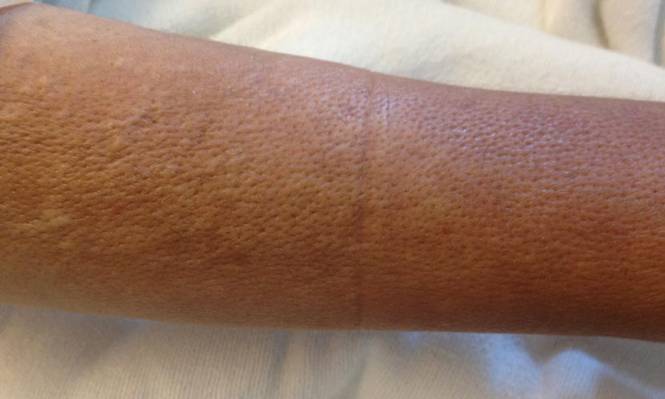
A 43-year-old woman presented with pain and paresthesia of the bilateral legs of 3 months’ duration with skin tightness and discoloration, which she attributed to a car accident that occurred 7 months prior. She also reported abdominal pain, shortness of breath, fever, double vision, dysphagia, voice changes, temperature sensitivity, and hair loss. The patient underwent outpatient steroid injections with limited symptomatic relief. She denied any antecedent exposure to vinyl chloride, rapeseed oil, or L-tryptophan. Physical examination revealed thickened skin on the bilateral legs (top), reddish discoloration of the feet, decreased sensation to light touch, and edema of the ankles and wrists, as well as a peau d’orange appearance of the skin on the arms (bottom), legs, and abdomen.
The Diagnosis: Eosinophilic Fasciitis
Eosinophilic fasciitis is a rare autoimmune disease of uncertain etiology first described by Shulman1 in 1974. It is similar in presentation and is perhaps related to scleroderma. Classic differentiating features include a peculiar peau d’orange appearance, peripheral eosinophilia, and lack of Raynaud phenomenon, thus it is regarded as a unique disease.2 Despite the name of the disease, eosinophilia has been known to be absent in later stages of eosinophilic fasciitis.1

On physical examination, “prayer and groove signs” can sometimes be evident.3 Although it was not initially observed in our case, a groove sign was noted on the left forearm on a second inspection (Figure 1). In contrast with systemic sclerosis, visceral involvement rarely is seen with eosinophilic fasciitis. There are, however, 3 major exceptions to this rule. First, there can be widespread nerve deficits, esophageal dysmotility, and nonspecific electromyography findings (ie, denervation, reinnervation, fasciculations).4 There also can be a concomitant hematologic disorder or Hashimoto thyroiditis.5 Because eosinophilic fasciitis has been associated with monoclonal gammopathy, which our patient also demonstrated, it is important to conduct a workup with serum or urine protein electrophoresis. If the test is negative, it should be followed up with an immunofixation assay or serum light chain assays.
Some proposed risk factors for eosinophilic fasciitis include trauma, extensive exercise, and Borrelia burgdorferi infection, but many cases have none of these associations.8 Although not firmly proven in the literature, there have been reports of eosinophilic fasciitis after isolated trauma.5 A causal link could not be established between our patient’s car accident and eosinophilic fasciitis, but the coincidence was notable.
The treatment of eosinophilic fasciitis is similar to scleroderma. Corticosteroids are effective in most cases and recovery often occurs with monotherapy.5 Case series have demonstrated efficacy in adding methotrexate, azathioprine, colchicine, and hydroxychloroquine in refractory patients.2,9 Our patient demonstrated a good response with a combination of prednisone and methotrexate. Relapses have been known to occur.2
A punch biopsy obtained from the right arm showed thickened acellular collagen bundles throughout the dermis and extending into the underlying subcutis. There also was obliteration of adnexal structures, loss of perieccrine fat, and sparse perivascular and interstitial lymphoplasmacytic infiltrate (Figure 2), consistent with a sclerosing disorder such as scleroderma or eosinophilic fasciitis.

A complete blood cell count revealed eosinophil levels of 12.5% (reference range, 2.7%). Rheumatologic workup was negative for antinuclear antibody, double-stranded DNA, thyroid-stimulating hormone, anticentromere antibodies, and Scl-70 autoantibodies. Computed tomography of the chest and pelvis revealed a thickened patulous esophagus. Endoscopy showed dysmotility of the lower esophagus. At this point the differential diagnosis included scleredema versus eosinophilic fasciitis, and the patient was started on oral prednisone 60 mg daily. She showed rapid improvement in sclerosis, joint mobility, and ability to swallow. Magnetic resonance imaging was then performed and revealed thickening and contrast enhancement of the forearm fascia, particularly along the distal aspect, confirming a diagnosis of eosinophilic fasciitis. Further workup including immunofixation assay and serum light chain assays were performed, revealing IgG λ hypergammaglobulinemia. She was then additionally treated with oral methotrexate 15 mg weekly. Due to the rapid improvement of symptoms on oral prednisone over 2 weeks, the peripheral eosinophilia, the magnetic resonance imaging findings, and the results of skin biopsy, a diagnosis of eosinophilic fasciitis was heavily favored over scleroderma and scleredema.
1. Shulman L. Diffuse fasciitis with hypergammaglobulinemia and eosinophilia in a new syndrome. J. Rheumatol. 1974;1(suppl):46.
2. Lakhanpal S, Ginsburg WW, Michet CJ, et al. Eosinophilic fasciitis: clinical spectrum and therapeutic response in 52 cases. Semin Arthritis Rheum. 1988;17:221-231.
3. Servy A, Clerici T, Malines C, et al. Eosinophilic fasciitis: a rare skin sclerosis. Pathol Res Int. 2010;2011:716935.
4. Satsangi J, Donaghy M. Multifocal peripheral neuropathy in eosinophilic fasciitis. J Neurol. 1992;239:91-92.
5. Antic M, Lautenschlager S, Itin PH. Eosinophilic fasciitis 30 years after—what do we really know? Dermatology. 2006;213:93-101.
6. Doyle JA, Ginsburg WW. Eosinophilic fasciitis. Med Clin North Am. 1989;73:1157-1166.
7. Naschitz JE, Yeshurun D, Miselevich I, et al. Colitis and pericarditis in a patient with eosinophilic fasciitis—a contribution to the multisystem nature of eosinophilic fasciitis. J Rheumatol. 1989;16:688-692.
8. Haustein UF. Scleroderma and pseudoscleroderma: uncommon presentations. Clin Dermatol. 2005;23:480-490.
9. Lebeaux D, Francès C, Barete S, et al. Eosinophilic fasciitis (Shulman disease): new insights into the therapeutic management from a series of 34 patients. Rheumatology. 2012;51:557-561.
|
A 43-year-old woman presented with pain and paresthesia of the bilateral legs of 3 months’ duration with skin tightness and discoloration, which she attributed to a car accident that occurred 7 months prior. She also reported abdominal pain, shortness of breath, fever, double vision, dysphagia, voice changes, temperature sensitivity, and hair loss. The patient underwent outpatient steroid injections with limited symptomatic relief. She denied any antecedent exposure to vinyl chloride, rapeseed oil, or L-tryptophan. Physical examination revealed thickened skin on the bilateral legs (top), reddish discoloration of the feet, decreased sensation to light touch, and edema of the ankles and wrists, as well as a peau d’orange appearance of the skin on the arms (bottom), legs, and abdomen.
The Diagnosis: Eosinophilic Fasciitis
Eosinophilic fasciitis is a rare autoimmune disease of uncertain etiology first described by Shulman1 in 1974. It is similar in presentation and is perhaps related to scleroderma. Classic differentiating features include a peculiar peau d’orange appearance, peripheral eosinophilia, and lack of Raynaud phenomenon, thus it is regarded as a unique disease.2 Despite the name of the disease, eosinophilia has been known to be absent in later stages of eosinophilic fasciitis.1
On physical examination, “prayer and groove signs” can sometimes be evident.3 Although it was not initially observed in our case, a groove sign was noted on the left forearm on a second inspection (Figure 1). In contrast with systemic sclerosis, visceral involvement rarely is seen with eosinophilic fasciitis. There are, however, 3 major exceptions to this rule. First, there can be widespread nerve deficits, esophageal dysmotility, and nonspecific electromyography findings (ie, denervation, reinnervation, fasciculations).4 There also can be a concomitant hematologic disorder or Hashimoto thyroiditis.5 Because eosinophilic fasciitis has been associated with monoclonal gammopathy, which our patient also demonstrated, it is important to conduct a workup with serum or urine protein electrophoresis. If the test is negative, it should be followed up with an immunofixation assay or serum light chain assays.
Some proposed risk factors for eosinophilic fasciitis include trauma, extensive exercise, and Borrelia burgdorferi infection, but many cases have none of these associations.8 Although not firmly proven in the literature, there have been reports of eosinophilic fasciitis after isolated trauma.5 A causal link could not be established between our patient’s car accident and eosinophilic fasciitis, but the coincidence was notable.
The treatment of eosinophilic fasciitis is similar to scleroderma. Corticosteroids are effective in most cases and recovery often occurs with monotherapy.5 Case series have demonstrated efficacy in adding methotrexate, azathioprine, colchicine, and hydroxychloroquine in refractory patients.2,9 Our patient demonstrated a good response with a combination of prednisone and methotrexate. Relapses have been known to occur.2
A punch biopsy obtained from the right arm showed thickened acellular collagen bundles throughout the dermis and extending into the underlying subcutis. There also was obliteration of adnexal structures, loss of perieccrine fat, and sparse perivascular and interstitial lymphoplasmacytic infiltrate (Figure 2), consistent with a sclerosing disorder such as scleroderma or eosinophilic fasciitis.
A complete blood cell count revealed eosinophil levels of 12.5% (reference range, 2.7%). Rheumatologic workup was negative for antinuclear antibody, double-stranded DNA, thyroid-stimulating hormone, anticentromere antibodies, and Scl-70 autoantibodies. Computed tomography of the chest and pelvis revealed a thickened patulous esophagus. Endoscopy showed dysmotility of the lower esophagus. At this point the differential diagnosis included scleredema versus eosinophilic fasciitis, and the patient was started on oral prednisone 60 mg daily. She showed rapid improvement in sclerosis, joint mobility, and ability to swallow. Magnetic resonance imaging was then performed and revealed thickening and contrast enhancement of the forearm fascia, particularly along the distal aspect, confirming a diagnosis of eosinophilic fasciitis. Further workup including immunofixation assay and serum light chain assays were performed, revealing IgG λ hypergammaglobulinemia. She was then additionally treated with oral methotrexate 15 mg weekly. Due to the rapid improvement of symptoms on oral prednisone over 2 weeks, the peripheral eosinophilia, the magnetic resonance imaging findings, and the results of skin biopsy, a diagnosis of eosinophilic fasciitis was heavily favored over scleroderma and scleredema.
1. Shulman L. Diffuse fasciitis with hypergammaglobulinemia and eosinophilia in a new syndrome. J. Rheumatol. 1974;1(suppl):46.
2. Lakhanpal S, Ginsburg WW, Michet CJ, et al. Eosinophilic fasciitis: clinical spectrum and therapeutic response in 52 cases. Semin Arthritis Rheum. 1988;17:221-231.
3. Servy A, Clerici T, Malines C, et al. Eosinophilic fasciitis: a rare skin sclerosis. Pathol Res Int. 2010;2011:716935.
4. Satsangi J, Donaghy M. Multifocal peripheral neuropathy in eosinophilic fasciitis. J Neurol. 1992;239:91-92.
5. Antic M, Lautenschlager S, Itin PH. Eosinophilic fasciitis 30 years after—what do we really know? Dermatology. 2006;213:93-101.
6. Doyle JA, Ginsburg WW. Eosinophilic fasciitis. Med Clin North Am. 1989;73:1157-1166.
7. Naschitz JE, Yeshurun D, Miselevich I, et al. Colitis and pericarditis in a patient with eosinophilic fasciitis—a contribution to the multisystem nature of eosinophilic fasciitis. J Rheumatol. 1989;16:688-692.
8. Haustein UF. Scleroderma and pseudoscleroderma: uncommon presentations. Clin Dermatol. 2005;23:480-490.
9. Lebeaux D, Francès C, Barete S, et al. Eosinophilic fasciitis (Shulman disease): new insights into the therapeutic management from a series of 34 patients. Rheumatology. 2012;51:557-561.

Avoid Trimethoprim-Sulfamethoxazole for Severe MRSA Infections
Clinical question: Is trimethoprim-sulfamethoxazole equivalent to vancomycin for the treatment of severe infections caused by methicillin-resistant Staphyloccus aureus?
Bottom line: Trimethoprim-sulfamethoxazole (TMP-SMX) did not achieve noninferiority as compared with vancomycin for the treatment of severe methicillin-resistant Staphyloccus aureus (MRSA) infections in hospitalized patients, and it may lead to increased mortality in the subset of patients with bacteremia. (LOE = 1b)
Reference: Paul M, Bishara J, Yahav D, et al. Trimethoprim-sulfamethoxazole versus vancomycin for severe infections caused by meticillin-resistant Staphylococcus aureus. BMJ 2015;350:h2219.
Study design: Randomized controlled trial (nonblinded)
Funding source: Foundation
Allocation: Concealed
Setting: Inpatient (any location)
Synopsis
Although TMP-SMX can be used to treat uncomplicated skin and soft-tissue infections caused by MRSA, it is not currently recommended for more serious MRSA infections such as bacteremia or pneumonia. In this study, investigators tested whether TMP-SMX is noninferior to vancomycin for the treatment of hospitalized patients with severe MRSA infections. Patients included in the study (N = 252) had microbiologically documented MRSA infections, including complicated skin and soft-tissue infections, bone or joint infections, pneumonia, or primary bacteremia. Patients with MRSA isolates resistant to TMP-SMX or vancomycin were excluded.
Using concealed allocation, the investigators randomized the patients to receive either high-dose TMP-SMX (320 mg trimethoprim/1600 mg sulfamethoxazole intravenously twice daily) or vancomycin (1 mg intravenously twice daily) for at least 7 days. In the TMP-SMX group, treatment could be transitioned to an oral regimen of an equivalent dose at the clinician's discretion. The 2 groups had similar baseline characteristics with a mean age of 66 years and similar comorbidities, though the vancomycin group had a higher percentage of patients with bacteremia than the TMP-SMX group (30% vs 43%; P = .042). The primary outcome was treatment failure at 7 days, defined as a composite of death, persistent fever or hypotension, stable or worsening Sequential Organ Failure Assessment score, or persistent bacteremia. There was no statistically significant difference detected between the 2 groups for this outcome (38% treatment failure with TMP-SMX vs 27% with vancomycin; absolute difference 10.4%, 95% CI -1.2% to 21.5%).
However, since the 95% confidence interval for the absolute difference fell outside the predefined lower limit of noninferiority of 15%, the authors concluded that TMP-SMX failed to achieve noninferiority as compared with vancomycin. Additionally, in the subgroup of patients with bacteremia, patients were more likely to die in the TMP-SMX group as compared with the vancomycin group, although this difference again was not statistically significant (34% with TMP-SMX vs 18% with vancomycin; relative risk 1.90, 0.92-3.93).
Dr. Kulkarni is an assistant professor of hospital medicine at Northwestern University in Chicago.
Treating Acne During Pregnancy and Lactation
Acne during pregnancy and lactation is common and poses a considerable treatment challenge for dermatologists. It is a disease that often is trivialized, viewed by the ill informed as cosmetic in nature. Combined with fetal and neonatal health concerns plus a healthy dose of medicolegal overlay, treatment of acne in this patient population may be complicated.
Pregnant and lactating women have been summarily orphaned from advances in drug therapy. Due to, in no small part, the pervasive litigious atmosphere surrounding birth defects in pregnancy, many health care providers have defaulted to avoiding all medications in this patient population to be “on the safe side,” and many have convinced pregnant women that taking medication to relieve pain and discomfort while pregnant is selfish and vain, especially where acne is concerned. However, erring on the safe side is not always safe. Drug avoidance can lead to increased physical and psychiatric morbidity.
Numerous studies have shown that acne is not trivial or inconsequential and may even be associated with suicidal ideations.1,2 In one study, female gender and acne were both jointly and independently associated with the risk for major depression and suicide.3 The traditional notion that pregnancy is a time of joy and emotional well-being is not supported by data. There is a marked increase of mood instability during pregnancy. According to the American Psychological Association, the incidence of true clinical postpartum depression in the United States is 1 in 7 pregnancies but is likely much higher, as it often remains undiagnosed.4 These women may consider suicide and may even harm their children. Therefore, “first, do no harm” might indeed involve aggressive therapy in this patient population; at the very least, it warrants a thorough consideration of the risks and benefits rather than a knee-jerk “wait until you stop breastfeeding” default. Without adequate knowledge of true drug risks and with the stakes so high, we find ourselves in medicolegal quicksand. As clinicians, we understand the concept of weighing risks and benefits, but the balance of the scale cannot be determined when no evidence exists regarding the relative weight of the risk side.
Most drug risks in pregnancy are noted after market approval and are obtained from published case reports and retrospective birth defect registries. Reported problems likely represent a small fraction of actual cases. The absence of direct information regarding drug use during pregnancy is exacerbated by the knowledge that there are large gender differences in drug pharmacokinetics. This dichotomy would be expected to be especially pronounced between men and pregnant women in whom drug absorption, distribution, and elimination are all notably altered. A poorly publicized aberration in the drug approval process is that gender information is not required from generic medication bioequivalence studies. Although studies for drugs indicated for both sexes need to include male and female participants, resulting data showing gender differences are not required to be disclosed, which means that it is theoretically possible for a generic drug to be approved based on results in men only.
The pregnancy categories for drugs (A, B, C, D, and X), which were initially defined in 1979, have been our only aid in risk assessment but have little clinical relevance beyond defining the level of medicolegal risk. Furthermore, these drug categories are poised to disappear before the publication of this editorial, as new guidelines for labeling human prescription drugs are mandated to begin on June 30, 2015.5 Although guaranteed to be confusing at first, it seems the new labeling guidelines will be much more helpful for clinicians. One of the most important changes is the inclusion of the following statement in pregnancy and lactation subsections on drug labels: “All pregnancies have a background risk of birth defect, loss, or other adverse outcome regardless of drug exposure. The fetal risk summary below describes (name of drug)’s potential to increase the risk of developmental abnormalities above the background risk.”5 In the absence of concerning human data, efforts will be made to put positive animal data into perspective. In the absence of systemic exposure the label will state: “(Name of drug) is not absorbed systemically from (part of body) and cannot be detected in the blood. Maternal use is not expected to result in fetal exposure to the drug.”5 This final rule includes virtually all topical acne products, including topical retinoids.
As weak as the evidence-based risk information is for drugs in pregnancy, it is worse for lactation. It is a commonly mistaken belief among practitioners that the safety, or lack thereof, of medications during pregnancy indicates safety during lactation. In actuality, decisions should instead be based on safety data on the drug during the neonatal period. Levels of neonatal drug exposure through breast milk is 5- to 10-fold less than fetal exposure in utero.6 Therefore, it generally is safer for women to take drugs during lactation than during pregnancy. For the most part, medications enter the breast milk by passive diffusion from the maternal bloodstream. Several hours after a medication is taken, maternal blood levels fall and drug from the breast milk flows back along the concentration gradient into the maternal circulation. Therefore, safety is maximized by administering maternal medications immediately after the last feed and just prior to the longest sleep period of the child, usually at night.
In the lactation section of the new labeling guidelines ruling, the verbiage is completely different and highly clinically relevant. If the data demonstrate that a drug does not affect the quantity and/or quality of human breast milk, the product label must state: “The use of (name of drug) is compatible with breastfeeding.”5 If the drug is not systemically absorbed, the label will state simply and clearly, “Breastfeeding is not expected to result in fetal exposure to the drug.” Therefore, if these labeling guidelines are followed, it appears that all topical acne medications will be interpreted as safe during lactation under the new guidelines.
Dermatologists have taken an oath to “first, do no harm,” but in the case of acne in pregnancy and especially in lactation, we may need to treat aggressively and push the envelope beyond our current category B medications. Erring on the side of caution may be the wrong approach, especially in lactation where psychological consequences are high and neonatal exposure is minimal. The new US Food and Drug Administration guidelines should be helpful in the process of risk assessment and aid us in discussing rational, thoughtful, practical approaches with our patients.
1. Halvorsen J, Stern R, Dalgard F, et al. Suicidal ideation, mental health problems and social impairment are increased in adolescents with acne: a population-based study. J Invest Dermatol. 2001;13:363-370.
2. Ramrakha S, Fergusson D, Horwood L, et al. Cumulative health consequences of acne: 23-year follow-up in a general population birth cohort study [published online ahead of print March 27, 2015]. Br J Dermatol. doi:10.1111/bjd.13786.
3. Yang YC, Tu HP, Hong CH, et al. Female gender and acne disease are jointly and independently associated with the risk of major depression and suicide: a national population-based study [published online ahead of print February 11, 2014]. Biomed Res Int. 2014;2014:504279.
4. Postpartum depression. American Psychological Association Web site. http://www.apa.org/pi/women/programs/depression/postpartum.aspx. Accessed June 20, 2015.
5. Content and format of labeling for human prescription drugs and biologics; requirements for pregnancy and lactation labeling. Fed Regist. 2004;79(233):72064-72103. To be codified at 21 CFR §201.
6. Wright-Hale T, Rowe HE, eds. Medications and Mother’s Milk. 3rd ed. Plano, TX: Hale Publishing; 2008.
Acne during pregnancy and lactation is common and poses a considerable treatment challenge for dermatologists. It is a disease that often is trivialized, viewed by the ill informed as cosmetic in nature. Combined with fetal and neonatal health concerns plus a healthy dose of medicolegal overlay, treatment of acne in this patient population may be complicated.
Pregnant and lactating women have been summarily orphaned from advances in drug therapy. Due to, in no small part, the pervasive litigious atmosphere surrounding birth defects in pregnancy, many health care providers have defaulted to avoiding all medications in this patient population to be “on the safe side,” and many have convinced pregnant women that taking medication to relieve pain and discomfort while pregnant is selfish and vain, especially where acne is concerned. However, erring on the safe side is not always safe. Drug avoidance can lead to increased physical and psychiatric morbidity.
Numerous studies have shown that acne is not trivial or inconsequential and may even be associated with suicidal ideations.1,2 In one study, female gender and acne were both jointly and independently associated with the risk for major depression and suicide.3 The traditional notion that pregnancy is a time of joy and emotional well-being is not supported by data. There is a marked increase of mood instability during pregnancy. According to the American Psychological Association, the incidence of true clinical postpartum depression in the United States is 1 in 7 pregnancies but is likely much higher, as it often remains undiagnosed.4 These women may consider suicide and may even harm their children. Therefore, “first, do no harm” might indeed involve aggressive therapy in this patient population; at the very least, it warrants a thorough consideration of the risks and benefits rather than a knee-jerk “wait until you stop breastfeeding” default. Without adequate knowledge of true drug risks and with the stakes so high, we find ourselves in medicolegal quicksand. As clinicians, we understand the concept of weighing risks and benefits, but the balance of the scale cannot be determined when no evidence exists regarding the relative weight of the risk side.
Most drug risks in pregnancy are noted after market approval and are obtained from published case reports and retrospective birth defect registries. Reported problems likely represent a small fraction of actual cases. The absence of direct information regarding drug use during pregnancy is exacerbated by the knowledge that there are large gender differences in drug pharmacokinetics. This dichotomy would be expected to be especially pronounced between men and pregnant women in whom drug absorption, distribution, and elimination are all notably altered. A poorly publicized aberration in the drug approval process is that gender information is not required from generic medication bioequivalence studies. Although studies for drugs indicated for both sexes need to include male and female participants, resulting data showing gender differences are not required to be disclosed, which means that it is theoretically possible for a generic drug to be approved based on results in men only.
The pregnancy categories for drugs (A, B, C, D, and X), which were initially defined in 1979, have been our only aid in risk assessment but have little clinical relevance beyond defining the level of medicolegal risk. Furthermore, these drug categories are poised to disappear before the publication of this editorial, as new guidelines for labeling human prescription drugs are mandated to begin on June 30, 2015.5 Although guaranteed to be confusing at first, it seems the new labeling guidelines will be much more helpful for clinicians. One of the most important changes is the inclusion of the following statement in pregnancy and lactation subsections on drug labels: “All pregnancies have a background risk of birth defect, loss, or other adverse outcome regardless of drug exposure. The fetal risk summary below describes (name of drug)’s potential to increase the risk of developmental abnormalities above the background risk.”5 In the absence of concerning human data, efforts will be made to put positive animal data into perspective. In the absence of systemic exposure the label will state: “(Name of drug) is not absorbed systemically from (part of body) and cannot be detected in the blood. Maternal use is not expected to result in fetal exposure to the drug.”5 This final rule includes virtually all topical acne products, including topical retinoids.
As weak as the evidence-based risk information is for drugs in pregnancy, it is worse for lactation. It is a commonly mistaken belief among practitioners that the safety, or lack thereof, of medications during pregnancy indicates safety during lactation. In actuality, decisions should instead be based on safety data on the drug during the neonatal period. Levels of neonatal drug exposure through breast milk is 5- to 10-fold less than fetal exposure in utero.6 Therefore, it generally is safer for women to take drugs during lactation than during pregnancy. For the most part, medications enter the breast milk by passive diffusion from the maternal bloodstream. Several hours after a medication is taken, maternal blood levels fall and drug from the breast milk flows back along the concentration gradient into the maternal circulation. Therefore, safety is maximized by administering maternal medications immediately after the last feed and just prior to the longest sleep period of the child, usually at night.
In the lactation section of the new labeling guidelines ruling, the verbiage is completely different and highly clinically relevant. If the data demonstrate that a drug does not affect the quantity and/or quality of human breast milk, the product label must state: “The use of (name of drug) is compatible with breastfeeding.”5 If the drug is not systemically absorbed, the label will state simply and clearly, “Breastfeeding is not expected to result in fetal exposure to the drug.” Therefore, if these labeling guidelines are followed, it appears that all topical acne medications will be interpreted as safe during lactation under the new guidelines.
Dermatologists have taken an oath to “first, do no harm,” but in the case of acne in pregnancy and especially in lactation, we may need to treat aggressively and push the envelope beyond our current category B medications. Erring on the side of caution may be the wrong approach, especially in lactation where psychological consequences are high and neonatal exposure is minimal. The new US Food and Drug Administration guidelines should be helpful in the process of risk assessment and aid us in discussing rational, thoughtful, practical approaches with our patients.
1. Halvorsen J, Stern R, Dalgard F, et al. Suicidal ideation, mental health problems and social impairment are increased in adolescents with acne: a population-based study. J Invest Dermatol. 2001;13:363-370.
2. Ramrakha S, Fergusson D, Horwood L, et al. Cumulative health consequences of acne: 23-year follow-up in a general population birth cohort study [published online ahead of print March 27, 2015]. Br J Dermatol. doi:10.1111/bjd.13786.
3. Yang YC, Tu HP, Hong CH, et al. Female gender and acne disease are jointly and independently associated with the risk of major depression and suicide: a national population-based study [published online ahead of print February 11, 2014]. Biomed Res Int. 2014;2014:504279.
4. Postpartum depression. American Psychological Association Web site. http://www.apa.org/pi/women/programs/depression/postpartum.aspx. Accessed June 20, 2015.
5. Content and format of labeling for human prescription drugs and biologics; requirements for pregnancy and lactation labeling. Fed Regist. 2004;79(233):72064-72103. To be codified at 21 CFR §201.
6. Wright-Hale T, Rowe HE, eds. Medications and Mother’s Milk. 3rd ed. Plano, TX: Hale Publishing; 2008.

Myth of the Month: Why can’t I give my patient hydrochlorothiazide?
A 56-year-old woman presents with hypertension. Her blood pressures have been about 160/100 mm Hg. Past medical history includes depression, GERD, and hypothyroidism, and the patient has an allergy to sulfamethoxazole (rash).
She receives a prescription for hydrochlorothiazide. The pharmacist calls later to report that the pharmacy did not fill the prescription because the patient has a sulfa allergy.
What would you recommend?
A. Call in a prescription for a calcium channel blocker.
B. Call in a prescription for an ACE inhibitor.
C. Call in a prescription for a beta-blocker.
D. Call and ask the pharmacist to fill the hydrochlorothiazide prescription.
I have received this call from pharmacies many times. The patients are usually very frustrated because they could not pick up their medications. Is this the right call from the pharmacist? Does the fact that the patient has a sulfa allergy make prescribing hydrochlorothiazide wrong?
Allergies to sulfonamide antibiotics occur in about 3% of patients who are prescribed the drugs. Sulfa-containing antibiotics contain a five- or six-member nitrogen-containing ring attached to the N1 nitrogen of the sulfonamide group and an arylamine group (H2N) at the N4 position of the sulfonamide group (Pharmacotherapy 2004;24:856-70). Sulfa-containing nonantibiotics – including thiazides and loop diuretics, as well as COX-2 inhibitors – do not contain these same features.
There has always been concern that there is a possibility of increased risk of drug reactions in patients who receive a sulfa nonantibiotic, and frequently prescriptions for these medicines are not filled by pharmacies without directly confirming the intent by speaking with the prescriber.
Brian Hemstreet, Pharm.D., and Robert Page II, Pharm.D., did a prospective, observational study of patients admitted to a hospital with a history of sulfa allergy (Pharmacotherapy 2006;26:551-7). A total of 94 patients were studied who had a reported sulfa allergy. Forty of these patients were taking a sulfonamide nonantibiotic at the time of admission (most commonly furosemide). Nine of the patients received a sulfonamide nonantibiotic during their hospitalization. None of the patients had a drug reaction, either while receiving a sulfonamide nonantibiotic in the hospital, or previously while receiving one as an outpatient.
Dr. Pilar Tornero and colleagues used patch testing and control oral challenge in patients with previous fixed drug eruptions to trimethoprim-sulfamethoxazole or an unknown sulfonamide (Contact Dermatitis 2004;51:57-62). All patients received low doses of oral sulfonamide antibiotics (trimethoprim-sulfamethoxazole, sulfadiazine, or sulfamethizole). All patients also received furosemide.
Every patient with previous known sulfa reaction had a positive oral challenge test when given sulfamethoxazole. There was cross reactivity with other sulfa antibiotics: Seven of 18 patients with prior sulfamethoxazole allergy reacted to oral challenge with sulfadiazine, and 4 of 9 patients with prior allergy with sulfamethoxazole reacted to challenge with sulfamethazine. All 28 patients in the study were challenged with furosemide (a sulfa nonantibiotic) with no allergic reactions.
Dr. Brian Strom and colleagues conducted a retrospective cohort study using general practice research database, looking at risk of allergic reactions within 30 days of receipt of a sulfonamide nonantibiotic (N. Engl. J. Med. 2003;349:1628-35).
Patients who had a history of prior hypersensitivity to a sulfonamide antibiotic were compared with those with no previous history of allergy. Analyses were also performed in patients with a prior penicillin allergy. A total of 969 patients who had an allergic reaction after a sulfonamide antibiotic were evaluated.
Of those patients, 9.1% had an allergic reaction after receiving a sulfonamide nonantibiotic. In those patients without a sulfa antibiotic allergy, only 1.6% had a reaction to a sulfa nonantibiotic. Interestingly, in patients with a prior history of penicillin reaction, 14.6% had an allergic reaction when receiving a sulfa nonantibiotic.
Patients with a history of sulfa allergy to a sulfa antibiotic are more likely to have a reaction to a sulfa nonantibiotic than are those without a previous allergy history. But this appears to be due to overall increased reactiveness and not a cross reactivity, because those with history of penicillin allergy had an even higher allergy rate to sulfa nonantibiotics than did patients with a prior sulfa allergy.
Dr. Paauw is professor of medicine in the division of general internal medicine at the University of Washington, Seattle, and he serves as third-year medical student clerkship director at the University of Washington. Contact Dr. Paauw at [email protected].

Index discriminates prognostic groups in CLL
An international prognostic index for patients with chronic lymphocytic leukemia (CLL) may help to inform treatment decisions, based on a meta-analysis presented at the International Congress on Malignant Lymphoma in Lugano, Switzerland.
The International Prognostic Index for patients with CLL (CLL-IPI) combines the most important genetic risk factors and traditional clinical stage, age, and serum beta-2-microglobulin measures. By discriminating between prognostic groups, the index may aid in informing treatment of CLL patients, Dr. Jasmin Bahlo of the University Hospital Cologne, Köln, Germany, said.
The CLL-IPI consists of five risk factors – age, clinical stage, IgHV (immunoglobulin heavy-chain variable-region) gene mutation status, serum beta-2-microglobulin measure, and the presence of del(17p) and/or TP53 mutation, Dr. Bahlo said.
To develop the index, Dr. Bahlo and colleagues performed an analysis of 26 possible prognostic factors by using data from eight phase III trials from France, Germany, the United Kingdom, the United States, and Poland. The data included a full analysis set of 3,742 previously untreated patients at early and advanced stages of disease. The median age of the patients was 61 years, the median observation time was 80 months, and the main endpoint was overall survival.
From the 26 variables, the researchers identified five independent predictors for overall survival: age (65 years or more), clinical stage (Binet A/Rai 0 vs. Binet B-C/Rai I-IV), del(17p) and/or TP53 mutation status, IgHV mutation status, and serum beta-2-microglobulin measure (3.5 mg/L or more).
The index was used to identify four risk groups – low risk (score 0-1), intermediate (score 2-3), high (score 4-6), and very high (score 7-10)) – with significantly different overall survival rates at 5 years of 93%, 79%, 64%, and 23%, respectively.
The value of the index was then confirmed in 575 patients, with a 5-year overall survival rate of 91%, 80%, 52%, and 19%, respectively.
Similar findings were seen in an external data set of patients from the Mayo Clinic data set, with 5-year overall survivals of 97%, 91%, 68%, and 21%, respectively. The CLL-IPI also provided accurate estimation regarding time to first treatment; 81%, 47%, 30%, and 19% of patients in the respective risk groups were free from treatment at 5 years.
In the era of more effective treatments for CLL, the established clinical staging systems (Rai and Binet) do not accurately discriminate between prognostic groups because they do not integrate the major clinical, biologic, and genetic variables into one widely accepted prognostic system, Dr. Bahlo noted. The CLL-IPI is, therefore, an important contribution to management of this condition.
The researchers had no relevant financial disclosures.
Until very recently, most treatment decisions in CLL have been based on age, overall fitness of the patient and presence of cytopenias. Biologic prognostic markers have been delineated, but not acted upon, with the recent exception of del17p given the advent of effective novel agents in this setting. This is an admirable attempt to establish a better prognostic index, building upon prior German CLL group data (Pflug et al Blood 2014), but it has limitations. It is a weighted score, heavily dependent on p53 mutation/del17p, which is uncommon at initial diagnosis, and today such patients should be receiving a targeted agent. It would be useful to have a CLL-IPI for patients without del17p. Further, while its ability to predict time to require therapy will remain useful, its survival predictions are likely already outdated given the array of new agents already, or soon to be, available.
Until very recently, most treatment decisions in CLL have been based on age, overall fitness of the patient and presence of cytopenias. Biologic prognostic markers have been delineated, but not acted upon, with the recent exception of del17p given the advent of effective novel agents in this setting. This is an admirable attempt to establish a better prognostic index, building upon prior German CLL group data (Pflug et al Blood 2014), but it has limitations. It is a weighted score, heavily dependent on p53 mutation/del17p, which is uncommon at initial diagnosis, and today such patients should be receiving a targeted agent. It would be useful to have a CLL-IPI for patients without del17p. Further, while its ability to predict time to require therapy will remain useful, its survival predictions are likely already outdated given the array of new agents already, or soon to be, available.
Until very recently, most treatment decisions in CLL have been based on age, overall fitness of the patient and presence of cytopenias. Biologic prognostic markers have been delineated, but not acted upon, with the recent exception of del17p given the advent of effective novel agents in this setting. This is an admirable attempt to establish a better prognostic index, building upon prior German CLL group data (Pflug et al Blood 2014), but it has limitations. It is a weighted score, heavily dependent on p53 mutation/del17p, which is uncommon at initial diagnosis, and today such patients should be receiving a targeted agent. It would be useful to have a CLL-IPI for patients without del17p. Further, while its ability to predict time to require therapy will remain useful, its survival predictions are likely already outdated given the array of new agents already, or soon to be, available.
An international prognostic index for patients with chronic lymphocytic leukemia (CLL) may help to inform treatment decisions, based on a meta-analysis presented at the International Congress on Malignant Lymphoma in Lugano, Switzerland.
The International Prognostic Index for patients with CLL (CLL-IPI) combines the most important genetic risk factors and traditional clinical stage, age, and serum beta-2-microglobulin measures. By discriminating between prognostic groups, the index may aid in informing treatment of CLL patients, Dr. Jasmin Bahlo of the University Hospital Cologne, Köln, Germany, said.
The CLL-IPI consists of five risk factors – age, clinical stage, IgHV (immunoglobulin heavy-chain variable-region) gene mutation status, serum beta-2-microglobulin measure, and the presence of del(17p) and/or TP53 mutation, Dr. Bahlo said.
To develop the index, Dr. Bahlo and colleagues performed an analysis of 26 possible prognostic factors by using data from eight phase III trials from France, Germany, the United Kingdom, the United States, and Poland. The data included a full analysis set of 3,742 previously untreated patients at early and advanced stages of disease. The median age of the patients was 61 years, the median observation time was 80 months, and the main endpoint was overall survival.
From the 26 variables, the researchers identified five independent predictors for overall survival: age (65 years or more), clinical stage (Binet A/Rai 0 vs. Binet B-C/Rai I-IV), del(17p) and/or TP53 mutation status, IgHV mutation status, and serum beta-2-microglobulin measure (3.5 mg/L or more).
The index was used to identify four risk groups – low risk (score 0-1), intermediate (score 2-3), high (score 4-6), and very high (score 7-10)) – with significantly different overall survival rates at 5 years of 93%, 79%, 64%, and 23%, respectively.
The value of the index was then confirmed in 575 patients, with a 5-year overall survival rate of 91%, 80%, 52%, and 19%, respectively.
Similar findings were seen in an external data set of patients from the Mayo Clinic data set, with 5-year overall survivals of 97%, 91%, 68%, and 21%, respectively. The CLL-IPI also provided accurate estimation regarding time to first treatment; 81%, 47%, 30%, and 19% of patients in the respective risk groups were free from treatment at 5 years.
In the era of more effective treatments for CLL, the established clinical staging systems (Rai and Binet) do not accurately discriminate between prognostic groups because they do not integrate the major clinical, biologic, and genetic variables into one widely accepted prognostic system, Dr. Bahlo noted. The CLL-IPI is, therefore, an important contribution to management of this condition.
The researchers had no relevant financial disclosures.
FROM 13-ICML
Key clinical point: An international prognostic index for patients with chronic lymphocytic leukemia may help to inform treatment decisions.
Major finding: The index was used to identify four risk groups – low risk (score 0-1), intermediate (score 2-3), high (score 4-6), and very high (score 7-10)) – with significantly different overall survival rates at 5 years of 93%, 79%, 64%, and 23%, respectively.
Data source: A multivariate analysis of 3,742 previously untreated patients at early and advanced CLL stages.
Disclosures: The researchers had no relevant financial disclosures.
High VTE recurrence risk persists for at least 3 years
TORONTO – The risk of recurrence following an initial episode of venous thromboembolism is highest in the first 3 months, but remains high for up to 3 years, according to findings from a population-based study involving 2,989 adults.
Over a mean of 23 months (median, 30 months), there were 329 VTE recurrences in the study subjects. Cumulative incidence rates were 5.1% at 3 months, and 14.5% at 3 years. The corresponding rates were 8.7% and 24.8% among those with active cancer, 5.2% and 13.0% among those with provoked VTE, and 3.8% and 13.1% among those with unprovoked VTE, Dr. Wei Huang reported at the International Society on Thrombosis and Haemostasis congress.

Independent predictors of recurrence within 3 years after the index event were active cancer with chemotherapy (hazard ratio, 2.59), active cancer without chemotherapy (HR, 1.59), hypercoagulable state (HR, 2.53) superficial thrombophlebitis (HR, 1.62), varicose vein stripping (HR, 1.75), and inferior vena cava (IVC) filter placement (HR, 2.04), said Dr. Huang of the University of Massachusetts, Worcester.
Individuals included in the study were all residents of the Worcester Metropolitan Statistical Area (WMSA) who had a validated diagnosis of acute first-time deep vein thrombosis and/or pulmonary embolism in a hospital or ambulatory care center that provided short-term care for WMSA residents between 1999 and 2009. Medical records and national and local death registry data were reviewed to examine outcomes up to 3 years after the index event.
Subjects were adults with a mean age of 64 years; 44% were men, and 94% where white. Pulmonary embolism with or without deep vein thrombosis occurred in 42%, and 17% of cases were associated with cancer, 43% involved provoked VTE, and 40% involved unprovoked VTE.
Provoked VTE was defined as VTE occurring within 3 months of a prior surgery, pregnancy, trauma, fracture, or hospitalization in patients without presence of active cancer.
Though limited by the lack of information about variations in physician practices across regions, and by the high proportion of white resident in the WMSA, which both raise questions about whether the findings are generalizable to the U.S. population, the identification of these predictors could allow for improved estimation of risk for individual patients, and may aid in the design of new interventional studies, Dr. Huang concluded.
This study was supported by the National Institutes of Health.
TORONTO – The risk of recurrence following an initial episode of venous thromboembolism is highest in the first 3 months, but remains high for up to 3 years, according to findings from a population-based study involving 2,989 adults.
Over a mean of 23 months (median, 30 months), there were 329 VTE recurrences in the study subjects. Cumulative incidence rates were 5.1% at 3 months, and 14.5% at 3 years. The corresponding rates were 8.7% and 24.8% among those with active cancer, 5.2% and 13.0% among those with provoked VTE, and 3.8% and 13.1% among those with unprovoked VTE, Dr. Wei Huang reported at the International Society on Thrombosis and Haemostasis congress.
Independent predictors of recurrence within 3 years after the index event were active cancer with chemotherapy (hazard ratio, 2.59), active cancer without chemotherapy (HR, 1.59), hypercoagulable state (HR, 2.53) superficial thrombophlebitis (HR, 1.62), varicose vein stripping (HR, 1.75), and inferior vena cava (IVC) filter placement (HR, 2.04), said Dr. Huang of the University of Massachusetts, Worcester.
Individuals included in the study were all residents of the Worcester Metropolitan Statistical Area (WMSA) who had a validated diagnosis of acute first-time deep vein thrombosis and/or pulmonary embolism in a hospital or ambulatory care center that provided short-term care for WMSA residents between 1999 and 2009. Medical records and national and local death registry data were reviewed to examine outcomes up to 3 years after the index event.
Subjects were adults with a mean age of 64 years; 44% were men, and 94% where white. Pulmonary embolism with or without deep vein thrombosis occurred in 42%, and 17% of cases were associated with cancer, 43% involved provoked VTE, and 40% involved unprovoked VTE.
Provoked VTE was defined as VTE occurring within 3 months of a prior surgery, pregnancy, trauma, fracture, or hospitalization in patients without presence of active cancer.
Though limited by the lack of information about variations in physician practices across regions, and by the high proportion of white resident in the WMSA, which both raise questions about whether the findings are generalizable to the U.S. population, the identification of these predictors could allow for improved estimation of risk for individual patients, and may aid in the design of new interventional studies, Dr. Huang concluded.
This study was supported by the National Institutes of Health.
AT THE 2015 ISTH CONGRESS
Key clinical point: The risk of recurrence following an initial episode of venous thromboembolism is highest in the first 3 months, but remains high for up to 3 years, according to findings from a population-based study involving 2,989 adults.
Major finding: Active cancer with chemotherapy was the strongest predictor of VTE recurrence (hazard ratio, 2.59).
Data source: Population-based surveillance of 2,989 adults patients.
Disclosures: The National Institutes of Health supported the study.

Statins showed no benefit in reducing risk of recurrent VTE
TORONTO – The use of statins showed no benefit in reducing the risk of recurrent venous thromboembolism in patients enrolled in phase III trials comparing direct oral anticoagulants with vitamin K antagonists, a large meta-analysis demonstrated.
Recurrence after an unprovoked VTE is 10%-15% in the first 6-12 months, and recurrence risk in the first 6 months is reduced by 80%-90% with anticoagulants, Dr. Mandy N. Lauw said at the International Society on Thrombosis and Haemostasis congress.

“However, the use of anticoagulants has the risk of bleeding, and therefore the long-term risk-benefit ratio is unclear,” said Dr. Lauw of the department of vascular medicine at Academic Medical Center, Amsterdam. “Therefore it’s interesting to look at modalities outside the coagulation cascade to treat patients for longer term and to prevent recurrent thrombosis. One of these modalities has been the use of statins, which are known to reduce arterial vascular events by lowering cholesterol levels. However, recent studies have also indicated that they may have an effect on VTE events.”
In an effort to evaluate the effects of statins on recurrent VTE, Dr. Lauw and her associates conducted a meta-analysis of statins in three randomized, phase III trials comparing non–vitamin K oral anticoagulant (NOAC) with vitamin K antagonist (VKA) therapy in patients with acute symptomatic VTE.
The trials included 5,153 patients enrolled in RE-COVER I and II (an analysis of dabigatran vs. standard therapy for acute VTE), 8,281 enrolled in the EINSTEIN clinical trials for DVT and pulmonary embolism (an analysis of rivaroxaban vs. standard therapy for symptomatic VTE), and 8,292 enrolled in a trial conducted by the Hokusai-DVT investigators (an analysis of edoxaban vs. standard therapy for symptomatic VTE). The researchers examined the effect of statin use on recurrent VTE or VTE-related death, recurrent DVT or PE, and major bleeding. To do this they conducted a pooled meta-analysis and an analysis per study, adjusted for age, gender, diabetes mellitus, creatinine clearance of less than 50 mL/min, hypertension, prior VTE, and use of aspirin.
Dr. Lauw reported results from 21,587 patients included in the analysis. Among all three studies, 2,754 patients (12.8%) used statins and 18,833 (87.2%) did not. In an unadjusted pooled analysis, the use of statins at baseline did not have an influence on the risk of recurrent VTE or VTE-related death, with an odds ratio of 0.91. There was also no effect of statins on the risk of recurrent PE or DVT (ORs of 0.84 and 1.05, respectively), while major bleeding seemed to be increased with the use of statins (OR, 1.65). A subanalysis in patients getting NOAC or VKA separately showed a non–statistically significant benefit of statins with NOACs, compared with VKAs on the risk of recurrent VTE or VTE-related death (ORs of 0.60 vs. OR 1.24, respectively). The results were similar for NOACs, compared with VKA, on the risk of recurrent DVT (ORs of 0.47 vs. OR 1.67) and the risk of recurrent PE (ORs of 0.73 vs. 1.02).
On adjusted analysis, the risk of recurrent VTE or VTE-related death between all three studies was similar and nonsignificant (hazard ratio of 0.99 in RE-COVER I and II, HR of 0.78 in the EINSTEIN clinical trials for DVT & PE, and HR of 0.99 in the trial conducted by the Hokusai-DVT Investigators). There also were no significant differences between the study groups in recurrent PE, recurrent DVT, or major bleeding. “So statins have no beneficial effect, but also no harmful effect,” Dr. Lauw said.
She acknowledged certain limitations of the study, including the fact that it was an on-treatment analysis, “so it could be that we had inadequate follow-up duration,” she said. “Also, we don’t have any assessment of statin effects without anticoagulation in these patients. Perhaps it would be interesting to use the extension trials to explore these results as well.”
For now, “there is no evidence that statins reduce the recurrence of VTE,” she concluded. “The only way to explore this is to do a randomized controlled trial properly designed and powered to estimate this effect prospectively.”
Dr. Lauw reported having no financial disclosures.
TORONTO – The use of statins showed no benefit in reducing the risk of recurrent venous thromboembolism in patients enrolled in phase III trials comparing direct oral anticoagulants with vitamin K antagonists, a large meta-analysis demonstrated.
Recurrence after an unprovoked VTE is 10%-15% in the first 6-12 months, and recurrence risk in the first 6 months is reduced by 80%-90% with anticoagulants, Dr. Mandy N. Lauw said at the International Society on Thrombosis and Haemostasis congress.
“However, the use of anticoagulants has the risk of bleeding, and therefore the long-term risk-benefit ratio is unclear,” said Dr. Lauw of the department of vascular medicine at Academic Medical Center, Amsterdam. “Therefore it’s interesting to look at modalities outside the coagulation cascade to treat patients for longer term and to prevent recurrent thrombosis. One of these modalities has been the use of statins, which are known to reduce arterial vascular events by lowering cholesterol levels. However, recent studies have also indicated that they may have an effect on VTE events.”
In an effort to evaluate the effects of statins on recurrent VTE, Dr. Lauw and her associates conducted a meta-analysis of statins in three randomized, phase III trials comparing non–vitamin K oral anticoagulant (NOAC) with vitamin K antagonist (VKA) therapy in patients with acute symptomatic VTE.
The trials included 5,153 patients enrolled in RE-COVER I and II (an analysis of dabigatran vs. standard therapy for acute VTE), 8,281 enrolled in the EINSTEIN clinical trials for DVT and pulmonary embolism (an analysis of rivaroxaban vs. standard therapy for symptomatic VTE), and 8,292 enrolled in a trial conducted by the Hokusai-DVT investigators (an analysis of edoxaban vs. standard therapy for symptomatic VTE). The researchers examined the effect of statin use on recurrent VTE or VTE-related death, recurrent DVT or PE, and major bleeding. To do this they conducted a pooled meta-analysis and an analysis per study, adjusted for age, gender, diabetes mellitus, creatinine clearance of less than 50 mL/min, hypertension, prior VTE, and use of aspirin.
Dr. Lauw reported results from 21,587 patients included in the analysis. Among all three studies, 2,754 patients (12.8%) used statins and 18,833 (87.2%) did not. In an unadjusted pooled analysis, the use of statins at baseline did not have an influence on the risk of recurrent VTE or VTE-related death, with an odds ratio of 0.91. There was also no effect of statins on the risk of recurrent PE or DVT (ORs of 0.84 and 1.05, respectively), while major bleeding seemed to be increased with the use of statins (OR, 1.65). A subanalysis in patients getting NOAC or VKA separately showed a non–statistically significant benefit of statins with NOACs, compared with VKAs on the risk of recurrent VTE or VTE-related death (ORs of 0.60 vs. OR 1.24, respectively). The results were similar for NOACs, compared with VKA, on the risk of recurrent DVT (ORs of 0.47 vs. OR 1.67) and the risk of recurrent PE (ORs of 0.73 vs. 1.02).
On adjusted analysis, the risk of recurrent VTE or VTE-related death between all three studies was similar and nonsignificant (hazard ratio of 0.99 in RE-COVER I and II, HR of 0.78 in the EINSTEIN clinical trials for DVT & PE, and HR of 0.99 in the trial conducted by the Hokusai-DVT Investigators). There also were no significant differences between the study groups in recurrent PE, recurrent DVT, or major bleeding. “So statins have no beneficial effect, but also no harmful effect,” Dr. Lauw said.
She acknowledged certain limitations of the study, including the fact that it was an on-treatment analysis, “so it could be that we had inadequate follow-up duration,” she said. “Also, we don’t have any assessment of statin effects without anticoagulation in these patients. Perhaps it would be interesting to use the extension trials to explore these results as well.”
For now, “there is no evidence that statins reduce the recurrence of VTE,” she concluded. “The only way to explore this is to do a randomized controlled trial properly designed and powered to estimate this effect prospectively.”
Dr. Lauw reported having no financial disclosures.
AT THE 2015 ISTH CONGRESS
Key clinical point: No beneficial effect of statins in reducing recurrent VTE was observed in patients threated in phase III acute VTE trials.
Major finding: On adjusted analysis, the risk of recurrent VTE or VTE-related death between all three studies was similar and nonsignificant (HR of 0.99 in RE-COVER I and II, HR of 0.78 in the EINSTEIN clinical trials for DVT and PE, and HR of 0.99 in the trial conducted by the Hokusai-DVT investigators).
Data source: A meta-analysis of 21,587 patients enrolled in three phase III trials comparing non–vitamin K oral anticoagulant (NOAC) with vitamin K antagonist (VKA) therapy in patients with acute symptomatic VTE.
Disclosures: Dr. Lauw reported having no financial disclosures.

Combo shows potential for treating PEL

reviewing an image
Photo from the University
of Southern California
Immunomodulatory drugs (IMiDs) and BRD4 inhibitors hold promise for treating primary effusion lymphoma (PEL), according to preclinical research.
The IMiDs lenalidomide and pomalidomide had antiproliferative effects in PEL cell lines, and lenalidomide exhibited synergistic cytotoxicity with the BRD4 inhibitors JQ-1, IBET151, and PFI-1.
In mouse models of PEL, treatment with lenalidomide and JQ-1 significantly prolonged survival.
Preet Chaudhary, MD, PhD, of the University of Southern California, Los Angeles, and his colleagues reported these results in Oncogene.
The researchers first tested lenalidomide and pomalidomide in 9 PEL cell lines. Both drugs exhibited antiproliferative effects, at clinically achievable doses, in 6 of the cell lines (BC-3, BCBL-1, JSC-1, VG-1, UMPEL-1, and UMPEL-3).
The IMiDs displayed activity in the remaining 3 cells lines (BC-1, BCP-1, and APK-1) as well, but only at high doses (ranging from 2.6 μM to 10 μM for lenalidomide and from 226 nM to 744 nM for pomalidomide).
Looking into the mechanism of IMiDs in PEL, the researchers found these drugs induce G1 cell-cycle arrest without inducing Kaposi’s sarcoma-associated herpes virus lytic cycle reactivation.
Further investigation revealed that interferon α, β, and γ are cytotoxic to PEL, but they are not essential for the antiproliferative effects of IMiDs. On the other hand, cereblon-dependent suppression of IRF4 and rapid degradation of IKZF1 are essential.
The researchers also found that knocking down MYC enhanced IMiD activity. This led them to BRD4 inhibitors, which are known to target MYC transcription.
The team tested lenalidomide in combination with JQ-1, IBET151, and PFI-1. The IMiD was “highly synergistic” with all 3 BRD4 inhibitors in BC-3 and BCBL-1 cell lines.
In both cell lines, treatment with lenalidomide and JQ-1 significantly decreased the expression of MYC and IRF4 at protein and mRNA levels. The treatment also resulted in G1 cell cycle arrest, cleavage of poly (ADP-ribose) polymerase, and apoptosis.
So the researchers tested this combination in a mouse model of PEL (NOD-SCID mice injected with BC-3 cells). And they observed a significant improvement in median survival for mice that received combination treatment, compared to lenalidomide or JQ-1 alone—51 days, 35 days, and 42 days, respectively (P≤0.01).![]()