User login
Compound could aid fight against malaria
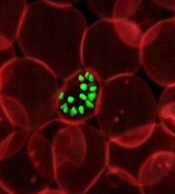
infecting an RBC
Image courtesy of St. Jude
Children’s Research Hospital
Luminol, the compound detectives spray at crime scenes to find trace amounts of blood, can help kill malaria parasites, according to preclinical research published in eLife.
Luminol glows blue when it encounters the hemoglobin in red blood cells (RBCs), and researchers have found they can trick malaria-infected RBCs into
building up a volatile chemical stockpile that can be set off by luminol’s glow.
To achieve this, the researchers exposed infected RBCs to an amino acid known as 5-aminolevulinic acid (ALA), luminol, and 4-iodophenol (a small-molecule that enhances the intensity and duration of luminol chemiluminescence).
This triggered buildup of the chemical, protoporphyrin IX (PPIX), which effectively killed the parasites. When the team substituted artemisinin for 4-iodophenol, they observed similar results.
“The light that luminol emits is enhanced by the antimalarial drug artemisinin,” said study author Daniel Goldberg, MD, PhD, of the Washington University School of Medicine in St Louis, Missouri.
“We think these agents could be combined to form an innovative treatment for malaria.”
The researchers believe this type of therapy would have an advantage over current malaria treatments, which have become less effective as the parasite mutates. That is because the new approach targets proteins made by human RBCs, which the parasite can’t mutate.
To uncover this approach, Dr Goldberg and his colleagues worked with human RBCs infected with Plasmodium falciparum. The team wanted to better understand how the parasite gets hold of heme, which is essential to the parasite’s survival.
They found that P falciparum opens an unnatural channel on the surface of RBCs. When the researchers put ALA (an ingredient of heme) into a solution containing infected RBCs, ALA entered the cells through the channel and started the heme-making process.
This led to a buildup of PPIX. When exposed to luminol and 4-iodophenol, PPIX emitted free radicals. This potently inhibited parasite growth, according to the researchers. And microscopic examination revealed widespread parasite death.
The ALA/luminol/4-iodophenol combination also worked in a parasite line that was resistant to antifolate and quinolone antibiotics, as well as one with a kelch-13 protein mutation, which confers artemisinin tolerance.
The researchers then wanted to determine if artemisinin would enhance their strategy. So they incubated malaria-infected RBCs with ALA, luminol, and/or sub-therapeutic doses of dihydroartemisinin.
Each of the components alone or 2 of them together had little effect, but all 3 in combination successfully ablated parasite growth.
The researchers are now planning to test this treatment approach in vivo.
“All of these agents—the amino acid, the luminol, and artemisinin—have been cleared for use in humans individually, so we are optimistic that they won’t present any safety problems together,” Dr Goldberg said. “This could be a promising new treatment for a devastating disease.” ![]()
The six Ps of vascular surgery
Vascular Surgery has evolved to balance clinical medicine, open and minimally invasive surgical interventions, and innovation into a unique career where technological advancement is constantly pushing the boundaries of what is possible in surgical capabilities.
Being awed and inspired by the Vascular Surgery specialty, we have put together the 6Ps for pursuing a career in Vascular Surgery in the spirit of the notorious 6Ps for acute limb ischemia.
1. Patients: Vascular patients are a unique and complex population of patients burdened with numerous comorbidities. Approaching and managing vascular patients requires a good understanding of preoperative medical assessment, risk factor modification, and clinical medicine. Moreover, the nature of vascular disease allows vascular surgeons to develop longstanding relationships with their patients and their families, and follow them through numerous stages of their illness and recovery.
2. Procedures: Performing vascular surgery is a delicate and exhilarating experience operating on arteries, veins, and lymphatics virtually in every part of the body, from the neck, chest, abdomen, and upper and lower limbs. We perform complex procedures from minimally invasive routes to intricate open procedures. Vascular surgeons offer lifesaving, limb-salvaging and quality of life-improving procedures on a daily basis.
3. Problem solving: As medical students and residents can appreciate in vascular teaching rounds, there is never one answer to a clinical situation. Each particular case may be considered through multiple approaches – open surgery, endovascular surgery, hybrid surgery, or medical management. Strikingly, within each category there are further numerous options to consider. Trying to develop the solutions and clinical judgment around a case is what makes this specialty tantalizing. 4. People: Vascular surgeons are the nicest group of surgeons we have ever worked with (there might be a large bias in this statement). They are passionate about their specialty, dedicated to patient care, enthusiastic to teach students, and always easily approachable. We have both been fortunate to be mentored by vascular surgeons and as such decided to pursue careers in this extremely patient-centered field. Given that it is a small community, it truly feels like you are part of the vascular family.
5. Potential: Technology is advancing at an extraordinarily fast pace and the vascular community fosters innovation from preventative strategies, new imaging modalities, and new graft designs just to name a few. The big question is, where will the vascular specialty be in 10 years? And our belief is that it depends on the limits of our imagination. We need to challenge conventional thinking with courage and imagination, bringing innovation to the health care platform.
And finally, one should pursue a career in vascular surgery because it is simply ...
6. Pretty awesome.
As the frontiers of science and technology push forward, so too do the ideas, creativity, and innovation of talented people. Our hope is to be at that cutting edge leading the development of improved medical care and surgical delivery as vascular surgeons.

Percutaneous thrombectomy reduces risk of postthrombotic syndrome
Adding a mechanical suction technique to local thrombolysis to break up and remove blood clots reduced postthrombotic syndrome (PTS) after deep vein thrombosis (DVT) without causing increased complications, according to a small retrospective study.
Dr. Chun-Yang Huang of the National Yang Ming University (Taipei, Taiwan) and colleagues examined patients diagnosed with acute proximal lower limb DVT. Patients received either thrombolysis alone via a catheter-directed thrombolysis (CDT), or percutaneous mechanical thrombectomy (PMT) by a combination of pharmacologic thrombolysis and suction; both techniques were accompanied by systemic anticoagulation. Though both treatment groups fared well during treatment and for the 12-month follow-up period, the PMT group had a significantly lower incidence of PTS 1 year after treatment (Ann. Vascular Surg. 2015. doi: 10.1016/j.avsg.2015.01.014).
For those with DVT, parenteral anticoagulation prevents propagation of the clot and minimizes risk of pulmonary embolism (PE); however, anticoagulation does not accelerate dissolution of the existing clot. According to study authors, 30%-40% of those with proximal leg DVTs will go on to develop PTS, with the prolonged distal venous stasis from an undisturbed clot causing loss of valvular competence and resultant chronic venous insufficiency. PTS can involve leg swelling, discomfort, skin changes, and ulceration, with significant impact on quality of life and health care costs.
Techniques such as CDT and PMT can increase the rate of clot dissolution, thus restoring patency sooner and minimizing risk for PTS. However, these methods also can carry increased risk of bleeding and infection, considerations that must be balanced against potential benefit.
Investigators reviewed records for 39 patients who were diagnosed with ultrasound- or CT-confirmed acute proximal lower limb DVT and received either CDT or PMT during the period from November 2010 to November 2013. Patients were not randomized to treatment arms but were assigned using clinical judgment and patient preference. During the 12-month follow-up, three participants died of malignancy and two were lost to follow-up. Analysis was completed for the remaining 34 patients.
Overall, patient characteristics did not differ significantly between groups, with mean ages of 62.75 for the PMT group (n = 16) and 64.17 for the CDT group (n = 18). In all, 13/34 participants were female. Patients in both treatment groups fared well, with no 30-day mortality, and no episodes of major bleeding, PE, or renal failure. Ten patients in the PMT group and six in the CDT group required stenting of the common iliac vein to maintain patency, a nonsignificant difference. Just one participant in the CDE group experienced a minor bleeding event.
Turning to outcomes, study authors assessed postprocedure patency, finding improved patency for both procedures (P less than .001 for both, compared with preoperation patency scores), with no significant difference between the two groups post procedure. Thrombus scores were also significantly better for both treatment arms post procedure (P less than .001). Clot burden tended to improve more rapidly over the 12-month follow-up period for the PMT group, though the difference between groups was just short of statistically significant.
At 12 months, though the amount of venous reflux did not differ significantly between groups, those who had received PMT had significantly fewer signs and symptoms of PTS. This assessment used the Villalta scale, a standardized assessment and scoring system for PTS, where higher numbers indicate worse PTS. The PMT group’s Villalta score was 2.06 +/–2.95, compared with 5.06 +/–4.07 for the CDT group (P = .030).
Study limitations included the small study size, retrospective study design, and lack of randomization. Acknowledging these limitations, Dr. Huang and coauthors called for larger, multicenter, randomized controlled studies of PMT. The personal and economic costs of PTS, they argue, warrant exploring whether PMT may help minimize total thrombolysis dose, reduce hospital stays, and decrease costs while minimizing the risks of chronic venous insufficiency post DVT.
Dr. Huang and coauthors reported no conflicts of interest.
Key clinical point: Both percutaneous PMT and catheter-directed thrombolysis (CDT) were safe and effective, but PMT reduced risk of postthrombotic syndrome.
Major finding: In a small retrospective analysis of patients with deep vein thrombosis (DVT), both PMT and CDT were safe and effective when used in combination with systemic anticoagulation; however, postthrombotic syndrome (PTS) scoring was significantly better for those receiving PMT (Villalta score 2.1 +/- 3.0 vs. 5.1 +/- 4.1, P = .030).
Data source: Retrospective study of 39 patients who were diagnosed with acute proximal DVT of the lower limb between November 2010 and November 2013 at a Taiwanese hospital.
Disclosures: The authors reported that they had no conflicts of interest; funding source was not provided.
NICE recommends empagliflozin in combo therapy for type 2 diabetes
The National Institute for Health and Care Excellence (NICE) has issued guidance on the clinical and cost-effectiveness of empagliflozin in combination therapy for treatment of type 2 diabetes.
The guideline, released in March, is for advanced-practice nurses, nurses, physician assistants, and physicians, according to a summary by the National Guideline Clearinghouse (NGC).
The summary lists recommendations by NICE for treatment of type 2 diabetes as follows:
• Empagliflozin in a dual-therapy regimen in combination with metformin, only if a sulfonylurea is contraindicated or not tolerated, or if the person is at significant risk of hypoglycemia or its consequences.
• Empagliflozin in a triple-therapy regimen, in combination with metformin and a sulfonylurea or metformin and a thiazolidinedione.
• Empagliflozin in combination with insulin with or without other antidiabetic drugs.
According to the summary, the most commonly reported adverse reactions for empagliflozin are hypoglycemia in combination with insulin or a sulfonylurea, vulvovaginal candidiasis, urinary tract infection, and polyuria or pollakiuria.
As for the cost-effectiveness, an appraisal committee independent of NICE “concluded that the very small differences in costs and quality-adjusted life years between empagliflozin (10 mg and 25 mg) and its key comparators showed that empagliflozin was a cost-effective use of National Health Service resources as dual therapy in combination with metformin, triple therapy in combination with metformin and either a sulfonylurea or a thiazolidinedione, and as an add-on treatment to insulin.”
NICE releases guidelines on medicine optimization
Effective systems and processes are a key part of minimizing the risk of preventable medicine-related problems and ensuring best possible outcomes for care, according to newly released clinical guidelines from the Medicines Prescribing Centre of the U.K.-based National Institute for Health and Care Excellence (NICE).
The guidelines, developed by a multidisciplinary Guideline Development Group (GDG) of NICE staff, health professionals, and lay members, were designed to ensure that National Health Service patients get the best possible outcomes from their medicines.
“Relevant information about medicines should be shared with patients, and their family members or carers, where appropriate, and between health and social care practitioners when a person moves from one care setting to another, to support high-quality care,” wrote the authors of the guidelines, led by Dr. Weeliat Chong, chair of the GDG.
The report identified four key recommendations as priorities for implementation:
• Consider using multiple methods (such as health record review, patient surveys and direct observation of medicines administration) to identify medicine-related patient safety incidents
• Organizations should ensure that medicines reconciliation (i.e., making sure medicines prescribed on admission correspond to those that the patient was taking before admission) is carried out by a trained and competent health professional with effective communication skills, technical knowledge of processes for managing medicines, and therapeutic knowledge of medicines use.
• Health and social care practitioners should share relevant information about the [patients] and their medicines via medicines-related communication systems when a person transfers from one care setting to another.
• Consider sending the patient’s medicines discharge information to [his or her] nominated community pharmacy, when possible and in agreement with the patient.
Click here for the full report.
“Cogwheel” and other signs of hydrosalpinx and pelvic inclusion cysts
Ultrasonography is the preferred imaging method to evaluate most adnexal cysts. Most types of pelvic cyst pathology have characteristic findings that, when identified, can guide counseling and management decisions. For instance, simple cysts have thin walls, are uniformly hypoechoic, and show no blood flow on color Doppler. Endometriomas, on the other hand, demonstrate diffuse, low-level internal echoes on ultrasonography.
In parts 1 and 2 of this 4-part series on adnexal pathology, we presented images detailing common benign adnexal cysts, including:
- simple and hemorrhagic cysts (Part 1:Telltale sonographic features of simple and hemorrhagic cysts)
- and mature cystic teratomas (dermoid cysts) and endometriomas (Part 2: Imaging the endometrioma and mature cystic teratoma).
In this part 3, we detail imaging for hydrosalpinx and pelvic inclusion cysts. In part 4 we will consider cystadenomas and ovarian neoplasias.
hydrosalpinx
These cysts are caused by fimbrial obstruction and result in tubal distention with serous fluid. A hydrosalpinx may occur following an episode of salpingitis or pelvic surgery.
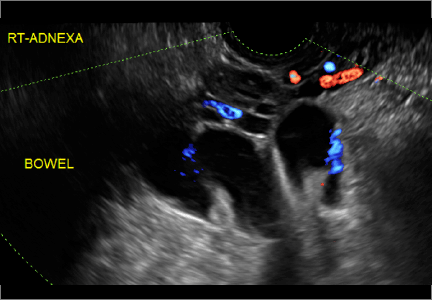
Sonographic features diagnostic for hydrosalpinx include a tubular or S-shaped cystic mass separate from the ovary, with:
- “beads on a string” or “cogwheel” appearance (small round nodules less than 3 mm in size that represent endosalpingeal folds when viewed in cross section)
- “waist sign” (indentations on opposite sides)
- incomplete septations, which result from segments of distended tube folding over/adhering to other tubal segments
Levine and colleagues noted that 3-dimensional imaging may be helpful when the diagnosis is uncertain.1
When a mass is noted that has features classic for hydrosalpinx, the Society of Radiologists in Ultrasound 2010 Consensus Conference Statement recommends1:
- no further imaging is necessary to establish the diagnosis
- frequency of follow-up imaging should be based on the patient’s age and clinical symptoms
In FIGURES 1 through 6 below (slides of image collections), we present 5 cases, including one of a 45-year-old patient presenting with chronic pelvic pain who was found to have bilateral hydrosalginges and right-sided tubo-ovarian complex.
pelvic inclusion cysts
Pelvic/peritoneal inclusion cysts, or peritoneal pseudocysts, are typically associated with factors that increase the risk for pelvic adhesive disease (including endometriosis, pelvic inflammatory disease, or prior pelvic surgery).
Classic sonographic features of pelvic inclusion cysts are:
- cystic mass, usually with septations/loculations
- the mass follows the contour of adjacent organs
- ovary at edge of the mass or sometimes suspended within it
- with or without flow in septation on color Doppler
When a mass is noted that has features classic for a peritoneal inclusion cyst, the US Society of Radiologists in Ultrasound recommends that1:
- no further imaging is necessary to establish the diagnosis (although further imaging may be needed if the diagnosis is uncertain)
- the frequency of follow-up imaging should be based on the patient’s age and clinical symptoms
In FIGURES 7 through 22 below (slides of image collections), we present several cases that demonstrate pelvic inclusion cysts on imaging. One case involves a 25-year-old patient presenting for 2- and 3-dimensional pelvic imaging due to infertility. She had a history of laparoscopic left ovarian cystectomy, right paratubal cystectomy, and lysis of adhesions. She was found to have a pelvic inclusion cyst and an endometrioma in the left ovary.
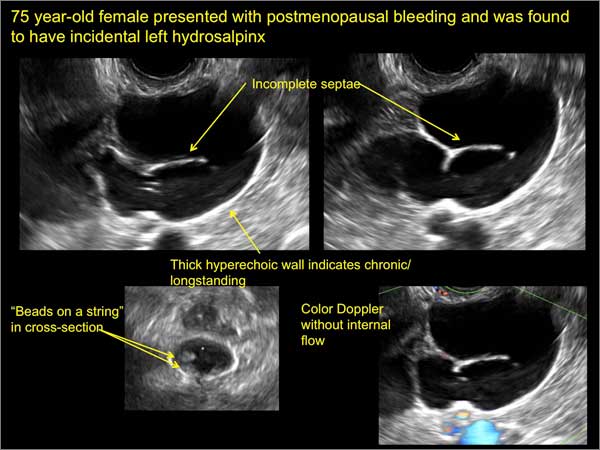
Figure 1
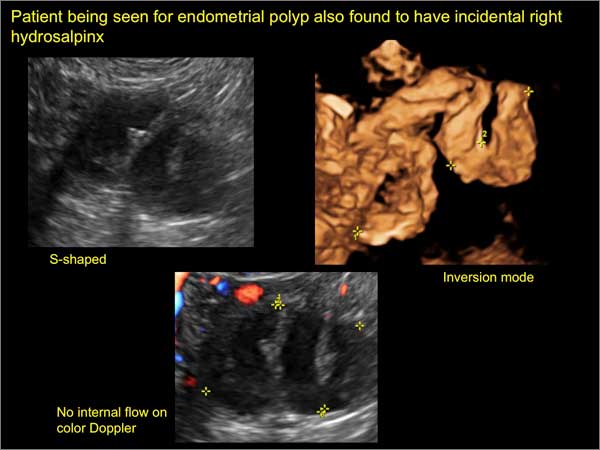
Figure 2
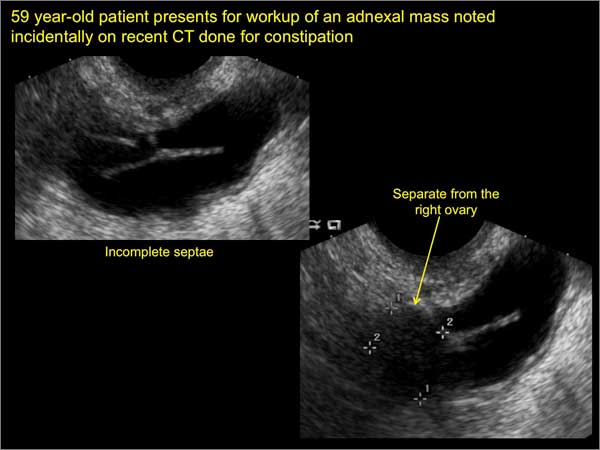
Figure 3
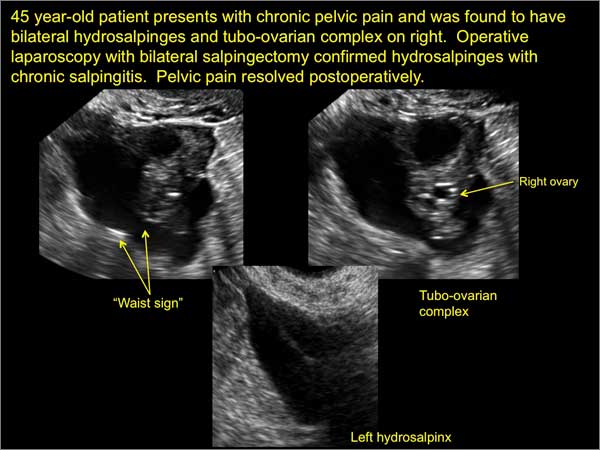
Figure 4
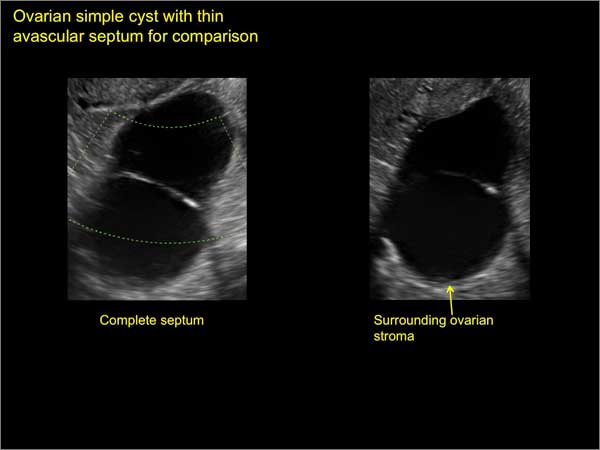
Figure 5
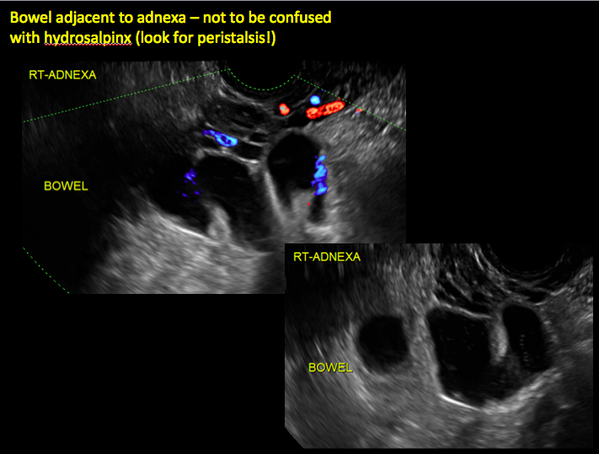
Figure 6
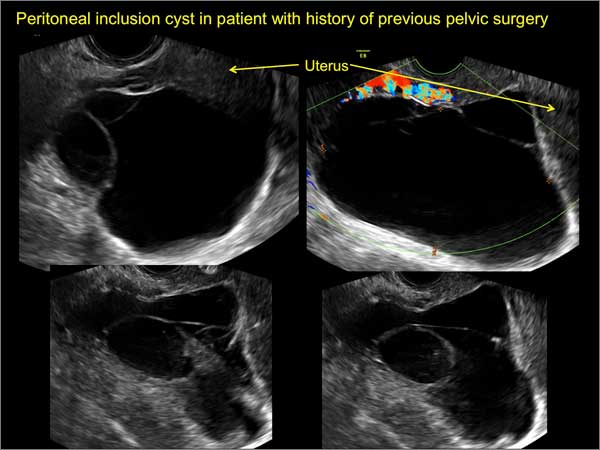
Figure 7
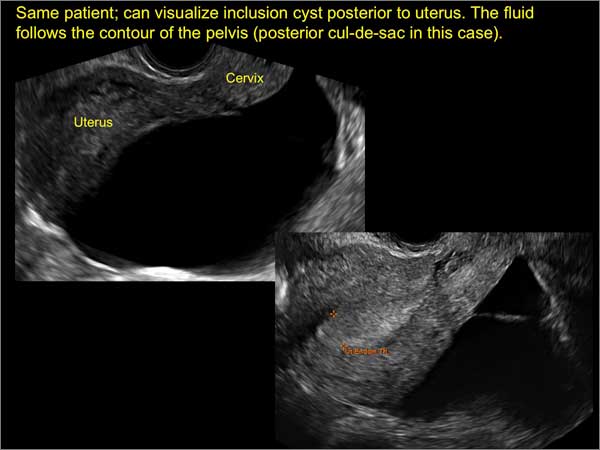
Figure 8
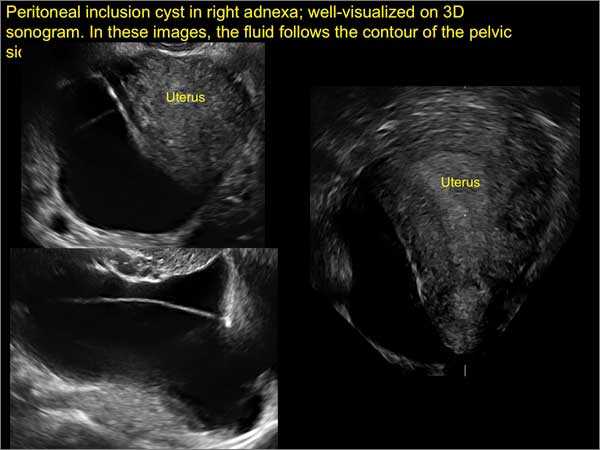
Figure 9
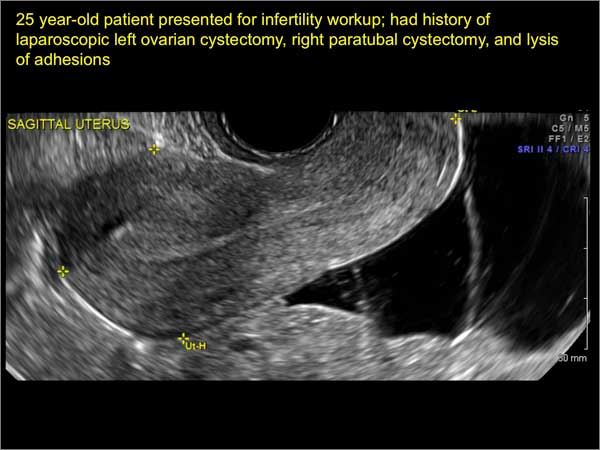
Figure 10
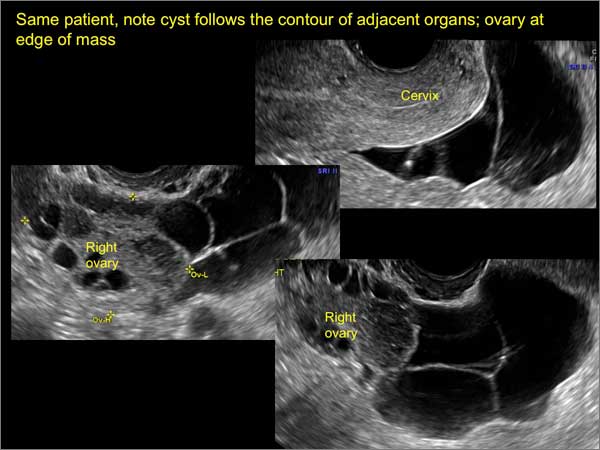
Figure 11
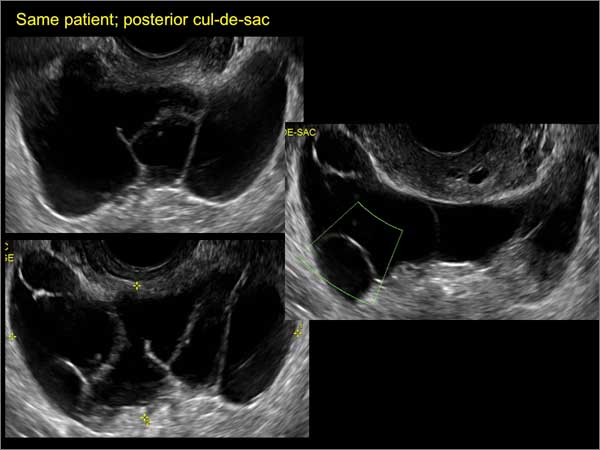
Figure 12
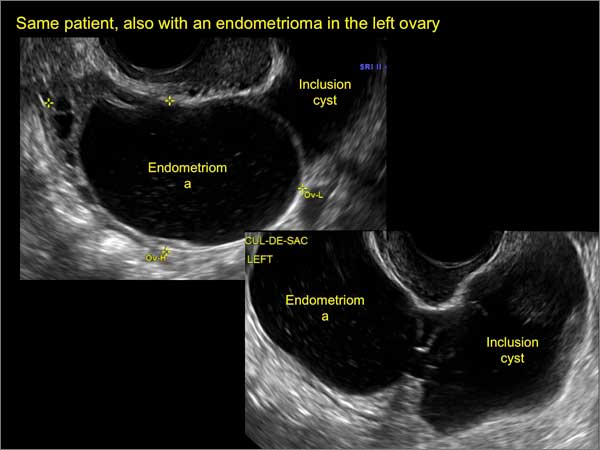
Figure 13
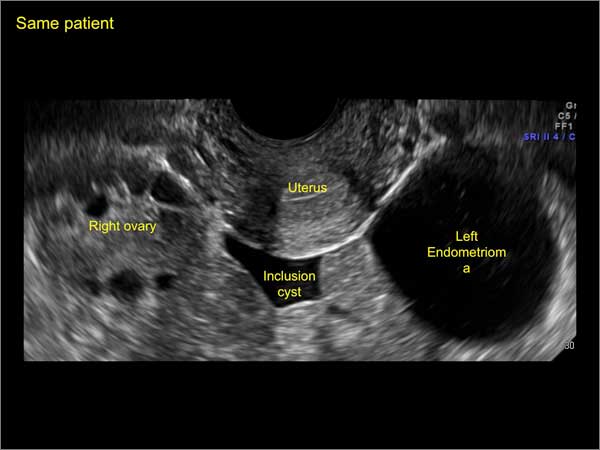
Figure 14
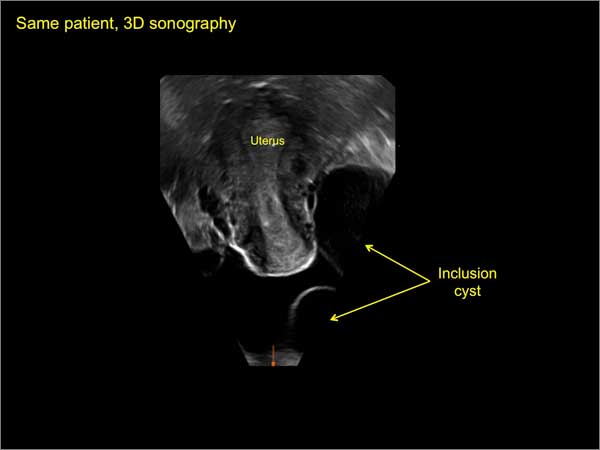
Figure 15
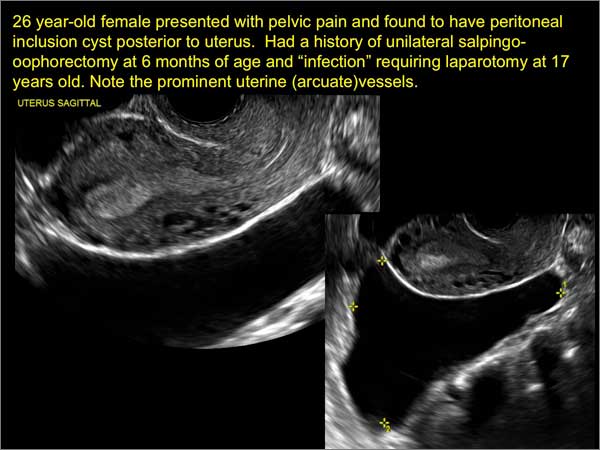
Figure 16
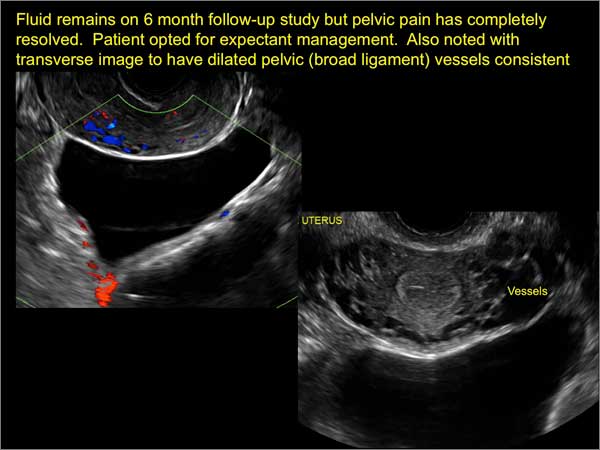
Figure 17
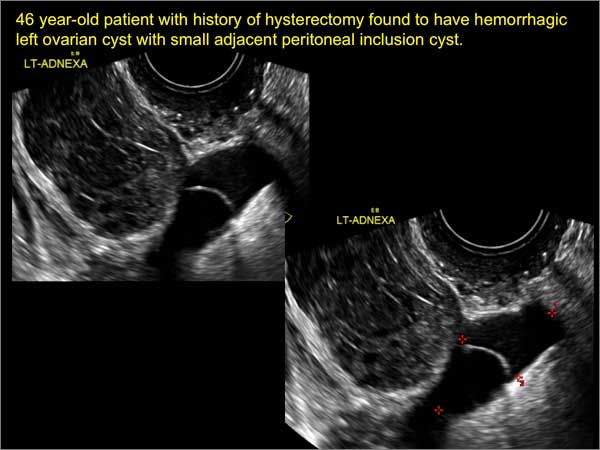
Figure 18
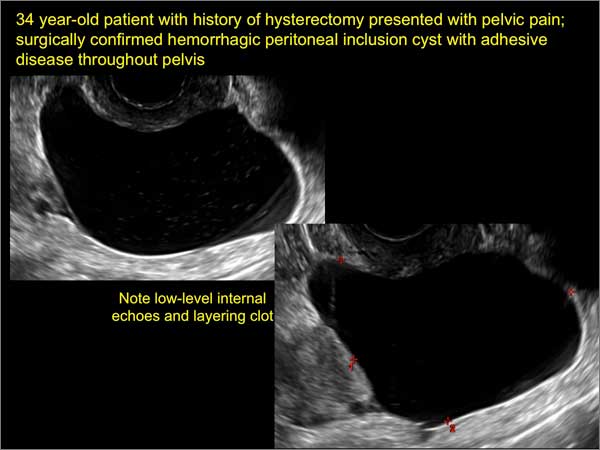
Figure 19
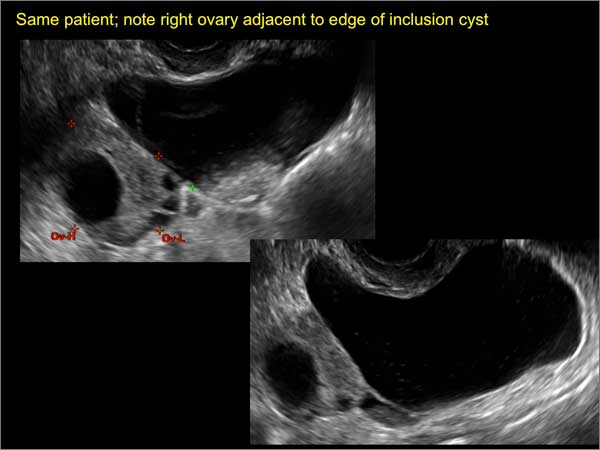
Figure 20
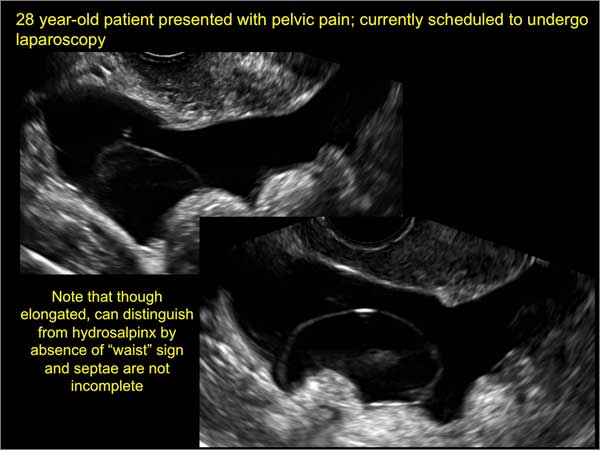
Figure 21
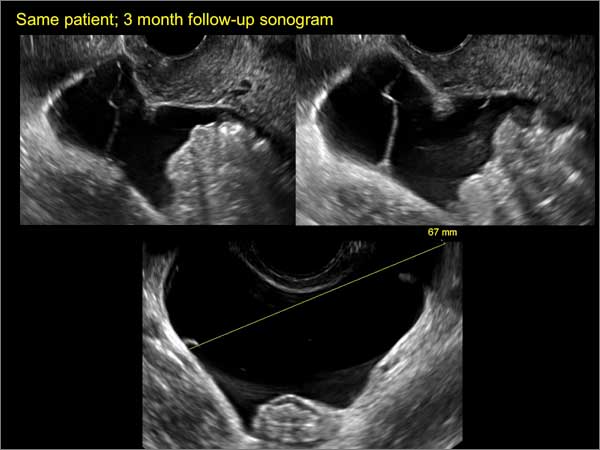
Figure 22
Reference
1. Levine D, Brown DL, Andreotti RF, et al. Management of asymptomatic ovarian and other adnexal cysts imaged at US Society of Radiologists in Ultrasound consensus conference statement. Ultrasound Q. 2010;26(3):121−131.
Michelle Stalnaker Ozcan, MD, and Andrew M. Kaunitz, MD
Dr. Ozcan is Assistant Professor and Associate Program Director, Obstetrics and Gynecology Residency, Department of Obstetrics and Gynecology, at the University of Florida College of Medicine–Jacksonville.

Dr. Kaunitz is University of Florida Research Foundation Professor and Associate Chairman, Department of Obstetrics and Gynecology, at the University of Florida College of Medicine–Jacksonville. Dr. Kaunitz serves on the OBG Management Board of Editors.
The authors report no financial relationships relevant to this article.
Michelle Stalnaker Ozcan, MD, and Andrew M. Kaunitz, MD
Dr. Ozcan is Assistant Professor and Associate Program Director, Obstetrics and Gynecology Residency, Department of Obstetrics and Gynecology, at the University of Florida College of Medicine–Jacksonville.
Dr. Kaunitz is University of Florida Research Foundation Professor and Associate Chairman, Department of Obstetrics and Gynecology, at the University of Florida College of Medicine–Jacksonville. Dr. Kaunitz serves on the OBG Management Board of Editors.
The authors report no financial relationships relevant to this article.
Ultrasonography is the preferred imaging method to evaluate most adnexal cysts. Most types of pelvic cyst pathology have characteristic findings that, when identified, can guide counseling and management decisions. For instance, simple cysts have thin walls, are uniformly hypoechoic, and show no blood flow on color Doppler. Endometriomas, on the other hand, demonstrate diffuse, low-level internal echoes on ultrasonography.
In parts 1 and 2 of this 4-part series on adnexal pathology, we presented images detailing common benign adnexal cysts, including:
- simple and hemorrhagic cysts (Part 1:Telltale sonographic features of simple and hemorrhagic cysts)
- and mature cystic teratomas (dermoid cysts) and endometriomas (Part 2: Imaging the endometrioma and mature cystic teratoma).
In this part 3, we detail imaging for hydrosalpinx and pelvic inclusion cysts. In part 4 we will consider cystadenomas and ovarian neoplasias.
hydrosalpinx
These cysts are caused by fimbrial obstruction and result in tubal distention with serous fluid. A hydrosalpinx may occur following an episode of salpingitis or pelvic surgery.
Sonographic features diagnostic for hydrosalpinx include a tubular or S-shaped cystic mass separate from the ovary, with:
- “beads on a string” or “cogwheel” appearance (small round nodules less than 3 mm in size that represent endosalpingeal folds when viewed in cross section)
- “waist sign” (indentations on opposite sides)
- incomplete septations, which result from segments of distended tube folding over/adhering to other tubal segments
Levine and colleagues noted that 3-dimensional imaging may be helpful when the diagnosis is uncertain.1
When a mass is noted that has features classic for hydrosalpinx, the Society of Radiologists in Ultrasound 2010 Consensus Conference Statement recommends1:
- no further imaging is necessary to establish the diagnosis
- frequency of follow-up imaging should be based on the patient’s age and clinical symptoms
In FIGURES 1 through 6 below (slides of image collections), we present 5 cases, including one of a 45-year-old patient presenting with chronic pelvic pain who was found to have bilateral hydrosalginges and right-sided tubo-ovarian complex.
pelvic inclusion cysts
Pelvic/peritoneal inclusion cysts, or peritoneal pseudocysts, are typically associated with factors that increase the risk for pelvic adhesive disease (including endometriosis, pelvic inflammatory disease, or prior pelvic surgery).
Classic sonographic features of pelvic inclusion cysts are:
- cystic mass, usually with septations/loculations
- the mass follows the contour of adjacent organs
- ovary at edge of the mass or sometimes suspended within it
- with or without flow in septation on color Doppler
When a mass is noted that has features classic for a peritoneal inclusion cyst, the US Society of Radiologists in Ultrasound recommends that1:
- no further imaging is necessary to establish the diagnosis (although further imaging may be needed if the diagnosis is uncertain)
- the frequency of follow-up imaging should be based on the patient’s age and clinical symptoms
In FIGURES 7 through 22 below (slides of image collections), we present several cases that demonstrate pelvic inclusion cysts on imaging. One case involves a 25-year-old patient presenting for 2- and 3-dimensional pelvic imaging due to infertility. She had a history of laparoscopic left ovarian cystectomy, right paratubal cystectomy, and lysis of adhesions. She was found to have a pelvic inclusion cyst and an endometrioma in the left ovary.
Figure 1
Figure 2
Figure 3
Figure 4
Figure 5
Figure 6
Figure 7
Figure 8
Figure 9
Figure 10
Figure 11
Figure 12
Figure 13
Figure 14
Figure 15
Figure 16
Figure 17
Figure 18
Figure 19
Figure 20
Figure 21
Figure 22
Reference
1. Levine D, Brown DL, Andreotti RF, et al. Management of asymptomatic ovarian and other adnexal cysts imaged at US Society of Radiologists in Ultrasound consensus conference statement. Ultrasound Q. 2010;26(3):121−131.
Reference
1. Levine D, Brown DL, Andreotti RF, et al. Management of asymptomatic ovarian and other adnexal cysts imaged at US Society of Radiologists in Ultrasound consensus conference statement. Ultrasound Q. 2010;26(3):121−131.
Endovascular stents effective for iliofemoral obstructions in patients with PTS
Endovascular stenting is a safe and effective way to treat iliofemoral obstructions in patients with postthrombotic syndrome, according to Dr. M. Yin of Shanghai (China) JiaoTong University, and associates.
The stenting process was achieved without major complications in 95% of cases. Cumulative primary, assisted primary, and secondary patency rates after 3 years were 69%, 79%, and 92%, respectively. Patients with severe postthrombotic syndrome (PTS) saw a significant drop in their Villalta score, compared with patients treated with elastic compression stockings (ECS) therapy, though scores were similar in patients with moderate PTS in both groups. The 24-month recurrence-free ulcer healing rate was significantly higher in the stenting group (87% vs. 71%).
“ECS therapy shows equal clinical effects with stent placement in patients with moderate PTS,” but the stented patients did not have to wear stockings after the procedure, the researchers wrote.
Find the full study in the European Journal of Vascular & Endovascular Surgery (doi: 10.1016/j.ejvs.2015.03.029).
NICE advises on how to maintain, achieve healthy weight
The National Institute for Health and Care Excellence (NICE) has issued a new guideline on maintaining a healthy weight and preventing excess weight gain.
This guideline replaces section 1.1.1 of NICE’s guideline on obesity, CG43 (2006).

The guideline, for those who educate people on how to maintain a healthy weight or prevent excess weight gain, comprises the following recommendations:
• Encourage people to make changes in line with existing advice.
• Encourage physical activity habits to avoid low energy expenditure.
• Encourage dietary habits that reduce the risk of excess energy intake.
• Provide further advice for parents and carers of children and young people.
• Encourage adults to limit the amount of alcohol they drink.
• Encourage self-monitoring.
• Clearly communicate the benefits of maintaining a healthy weight.
• Clearly communicate the benefits of gradual improvements to physical activity and dietary habits.
• Tailor messages for specific groups.
• Ensure activities are integrated with the local strategic approach to obesity.
The National Institute for Health and Care Excellence (NICE) has issued a new guideline on maintaining a healthy weight and preventing excess weight gain.
This guideline replaces section 1.1.1 of NICE’s guideline on obesity, CG43 (2006).
The guideline, for those who educate people on how to maintain a healthy weight or prevent excess weight gain, comprises the following recommendations:
• Encourage people to make changes in line with existing advice.
• Encourage physical activity habits to avoid low energy expenditure.
• Encourage dietary habits that reduce the risk of excess energy intake.
• Provide further advice for parents and carers of children and young people.
• Encourage adults to limit the amount of alcohol they drink.
• Encourage self-monitoring.
• Clearly communicate the benefits of maintaining a healthy weight.
• Clearly communicate the benefits of gradual improvements to physical activity and dietary habits.
• Tailor messages for specific groups.
• Ensure activities are integrated with the local strategic approach to obesity.

Esophagogastric cancer chemotherapy commonly causes VTE
Venous thromboembolism is common in patients undergoing oxaliplatin, capecitabine, and epirubicin chemotherapy for esophagogastric cancer, according to Dr. Anders Christian Larsen of Aalborg (Denmark) University Hospital and associates.
There were 21 cases of VTE among the 129 patients with esophagogastric cancer, a rate of 16%. Of the VTE cases, 14 were asymptomatic and 7 were symptomatic. Gastric cancer and late-stage cancer were significant VTE risk factors, with odds ratios of 6.4 and 5.2, respectively. The median survival time was 18 months in non-VTE patients and 14 months in VTE patients.
“The extent of treatment-related VTE in upper GI cancer patients (with active cancer) receiving both chemotherapy and curative intended surgery may be greater than previously estimated. … Our data demonstrate the need to address this clinical problem with randomized clinical trials on VTE prophylaxis, particularly in patients undergoing neoadjuvant chemotherapy for resectable cancer disease,” the investigators concluded.
The authors said that there were no conflicts; the study was funded by private foundations.
Find the full study in Thrombosis Research.
NICE recommends rivaroxaban for acute coronary syndrome
Rivaroxaban has been recommended by the U.K. National Institute for Health and Care Excellence (NICE) as a treatment option for prevention of blood clots in adults who have had acute coronary syndrome with elevated cardiac biomarkers, the agency announced in a statement.
NICE officials recommended rivaroxaban (Xarelto), in combination with aspirin plus clopidogrel or aspirin alone, as an option for preventing atherothrombotic events in patients who have had a heart attack. Assessment of clinical-effectiveness evidence was based on data from an international, multicenter, randomized controlled trial. An independent appraisal committee considered clinical and cost-effectiveness evidence before making the recommendation.
Rivaroxaban, manufactured by Bayer and marketed by Janssen Pharmaceuticals, is an orally active direct factor Xa inhibitor.
Clinicians should regularly reassess the benefits and risks of continuing treatment with rivaroxaban, the agency recommended, and a decision on continuation of treatment should be made no later than 12 months after starting treatment.
Read the full guideline statement here.