User login
Defining Patient Experience: 'Everything We Say and Do'
Editor’s note: “Everything We Say and Do” is an informational series developed by SHM’s Patient Experience Committee to provide readers with thoughtful and actionable communication tactics that have great potential to positively impact patients’ experience of care. Each article will focus on how the contributor applies one ormore of the “key communication” tactics in practice to maintain provider accountability for “Everything we say and do that affects our patients’ thoughts, feelings and well-being.”
As providers, how do we define the patient experience? Over the past year, I have had the pleasure of working with a dedicated group of 15 fellow members on the newly formed SHM Patient Experience Committee. One of our first goals was to define the patient experience in a way that acknowledges our role and its potential impact on patients as emotional beings and not just vessels for their disease.

To this end, we define the patient experience as “everything we say and do that affects our patients’ thoughts, feelings, and well-being.
Although it’s true that patients bring with them their own history and narrative that contribute to their experience, we cannot change that. We can only adjust our own behaviors and actions when we seek to elicit or respond to patients’ concerns and goals.
And although “everything we say and do” is inclusive of providing the most effective and evidence-based medical care at all times, we believe that accurate clinical decision making absolutely must be accompanied by superior communication. By offering clear explanations, listening compassionately, and acknowledging patients’ predicaments with empathy and caring statements, we can restore a degree of humanity to our care that will allow patients to trust that we have their best interests in mind at all times. This is our role in improving the patient experience.
Beginning next month, members of the Patient Experience Committee will be sharing key communication skills and interventions that each of us believes to be important and effective. Each member will share what they do, why they do it, and how it can be done effectively. The items we’ll be focusing on will be taken from the “Core Principles” and “Key Communications,” as compiled by the committee (see Table 1, below). Some have evidence to back them up. Some are common sense. All of them are simply the right thing to do.
We hope you’ll reflect on “everything we say and do” each month as well as share it with your colleagues and teams. And we need look no further for a winning argument to focus on the patient experience than Sir William Osler and one of his most famous quotes: “The good physician treats the disease; the great physician treats the patient who has the disease.”
We’re going for great. Are you with us? TH
Dr. Rudolph is vice president of physician development and patient experience for Tacoma, Wash.–based Sound Physicians. He is chair of SHM’s Patient Experience Committee.
Table 1.

Editor’s note: “Everything We Say and Do” is an informational series developed by SHM’s Patient Experience Committee to provide readers with thoughtful and actionable communication tactics that have great potential to positively impact patients’ experience of care. Each article will focus on how the contributor applies one ormore of the “key communication” tactics in practice to maintain provider accountability for “Everything we say and do that affects our patients’ thoughts, feelings and well-being.”
As providers, how do we define the patient experience? Over the past year, I have had the pleasure of working with a dedicated group of 15 fellow members on the newly formed SHM Patient Experience Committee. One of our first goals was to define the patient experience in a way that acknowledges our role and its potential impact on patients as emotional beings and not just vessels for their disease.
To this end, we define the patient experience as “everything we say and do that affects our patients’ thoughts, feelings, and well-being.
Although it’s true that patients bring with them their own history and narrative that contribute to their experience, we cannot change that. We can only adjust our own behaviors and actions when we seek to elicit or respond to patients’ concerns and goals.
And although “everything we say and do” is inclusive of providing the most effective and evidence-based medical care at all times, we believe that accurate clinical decision making absolutely must be accompanied by superior communication. By offering clear explanations, listening compassionately, and acknowledging patients’ predicaments with empathy and caring statements, we can restore a degree of humanity to our care that will allow patients to trust that we have their best interests in mind at all times. This is our role in improving the patient experience.
Beginning next month, members of the Patient Experience Committee will be sharing key communication skills and interventions that each of us believes to be important and effective. Each member will share what they do, why they do it, and how it can be done effectively. The items we’ll be focusing on will be taken from the “Core Principles” and “Key Communications,” as compiled by the committee (see Table 1, below). Some have evidence to back them up. Some are common sense. All of them are simply the right thing to do.
We hope you’ll reflect on “everything we say and do” each month as well as share it with your colleagues and teams. And we need look no further for a winning argument to focus on the patient experience than Sir William Osler and one of his most famous quotes: “The good physician treats the disease; the great physician treats the patient who has the disease.”
We’re going for great. Are you with us? TH
Dr. Rudolph is vice president of physician development and patient experience for Tacoma, Wash.–based Sound Physicians. He is chair of SHM’s Patient Experience Committee.
Table 1.
Novel Intraoperative Technique to Visualize the Lower Cervical Spine: A Case Series
Two adequate views of the lower cervical vertebrae are necessary to confirm the 3-dimensional location of any hardware placed during cervical spine fusion. Visualizing the lower cervical vertebrae in 2 planes intraoperatively is often a challenge because the shoulders obstruct the lateral view.1 Techniques have been described to improve lateral visualization, including gentle traction of the arms via wrist restraints or taping the shoulders down inferiorly.2,3 These techniques have their inadequacies, including an association with peripheral nerve injury and brachial plexopathy.4 In patients with stout necks, these methods may still be insufficient to achieve adequate visualization of the lower cervical vertebrae.
Invasive techniques to improve visualization have also been described. In 1 study, exposure had to be extended cephalad to allow for manual counting of cervical vertebrae when the mid- to lower cervical vertebrae had to be identified in a morbidly obese patient.5 More invasive spine procedures are associated with higher rates of complications, increased blood loss, more soft-tissue trauma, and longer hospital stays.6 We present a view 30º oblique from horizontal and 30º cephalad from neutral as a variation of the lateral radiograph that improves visualization of the mid- to lower cervical vertebrae. The authors have obtained the patients’ informed written consent for print and electronic publication of these case reports.
Technique
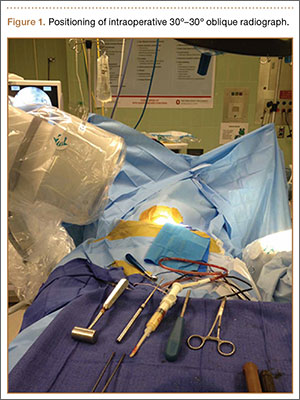
We used either the Smith-Robinson or Cloward approach to the anterior spine. Both techniques use the avascular plane between the medially located esophagus and trachea and the lateral sternocleidomastoid and carotid sheath to approach the anterior cervical spine. Once adequate exposure was achieved, standard anteroposterior and lateral radiographs were obtained to confirm the correct vertebral level. Gentle caudal traction was applied to the patient’s wrist straps, and when visualization continued to be compromised, a view 30º oblique from horizontal and 30º cephalad from neutral was obtained (Figure 1).
Case Series
Case 1
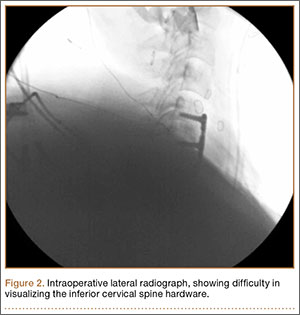
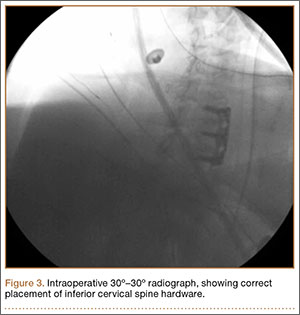
A 54-year-old man with a body mass index (BMI) of 50 presented with neck and bilateral arm pain, with left greater than right radicular symptoms in the C6 and C7 distribution. Magnetic resonance imaging (MRI) showed disc herniations at C5-C6 and C6-C7 with spinal cord signal changes, and he underwent a C5-C6 and C6-C7 anterior cervical discectomy and fusion. Initial localization was determined using a lateral radiograph and vertebral needle. During hardware placement, anteroposterior and lateral fluoroscopic radiographs confirmed adequate placement of the superior screw, but visualization of the inferior portion of the plate and inferior screw was challenging (Figure 2). Our oblique 30º–30º view provided better visualization of the plate and screws in the lower cervical vertebrae than lateral imaging, and allowed confirmation that the hardware was positioned correctly (Figure 3). It took 1 attempt to achieve adequate visualization with the 30º–30º view.
Postoperatively, the patient’s radiculopathy and motor weakness improved. Radiographs confirmed adequate hardware placement, and he was discharged on postoperative day 1 (Figure 4). Imaging at the patient’s 6-week follow-up confirmed adequate fusion from C5-C7, anatomically aligned facet joints, and no hardware failure. The patient’s Neck Disability Index was 31/50 preoperatively and 26/50 at this visit.

Case 2
A 51-year-old man with a BMI of 29 presented with a long-standing history of neck pain and bilateral arm pain left greater than right in the C6 and C7 dermomyotome. MRI showed a broad-based disc herniation with foraminal narrowing at C5-C6 and C6-C7, and the patient underwent a 2-level anterior cervical discectomy and fusion. This patient had pronounced neck musculature, and a deeper than normal incision was required.
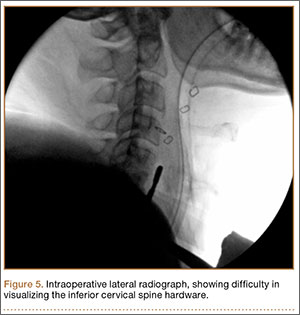
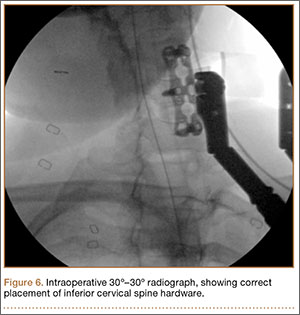
Intraoperative lateral fluoroscopy was obtained to confirm the C5-C6 and C6-C7 level prior to discectomy. The musculature of the patient’s neck and shoulder made visualization of the C6-C7 disc space difficult on the lateral radiograph (Figure 5). One attempt was required to obtain the 30º–30º oblique view, which was used to ensure correct placement of the screws and plate (Figure 6).
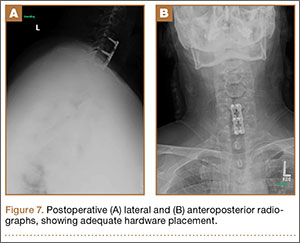
Postoperatively, the patient’s pain had improved, and radiographs confirmed adequate hardware placement. He was discharged 1 day after surgery (Figure 7). Imaging at the patient’s 6-week follow-up confirmed adequate fusion from C5-C7, stable disc spaces, and anatomically aligned facet joints. His Neck Disability Index was 34/50 preoperatively and 32/50 at 2-week follow-up.
Discussion
The aim of this study was to describe an alternative to the lateral radiograph for imaging the cervical spine in patients with challenging anatomy or in procedures involving hardware placement at the lower cervical vertebrae. Techniques have been developed to assist with improved lateral visualization, including gentle traction of the arms via wrist restraints or taping the shoulders down inferiorly.2,3 However, visualization in 2 planes continues to be a challenge in a subset of patients. It is particularly difficult to obtain adequate lateral radiographs of the cervical spine in patients with stout necks.3 In patients with stout necks, there is more obstruction of the radiography path through the cervical spine. This leads to imaging that is unclear or may fail to show the mid- to lower cervical spine. The extent to which one should rely on the 30º–30º oblique technique for adequate visualization of the cervical spine depends on the anatomy of a particular patient. Historically, it is more challenging to obtain satisfactory lateral radiographs in patients with stout necks,3 and these patients have benefited the most from using the 30º–30º degree oblique view.
Lack of visualization can lead to aborted surgeries or, potentially, surgery at the wrong level.3 A 2008 American Academy of Neurological Surgeons survey indicated that 50% of spine surgeons had performed a wrong-level surgery at least once in their career, and the cervical spine accounted for 21% of all incorrect-level spine surgeries.7 Intraoperative factors reported during cases of wrong-level spinal surgeries included misinterpretation of intraoperative imaging, no intraoperative imaging, and unusual anatomy or physical characteristics.8 Such complications can lead to revision surgery and other significant morbidities for the patient.
In most patients, fluoroscopy allows confirmation of the correct level before disc incision.3 However, operating at a lower cervical level in a patient with a short neck or prominent shoulders poses a significant problem.3 A case report from Singh and colleagues9 described a modified intraoperative fluoroscopic view for spinal level localization at cervicothoracic levels. Their method focuses on identifying the bony lamina and using them as landmarks to count spinal levels, whereas our 30º–30º oblique image is useful for confirmation of adequate hardware placement during anterior cervical spinal fusions. Often, the initial localization of cervical vertebral levels can be achieved with a standard lateral radiograph. We recognized the utility of the 30º–30º oblique view when we were attempting to visualize the inferior aspect of the plate and inferior screw placement.
In patients with stout necks, a lateral radiograph may show only visualization down to C4 or C5.3 Even with applying traction to the arms or taping the shoulders down, it can be impossible to visualize C6, C7, or T1 because the shoulder bones and muscles obstruct the image.3 Using a 30º–30º oblique view, we were able to obtain adequate visualization and assess the accurate placement of hardware.
Conclusion
A 30º oblique view from horizontal and 30º cephalad from neutral radiograph can be used intraoperatively in patients with challenging anatomy to identify placement of hardware at the correct vertebral level in the lower cervical spine. It is a noninvasive technique that can help reduce the risk of wrong-site surgeries without prolonging operation time. This technique describes an alternative to the lateral radiograph and provides a solution to the difficult problem of intraoperative imaging of the mid- to lower cervical spine in 2 adequate planes.
1. Bebawy JF, Koht A, Mirkovic S. Anterior cervical spine surgery. In: Khot A, Sloan TB, Toleikis JR, eds. Monitoring the Nervous System for Anesthesiologists and Other Health Care Professionals. New York, NY: Springer; 2012:539-554.
2. Abumi K, Shono Y, Ito M, Taneichi H, Kotani Y, Kaneda K. Complications of pedicle screw fixation in reconstructive surgery of the cervical spine. Spine. 2000;25(8):962-969.
3. Irace C. Intraoperative imaging for verification of the correct level during spinal surgery. In: Fountas KN, ed. Novel Frontiers of Advanced Neuroimaging. Rijeka, Croatia: Intech; 2013:175-188.
4. Schwartz DM, Sestokas AK, Hilibrand AS, et al. Neurophysiological identification of position-induced neurologic injury during anterior cervical spine surgery. J Clin Monit Comput. 2006;20(6):437-444.
5. Telfeian AE, Reiter GT, Durham SR, Marcotte P. Spine surgery in morbidly obese patients. J Neurosurg Spine. 2002;97(1):20-24.
6. Oppenheimer JH, DeCastro I, McDonnell DE. Minimally invasive spine technology and minimally invasive spine surgery: a historical review. Neurosurg Focus. 2009;27(3):E9.
7. Mody MG, Nourbakhsh A, Stahl DL, Gibbs M, Alfawareh M, Garges KJ. The prevalence of wrong level surgery among spine surgeons. Spine. 2008;33(2):194.
8. Jhawar BS, Mitsis D, Duggal N. Wrong-sided and wrong-level neurosurgery: A national survey. J Neurosurg Spine. 2007;7(5):467-472.
9. Singh H, Meyer SA, Hecht AC, Jenkins AL 3rd. Novel fluoroscopic technique for localization at cervicothoracic levels. J Spinal Disord Tech. 2009;22(8):615-618.
Two adequate views of the lower cervical vertebrae are necessary to confirm the 3-dimensional location of any hardware placed during cervical spine fusion. Visualizing the lower cervical vertebrae in 2 planes intraoperatively is often a challenge because the shoulders obstruct the lateral view.1 Techniques have been described to improve lateral visualization, including gentle traction of the arms via wrist restraints or taping the shoulders down inferiorly.2,3 These techniques have their inadequacies, including an association with peripheral nerve injury and brachial plexopathy.4 In patients with stout necks, these methods may still be insufficient to achieve adequate visualization of the lower cervical vertebrae.
Invasive techniques to improve visualization have also been described. In 1 study, exposure had to be extended cephalad to allow for manual counting of cervical vertebrae when the mid- to lower cervical vertebrae had to be identified in a morbidly obese patient.5 More invasive spine procedures are associated with higher rates of complications, increased blood loss, more soft-tissue trauma, and longer hospital stays.6 We present a view 30º oblique from horizontal and 30º cephalad from neutral as a variation of the lateral radiograph that improves visualization of the mid- to lower cervical vertebrae. The authors have obtained the patients’ informed written consent for print and electronic publication of these case reports.
Technique
We used either the Smith-Robinson or Cloward approach to the anterior spine. Both techniques use the avascular plane between the medially located esophagus and trachea and the lateral sternocleidomastoid and carotid sheath to approach the anterior cervical spine. Once adequate exposure was achieved, standard anteroposterior and lateral radiographs were obtained to confirm the correct vertebral level. Gentle caudal traction was applied to the patient’s wrist straps, and when visualization continued to be compromised, a view 30º oblique from horizontal and 30º cephalad from neutral was obtained (Figure 1).
Case Series
Case 1
A 54-year-old man with a body mass index (BMI) of 50 presented with neck and bilateral arm pain, with left greater than right radicular symptoms in the C6 and C7 distribution. Magnetic resonance imaging (MRI) showed disc herniations at C5-C6 and C6-C7 with spinal cord signal changes, and he underwent a C5-C6 and C6-C7 anterior cervical discectomy and fusion. Initial localization was determined using a lateral radiograph and vertebral needle. During hardware placement, anteroposterior and lateral fluoroscopic radiographs confirmed adequate placement of the superior screw, but visualization of the inferior portion of the plate and inferior screw was challenging (Figure 2). Our oblique 30º–30º view provided better visualization of the plate and screws in the lower cervical vertebrae than lateral imaging, and allowed confirmation that the hardware was positioned correctly (Figure 3). It took 1 attempt to achieve adequate visualization with the 30º–30º view.
Postoperatively, the patient’s radiculopathy and motor weakness improved. Radiographs confirmed adequate hardware placement, and he was discharged on postoperative day 1 (Figure 4). Imaging at the patient’s 6-week follow-up confirmed adequate fusion from C5-C7, anatomically aligned facet joints, and no hardware failure. The patient’s Neck Disability Index was 31/50 preoperatively and 26/50 at this visit.
Case 2
A 51-year-old man with a BMI of 29 presented with a long-standing history of neck pain and bilateral arm pain left greater than right in the C6 and C7 dermomyotome. MRI showed a broad-based disc herniation with foraminal narrowing at C5-C6 and C6-C7, and the patient underwent a 2-level anterior cervical discectomy and fusion. This patient had pronounced neck musculature, and a deeper than normal incision was required.
Intraoperative lateral fluoroscopy was obtained to confirm the C5-C6 and C6-C7 level prior to discectomy. The musculature of the patient’s neck and shoulder made visualization of the C6-C7 disc space difficult on the lateral radiograph (Figure 5). One attempt was required to obtain the 30º–30º oblique view, which was used to ensure correct placement of the screws and plate (Figure 6).
Postoperatively, the patient’s pain had improved, and radiographs confirmed adequate hardware placement. He was discharged 1 day after surgery (Figure 7). Imaging at the patient’s 6-week follow-up confirmed adequate fusion from C5-C7, stable disc spaces, and anatomically aligned facet joints. His Neck Disability Index was 34/50 preoperatively and 32/50 at 2-week follow-up.
Discussion
The aim of this study was to describe an alternative to the lateral radiograph for imaging the cervical spine in patients with challenging anatomy or in procedures involving hardware placement at the lower cervical vertebrae. Techniques have been developed to assist with improved lateral visualization, including gentle traction of the arms via wrist restraints or taping the shoulders down inferiorly.2,3 However, visualization in 2 planes continues to be a challenge in a subset of patients. It is particularly difficult to obtain adequate lateral radiographs of the cervical spine in patients with stout necks.3 In patients with stout necks, there is more obstruction of the radiography path through the cervical spine. This leads to imaging that is unclear or may fail to show the mid- to lower cervical spine. The extent to which one should rely on the 30º–30º oblique technique for adequate visualization of the cervical spine depends on the anatomy of a particular patient. Historically, it is more challenging to obtain satisfactory lateral radiographs in patients with stout necks,3 and these patients have benefited the most from using the 30º–30º degree oblique view.
Lack of visualization can lead to aborted surgeries or, potentially, surgery at the wrong level.3 A 2008 American Academy of Neurological Surgeons survey indicated that 50% of spine surgeons had performed a wrong-level surgery at least once in their career, and the cervical spine accounted for 21% of all incorrect-level spine surgeries.7 Intraoperative factors reported during cases of wrong-level spinal surgeries included misinterpretation of intraoperative imaging, no intraoperative imaging, and unusual anatomy or physical characteristics.8 Such complications can lead to revision surgery and other significant morbidities for the patient.
In most patients, fluoroscopy allows confirmation of the correct level before disc incision.3 However, operating at a lower cervical level in a patient with a short neck or prominent shoulders poses a significant problem.3 A case report from Singh and colleagues9 described a modified intraoperative fluoroscopic view for spinal level localization at cervicothoracic levels. Their method focuses on identifying the bony lamina and using them as landmarks to count spinal levels, whereas our 30º–30º oblique image is useful for confirmation of adequate hardware placement during anterior cervical spinal fusions. Often, the initial localization of cervical vertebral levels can be achieved with a standard lateral radiograph. We recognized the utility of the 30º–30º oblique view when we were attempting to visualize the inferior aspect of the plate and inferior screw placement.
In patients with stout necks, a lateral radiograph may show only visualization down to C4 or C5.3 Even with applying traction to the arms or taping the shoulders down, it can be impossible to visualize C6, C7, or T1 because the shoulder bones and muscles obstruct the image.3 Using a 30º–30º oblique view, we were able to obtain adequate visualization and assess the accurate placement of hardware.
Conclusion
A 30º oblique view from horizontal and 30º cephalad from neutral radiograph can be used intraoperatively in patients with challenging anatomy to identify placement of hardware at the correct vertebral level in the lower cervical spine. It is a noninvasive technique that can help reduce the risk of wrong-site surgeries without prolonging operation time. This technique describes an alternative to the lateral radiograph and provides a solution to the difficult problem of intraoperative imaging of the mid- to lower cervical spine in 2 adequate planes.
1. Bebawy JF, Koht A, Mirkovic S. Anterior cervical spine surgery. In: Khot A, Sloan TB, Toleikis JR, eds. Monitoring the Nervous System for Anesthesiologists and Other Health Care Professionals. New York, NY: Springer; 2012:539-554.
2. Abumi K, Shono Y, Ito M, Taneichi H, Kotani Y, Kaneda K. Complications of pedicle screw fixation in reconstructive surgery of the cervical spine. Spine. 2000;25(8):962-969.
3. Irace C. Intraoperative imaging for verification of the correct level during spinal surgery. In: Fountas KN, ed. Novel Frontiers of Advanced Neuroimaging. Rijeka, Croatia: Intech; 2013:175-188.
4. Schwartz DM, Sestokas AK, Hilibrand AS, et al. Neurophysiological identification of position-induced neurologic injury during anterior cervical spine surgery. J Clin Monit Comput. 2006;20(6):437-444.
5. Telfeian AE, Reiter GT, Durham SR, Marcotte P. Spine surgery in morbidly obese patients. J Neurosurg Spine. 2002;97(1):20-24.
6. Oppenheimer JH, DeCastro I, McDonnell DE. Minimally invasive spine technology and minimally invasive spine surgery: a historical review. Neurosurg Focus. 2009;27(3):E9.
7. Mody MG, Nourbakhsh A, Stahl DL, Gibbs M, Alfawareh M, Garges KJ. The prevalence of wrong level surgery among spine surgeons. Spine. 2008;33(2):194.
8. Jhawar BS, Mitsis D, Duggal N. Wrong-sided and wrong-level neurosurgery: A national survey. J Neurosurg Spine. 2007;7(5):467-472.
9. Singh H, Meyer SA, Hecht AC, Jenkins AL 3rd. Novel fluoroscopic technique for localization at cervicothoracic levels. J Spinal Disord Tech. 2009;22(8):615-618.
ISTH releases new clinical core curriculum
Image by Kevin MacKenzie
The International Society on Thrombosis and Haemostasis (ISTH) has announced its new international clinical core curriculum on thrombosis and hemostasis.
It is the first framework of its kind to define the minimum standards for a medical doctor to attain a level of proficiency to practice independently as a specialist in the field.
The core curriculum appears in the January 2016 issue of the Journal of Thrombosis and Haemostasis.
“Internationally, there is wide variation in how clinicians who work in thrombosis and hemostasis reach their final destination as recognized specialists,” said Claire McLintock, MD, of Auckland City Hospital in New Zealand.
“The ISTH clinical core curriculum serves to provide a framework for training of specialists in this field and to promote harmonization of training internationally.”
Dr McLintock noted that, prior to the development of the ISTH core curriculum, there was no international consensus on what constituted the requirements for a specialist in thrombosis and hemostasis in terms of clinical competencies.
In 2013, ISTH identified the need for an international clinical core curriculum and developed a working group consisting of specialists from around the world to address and draft a list of competencies.
ISTH members and the global thrombosis and hemostasis community were surveyed to rate the importance of the proposed competencies. The survey garnered more than 640 responses with broad geographical representation, which determined the ultimate framework for the new curriculum.
“We are pleased to release this exciting new resource for the global thrombosis and hemostasis community,” said Nigel Key, MD, of the UNC Hemophilia and Thrombosis Center in Chapel Hill, North Carolina.
“Our intent is for the core curriculum to serve as a common reference point for national and regional thrombosis and hemostasis societies to create or revise their own clinical training programs. Additionally, it can potentially be used as a framework for continuous professional development, maintenance of competence, and to inform future ISTH educational offerings.” ![]()
NHSBT offers more precise blood typing
Photo by Juan D. Alfonso
NHS Blood and Transplant (NHSBT) has announced an initiative to provide more detailed blood-group typing for patients with hemoglobinopathies, with the goal of enabling better-matched and potentially safer transfusions.
The typing will detect Rh variant blood groups, which need to be considered when planning transfusions.
Previously, typing to this level was only possible through reference laboratories using complex genotyping methods.
NHSBT is offering the testing at no extra cost to hospitals in England until the end of June 2016.
The initiative involves routinely testing for the RHD and RHCE variants most commonly found in patients with hemoglobinopathies. NHSBT will also test genes for the blood groups K, k, Kpa, Kpb, Jsa, Jsb, Jka, Jkb, Fya, Fyb, Fy (GATA), M, N, S, s, U, Doa, and Dob.
Unlike older methods, this testing can be performed in patients who have recently received blood.
NHSBT said this initiative will enable the creation of a database of genotyped blood details for patients with hemoglobinopathies.
Extended blood type information and fast access to the database could potentially enable safer blood transfusions for these patients, who may need numerous transfusions during their lifetime and may move between hospitals.
NHSBT said it has received more than 2500 blood samples thus far. The results are processed centrally by NHSBT at the International Blood Group Reference Laboratory in Filton and are securely stored.
Patients’ test results will be accessible to the teams involved in the patients’ care.
“Patients taking part can now potentially receive more finely matched blood if we know not just their blood group but whether they have a variant Rh type,” said Sara Trompeter, MB ChB, a consultant hematologist for NHSBT.
“And there will also be greater safety and likelihood of getting matched blood in an emergency, as their records will be held centrally and can be accessed by blood banks in local hospitals. We would urge all patients with hemoglobin disorders such as sickle cell disease or thalassemia to speak to their medical or nursing team about providing a blood sample to NHS Blood and Transplant via their local transfusion laboratories to be genotyped.”
Additional information on this initiative can be found at www.nhsbt.nhs.uk/extendedbloodgrouptesting. ![]()
Race plays role in Hodgkin lymphoma outcomes in kids
Photo courtesy of Sylvester
Comprehensive Cancer Center
In a retrospective study, young African American patients with Hodgkin lymphoma (HL) had inferior long-term overall survival when compared to their Hispanic and white peers.
Hispanic and white patients had similar rates of overall survival, but Hispanic males had inferior disease-specific survival compared to white males.
The study, published in Pediatric Blood & Cancer, is the largest yet on racial and ethnic disparity in the pediatric HL population in the US.
“Little was known about the association between race, ethnicity, and survival in the pediatric Hodgkin lymphoma population,” said Joseph Panoff, MD, of Sylvester Comprehensive Cancer Center at the University of Miami in Florida.
“Our study showed that African American children and teenagers had worse overall survival than whites and Hispanics at 25 years after diagnosis. We also found that Hispanic males had inferior disease-specific survival compared to white males.”
Dr Panoff and his colleagues analyzed data from more than 7800 patients listed in the Florida Cancer Data System (FCDS) and the National Institutes of Health’s Surveillance, Epidemiology, and End Results Program (SEER).
The patients were 0.1 to 21 years of age (average, 17 years) and were diagnosed with HL from 1981 to 2010.
In the FCDS cohort, which was significantly smaller than the SEER cohort (1778 vs 6027), African Americans had a 33% overall survival rate at 25 years, compared to 44.7% for Hispanics and 49.2% for whites (P=0.0005).
In a multivariate analysis, African American race was associated with inferior overall survival. The hazard ratio was 1.81 (P=0.0003).
Patients in the FCDS cohort had worse overall survival than patients in the SEER cohort, indicating that patients treated in Florida have worse outcomes when compared to the rest of the nation.
In the SEER cohort, the overall survival rate at 25 years was 74.2% for African Americans and 82% for both Hispanic and white patients (P=0.0005). Disease-specific survival rates at 25 years were 85.7% for African Americans, 88.1% for Hispanics, and 90.8% for whites (P=0.0002).
The researchers noted that Hispanic males had inferior disease-specific survival when compared to white males—84.8% and 90.6%, respectively (P=0.0478).
And Hispanic race was a predictor of inferior disease-specific survival in multivariate analysis. The hazard ratio was 1.238 (P<0.0001).
“Clearly, racial and ethnic disparities persist in the pediatric Hodgkin lymphoma population, despite modern treatment, particularly in Florida,” Dr Panoff noted. “The underlying causes of these disparities are complex and need further explanation.”
As a next step, Dr Panoff suggests identifying flaws in the diagnostic and treatment process with regard to African American and Hispanic patients.
“It is important to identify sociocultural factors and health behaviors that negatively affect overall survival in African American patients and disease-free survival in Hispanic males,” he said. “The fact that the entire Florida cohort seems to have worse overall survival than patients in the rest of the country is a new finding that requires further research.” ![]()
Team uncovers new info on hemangioblasts

Research published in PNAS has shed new light on the mechanism by which hemangioblasts become blood cells.
Hemangioblasts, which give rise to both hematopoietic and endothelial progenitors, have been identified in the embryos of chickens, mice, fish, and humans. It has also become clear that the cells are present in adult organisms.
However, the mechanism by which hemangioblasts differentiate into blood cells and vascular endothelia has remained a mystery in many aspects.
With that in mind, Makoto Kobayashi, PhD, of the University of Tsukuba in Japan, and his colleagues studied hemangioblasts in zebrafish.
The investigators looked for zebrafish mutants with defects in the hemangioblast expression of Gata1, which is not expressed in endothelial progenitors.
This revealed a mutant with downregulation of hematopoietic genes and upregulation of endothelial genes.
The team then identified the gene responsible for this mutant—LSD1. Additional experiments showed that LSD1 silences Etv2, a critical regulator of hemangioblast development.
The investigators said these results indicate that epigenetic silencing of Etv2 by LSD1 may be a significant event required for hemangioblasts to initiate hematopoietic differentiation. ![]()
Subcutaneous Tortuous Nodules on the Posterior Lower Extremity
The Diagnosis: Plexiform Neurofibroma as a Manifestation of Neurofibromatosis Type I
Physical examination revealed a large 10×8-cm subcutaneous nodule that was boggy and resembled a bag of worms on palpation. It was covered by slightly hyperpigmented skin. He also had numerous (>20) café au lait spots measuring 2 to 3 cm across the body and several others on the axillae. There were no gross eye findings. Otherwise the examination was unremarkable on the rest of the body. The patient’s paternal grandfather and aunt had similar macules and multiple nodules. The patient had mild to moderate learning difficulties. He was subsequently referred for genetic and ophthalmology evaluation.
Plexiform neurofibromas are usually benign nerve sheath tumors that are elongated and are multinodular, forming when the tumor involves either multiple trunks of a plexus or multiple fascicles of a large nerve such as the sciatic. Some plexiform neurofibromas resemble a bag of worms; others produce a massive ropy enlargement of the nerve.1,2 Plexiform neurofibromas are associated with cases of neurofibromatosis type I (NFI) and are themselves one of the diagnostic criteria for NFI.1
Plexiform neurofibromas are benign tumors that are the result of a genetic mutation in which loss of heterozygosity occurs, as is the case with the other predominant neoplasms of NFI, that results in unrestricted cell growth.3,4 Some patients have a loss of heterozygosity of this tumor suppression gene with overgrowth of neurofibromatosis on a Blaschko segment. One study in mouse models showed that stromal mast cells were involved in promoting inflammation and increasing tumor growth by mediation of mitogenic signals involved in vascular ingrowth, collagen deposition, and cellular proliferation.5 Plexiform neurofibromas are a presenting feature in 30% of NFI cases within the first year of life. They are extensive nerve sheath tumors with an unpredictable growth pattern that can involve multiple fascicles (ie, large nerves and their branches). Five percent become malignant and the transformation is often heralded by rapid growth and pain.6 If malignant transformation is suspected, biopsy is diagnostic. Magnetic resonance imaging with and without contrast can categorize them into 3 growth categories: superficial, displacing, and invasive.7 Because plexiform neurofibromas are rare tumors, it previously was common practice to delay surgical intervention until disfigurement or disability arose. Complete surgical resection at more advanced stages is nearly impossible given the networklike growth pattern that commonly encapsulates vital structures.8,9 Therefore, surgery has been used in the past for debulking the large growths that eventually will recur. A study of 9 small superficial plexiform neurofibromas in children aged 3 to 15 years documented treatment with early surgical resection, which showed complete resection and no relapse at 4 years. This study showed a promising strategy to prevent future extension of these fast-growing tumors into vital structures.8 There also are current clinical trials investigating sirolimus and peginterferon alfa-2b in patients with more invasive plexiform neurofibromas that are unable to undergo surgical resection due to encapsulation or proximity to essential anatomical structures (registered at www.clinicaltrials.gov with the identifiers NCT00652990 and NCT00678951, respectively).
Pain, development of a neurologic deficit, or enlargement of a preexisting plexiform neurofibroma may signal a malignant peripheral nerve sheath tumor (MPNST) and require immediate evaluation.10 Examination by magnetic resonance imaging and positron emission tomography is useful in distinguishing benign and MPNSTs,8,11,12 but definitive differentiation can only be made by histologic examination of the tumor. Complete surgical excision, when possible, is the only treatment that offers the possibility of cure of MPNSTs. Adjuvant chemotherapy or radiotherapy also is sometimes used, though benefit has not been clearly established.8,9,13,14
Death certificate and population-based studies have shown that approximately 10% of patients with NFI have a reduced life expectancy due to MPNSTs; indeed, these tumors arising from plexiform neurofibromas are the main cause of death in adults with NFI. In 2003, Mautner et al7 studied 50 individuals with NFI. The objective was to establish magnetic resonance imaging criteria for MPNST and to test their usefulness in detecting early malignant change in plexiform neurofibromas. This study found that MPNST in patients with NFI frequently showed inhomogeneous contrast enhancement. This inhomogeneity was due to necrosis and hemorrhage, as shown by macroscopic and histologic analysis of amputated limbs in 2 patients within the study. The investigators found it to be possible to detect malignant transformation at an early stage in patients with no overt clinical signs of progression.7 Careful follow-up will determine how frequently early malignancy can be detected and if it is worthwhile carrying out magnetic resonance imaging at defined intervals.2,7,10,15,16
- Friedman JM. Neurofibromatosis 1. In: Pagon RA, ed. GeneReviews. Seattle, WA: University of Washington, Seattle; 1993. http://www.ncbi.nlm.nih.gov/books/NBK1109/. Updated September 4, 2014. Accessed April 6, 2015.
- Friedman JM, Riccardi VM. Clinical epidemiological features. In: Friedman JM, Gutmann DH, MacCollin M, et al, eds. Neurofibromatosis: Phenotype, Natural History, and Pathogenesis. Baltimore, MD: Johns Hopkins University Press; 1999:29-86.
- Bausch B, Borozdin W, Mautner VF, et al; European-American Phaeochromocytoma Registry Study Group. Germline NF1 mutational spectra and loss-of-heterozygosity analyses in patients with phaeochromocytoma and neurofibromatosis type 1. J Clin Endocrinol Metab. 2007;92:2784-2792.
- Bottillo I, Ahlquist T, Brekke H, et al. Germline and somatic NF1 mutations in sporadic and NF1-associated malignant peripheral nerve sheath tumours. J Pathol. 2009;217:693-701.
- Staser K, Yang FC, Clapp DW. Pathogenesis of plexiform neurofibroma: tumor-stromal/hematopoietic interactions in tumor progression. Ann Rev Pathol. 2012;7:469-495.
- Murphey MD, Smith WS, Smith SE, et al. From the archives of the AFIP: imaging of musculoskeletal neurogenic tumors: radiologic-pathologic correlation. Radiographics. 1999;19:1253-1280.
- Mautner VF, Friedrich RE, von Deimling A, et al. Malignant peripheral nerve sheath tumours in neurofibromatosis type 1: MRI supports the diagnosis of malignant plexiform neurofibroma. Neuroradiology. 2003;45:618-625.
- Friedrich RE, Schmelzle R, Hartmann M, et al. Resection of small plexiform neurofibromas in neurofibromatosis type 1 children. World J Surg Oncol. 2005;3:6.
- Gottfried ON, Viskochil DH, Fults DW, et al. Molecular, genetic, and cellular pathogenesis of neurofibromas and surgical implications. Neurosurgery. 2006;58:1-16.
- Valeyrie-Allanore L, Ismaïli N, Bastuji-Garin S, et al. Symptoms associated with malignancy of peripheral nerve sheath tumours: a retrospective study of 69 patients with neurofibromatosis 1. Br J Dermatol. 2005;153:79-82.
- Bensaid B, Giammarile F, Mognetti T, et al. Utility of 18 FDG positron emission tomography in detection of sarcomatous transformation in neurofibromatosis type 1. Ann Dermatol Venereol. 2007;134:735-741.
- Ferner RE, Lucas JD, O’Doherty MJ, et al. Evaluation of (18)fluorodeoxyglucose positron emission tomography ((18)FDG PET) in the detection of malignant peripheral nerve sheath tumours arising from within plexiform neurofibromas in neurofibromatosis 1. J Neurol Neurosurg Psychiatry. 2000;68:3353-3357.
- Baujat B, Krastinova-Lolov D, Blumen M, et al. Radiofrequency in the treatment of craniofacial plexiform neurofibromatosis: a pilot study. Plast Reconstr Surg. 2006;117:1261-1268.
- Hummel T, Anyane-Yeboa A, Mo J, et al. Response of NF1-related plexiform neurofibroma to high-dose carboplatin. Pediatr Blood Cancer. 2011;56:488-490.
- Feldmann R, Schuierer G, Wessel A, et al. Development of MRI T2 hyperintensities and cognitive functioning in patients with neurofibromatosis type 1. Acta Paediatr. 2010;99:1657-1660.
- Blazo MA, Lewis RA, Chintagumpala MM, et al. Outcomes of systematic screening for optic pathway tumors in children with neurofibromatosis type 1. Am J Med Genet A. 2004;127A:224-229.
The Diagnosis: Plexiform Neurofibroma as a Manifestation of Neurofibromatosis Type I
Physical examination revealed a large 10×8-cm subcutaneous nodule that was boggy and resembled a bag of worms on palpation. It was covered by slightly hyperpigmented skin. He also had numerous (>20) café au lait spots measuring 2 to 3 cm across the body and several others on the axillae. There were no gross eye findings. Otherwise the examination was unremarkable on the rest of the body. The patient’s paternal grandfather and aunt had similar macules and multiple nodules. The patient had mild to moderate learning difficulties. He was subsequently referred for genetic and ophthalmology evaluation.
Plexiform neurofibromas are usually benign nerve sheath tumors that are elongated and are multinodular, forming when the tumor involves either multiple trunks of a plexus or multiple fascicles of a large nerve such as the sciatic. Some plexiform neurofibromas resemble a bag of worms; others produce a massive ropy enlargement of the nerve.1,2 Plexiform neurofibromas are associated with cases of neurofibromatosis type I (NFI) and are themselves one of the diagnostic criteria for NFI.1
Plexiform neurofibromas are benign tumors that are the result of a genetic mutation in which loss of heterozygosity occurs, as is the case with the other predominant neoplasms of NFI, that results in unrestricted cell growth.3,4 Some patients have a loss of heterozygosity of this tumor suppression gene with overgrowth of neurofibromatosis on a Blaschko segment. One study in mouse models showed that stromal mast cells were involved in promoting inflammation and increasing tumor growth by mediation of mitogenic signals involved in vascular ingrowth, collagen deposition, and cellular proliferation.5 Plexiform neurofibromas are a presenting feature in 30% of NFI cases within the first year of life. They are extensive nerve sheath tumors with an unpredictable growth pattern that can involve multiple fascicles (ie, large nerves and their branches). Five percent become malignant and the transformation is often heralded by rapid growth and pain.6 If malignant transformation is suspected, biopsy is diagnostic. Magnetic resonance imaging with and without contrast can categorize them into 3 growth categories: superficial, displacing, and invasive.7 Because plexiform neurofibromas are rare tumors, it previously was common practice to delay surgical intervention until disfigurement or disability arose. Complete surgical resection at more advanced stages is nearly impossible given the networklike growth pattern that commonly encapsulates vital structures.8,9 Therefore, surgery has been used in the past for debulking the large growths that eventually will recur. A study of 9 small superficial plexiform neurofibromas in children aged 3 to 15 years documented treatment with early surgical resection, which showed complete resection and no relapse at 4 years. This study showed a promising strategy to prevent future extension of these fast-growing tumors into vital structures.8 There also are current clinical trials investigating sirolimus and peginterferon alfa-2b in patients with more invasive plexiform neurofibromas that are unable to undergo surgical resection due to encapsulation or proximity to essential anatomical structures (registered at www.clinicaltrials.gov with the identifiers NCT00652990 and NCT00678951, respectively).
Pain, development of a neurologic deficit, or enlargement of a preexisting plexiform neurofibroma may signal a malignant peripheral nerve sheath tumor (MPNST) and require immediate evaluation.10 Examination by magnetic resonance imaging and positron emission tomography is useful in distinguishing benign and MPNSTs,8,11,12 but definitive differentiation can only be made by histologic examination of the tumor. Complete surgical excision, when possible, is the only treatment that offers the possibility of cure of MPNSTs. Adjuvant chemotherapy or radiotherapy also is sometimes used, though benefit has not been clearly established.8,9,13,14
Death certificate and population-based studies have shown that approximately 10% of patients with NFI have a reduced life expectancy due to MPNSTs; indeed, these tumors arising from plexiform neurofibromas are the main cause of death in adults with NFI. In 2003, Mautner et al7 studied 50 individuals with NFI. The objective was to establish magnetic resonance imaging criteria for MPNST and to test their usefulness in detecting early malignant change in plexiform neurofibromas. This study found that MPNST in patients with NFI frequently showed inhomogeneous contrast enhancement. This inhomogeneity was due to necrosis and hemorrhage, as shown by macroscopic and histologic analysis of amputated limbs in 2 patients within the study. The investigators found it to be possible to detect malignant transformation at an early stage in patients with no overt clinical signs of progression.7 Careful follow-up will determine how frequently early malignancy can be detected and if it is worthwhile carrying out magnetic resonance imaging at defined intervals.2,7,10,15,16
- Friedman JM. Neurofibromatosis 1. In: Pagon RA, ed. GeneReviews. Seattle, WA: University of Washington, Seattle; 1993. http://www.ncbi.nlm.nih.gov/books/NBK1109/. Updated September 4, 2014. Accessed April 6, 2015.
- Friedman JM, Riccardi VM. Clinical epidemiological features. In: Friedman JM, Gutmann DH, MacCollin M, et al, eds. Neurofibromatosis: Phenotype, Natural History, and Pathogenesis. Baltimore, MD: Johns Hopkins University Press; 1999:29-86.
- Bausch B, Borozdin W, Mautner VF, et al; European-American Phaeochromocytoma Registry Study Group. Germline NF1 mutational spectra and loss-of-heterozygosity analyses in patients with phaeochromocytoma and neurofibromatosis type 1. J Clin Endocrinol Metab. 2007;92:2784-2792.
- Bottillo I, Ahlquist T, Brekke H, et al. Germline and somatic NF1 mutations in sporadic and NF1-associated malignant peripheral nerve sheath tumours. J Pathol. 2009;217:693-701.
- Staser K, Yang FC, Clapp DW. Pathogenesis of plexiform neurofibroma: tumor-stromal/hematopoietic interactions in tumor progression. Ann Rev Pathol. 2012;7:469-495.
- Murphey MD, Smith WS, Smith SE, et al. From the archives of the AFIP: imaging of musculoskeletal neurogenic tumors: radiologic-pathologic correlation. Radiographics. 1999;19:1253-1280.
- Mautner VF, Friedrich RE, von Deimling A, et al. Malignant peripheral nerve sheath tumours in neurofibromatosis type 1: MRI supports the diagnosis of malignant plexiform neurofibroma. Neuroradiology. 2003;45:618-625.
- Friedrich RE, Schmelzle R, Hartmann M, et al. Resection of small plexiform neurofibromas in neurofibromatosis type 1 children. World J Surg Oncol. 2005;3:6.
- Gottfried ON, Viskochil DH, Fults DW, et al. Molecular, genetic, and cellular pathogenesis of neurofibromas and surgical implications. Neurosurgery. 2006;58:1-16.
- Valeyrie-Allanore L, Ismaïli N, Bastuji-Garin S, et al. Symptoms associated with malignancy of peripheral nerve sheath tumours: a retrospective study of 69 patients with neurofibromatosis 1. Br J Dermatol. 2005;153:79-82.
- Bensaid B, Giammarile F, Mognetti T, et al. Utility of 18 FDG positron emission tomography in detection of sarcomatous transformation in neurofibromatosis type 1. Ann Dermatol Venereol. 2007;134:735-741.
- Ferner RE, Lucas JD, O’Doherty MJ, et al. Evaluation of (18)fluorodeoxyglucose positron emission tomography ((18)FDG PET) in the detection of malignant peripheral nerve sheath tumours arising from within plexiform neurofibromas in neurofibromatosis 1. J Neurol Neurosurg Psychiatry. 2000;68:3353-3357.
- Baujat B, Krastinova-Lolov D, Blumen M, et al. Radiofrequency in the treatment of craniofacial plexiform neurofibromatosis: a pilot study. Plast Reconstr Surg. 2006;117:1261-1268.
- Hummel T, Anyane-Yeboa A, Mo J, et al. Response of NF1-related plexiform neurofibroma to high-dose carboplatin. Pediatr Blood Cancer. 2011;56:488-490.
- Feldmann R, Schuierer G, Wessel A, et al. Development of MRI T2 hyperintensities and cognitive functioning in patients with neurofibromatosis type 1. Acta Paediatr. 2010;99:1657-1660.
- Blazo MA, Lewis RA, Chintagumpala MM, et al. Outcomes of systematic screening for optic pathway tumors in children with neurofibromatosis type 1. Am J Med Genet A. 2004;127A:224-229.
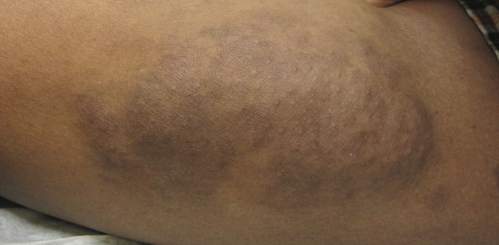
An 11-year-old boy presented for evaluation of a 10×8-cm tortuous lesion on the right posterior leg. Although it had been present since birth, the patient’s mother reported recent growth of the lesion. The lesion was noted to occasionally become irritated and pruritic. The patient’s history was remarkable for asthma.

High participation, steady sensitivity for CRC with annual FIT screening
Annual fecal immunochemical testing (FIT) for colorectal cancer screening demonstrated slightly decreased but steady sensitivity and predictive values over several rounds with a high participation rate.
According to the report, noninvasive fecal blood testing has been shown to decrease colorectal cancer (CRC) incidence and mortality. Further, screening with fecal immunochemical testing (FIT) doesn’t require consideration of medications or dietary factors as guaiac stool testing does.
Dr. Christopher Jensen of the Kaiser Permanente Division of Research in Oakland, Calif., and colleagues conducted a retrospective cohort study of 50- to 70-year-olds to assess the performance of FIT for 4 years of annual screening. Their results were published in Annals of Internal Medicine.

In total, 670,841 participants received FIT kits and 48.2% returned completed kits. Among the participants in round 1, 55.4% were white, 46.4% were men, and the mean age was 58.5 years. In subsequent rounds, eligible participants returned the kits at a rate of 75.3% for round 2, 83.4% for round 3, 86.1% for round 4, and 63.8% overall.
Tests were 5% positive in the first round and ranged from 3.7% to 4.3% positive in subsequent rounds. Further, men compared with women (5.1% versus 3.7%) and older participants compared to younger (5.2% versus 4.1%) had higher rates of FIT positivity. Follow-up colonoscopy was obtained within 1 year (median 45 days) of a positive FIT in 78.4% of participants.
The positive predictive value for adenoma was highest in the first round at 51.5% and ranged from 47.4% to 48.5% in subsequent rounds. Similarly, the positive predictive value for colorectal cancer was 3.4% in the first round and ranged from 2.1% to 2.3% in subsequent rounds.
Finally, the sensitivity of FIT for CRC was 84.5% in the first round and between 73.4% and 78% in subsequent rounds. Across all screening rounds, participants with a diagnosis with CRC had a positive FIT between 79.7% in round 1 to 75.3% in round 4 beforehand. The authors point out that sensitivity was slightly lower for proximal compared with distal cancer. Further, those with a positive FIT the year prior were less likely to have advanced-stage CRC (26.9%) than those with a negative FIT (33.1%) or not screened (37.1%).
Dr. Corley and Dr. Levin reported grants from the National Cancer Institute, which supported the study. Dr. Jensen reported grants from the National Institutes of Health, and Dr. Doubeni reported consulting for Exact Sciences.
Annual fecal immunochemical testing (FIT) for colorectal cancer screening demonstrated slightly decreased but steady sensitivity and predictive values over several rounds with a high participation rate.
According to the report, noninvasive fecal blood testing has been shown to decrease colorectal cancer (CRC) incidence and mortality. Further, screening with fecal immunochemical testing (FIT) doesn’t require consideration of medications or dietary factors as guaiac stool testing does.
Dr. Christopher Jensen of the Kaiser Permanente Division of Research in Oakland, Calif., and colleagues conducted a retrospective cohort study of 50- to 70-year-olds to assess the performance of FIT for 4 years of annual screening. Their results were published in Annals of Internal Medicine.
In total, 670,841 participants received FIT kits and 48.2% returned completed kits. Among the participants in round 1, 55.4% were white, 46.4% were men, and the mean age was 58.5 years. In subsequent rounds, eligible participants returned the kits at a rate of 75.3% for round 2, 83.4% for round 3, 86.1% for round 4, and 63.8% overall.
Tests were 5% positive in the first round and ranged from 3.7% to 4.3% positive in subsequent rounds. Further, men compared with women (5.1% versus 3.7%) and older participants compared to younger (5.2% versus 4.1%) had higher rates of FIT positivity. Follow-up colonoscopy was obtained within 1 year (median 45 days) of a positive FIT in 78.4% of participants.
The positive predictive value for adenoma was highest in the first round at 51.5% and ranged from 47.4% to 48.5% in subsequent rounds. Similarly, the positive predictive value for colorectal cancer was 3.4% in the first round and ranged from 2.1% to 2.3% in subsequent rounds.
Finally, the sensitivity of FIT for CRC was 84.5% in the first round and between 73.4% and 78% in subsequent rounds. Across all screening rounds, participants with a diagnosis with CRC had a positive FIT between 79.7% in round 1 to 75.3% in round 4 beforehand. The authors point out that sensitivity was slightly lower for proximal compared with distal cancer. Further, those with a positive FIT the year prior were less likely to have advanced-stage CRC (26.9%) than those with a negative FIT (33.1%) or not screened (37.1%).
Dr. Corley and Dr. Levin reported grants from the National Cancer Institute, which supported the study. Dr. Jensen reported grants from the National Institutes of Health, and Dr. Doubeni reported consulting for Exact Sciences.
FROM ANNALS OF INTERNAL MEDICINE
Key clinical point: Annual FIT screening had high participation and steady sensitivity for CRC.
Major finding: The positive predictive value for adenoma was 51.5% in round 1 (47.4%-48.5% in subsequent rounds), the PPV for CRC was 3.4% in round 1 (2.1%-2.3% in subsequent rounds), and the sensitivity for CRC was 84.5% in round 1 (73.4%-78% in subsequent rounds).
Data source: Retrospective cohort study of 50- to 70-year-olds to assess the performance of FIT for 4 years of annual screening.
Disclosures: Dr. Corley and Dr. Levin reported grants from the National Cancer Institute, which supported the study. Dr. Jensen reported grants from the National Institutes of Health, and Dr. Doubeni reported consulting for Exact Sciences.

U.S. flu activity picks up slightly
There were no states in the “high” range of influenza-like illness (ILI) activity during week 14 of the 2015-2016 flu season, but there were more states with elevated levels, compared with the previous week, the Centers for Disease Control and Prevention reported.
Arizona had the highest activity (level 7) for the week ending Jan. 16, with Maryland and South Carolina (level 6) the only other states in the “moderate” range of ILI activity. There were 21 states at level 2 or higher, up from 18 the week before, but still below the peak of 24 that was seen 2 weeks ago. The overall proportion of outpatient visits for ILI was 2.1% for week 14, which was up from 2% for week 13 but was right at the national baseline, according to data from the CDC’s Outpatient Influenza-like Illness Surveillance Network.

There were no influenza-related pediatric deaths reported for week 14, so the number of total deaths remains at seven for the season, which is well below the week-14 totals for each of the previous three seasons. There have been 494 laboratory-confirmed influenza-associated hospitalizations reported in the 13 states of the CDC’s Influenza Hospitalization Surveillance Network through week 14, for an overall hospitalization rate of 1.8/100,000 population, the CDC said.
Among all hospitalizations, 65.4% were associated with influenza A, 28.7% with influenza B, 3.2% with influenza A and B coinfection, and 2.6% had no virus type information, the CDC report noted.
There were no states in the “high” range of influenza-like illness (ILI) activity during week 14 of the 2015-2016 flu season, but there were more states with elevated levels, compared with the previous week, the Centers for Disease Control and Prevention reported.
Arizona had the highest activity (level 7) for the week ending Jan. 16, with Maryland and South Carolina (level 6) the only other states in the “moderate” range of ILI activity. There were 21 states at level 2 or higher, up from 18 the week before, but still below the peak of 24 that was seen 2 weeks ago. The overall proportion of outpatient visits for ILI was 2.1% for week 14, which was up from 2% for week 13 but was right at the national baseline, according to data from the CDC’s Outpatient Influenza-like Illness Surveillance Network.
There were no influenza-related pediatric deaths reported for week 14, so the number of total deaths remains at seven for the season, which is well below the week-14 totals for each of the previous three seasons. There have been 494 laboratory-confirmed influenza-associated hospitalizations reported in the 13 states of the CDC’s Influenza Hospitalization Surveillance Network through week 14, for an overall hospitalization rate of 1.8/100,000 population, the CDC said.
Among all hospitalizations, 65.4% were associated with influenza A, 28.7% with influenza B, 3.2% with influenza A and B coinfection, and 2.6% had no virus type information, the CDC report noted.
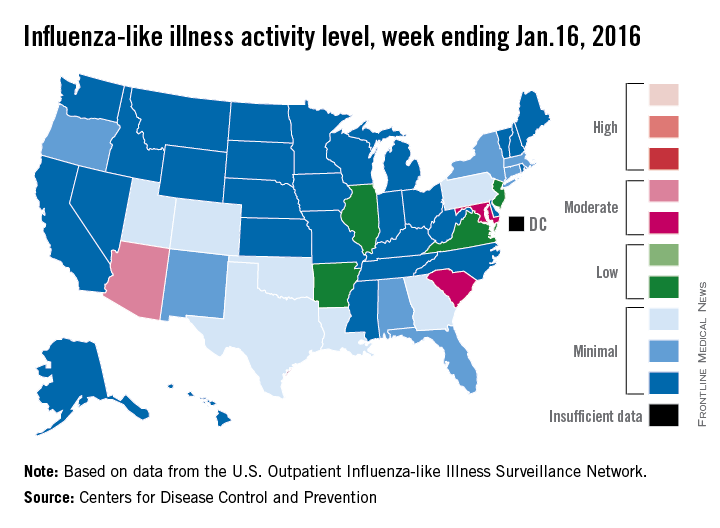
Peripheral T-cell lymphoma incidence and survival varies significantly by race
Peripheral T-cell lymphoma (PTCL) incidence, proportions of subtypes, and survival differed markedly among racial/ethnic subpopulations in the United States, according to analysis of SEER cancer registries.
Compared with non-Hispanic whites, blacks had higher incidence rates overall of PTCL, due to higher rates of PTCL not otherwise specified (PTCL-NOS) (incidence rate ratio [IRR], 1.67; 95% CI, 1.53-1.82) and adult T-cell leukemia/lymphoma (ATLL) (IRR, 4.37; 3.42-5.56). By contrast, blacks had lower incidence rates of angioimmunoblastic T-cell lymphoma (AITL) and extranodal NK/T-cell lymphoma and natural killer–cell leukemia (ENKCL) than non-Hispanic whites. Underlying causes for these differences are not understood.
“Our findings also highlight the need for stronger efforts to increase recruitment of blacks into clinical trials of PTCL therapies,” wrote Dr. Scott Adams of Fred Hutchinson Cancer Research Center, Seattle, and colleagues (J Clin Oncol. 2016 Jan 25. doi: 10.1200/JCO.2015.635540).
Asians/Pacific Islanders and Hispanic whites had higher rates of ENKCL (IRR, 3.61; 2.93-4.42), and ENKCL comprised a larger proportion of PTCL (14%) in these populations than for non-Hispanic whites (3%), findings which reflect global variations. High rates of ENKCL may be influenced by both genetic and environmental factors, as 35% of this subpopulation was born outside the U.S., compared with 16% of all patients with PTCL. Epstein-Barre virus infection is associated with ENKCL.
Similar to global incidence patterns, Asians/Pacific Islanders had lower rates of anaplastic large-cell lymphoma (ALCL).
Higher incidence of ATLL among blacks and Asians/Pacific Islanders corresponded to a higher prevalence of human T-lymphotropic virus type 1 in these populations. Substantial differences in survival were also observed. Compared with non-Hispanic whites, survival with PTCL-NOS was shorter for every minority group, and blacks had worse prognoses for almost every histology. For patients with any PTCL, median survival time varied by race: 49 months for non-Hispanic whites, 24 for blacks, 22 for Asians/Pacific Islanders, 28 for Hispanic whites, and 36 for American Indians/Alaskan natives.
Reasons for survival disparities are not known, but contributing factors may include racial variations in pharmacokinetics or pharmacodynamics of therapeutic agents and genomic variations of the tumors, as well as healthcare disparities and socioeconomic factors.
The analysis used data from SEER cancer registries of 13,107 patients 15 years and older who had PTCL diagnosed in the U.S. between 2000 and 2012.
For non-Hispanic whites, the annual incidence rate of all PTCLs was 1.56 (95% CI; 1.52-1.59) per 100,000. Compared with non-Hispanic whites, incidence rate ratios were 1.32 (1.25-1.39; P less than .001) for blacks, 0.89 (0.83-0.95; P less than .001) for Asians/Pacific Islanders, 0.63 (0.49-0.79; P less than .001) for American Indians/Alaskan natives, and 0.96 (0.90-1.01; P = .13) for Hispanic whites.
Key clinical point: Peripheral T-cell lymphoma incidence, proportions of subtypes, and survival differed markedly among racial/ethnic subpopulations in the United States.
Major finding: Compared with non-Hispanic whites, blacks had higher incidence rates of PTCL not otherwise specified (PTCL-NOS) and adult T-cell leukemia/lymphoma (ATLL), and lower incidence rates of angioimmunoblastic T-cell lymphoma (AITL) and extranodal NK/T-cell lymphoma and natural killer–cell leukemia (ENKCL); Asians/Pacific Islanders and Hispanic whites had higher rates of ENKCL; Asians/Pacific Islanders had lower rates of anaplastic large-cell lymphoma (ALCL); survival with PTCL-NOS was shorter for every minority group compared with non-Hispanic whites.
Data source: SEER cancer registries of 13,107 patients 15 years and older who had PTCL diagnosed in the U.S. between 2000 and 2012.
Disclosures: Dr. Adams reported having no disclosures. Dr. Shustov, a coauthor, reported financial ties to Celgene, Spectrum Pharmaceuticals, Bristol-Myers Squibb, Millennium, Gilead Sciences, Seattle Genetics, and Pfizer.