User login
Trust
At this ripe point in my career, many new patients come referred by Dr. Google. “I checked the Internet,” they say. “You have great reviews.”
I don’t read my reviews. The abusive ones make me ill. People must filter out the bile and focus on the positives.
Laymen have little sense of how good the professionals they consult really are. Unless I’m audited and lose, how would I know how skillful my accountant is? My urologist is a nice man. How good is he at prostate surgery? I hope not to find out. Nevertheless, reviews are here to stay, as are physician evaluations by insurers and professional agencies.

Some office days highlight the gap, really the chasm, between the truth of the professional matter and what makes patients decide to trust or mistrust us. Last Thursday was one of those days.
Marla brought in her daughter, aged 3 years. Zoe had a scaly rash and some red papules on her arms and legs.
“Did your pediatrician treat this?” I asked.
“No, I came right to you,” said Marla. “You diagnosed her with bedbugs when she was an infant. The pediatricians had no idea what was going on. I trust you.”
That is flattering, but if I were being fully honest, I would tell Marla:
• Bedbug bites are tricky to diagnose. I’ve missed my share.
• What helped me diagnose them in her daughter was that the pediatrician had already tried several remedies that hadn’t helped.
Even if I said these things, though – and why waste all that wonderful transference? – Marla would probably have said, “Maybe so, but you got it right, and I trust you.” Nothing succeeds like success.
The reverse, however, is also true: Nothing fails like failure.
Later the same day Brian brought in Luke, aged 6 years. Luke has severe atopic dermatitis. As usual, he was scratching up a storm. “I think it’s infected,” Brian said. “Shouldn’t he take antibiotics?”
I examined Luke and found subacute eczema. “I don’t think so,” I said. “This is what Luke’s eczema flares look like. Let’s treat him with a topical steroid cream and see how he does.”
“But he had staph last year,” said Brian.
“I recall,” I said, “but most of his outbreaks have not been infected, and it doesn’t look like staph now. Let’s treat it as we usually do and see what happens over the next week.”
Two weeks later Brian brought back Luke, still scratching. There were still no pustules or deeper inflammatory lesions. We started Luke on an antibiotic, and swabbed scratched areas. Two days later the culture grew staph. By the time I called Brian with the results, he had brought Luke to an emergency room. “He has abscesses,” he told me.
The next day the sensitivities were back, confirming staph. I called Brian, who had this to say: “He should have been on antibiotics 2 weeks ago. From now on, whenever he starts scratching, he should be started on them right away. I won’t be bringing him back to your practice. I don’t trust you. I trust the doctors in the ER more.”
Is it really a good idea to start every eczema patient on antibiotics? How about every eczema patient who once had staph? Based on my own clinical experience with both conditions, I would answer both questions in the negative. Others might disagree.
One thing is sure, though: Like most patients, Brian sees the situation not through the eyes of my experience but through his own case series, with an n of 1. But that 1 carries a lot of weight, because the 1 is Luke, his son. It is therefore clear – to him – that his son should be treated preemptively with antibiotics for every eczema flare.
At this point I might too, for Luke, but I will not get the chance. Once trust is gone, the clinical relationship is over. Sometimes it’s one strike and you’re out.
For her part, Marla sees things through her single case report as well, drawing the opposite conclusion: that my success earned me the trust her pediatrician lost.
The subtleties and nuances of such cases, which every clinician knows, are lost in the often black-and-white world of lay reviews and pay-for-performance algorithms. That’s clinical life.
Trust me.
Dr. Rockoff practices dermatology in Brookline, Mass., and is a longtime contributor to Dermatology News. He serves on the clinical faculty at Tufts University, Boston, and has taught senior medical students and other trainees for 30 years. Write to him at [email protected].
At this ripe point in my career, many new patients come referred by Dr. Google. “I checked the Internet,” they say. “You have great reviews.”
I don’t read my reviews. The abusive ones make me ill. People must filter out the bile and focus on the positives.
Laymen have little sense of how good the professionals they consult really are. Unless I’m audited and lose, how would I know how skillful my accountant is? My urologist is a nice man. How good is he at prostate surgery? I hope not to find out. Nevertheless, reviews are here to stay, as are physician evaluations by insurers and professional agencies.
Some office days highlight the gap, really the chasm, between the truth of the professional matter and what makes patients decide to trust or mistrust us. Last Thursday was one of those days.
Marla brought in her daughter, aged 3 years. Zoe had a scaly rash and some red papules on her arms and legs.
“Did your pediatrician treat this?” I asked.
“No, I came right to you,” said Marla. “You diagnosed her with bedbugs when she was an infant. The pediatricians had no idea what was going on. I trust you.”
That is flattering, but if I were being fully honest, I would tell Marla:
• Bedbug bites are tricky to diagnose. I’ve missed my share.
• What helped me diagnose them in her daughter was that the pediatrician had already tried several remedies that hadn’t helped.
Even if I said these things, though – and why waste all that wonderful transference? – Marla would probably have said, “Maybe so, but you got it right, and I trust you.” Nothing succeeds like success.
The reverse, however, is also true: Nothing fails like failure.
Later the same day Brian brought in Luke, aged 6 years. Luke has severe atopic dermatitis. As usual, he was scratching up a storm. “I think it’s infected,” Brian said. “Shouldn’t he take antibiotics?”
I examined Luke and found subacute eczema. “I don’t think so,” I said. “This is what Luke’s eczema flares look like. Let’s treat him with a topical steroid cream and see how he does.”
“But he had staph last year,” said Brian.
“I recall,” I said, “but most of his outbreaks have not been infected, and it doesn’t look like staph now. Let’s treat it as we usually do and see what happens over the next week.”
Two weeks later Brian brought back Luke, still scratching. There were still no pustules or deeper inflammatory lesions. We started Luke on an antibiotic, and swabbed scratched areas. Two days later the culture grew staph. By the time I called Brian with the results, he had brought Luke to an emergency room. “He has abscesses,” he told me.
The next day the sensitivities were back, confirming staph. I called Brian, who had this to say: “He should have been on antibiotics 2 weeks ago. From now on, whenever he starts scratching, he should be started on them right away. I won’t be bringing him back to your practice. I don’t trust you. I trust the doctors in the ER more.”
Is it really a good idea to start every eczema patient on antibiotics? How about every eczema patient who once had staph? Based on my own clinical experience with both conditions, I would answer both questions in the negative. Others might disagree.
One thing is sure, though: Like most patients, Brian sees the situation not through the eyes of my experience but through his own case series, with an n of 1. But that 1 carries a lot of weight, because the 1 is Luke, his son. It is therefore clear – to him – that his son should be treated preemptively with antibiotics for every eczema flare.
At this point I might too, for Luke, but I will not get the chance. Once trust is gone, the clinical relationship is over. Sometimes it’s one strike and you’re out.
For her part, Marla sees things through her single case report as well, drawing the opposite conclusion: that my success earned me the trust her pediatrician lost.
The subtleties and nuances of such cases, which every clinician knows, are lost in the often black-and-white world of lay reviews and pay-for-performance algorithms. That’s clinical life.
Trust me.
Dr. Rockoff practices dermatology in Brookline, Mass., and is a longtime contributor to Dermatology News. He serves on the clinical faculty at Tufts University, Boston, and has taught senior medical students and other trainees for 30 years. Write to him at [email protected].

Psychosis: Watch for sudden poor academic performance
When an adolescent presents with a history of sudden decline in academic performance, be sure to consider serious mental illness.
According to Dr. David Pickar, a psychiatrist and former (retired) director of intramural research at the National Institute of Mental Health, 90%of cases – particularly of schizophrenia – occur between the ages of 16 and 24 years.
“As a scientist, I’ve spent my career thinking about that, but for the primary care doc, if the family comes in and reports that their kid was a good student, and he’s now terrible,” first-episode psychosis should be considered, said Dr. Pickar, who produced a documentary short film describing how to recognize schizophrenia and psychosis. In this video, Dr. Pickar also explains how the use of marijuana also can precipitate psychosis in some people with a genetic predisposition to the illness.
The video associated with this article is no longer available on this site. Please view all of our videos on the MDedge YouTube channel

HM16 Session Analysis: Medical, Behavioral Management of Eating Disorders
Presenter: Kyung E. Rhee, MD, MSc, MA
Summary: Eating disorders (ED) are common and have significant morbidity and mortality. EDs are the third most common psychiatric disorder of adolescents with a prevalence of 0.5-2% for anorexia and 0.9-3% for bulimia; 90% of patients are female. Mortality rate can be as high as 10% for anorexia and 1% for bulimia. Diagnosis is formally guided by DSM 5 criteria, but the mnemonic SCOFF can be useful:
- Do you feel or make yourself SICK when eating?
- Do you feel you’ve lost CONTROL of your eating?
- Have you lost one STONE (14 lbs. developed by the British) of weight?
- Do you feel FAT?
- Does FOOD dominate your life?
A detailed history is needed as patients with ED may engage in secretive behaviors to hide their illness. After diagnosis, treatment may be outpatient or inpatient. Medical issues hospitalists are likely to see with inpatients include re-feeding syndrome, various metabolic disturbances, secondary amenorrhea, sleep disturbances, and for patients with bulimia, evidence of dental or esophageal trauma from purging. Differential diagnoses include: IBD, thyroid disease, celiac, diabetes, and Addison’s disease.
Hospitalists’ role in treatment is as part of a multidisciplinary group to manage the medical complications. Inpatient management includes individual and group therapy, monitored group meals, daily blind weights, bathroom visits, and focused lab studies. There is no “cure” and only ~50% of patients are free of ongoing symptoms after treatment.
Key Takeaways
- Eating disorders are common in adolescent females and have significant morbidity and mortality.
- Hospitalists’ role is diagnosis via careful history and management of medical complications with an eating disorder team. TH
Dr. Pressel is a pediatric hospitalist and inpatient medical director at Nemours/Alfred I. duPont Hospital for Children in Wilmington, Del., and a member of Team Hospitalist.
Psychosis: First-episode variety in adolescence ‘insidious’
Serious mental illness can present slowly and in ways that might not look serious, which is why primary care physicians would do well to educate themselves about what psychosis looks like.
The problem, according to Dr. David Pickar, psychiatrist and former (retired) intramural research director for the National Institute of Mental Health, is the lack of information about recognizing the signs and symptoms, and about proper interventions.
“Knowing about it is enormously important for all docs,” Dr. Pickar says. “What’s fascinating is many of the first breaks occur, not necessarily quietly, but can be a little insidious. They can be brought to primary care. It is not uncommon. With serious mental illness, particularly schizophrenia, 1% of the population has it. That makes it a very common disorder.”

VIDEO: How to navigate value-based care payer contracts
AUSTIN, TEX. – The shift from volume- to value-based care has become a regular hot topic among the medical community. But one rarely discussed question is how quality-based care will impact physician contracts with health plans, according to Bloomfield Hills, Mich., health law attorney Mark S. Kopson.
In a video interview at an American Health Lawyers Association meeting, Mr. Kopson discusses how to navigate payer contracts when operating within value-based care models. He addresses ideal terms to include in quality-based care contracts and how to mitigate legal risks with health plans.
“The contract language that works in volume-based contracts doesn’t work in value-based contracts,” Mr. Kopson explains. “We have to make a distinction between the two and recognize that there are risks and issues that have to be addressed in value-based arrangements.”
The video associated with this article is no longer available on this site. Please view all of our videos on the MDedge YouTube channel
On Twitter @legal_med
EXPERT ANALYSIS FROM THE PHYSICIANS AND HOSPITALS LAW INSTITUTE

PSYCHIATRY UPDATE 2016

View summaries from the event on the following pages.
Thursday, March 10, 2016
Make Way for Possibilities of an Adjunctive Treatment for Major Depressive Disorder
Roueen Rafeyan, MD, Feinberg School of Medicine at Northwestern University

Successful Aging
George T. Grossberg, MD, Saint Louis University

Psychopharmacology and Pregnancy: The New Labeling Changes and Implications for Clinical Practice
Marlene P. Freeman, MD, Massachusetts General Hospital

Anxiety Disorders in Women Across the Lifecycle
Marlene P. Freeman, MD, Massachusetts General Hospital

Mild Cognitive Impairment: “Senior Moments” and DSM-5
George T. Grossberg, MD, Saint Louis University

Assessing major depressive disorder and an option for treatment
Jay D. Fawver, MD, Indiana University School of Medicine

Innovative Treatments of Anxiety, Part 1 (Use of Benzodiazepines)
Mark H. Pollack, MD, Rush University Medical Center

Innovative Treatments of Anxiety, Part 2 (Other Standard and Novel Therapeutic Approaches)
Mark H. Pollack, MD, Rush University Medical Center

Treatment of Chronic Depression
Andrew A. Nierenberg, MD, Massachusetts General Hospital

Friday, March 11, 2016
Subtypes of Depression
Andrew A. Nierenberg, MD, Massachusetts General Hospital, Alexian Brothers Behavioral Health Hospital for Violence Prevention Clinic/Program and ADHD Clinic

Managing ADHD: What Matters Most When Selecting a Treatment Option
Michael Feld, MD, Alexian Brothers Behavioral Health Hospital for Violence Prevention Clinic/Program and ADHD Clinic

Dr. Feld discussed the utility of the brand-name extended-release (ER) methylphenidate HCl (Aptensio) for its value in children—specifically, its ability to “extend the day” without additional dosing of a short-action medication. The design of Aptensio—a multilayered beaded delivery system in which every bead is both an immediate- and an extended-release vehicle—allows an early peak serum drug level and later peak level (at 8 hours). Aptensio is administered by sprinkling the contents of a capsule on applesauce; it is is safe practice, Dr. Feld explained, to augment the ER drug delivery with an immediate-release agent when deemed necessary, by observing how difficult it is for the patient to make it through the day at home, school, or work.
Overview of Autism Spectrum Disorder
Robert L. Hendren, DO, University of California, San Francisco

Comorbidity of Schizophrenia and Substance Abuse
Henry A. Nasrallah, MD, Saint Louis University

Overview of PTSD
Carol S. North, MD, MPE, DFAPA, University of Texas Southwestern Medical Center

Bipolar Depression: Presentation, Diagnosis, and Treatment in the Outpatient Psychiatry Practice Setting
Peter J. Weiden, MD, University of Illinois at Chicago

Neuroinflammation and Oxidative Stress in Schizophrenia and Mood Disorders: Biomarkers and Therapeutic Targets
Henry A. Nasrallah, MD, Saint Louis University

Clinical Management of Autism Spectrum Disorders: What Happens Over Time/Borderline Intellectual Functioning
Robert L. Hendren, DO, University of California, San Francisco

Management of PTSD
Carol S. North, MD, MPE, DFAPA, University of Texas Southwestern Medical Center

Saturday, March 12, 2015
Managing the Difficult Child
Anthony L. Rostain, MD, MA, University of Pennsylvania

Major Depression With Subsyndromal Mania/Hypomania: Implications for Diagnosis and Management
Trisha Suppes, MD, PhD, Stanford University School of Medicine, Roger S. McIntyre, MD, FRCPC, University of Toronto, and J. Craig Nelson, MD, University of California, San Francisco

General Overview of Sleep Disorders
Thomas Roth, PhD, Henry Ford Hospital

Comorbid ADHD with Substance Abuse
Anthony L. Rostain, MD, MA, University of Pennsylvania

How to Treat Patients with Insomnia
Thomas Roth, PhD, Henry Ford Hospital

personality disorder, DSM-5, adults with ADHD, residual depressive symptoms, treatment-resistant depression,antisocial personality disorder, bipolar disorder, schizophrenia, psychotic disorder, clozapine, bipolar disorder and substance abuse, mood disorders during pregnancy, premenstrual dysphoric disorder, depressive symptoms in perimenopause, smoking and the mentally ill, help patients with mental illness lose weight, substance abuse in older adults
View summaries from the event on the following pages.
Thursday, March 10, 2016
Make Way for Possibilities of an Adjunctive Treatment for Major Depressive Disorder
Roueen Rafeyan, MD, Feinberg School of Medicine at Northwestern University
Successful Aging
George T. Grossberg, MD, Saint Louis University
Psychopharmacology and Pregnancy: The New Labeling Changes and Implications for Clinical Practice
Marlene P. Freeman, MD, Massachusetts General Hospital
Anxiety Disorders in Women Across the Lifecycle
Marlene P. Freeman, MD, Massachusetts General Hospital
Mild Cognitive Impairment: “Senior Moments” and DSM-5
George T. Grossberg, MD, Saint Louis University
Assessing major depressive disorder and an option for treatment
Jay D. Fawver, MD, Indiana University School of Medicine
Innovative Treatments of Anxiety, Part 1 (Use of Benzodiazepines)
Mark H. Pollack, MD, Rush University Medical Center
Innovative Treatments of Anxiety, Part 2 (Other Standard and Novel Therapeutic Approaches)
Mark H. Pollack, MD, Rush University Medical Center
Treatment of Chronic Depression
Andrew A. Nierenberg, MD, Massachusetts General Hospital
Friday, March 11, 2016
Subtypes of Depression
Andrew A. Nierenberg, MD, Massachusetts General Hospital, Alexian Brothers Behavioral Health Hospital for Violence Prevention Clinic/Program and ADHD Clinic
Managing ADHD: What Matters Most When Selecting a Treatment Option
Michael Feld, MD, Alexian Brothers Behavioral Health Hospital for Violence Prevention Clinic/Program and ADHD Clinic
Dr. Feld discussed the utility of the brand-name extended-release (ER) methylphenidate HCl (Aptensio) for its value in children—specifically, its ability to “extend the day” without additional dosing of a short-action medication. The design of Aptensio—a multilayered beaded delivery system in which every bead is both an immediate- and an extended-release vehicle—allows an early peak serum drug level and later peak level (at 8 hours). Aptensio is administered by sprinkling the contents of a capsule on applesauce; it is is safe practice, Dr. Feld explained, to augment the ER drug delivery with an immediate-release agent when deemed necessary, by observing how difficult it is for the patient to make it through the day at home, school, or work.
Overview of Autism Spectrum Disorder
Robert L. Hendren, DO, University of California, San Francisco
Comorbidity of Schizophrenia and Substance Abuse
Henry A. Nasrallah, MD, Saint Louis University
Overview of PTSD
Carol S. North, MD, MPE, DFAPA, University of Texas Southwestern Medical Center
Bipolar Depression: Presentation, Diagnosis, and Treatment in the Outpatient Psychiatry Practice Setting
Peter J. Weiden, MD, University of Illinois at Chicago
Neuroinflammation and Oxidative Stress in Schizophrenia and Mood Disorders: Biomarkers and Therapeutic Targets
Henry A. Nasrallah, MD, Saint Louis University
Clinical Management of Autism Spectrum Disorders: What Happens Over Time/Borderline Intellectual Functioning
Robert L. Hendren, DO, University of California, San Francisco
Management of PTSD
Carol S. North, MD, MPE, DFAPA, University of Texas Southwestern Medical Center
Saturday, March 12, 2015
Managing the Difficult Child
Anthony L. Rostain, MD, MA, University of Pennsylvania
Major Depression With Subsyndromal Mania/Hypomania: Implications for Diagnosis and Management
Trisha Suppes, MD, PhD, Stanford University School of Medicine, Roger S. McIntyre, MD, FRCPC, University of Toronto, and J. Craig Nelson, MD, University of California, San Francisco
General Overview of Sleep Disorders
Thomas Roth, PhD, Henry Ford Hospital
Comorbid ADHD with Substance Abuse
Anthony L. Rostain, MD, MA, University of Pennsylvania
How to Treat Patients with Insomnia
Thomas Roth, PhD, Henry Ford Hospital
personality disorder, DSM-5, adults with ADHD, residual depressive symptoms, treatment-resistant depression,antisocial personality disorder, bipolar disorder, schizophrenia, psychotic disorder, clozapine, bipolar disorder and substance abuse, mood disorders during pregnancy, premenstrual dysphoric disorder, depressive symptoms in perimenopause, smoking and the mentally ill, help patients with mental illness lose weight, substance abuse in older adults
personality disorder, DSM-5, adults with ADHD, residual depressive symptoms, treatment-resistant depression,antisocial personality disorder, bipolar disorder, schizophrenia, psychotic disorder, clozapine, bipolar disorder and substance abuse, mood disorders during pregnancy, premenstrual dysphoric disorder, depressive symptoms in perimenopause, smoking and the mentally ill, help patients with mental illness lose weight, substance abuse in older adults
Treating Tibia Fractures With Far Cortical Locking Implants
Fracture healing can be categorized as primary or secondary. Primary healing requires precise reapproximation of bone fragments and compression of cortices. Osteons are formed across the fracture line, allowing blood supply and endothelial cells to gain access, leading to osteoblast infiltration and subsequent bone formation.1 This type of bone healing can be accomplished only with absolute stability—specifically, only with less than 2% strain at the fracture site, necessitating operative intervention with compression plating (Figure 1).2 This type of construct generates friction between the bone fragments against a metal plate, created by tightening screws that purchase both far and near cortices of bone.3 Although this type of fixation works well with many fractures, there are several instances in which compression plating is not ideal.4 Osteoporotic bone, for example, limits the amount of compression that can be developed, as screws strip the bone more readily, leading to weakened constructs prone to failure. Metaphyseal fractures in which there is minimal cortex for screw thread purchase are a similar challenge.5 Highly comminuted fractures do not allow for sufficient fragment compression and stability. In addition, compression plating requires periosteal stripping at the fracture, and often substantial soft-tissue disruption, which is especially a problem in areas of tenuous blood supply (eg, the tibia).

Locked plating therefore has become a valuable technique in managing osteoporotic fractures.2 Locking plates may be used to achieve secondary bone healing through a small amount of interfragmentary motion, 0.2 to 10 mm, as seen with bridge plating for example, whereby the locking plates act as internal fixators. Much as with external fixators, as the distance from the fixator bar (or plate) to bone decreases, construct stiffness increases. Thus, locking plates function as extremely stiff fixators when the plate is very near bone. It has therefore been speculated that such stiffness is insufficient to provide optimal secondary healing conditions.6,7 Titanium (vs stainless steel) plates have been used, and screws have been omitted just adjacent to either side of the fracture site, in attempts to increase plate flexibility and thus interfragmentary motion.8,9 In addition, biomechanical and animal model studies have demonstrated that, with use of locking plates, motion at the fracture site is asymmetric and leads to unequal callus formation at the near and far cortices, thus weakening the fracture site.10,11
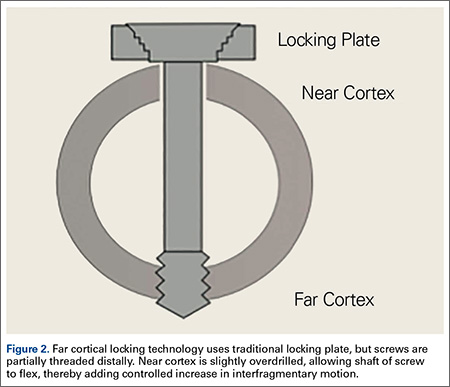
The locking plate design was recently modified to address these concerns. Far cortical locking (FCL) uses locking screws threaded only distally (Figure 2), which allows for purchase into the far cortex but not the near cortex, which increases pin length from plate to bone. The near cortex is no longer anchored to the plate and thus increases construct flexibility. Pilot holes in the near cortex allow for movement of the nonthreaded screw shaft in a controlled, biphasic manner.12 This design decreases stiffness while sacrificing very little construct strength.10 In addition, motion at the far and near cortices is nearly parallel. It has been shown in an ovine tibial osteotomy model that, compared with the traditional locking plate design, FCL generates symmetric callus formation and improved fracture healing.11 Although these results are promising, there are only limited clinical data on use of the FCL technique in fracture repair. Our null hypothesis was that, despite the theoretical advantages of FCL constructs over conventional locking plates, there would be no clinically observed differences between the constructs.
Patients and Methods
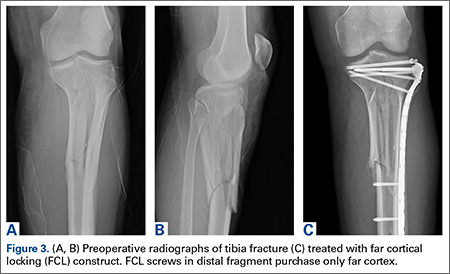
After obtaining Institutional Review Board approval from the 2 level I trauma centers and 1 level II trauma center involved in this study, we retrospectively reviewed the cases of all adults who presented with a tibia fracture and were treated with FCL technology (MotionLoc, Zimmer) by a fellowship-trained trauma surgeon at these hospitals (Figures 3A–3C). Any primary tibia fracture treated with FCL was considered. Only patients with follow-up of at least 20 weeks were included in the analysis. Exclusion criteria were tibial malunions or nonunions treated with FCL and fractures treated with a combination of intramedullary fixation and plating.
We reviewed the patient charts for demographic data, mechanism of injury, fracture type, and comorbidities. Risk factors for poor healing—such as diabetes and tobacco use, either current or prior—were recorded. We also reviewed the radiographs of the initial injuries for analysis of the tibia fracture types (Table 1) as well as the follow-up radiographs for evaluation of fracture healing. Using the Orthopaedic Trauma Association classification system, we identified a variety of fracture patterns. Fracture healing rates were recorded and used to calculate the overall healing rates for each group. Union was defined as either radiographic evidence of a completely healed fracture (≥3 cortices) or radiographic evidence of osseous bridging at the fracture site in addition to full weight-bearing without pain. Infection was defined as positive intraoperative cultures or grossly infected wounds with purulence and erythema.
For statistical analysis, we used Welch 2-sample t test to compare categorical data, including rates of fracture union, infection, and revision surgery. We chose this test because it was unclear whether variance in the groups would be similar. FCL and control data were compared for significant differences by calculating P values. Similarly, for continuous data, Fisher exact test was used to calculate P values for mean time to union and mean time to full weight-bearing in order to compare FCL and control outcomes.
Results
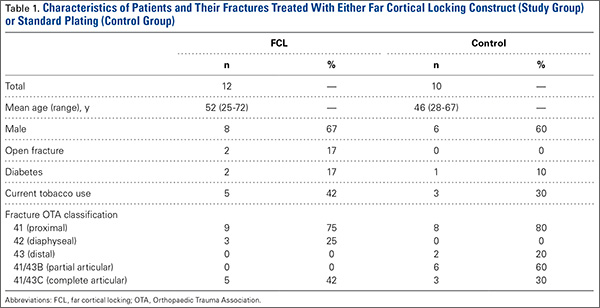
Twelve patients treated at 2 level I and 1 level II trauma centers between November 2010 and May 2012 met the inclusion and exclusion criteria for this study. Another 10 patients were treated with standard plating techniques (control group). Mean age was 52 years (range, 25-72 years) for the FCL group and 46 years (range, 28-67 years) for the control group. The FCL group included 2 open fractures (control, 0) and 2 patients with diabetes (control, 1) (Table 1).
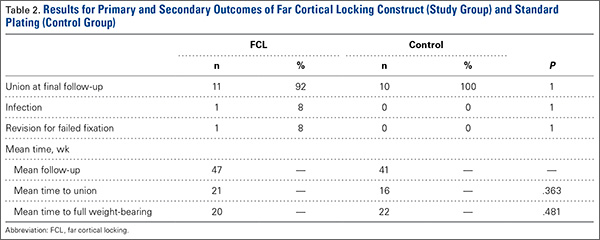
Eleven of the 12 FCL patients and all 10 control patients achieved fracture union by most recent follow-up (Table 2). The difference was not statistically significant (P = .363). The FCL-treated fracture that did not heal received an interfragmentary screw in addition to the standard FCL technology construct. The interfragmentary screw inhibited motion at the fracture site and could potentially have led to nonunion. For this patient, revision surgery to an intramedullary nail was required. Removal of the interfragmentary screw was uneventful. Each of the 2 open fractures in the FCL group required bone grafting because of large segmental bone loss. One of these fractures, a type 3B, became infected after bone grafting, and complete healing required plate removal. The patient was eventually treated with a brace. An infection that occurred after union in a closed tibia fracture in the FCL group required hardware removal. No patient in either group experienced loss or failure of fixation.
Discussion
Far cortical locking is a relatively new technology designed to increase fracture fixation flexibility by functionally lengthening the distance between the locking plate and the screw cortical purchase, which occurs at the far cortex rather than the near cortex. This construct thereby functions as an internal fixator and is functionally similar to an external fixator. Rather than there being bars external to the skin, a plate is placed internally, adjacent to but without compressing fracture fragments or the plate to the bone. This theoretically leads to a desirable amount of interfragmentary motion, promoting callus formation and secondary healing. However, too much motion at the fracture site disrupts healing by shearing proliferating cells attempting to bridge the fracture gap. Therefore, there is a narrow target zone of desirable motion between fracture fragments required to promote secondary bone healing—defined as 2% to 10% gap strain.2 FCL constructs are thought to fall in this range of gap strain and thus better promote secondary healing over standard locked plates. Although biomechanical studies have been used as proof of concept, there are no published clinical data on the effectiveness of FCL implants. The present article describes early data on clinical outcomes of this new type of implant.
The main limitation of this study is its small cohort size, which is largely a result of the short time these implants have been available and our attempt to compare only similar fractures in this analysis. In addition, follow-up was on average less than 1 year. We consider such follow-up acceptable, though, as all fractures essentially reached final healing status within that period. Another limitation is that we combined compression plating and locked plating in the control group. Considering the mechanism of the theoretical advantage of FCL implants, with larger cohorts it would be useful to perform a subanalysis in which compression and standard locking plates are separately compared with FCL implants.
This study found no statistically significant difference between FCL and standard plating, suggesting FCL likely is not inferior to standard plating. Although the FCL group included a nonunion, it is important to note that, in this case, there was a technical discrepancy in the ideal technique whereby another interfragmentary screw was placed, eliminating the interfragmentary motion that establishes the premise of FCL technology. This case thereby demonstrated that a breach in the FCL technique, as with standard locking techniques, may lead to fracture-healing complications. In the FCL group, 2 open fractures with significant segmental bone loss requiring bone graft subsequently healed. In addition, compared with the control group, the FCL group included more patients with diabetes and more tobacco users (both diabetes and tobacco use are associated with poor bone and wound healing). The FCL group was also, on average, 6 years older than the control group. None of these group differences, however, reached statistical significance. Indeed, part of the impetus to use FCL implants in this population was that these patients likely were at higher risk for poor healing and nonunion. This factor therefore represents a selection bias—the FCL group was more predisposed to nonunion—and a study limitation.
Together, our data show neither superiority nor inferiority of the FCL technique. This study is an important step in furthering investigations into FCL constructs. The finding of similar efficacy with FCL and conventional plating may assuage safety concerns and pave the way for more definitive studies of FCL technology and fuller evaluations of its effectiveness. These studies will be essential in determining whether the theoretical advantage of FCL translates into better clinical outcomes. Larger, prospective randomized studies with longer follow-ups will be needed to better compare FCL technology with current implants and techniques. At this early stage, however, FCL technology appears to be a viable option for complex fractures of the tibia.
1. Bernstein J, ed. Musculoskeletal Medicine. Rosemont, IL: American Academy of Orthopaedic Surgeons; 2003.
2. Egol KA, Kubiak EN, Fulkerson E, Kummer FJ, Koval KJ. Biomechanics of locked plates and screws. J Orthop Trauma. 2004;18(8):488-493.
3. Bagby GW. Compression bone-plating: historical considerations. J Bone Joint Surg Am. 1977;59(5):625-631.
4. Kubiak EN, Fulkerson E, Strauss E, Egol KA. The evolution of locked plates. J Bone Joint Surg Am. 2006;88(suppl 4):189-200.
5. Fitzpatrick DC, Doornink J, Madey SM, Bottlang M. Relative stability of conventional and locked plating fixation in a model of the osteoporotic femoral diaphysis. Clin Biomech. 2009;24(2):203-209.
6. Henderson CE, Bottlang M, Marsh JL, Fitzpatrick DC, Madey SM. Does locked plating of periprosthetic supracondylar femur fractures promote bone healing by callus formation? Two cases with opposite outcomes. Iowa Orthop J. 2008;28:73-76.
7. Lujan TJ, Henderson CE, Madey SM, Fitzpatrick DC, Marsh JL, Bottlang M. Locked plating of distal femur fractures leads to inconsistent and asymmetric callus formation. J Orthop Trauma. 2010;24(3):156-162.
8. Stoffel K, Dieter U, Stachowiak G, Gächter A, Kuster MS. Biomechanical testing of the LCP—how can stability in locked internal fixators be controlled? Injury. 2003;34(suppl 2):B11-B19.
9. Schmal H, Strohm PC, Jaeger M, Südkamp NP. Flexible fixation and fracture healing: do locked plating ‘internal fixators’ resemble external fixators? J Orthop Trauma. 2011;25(suppl 1):S15-S20.
10. Bottlang M, Doornink J, Fitzpatrick DC, Madey SM. Far cortical locking can reduce stiffness of locked plating constructs while retaining construct strength. J Bone Joint Surg Am. 2009;91(8):1985-1994.
11. Bottlang M, Lesser M, Koerber J, et al. Far cortical locking can improve healing of fractures stabilized with locking plates. J Bone Joint Surg Am. 2010;92(7):1652-1660.
12. Bottlang M, Feist F. Biomechanics of far cortical locking. J Orthop Trauma. 2011;25(suppl 1):S21-S28.
Fracture healing can be categorized as primary or secondary. Primary healing requires precise reapproximation of bone fragments and compression of cortices. Osteons are formed across the fracture line, allowing blood supply and endothelial cells to gain access, leading to osteoblast infiltration and subsequent bone formation.1 This type of bone healing can be accomplished only with absolute stability—specifically, only with less than 2% strain at the fracture site, necessitating operative intervention with compression plating (Figure 1).2 This type of construct generates friction between the bone fragments against a metal plate, created by tightening screws that purchase both far and near cortices of bone.3 Although this type of fixation works well with many fractures, there are several instances in which compression plating is not ideal.4 Osteoporotic bone, for example, limits the amount of compression that can be developed, as screws strip the bone more readily, leading to weakened constructs prone to failure. Metaphyseal fractures in which there is minimal cortex for screw thread purchase are a similar challenge.5 Highly comminuted fractures do not allow for sufficient fragment compression and stability. In addition, compression plating requires periosteal stripping at the fracture, and often substantial soft-tissue disruption, which is especially a problem in areas of tenuous blood supply (eg, the tibia).
Locked plating therefore has become a valuable technique in managing osteoporotic fractures.2 Locking plates may be used to achieve secondary bone healing through a small amount of interfragmentary motion, 0.2 to 10 mm, as seen with bridge plating for example, whereby the locking plates act as internal fixators. Much as with external fixators, as the distance from the fixator bar (or plate) to bone decreases, construct stiffness increases. Thus, locking plates function as extremely stiff fixators when the plate is very near bone. It has therefore been speculated that such stiffness is insufficient to provide optimal secondary healing conditions.6,7 Titanium (vs stainless steel) plates have been used, and screws have been omitted just adjacent to either side of the fracture site, in attempts to increase plate flexibility and thus interfragmentary motion.8,9 In addition, biomechanical and animal model studies have demonstrated that, with use of locking plates, motion at the fracture site is asymmetric and leads to unequal callus formation at the near and far cortices, thus weakening the fracture site.10,11
The locking plate design was recently modified to address these concerns. Far cortical locking (FCL) uses locking screws threaded only distally (Figure 2), which allows for purchase into the far cortex but not the near cortex, which increases pin length from plate to bone. The near cortex is no longer anchored to the plate and thus increases construct flexibility. Pilot holes in the near cortex allow for movement of the nonthreaded screw shaft in a controlled, biphasic manner.12 This design decreases stiffness while sacrificing very little construct strength.10 In addition, motion at the far and near cortices is nearly parallel. It has been shown in an ovine tibial osteotomy model that, compared with the traditional locking plate design, FCL generates symmetric callus formation and improved fracture healing.11 Although these results are promising, there are only limited clinical data on use of the FCL technique in fracture repair. Our null hypothesis was that, despite the theoretical advantages of FCL constructs over conventional locking plates, there would be no clinically observed differences between the constructs.
Patients and Methods
After obtaining Institutional Review Board approval from the 2 level I trauma centers and 1 level II trauma center involved in this study, we retrospectively reviewed the cases of all adults who presented with a tibia fracture and were treated with FCL technology (MotionLoc, Zimmer) by a fellowship-trained trauma surgeon at these hospitals (Figures 3A–3C). Any primary tibia fracture treated with FCL was considered. Only patients with follow-up of at least 20 weeks were included in the analysis. Exclusion criteria were tibial malunions or nonunions treated with FCL and fractures treated with a combination of intramedullary fixation and plating.
We reviewed the patient charts for demographic data, mechanism of injury, fracture type, and comorbidities. Risk factors for poor healing—such as diabetes and tobacco use, either current or prior—were recorded. We also reviewed the radiographs of the initial injuries for analysis of the tibia fracture types (Table 1) as well as the follow-up radiographs for evaluation of fracture healing. Using the Orthopaedic Trauma Association classification system, we identified a variety of fracture patterns. Fracture healing rates were recorded and used to calculate the overall healing rates for each group. Union was defined as either radiographic evidence of a completely healed fracture (≥3 cortices) or radiographic evidence of osseous bridging at the fracture site in addition to full weight-bearing without pain. Infection was defined as positive intraoperative cultures or grossly infected wounds with purulence and erythema.
For statistical analysis, we used Welch 2-sample t test to compare categorical data, including rates of fracture union, infection, and revision surgery. We chose this test because it was unclear whether variance in the groups would be similar. FCL and control data were compared for significant differences by calculating P values. Similarly, for continuous data, Fisher exact test was used to calculate P values for mean time to union and mean time to full weight-bearing in order to compare FCL and control outcomes.
Results
Twelve patients treated at 2 level I and 1 level II trauma centers between November 2010 and May 2012 met the inclusion and exclusion criteria for this study. Another 10 patients were treated with standard plating techniques (control group). Mean age was 52 years (range, 25-72 years) for the FCL group and 46 years (range, 28-67 years) for the control group. The FCL group included 2 open fractures (control, 0) and 2 patients with diabetes (control, 1) (Table 1).
Eleven of the 12 FCL patients and all 10 control patients achieved fracture union by most recent follow-up (Table 2). The difference was not statistically significant (P = .363). The FCL-treated fracture that did not heal received an interfragmentary screw in addition to the standard FCL technology construct. The interfragmentary screw inhibited motion at the fracture site and could potentially have led to nonunion. For this patient, revision surgery to an intramedullary nail was required. Removal of the interfragmentary screw was uneventful. Each of the 2 open fractures in the FCL group required bone grafting because of large segmental bone loss. One of these fractures, a type 3B, became infected after bone grafting, and complete healing required plate removal. The patient was eventually treated with a brace. An infection that occurred after union in a closed tibia fracture in the FCL group required hardware removal. No patient in either group experienced loss or failure of fixation.
Discussion
Far cortical locking is a relatively new technology designed to increase fracture fixation flexibility by functionally lengthening the distance between the locking plate and the screw cortical purchase, which occurs at the far cortex rather than the near cortex. This construct thereby functions as an internal fixator and is functionally similar to an external fixator. Rather than there being bars external to the skin, a plate is placed internally, adjacent to but without compressing fracture fragments or the plate to the bone. This theoretically leads to a desirable amount of interfragmentary motion, promoting callus formation and secondary healing. However, too much motion at the fracture site disrupts healing by shearing proliferating cells attempting to bridge the fracture gap. Therefore, there is a narrow target zone of desirable motion between fracture fragments required to promote secondary bone healing—defined as 2% to 10% gap strain.2 FCL constructs are thought to fall in this range of gap strain and thus better promote secondary healing over standard locked plates. Although biomechanical studies have been used as proof of concept, there are no published clinical data on the effectiveness of FCL implants. The present article describes early data on clinical outcomes of this new type of implant.
The main limitation of this study is its small cohort size, which is largely a result of the short time these implants have been available and our attempt to compare only similar fractures in this analysis. In addition, follow-up was on average less than 1 year. We consider such follow-up acceptable, though, as all fractures essentially reached final healing status within that period. Another limitation is that we combined compression plating and locked plating in the control group. Considering the mechanism of the theoretical advantage of FCL implants, with larger cohorts it would be useful to perform a subanalysis in which compression and standard locking plates are separately compared with FCL implants.
This study found no statistically significant difference between FCL and standard plating, suggesting FCL likely is not inferior to standard plating. Although the FCL group included a nonunion, it is important to note that, in this case, there was a technical discrepancy in the ideal technique whereby another interfragmentary screw was placed, eliminating the interfragmentary motion that establishes the premise of FCL technology. This case thereby demonstrated that a breach in the FCL technique, as with standard locking techniques, may lead to fracture-healing complications. In the FCL group, 2 open fractures with significant segmental bone loss requiring bone graft subsequently healed. In addition, compared with the control group, the FCL group included more patients with diabetes and more tobacco users (both diabetes and tobacco use are associated with poor bone and wound healing). The FCL group was also, on average, 6 years older than the control group. None of these group differences, however, reached statistical significance. Indeed, part of the impetus to use FCL implants in this population was that these patients likely were at higher risk for poor healing and nonunion. This factor therefore represents a selection bias—the FCL group was more predisposed to nonunion—and a study limitation.
Together, our data show neither superiority nor inferiority of the FCL technique. This study is an important step in furthering investigations into FCL constructs. The finding of similar efficacy with FCL and conventional plating may assuage safety concerns and pave the way for more definitive studies of FCL technology and fuller evaluations of its effectiveness. These studies will be essential in determining whether the theoretical advantage of FCL translates into better clinical outcomes. Larger, prospective randomized studies with longer follow-ups will be needed to better compare FCL technology with current implants and techniques. At this early stage, however, FCL technology appears to be a viable option for complex fractures of the tibia.
1. Bernstein J, ed. Musculoskeletal Medicine. Rosemont, IL: American Academy of Orthopaedic Surgeons; 2003.
2. Egol KA, Kubiak EN, Fulkerson E, Kummer FJ, Koval KJ. Biomechanics of locked plates and screws. J Orthop Trauma. 2004;18(8):488-493.
3. Bagby GW. Compression bone-plating: historical considerations. J Bone Joint Surg Am. 1977;59(5):625-631.
4. Kubiak EN, Fulkerson E, Strauss E, Egol KA. The evolution of locked plates. J Bone Joint Surg Am. 2006;88(suppl 4):189-200.
5. Fitzpatrick DC, Doornink J, Madey SM, Bottlang M. Relative stability of conventional and locked plating fixation in a model of the osteoporotic femoral diaphysis. Clin Biomech. 2009;24(2):203-209.
6. Henderson CE, Bottlang M, Marsh JL, Fitzpatrick DC, Madey SM. Does locked plating of periprosthetic supracondylar femur fractures promote bone healing by callus formation? Two cases with opposite outcomes. Iowa Orthop J. 2008;28:73-76.
7. Lujan TJ, Henderson CE, Madey SM, Fitzpatrick DC, Marsh JL, Bottlang M. Locked plating of distal femur fractures leads to inconsistent and asymmetric callus formation. J Orthop Trauma. 2010;24(3):156-162.
8. Stoffel K, Dieter U, Stachowiak G, Gächter A, Kuster MS. Biomechanical testing of the LCP—how can stability in locked internal fixators be controlled? Injury. 2003;34(suppl 2):B11-B19.
9. Schmal H, Strohm PC, Jaeger M, Südkamp NP. Flexible fixation and fracture healing: do locked plating ‘internal fixators’ resemble external fixators? J Orthop Trauma. 2011;25(suppl 1):S15-S20.
10. Bottlang M, Doornink J, Fitzpatrick DC, Madey SM. Far cortical locking can reduce stiffness of locked plating constructs while retaining construct strength. J Bone Joint Surg Am. 2009;91(8):1985-1994.
11. Bottlang M, Lesser M, Koerber J, et al. Far cortical locking can improve healing of fractures stabilized with locking plates. J Bone Joint Surg Am. 2010;92(7):1652-1660.
12. Bottlang M, Feist F. Biomechanics of far cortical locking. J Orthop Trauma. 2011;25(suppl 1):S21-S28.
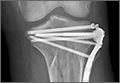
Bipolar, low compliance tied to greater cognitive impairment
Patients with bipolar disorder and low levels of pharmacological treatment adherence have greater levels of cognitive impairment, according to Dr. Ileana Fuentes and her associates.
After taking a neurological battery, 12 bipolar disorder patients with low treatment adherence performed worse than did 22 bipolar disorder patients with high treatment adherence in nearly all cognitive functions tested, but the effect was significant in verbal memory testing. The low-adherence group performed significantly worse in verbal memory immediate free recall, immediate cued recall, delayed free recall, and delayed cued recall.
Other factors found to be associated with poorer executive function and processing speed were greater number of manic episodes, history of psychosis, and fewer years of education, reported Dr. Fuentes of the University of Guadalajara, Mexico.
“Despite limitations of the study, our findings are clinically important, and they contribute to better understanding of the cognitive profile in low compliance patients with bipolar disorder. Low compliance, cognitive performance, and asymptomatic phase are important markers in [bipolar disorder] for further studies,” the investigators noted.
Find the study here (J Affect Disord. 2016 May;195:215-20 [doi: 10.1016/j.jad.2016.02.005]).
FROM THE JOURNAL OF AFFECTIVE DISORDERS
Guidelines on asparaginase hypersensitivity and silent inactivation in ALL
Recommendations for identification and management of asparaginase hypersensitivity and silent inactivation have been issued in consensus expert guidelines written by Dr. Inge M. van der Sluis of Sophia Children’s Hospital, Rotterdam, The Netherlands, and her colleagues.
The guidelines were published in Haematologica, the Journal of the European Hematology Association (Haematologica 2016 March;101:279-85).

Hypersensitivity reactions to asparaginase therapy can occur in 30% of children with acute lymphoblastic leukemia (ALL), and “silent inactivation” with the formation of neutralizing antibodies and reduced asparaginase activity can occur in the absence of a clinically evident allergic reaction. The guidelines seek to reduce the risk that patients will receive an inadequate course of asparaginase therapy due to either intolerable side effects or silent inactivation. The recommendations address therapeutic drug monitoring through serum asparaginase level assessment, indications for switching asparaginase preparations, and recommendations for monitoring after changes in asparaginase preparation.
The guidelines conclude that measures of serum asparaginase activity levels are the best and most reliable indicators of asparaginase efficacy. Trough asparaginase activity levels of at least 0.1 IU/mL appear to be a safe target level to ensure therapeutic benefit. Anti-asparaginase antibodies and asparagine measurements are not indicated for clinical decision making outside the context of a clinical trial.
Should clinical hypersensitivity occur, the patient has likely developed anti-asparaginase antibodies. Continued use of asparaginase of the same formulation will be ineffective in the treatment of leukemia and should be discouraged, even when it is clinically possible to administer the same preparation by using premedication such as steroids and antihistamines or by decreasing the infusion rate. Such measures reduce the symptoms of the allergy, but do not prevent asparaginase inactivation.
In patients with grade 1 allergic reactions (transient flushing or rash without need for intervention), the guideline writers recommend monitoring serum asparaginase level in real-time within 7 days to identify inactivation. In those with grade 2-4 reactions, the guideline writers recommend switching the asparaginase preparation, and there is no definite need to check asparaginase levels.
Screening for silent inactivation should be considered in all patients undergoing therapy for ALL with asparaginase, especially when there have been gaps in asparaginase therapy or in the setting of the treatment of relapsed leukemia.
“We recommend the testing of serum asparaginase activity level after the first dose of E. coli–derived asparaginase. With the use of pegaspargase, this should be done within 7 days of the dose. If the level is detectable but less than 0.1 IU/mL, activity should be rechecked at day 14,” according to the authors.
In patients who receive pegylated asparaginase every 14 days without a gap in dosing, it would be reasonable to confirm a low or undetectable level after a subsequent dose, and to change to an Erwinia preparation, for example, if two consecutive levels are undetectable.
“When there is a gap between asparaginase doses, we recommend checking a level after the first dose of asparaginase administered after the gap, with a gap defined as a period in which asparaginase activity level will have decreased to less than the [lower limit of quantification] between doses. In practice, this is usually the case when there is an interval of at least 4 weeks between pegylated asparaginase doses. With native E. coli asparaginase, we recommend measuring a trough level after the first dose and after every reintroduction of asparaginase,” the authors wrote.
When a limited number of asparaginase doses is planned or there are prolonged gaps between doses, the guidelines advise screening for silent inactivation after every asparaginase dose, and considering a switching in preparation based upon a single undetectable or low level.
The guidelines also recommend more insight into the costs of treatment with the various asparaginase preparations. In addition to the detection of silent inactivation, therapeutic drug monitoring can be used to individualize dosing based on activity levels and has the potential to reduce medication costs.
Several of the consensus writers have participated in advisory boards of companies involved in asparaginase, including Sigma-Tau, Medac, and Jazz Pharmaceuticals. Jazz Pharmaceuticals provided financial support for the investigator-initiated consensus meeting.
On Twitter @maryjodales
Recommendations for identification and management of asparaginase hypersensitivity and silent inactivation have been issued in consensus expert guidelines written by Dr. Inge M. van der Sluis of Sophia Children’s Hospital, Rotterdam, The Netherlands, and her colleagues.
The guidelines were published in Haematologica, the Journal of the European Hematology Association (Haematologica 2016 March;101:279-85).
Hypersensitivity reactions to asparaginase therapy can occur in 30% of children with acute lymphoblastic leukemia (ALL), and “silent inactivation” with the formation of neutralizing antibodies and reduced asparaginase activity can occur in the absence of a clinically evident allergic reaction. The guidelines seek to reduce the risk that patients will receive an inadequate course of asparaginase therapy due to either intolerable side effects or silent inactivation. The recommendations address therapeutic drug monitoring through serum asparaginase level assessment, indications for switching asparaginase preparations, and recommendations for monitoring after changes in asparaginase preparation.
The guidelines conclude that measures of serum asparaginase activity levels are the best and most reliable indicators of asparaginase efficacy. Trough asparaginase activity levels of at least 0.1 IU/mL appear to be a safe target level to ensure therapeutic benefit. Anti-asparaginase antibodies and asparagine measurements are not indicated for clinical decision making outside the context of a clinical trial.
Should clinical hypersensitivity occur, the patient has likely developed anti-asparaginase antibodies. Continued use of asparaginase of the same formulation will be ineffective in the treatment of leukemia and should be discouraged, even when it is clinically possible to administer the same preparation by using premedication such as steroids and antihistamines or by decreasing the infusion rate. Such measures reduce the symptoms of the allergy, but do not prevent asparaginase inactivation.
In patients with grade 1 allergic reactions (transient flushing or rash without need for intervention), the guideline writers recommend monitoring serum asparaginase level in real-time within 7 days to identify inactivation. In those with grade 2-4 reactions, the guideline writers recommend switching the asparaginase preparation, and there is no definite need to check asparaginase levels.
Screening for silent inactivation should be considered in all patients undergoing therapy for ALL with asparaginase, especially when there have been gaps in asparaginase therapy or in the setting of the treatment of relapsed leukemia.
“We recommend the testing of serum asparaginase activity level after the first dose of E. coli–derived asparaginase. With the use of pegaspargase, this should be done within 7 days of the dose. If the level is detectable but less than 0.1 IU/mL, activity should be rechecked at day 14,” according to the authors.
In patients who receive pegylated asparaginase every 14 days without a gap in dosing, it would be reasonable to confirm a low or undetectable level after a subsequent dose, and to change to an Erwinia preparation, for example, if two consecutive levels are undetectable.
“When there is a gap between asparaginase doses, we recommend checking a level after the first dose of asparaginase administered after the gap, with a gap defined as a period in which asparaginase activity level will have decreased to less than the [lower limit of quantification] between doses. In practice, this is usually the case when there is an interval of at least 4 weeks between pegylated asparaginase doses. With native E. coli asparaginase, we recommend measuring a trough level after the first dose and after every reintroduction of asparaginase,” the authors wrote.
When a limited number of asparaginase doses is planned or there are prolonged gaps between doses, the guidelines advise screening for silent inactivation after every asparaginase dose, and considering a switching in preparation based upon a single undetectable or low level.
The guidelines also recommend more insight into the costs of treatment with the various asparaginase preparations. In addition to the detection of silent inactivation, therapeutic drug monitoring can be used to individualize dosing based on activity levels and has the potential to reduce medication costs.
Several of the consensus writers have participated in advisory boards of companies involved in asparaginase, including Sigma-Tau, Medac, and Jazz Pharmaceuticals. Jazz Pharmaceuticals provided financial support for the investigator-initiated consensus meeting.
On Twitter @maryjodales
FROM HAEMATOLOGICA
HIV drug may overcome proteasome-inhibitor resistance in multiple myeloma
The protease inhibitor nelfinavir was used successfully to resensitize patients with proteasome inhibitor–refractory multiple myeloma for proteasome-inhibitor treatment, Dr. Christoph Driessen of Kantonsspital St. Gallen (Switzerland) and colleagues reported in Haematologica.
The researchers had hypothesized that nelfinavir would induce the unfolded protein response and would overcome proteasome-inhibitor resistance. The researchers determined a nelfinavir dose of 2,500 mg twice daily based on a dose-finding study in 12 patients with advanced hematologic malignancies.

In an exploratory extension cohort trial that followed, six patients with relapsed, bortezomib-refractory, lenalidomide-resistant myeloma were treated with 2,500 mg of nelfinavir twice daily in combination with bortezomib; three reached a partial response, two had a minor response, and one had progressive disease. All began the investigational therapy less than 2 months after progressing under therapies with bortezomib/bendamustine/dexamethasone, bortezomib/bendamustine, or bortezomib monotherapy, respectively, the researchers said (Haematologica March 2016;101:346-55).
The study protocol did not allow dexamethasone co-administration until completion of cycle three, when patients who did not achieve a minor response were allowed to co-administer 8 mg dexamethasone with bortezomib. Higher doses were excluded because of potential interactions with nelfinavir through the Cyp3A4 system.
Future research should assess whether bortezomib may be replaced by next-generation drugs like carfilzomib to avoid drug interactions and improve activity and whether nelfinavir may likewise be used in combination with novel oral proteasome inhibitors to boost their low single agent activity. “This ultimately suggests exploring the addition of HIV protease inhibitors to established combinations of proteasome inhibitors with immunomodulatory drugs, for example, in the carfilzomib/lenalidomide/dexamethasone regimen, one of the most powerful and tolerable regimens available to date for advanced multiple myeloma,” they concluded.
On Twitter @maryjodales
The protease inhibitor nelfinavir was used successfully to resensitize patients with proteasome inhibitor–refractory multiple myeloma for proteasome-inhibitor treatment, Dr. Christoph Driessen of Kantonsspital St. Gallen (Switzerland) and colleagues reported in Haematologica.
The researchers had hypothesized that nelfinavir would induce the unfolded protein response and would overcome proteasome-inhibitor resistance. The researchers determined a nelfinavir dose of 2,500 mg twice daily based on a dose-finding study in 12 patients with advanced hematologic malignancies.
In an exploratory extension cohort trial that followed, six patients with relapsed, bortezomib-refractory, lenalidomide-resistant myeloma were treated with 2,500 mg of nelfinavir twice daily in combination with bortezomib; three reached a partial response, two had a minor response, and one had progressive disease. All began the investigational therapy less than 2 months after progressing under therapies with bortezomib/bendamustine/dexamethasone, bortezomib/bendamustine, or bortezomib monotherapy, respectively, the researchers said (Haematologica March 2016;101:346-55).
The study protocol did not allow dexamethasone co-administration until completion of cycle three, when patients who did not achieve a minor response were allowed to co-administer 8 mg dexamethasone with bortezomib. Higher doses were excluded because of potential interactions with nelfinavir through the Cyp3A4 system.
Future research should assess whether bortezomib may be replaced by next-generation drugs like carfilzomib to avoid drug interactions and improve activity and whether nelfinavir may likewise be used in combination with novel oral proteasome inhibitors to boost their low single agent activity. “This ultimately suggests exploring the addition of HIV protease inhibitors to established combinations of proteasome inhibitors with immunomodulatory drugs, for example, in the carfilzomib/lenalidomide/dexamethasone regimen, one of the most powerful and tolerable regimens available to date for advanced multiple myeloma,” they concluded.
On Twitter @maryjodales
FROM HAEMATOLOGIA
Key clinical point: Adding HIV protease inhibitors to established combinations of proteasome inhibitors may improve outcomes in patients with multiple myeloma.
Major finding: When six patients with relapsed, bortezomib-refractory, lenalidomide-resistant myeloma were treated with 2,500 mg of nelfinavir twice daily in combination with bortezomib, three reached a partial response, two had a minor response, and disease progressed in one.
Data source: A dose-finding study in 12 patients with advanced hematologic malignancies and an exploratory extension cohort trial that followed.
Disclosures: None of the authors had financial conflicts of interest in relation to the study.