User login
Seasonal flu holding strong in New Jersey
The 2015-2016 seasonal influenza virus has gotten hold of New Jersey and just won’t let go, according to the latest data from the Centers for Disease Control and Prevention.
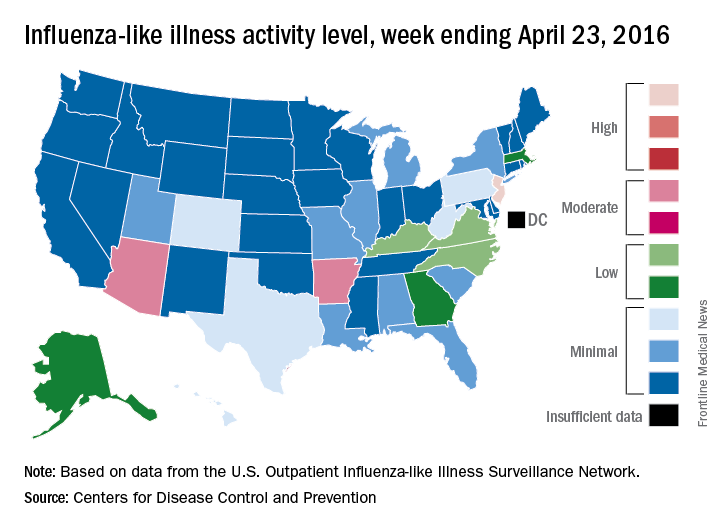
For the week ending April 23, 2016, influenza-like illness (ILI) activity in the United States remained at level 10 on the CDC’s 1-10 scale for the 11th consecutive week, even as the country’s overall proportion of outpatient visits for ILI dropped to 2.0%, which is below the national baseline of 2.1%, the CDC reported.

Two other states – Arizona and Arkansas – joined New Jersey in bucking the trend of decreasing ILI activity, as both moved up to level 7 and the high end of the “moderate” range. Arizona had been at level 5 the week before, while Arkansas was at level 4. No other state was above level 5 for the most recent week, and 27 states were at level 1, data from the CDC’s Influenza-like Illness Surveillance Network (ILINet) show.
Four flu-related pediatric deaths were reported during the week ending April 23, only one of which occurred that week. The total number of pediatric deaths rose to 60 for the 2015-2016 season, with 27 states and Puerto Rico reporting deaths so far, the CDC noted.
The CDC also reported a cumulative influenza-associated hospitalization rate for the season of 29.8 such hospitalizations per 100,000 population. This data was based on 8,239 laboratory-confirmed influenza-associated hospitalizations reported between October 1, 2015 and April 23, 2016. The highest rate of hospitalization was among adults aged 65 years or older (79.6 per 100,000 population), followed by adults aged 50-64 (43.1 per 100,000 population) and children aged 0-4 years (40.5 per 100,000 population). Among all hospitalizations, 6,254 (75.9%) were associated with influenza A, 1,905 (23.1%) with influenza B, 41 (0.5%) with influenza A and B co-infection, and 39 (0.5%) had no virus type information.
The 2015-2016 seasonal influenza virus has gotten hold of New Jersey and just won’t let go, according to the latest data from the Centers for Disease Control and Prevention.
For the week ending April 23, 2016, influenza-like illness (ILI) activity in the United States remained at level 10 on the CDC’s 1-10 scale for the 11th consecutive week, even as the country’s overall proportion of outpatient visits for ILI dropped to 2.0%, which is below the national baseline of 2.1%, the CDC reported.
Two other states – Arizona and Arkansas – joined New Jersey in bucking the trend of decreasing ILI activity, as both moved up to level 7 and the high end of the “moderate” range. Arizona had been at level 5 the week before, while Arkansas was at level 4. No other state was above level 5 for the most recent week, and 27 states were at level 1, data from the CDC’s Influenza-like Illness Surveillance Network (ILINet) show.
Four flu-related pediatric deaths were reported during the week ending April 23, only one of which occurred that week. The total number of pediatric deaths rose to 60 for the 2015-2016 season, with 27 states and Puerto Rico reporting deaths so far, the CDC noted.
The CDC also reported a cumulative influenza-associated hospitalization rate for the season of 29.8 such hospitalizations per 100,000 population. This data was based on 8,239 laboratory-confirmed influenza-associated hospitalizations reported between October 1, 2015 and April 23, 2016. The highest rate of hospitalization was among adults aged 65 years or older (79.6 per 100,000 population), followed by adults aged 50-64 (43.1 per 100,000 population) and children aged 0-4 years (40.5 per 100,000 population). Among all hospitalizations, 6,254 (75.9%) were associated with influenza A, 1,905 (23.1%) with influenza B, 41 (0.5%) with influenza A and B co-infection, and 39 (0.5%) had no virus type information.
Aripiprazole linked to rare but serious compulsion problems
Rare but serious instances of impulse control problems have been reported in people taking the antipsychotic drug aripiprazole, according to a May 3 press release from the Food and Drug Administration.
Pathological gambling is listed as a side effect of aripiprazole (Abilify, Abilify Maintena, Aristada, and generics). Additional side effects seen in patients include compulsive eating, shopping, and sexual actions. The symptoms are rare but can affect anyone taking the medication and can result in serious harm to the patient.

All compulsive symptoms stopped when patients stopped taking aripiprazole or reduced their dosage. The FDA will add new warnings about the symptoms to all drug labels and patient medication guides.
“Health care professionals should make patients and caregivers aware of the risk of these uncontrollable urges when prescribing aripiprazole, and specifically ask patients about any new or increasing urges while they are being treated with aripiprazole. Closely monitor for new or worsening uncontrollable urges in patients at higher risk for impulse control problems,” the FDA said in the press release.
Find the full press release on the FDA website.
Rare but serious instances of impulse control problems have been reported in people taking the antipsychotic drug aripiprazole, according to a May 3 press release from the Food and Drug Administration.
Pathological gambling is listed as a side effect of aripiprazole (Abilify, Abilify Maintena, Aristada, and generics). Additional side effects seen in patients include compulsive eating, shopping, and sexual actions. The symptoms are rare but can affect anyone taking the medication and can result in serious harm to the patient.
All compulsive symptoms stopped when patients stopped taking aripiprazole or reduced their dosage. The FDA will add new warnings about the symptoms to all drug labels and patient medication guides.
“Health care professionals should make patients and caregivers aware of the risk of these uncontrollable urges when prescribing aripiprazole, and specifically ask patients about any new or increasing urges while they are being treated with aripiprazole. Closely monitor for new or worsening uncontrollable urges in patients at higher risk for impulse control problems,” the FDA said in the press release.
Find the full press release on the FDA website.

Vedolizumab use linked to high rate of postoperative complications in IBD patients
LOS ANGELES – Overall, 44% of inflammatory bowel disease (IBD) patients on vedolizumab had some form of infectious complication following intra-abdominal or anorectal surgery, results from a small single-center study suggest.
According to lead study author Dr. Samuel Eisenstein, there are currently no published surgical outcomes of patients receiving vedolizumab, an integrin receptor antagonist which was approved in May 2014 for the treatment of adults with moderate to severe ulcerative colitis as well as those with moderate to severe Crohn’s disease. “We’re not trying to alienate people who are proponents of the medication,” Dr. Eisenstein said in an interview in advance of the annual meeting of the American Society of Colon and Rectal Surgeons. “It’s an effective medication for treating Crohn’s and ulcerative colitis. We need to have a high index of suspicion that patients may have complications after these surgeries and to treat them with caution until we have better data.”

Dr. Eisenstein and his associates in the section of colon and rectal surgery at Moores Cancer Center, University of California, San Diego, Health System, retrospectively analyzed the medical records of 26 patients with IBD who underwent intra-abdominal or anorectal surgery at the center following treatment with vedolizumab. The patients underwent a total of 36 operations: 27 that were intra-abdominal and 9 that were anorectal. Their mean age was 31 years and 46% were female.
Dr. Eisenstein reported that 17 of the 26 patients (65%) had a Clavien-Dindo grade II or greater complication following 19 operations. In all, 26 complications occurred following these 19 operations, and 53% were infectious in nature. The overall rate of infectious complications following any operation was 44%. In addition, the rate of anastomotic leak was 15%, and two patients died from culture-negative sepsis following abdominal surgery, for an overall mortality rate of 7.7%.
The researchers also observed that there were 23 visits to the emergency room following surgery and 10 hospital readmissions. The only preoperative characteristics that differed significantly between patients who had complications and those who did not were level of hemoglobin (10.6 g/dL vs. 11.9 g/dL, respectively; P = .02) and platelet count (349 vs. 287 K/mm3; P = .025). No differences in the rate of complications were observed based on the number of biologic medications each patient failed prior to the initiation of vedolizumab (P = .718). Compared with patients who had no postoperative complications, those who did were more likely to have undergone intra-abdominal surgery (17 vs. 10 patients; P = .034), require postoperative transfusion (4 vs. none; P = .045), visit the emergency department (10 vs. none; P less than .001), or require hospital readmission (10 vs. none; P less than .001).
Dr. Eisenstein acknowledged certain limitations of the study including its small sample size, single-center, retrospective design, and the potential for selection bias. “The patients who were getting vedolizumab are the patients who failed all of the anti-TNFs, so we’re really selecting patients with the worst, most medically refractory disease,” he noted. “Because of that we can’t say for sure [if the complications] are due to their severity of disease or due to the medication itself.”
The data are “preliminary and retrospectively analyzed, but there is some concern that patients on these types of medications may have an increased risk of postoperative complications,” he concluded. “What we really need are bigger studies. To that end, we are actually starting an IBD collaborative based on some of the findings we have here, because we really want to analyze these data over a much larger population of patients.”
The researchers reported having no financial disclosures.
LOS ANGELES – Overall, 44% of inflammatory bowel disease (IBD) patients on vedolizumab had some form of infectious complication following intra-abdominal or anorectal surgery, results from a small single-center study suggest.
According to lead study author Dr. Samuel Eisenstein, there are currently no published surgical outcomes of patients receiving vedolizumab, an integrin receptor antagonist which was approved in May 2014 for the treatment of adults with moderate to severe ulcerative colitis as well as those with moderate to severe Crohn’s disease. “We’re not trying to alienate people who are proponents of the medication,” Dr. Eisenstein said in an interview in advance of the annual meeting of the American Society of Colon and Rectal Surgeons. “It’s an effective medication for treating Crohn’s and ulcerative colitis. We need to have a high index of suspicion that patients may have complications after these surgeries and to treat them with caution until we have better data.”
Dr. Eisenstein and his associates in the section of colon and rectal surgery at Moores Cancer Center, University of California, San Diego, Health System, retrospectively analyzed the medical records of 26 patients with IBD who underwent intra-abdominal or anorectal surgery at the center following treatment with vedolizumab. The patients underwent a total of 36 operations: 27 that were intra-abdominal and 9 that were anorectal. Their mean age was 31 years and 46% were female.
Dr. Eisenstein reported that 17 of the 26 patients (65%) had a Clavien-Dindo grade II or greater complication following 19 operations. In all, 26 complications occurred following these 19 operations, and 53% were infectious in nature. The overall rate of infectious complications following any operation was 44%. In addition, the rate of anastomotic leak was 15%, and two patients died from culture-negative sepsis following abdominal surgery, for an overall mortality rate of 7.7%.
The researchers also observed that there were 23 visits to the emergency room following surgery and 10 hospital readmissions. The only preoperative characteristics that differed significantly between patients who had complications and those who did not were level of hemoglobin (10.6 g/dL vs. 11.9 g/dL, respectively; P = .02) and platelet count (349 vs. 287 K/mm3; P = .025). No differences in the rate of complications were observed based on the number of biologic medications each patient failed prior to the initiation of vedolizumab (P = .718). Compared with patients who had no postoperative complications, those who did were more likely to have undergone intra-abdominal surgery (17 vs. 10 patients; P = .034), require postoperative transfusion (4 vs. none; P = .045), visit the emergency department (10 vs. none; P less than .001), or require hospital readmission (10 vs. none; P less than .001).
Dr. Eisenstein acknowledged certain limitations of the study including its small sample size, single-center, retrospective design, and the potential for selection bias. “The patients who were getting vedolizumab are the patients who failed all of the anti-TNFs, so we’re really selecting patients with the worst, most medically refractory disease,” he noted. “Because of that we can’t say for sure [if the complications] are due to their severity of disease or due to the medication itself.”
The data are “preliminary and retrospectively analyzed, but there is some concern that patients on these types of medications may have an increased risk of postoperative complications,” he concluded. “What we really need are bigger studies. To that end, we are actually starting an IBD collaborative based on some of the findings we have here, because we really want to analyze these data over a much larger population of patients.”
The researchers reported having no financial disclosures.
AT THE ASCRS ANNUAL MEETING
Key clinical point:Patients on vedolizumab have a high rate of postoperative complications.
Major finding: The overall rate of infectious complications following intra-abdominal or anorectal surgery was 44%.
Data source: A retrospective study of 26 patients with IBD who underwent intra-abdominal or anorectal surgery following treatment with vedolizumab.
Disclosures: Dr. Eisenstein reported having no financial disclosures.

Fistula developed after delivery: $50M verdict
Fistula developed after delivery: $50M verdict
During delivery of a 31-year-old woman's baby, a nuchal cord was encountered. In order to safely deliver the child, the ObGyn performed an episiotomy.
After delivery, the patient reported an odorous vaginal discharge. The ObGyn explained that the condition was a natural byproduct of delivery and suggested that it would resolve without treatment.
The patient became pregnant a second time shortly after her first delivery and was evaluated by a midwife. The patient again reported the odorous discharge, but the condition was not addressed. At delivery of her second child, the ObGyn determined that the patient had a rectovaginal fistula. The patient underwent 13 repair operations.
PATIENT’S CLAIM:
The fistula was a byproduct of the episiotomy performed during the first delivery. The episiotomy should not have been performed. The ObGyn should have diagnosed and treated the fistula prior to delivery of the second child and performed a cesarean delivery.
DEFENDANT'S DEFENSE:
The ObGyn reported that the patient's medical records showed that she did not report the odorous discharge until after her second delivery.
VERDICT:
A New York $50 million verdict was returned.
Related article:
Management of wound complications following obstetric anal sphincter injury (OASIS)
Abdominal wall hematoma during pregnancy: $2.5M award
At 35 weeks' gestation, a 38-year-old woman presented to the emergency department (ED) with right upper abdominal pain. Her pregnancy was at high risk because of her age and the fact that she had thrombophilia involving both factor V and protein S deficiency. During pregnancy she was anticoagulated. She had been coughing from bronchitis, which was treated with antibiotics and an inhaler.
In the ED, laboratory testing determined that her blood was not properly clotting. Upper abdominal ultrasonography (US) showed an abdominal wall hematoma and gall stones. The ED physician, after contacting the on-call ObGyn, told the patient that nothing further could be done until after the baby's birth and prescribed medications for nausea and pain. The patient was discharged.
Thirty-three hours later, the patient was rushed to the hospital after she was found barely responsive, pale, and in severe pain. US results showed that the hematoma had grown extensively. The patient was in hypovolemic shock having lost more than 50% of her blood volume. She was admitted to the intensive care unit.
After induced labor, a stillborn son was delivered. The autopsy report revealed that the child died from either asphyxiation or an hypoxic ischemic event that occurred when the mother went into shock.
PATIENT’S CLAIM:
The ED physician and staff were negligent. Once the hematoma was identified, the standard of care is to monitor the hematoma with regular US. Instead, the ED physician discharged the patient. The ED physician contacted the on-call ObGyn but did not ask for a consult. The patient should have been admitted for monitoring.
DEFENDANT'S DEFENSE:
The ED physician met the standard of care. The mother's condition would likely have been detected during a nonstress test scheduled for the following day but the mother missed the prenatal exam because she had just left the hospital.
VERDICT:
A $2.5 million Missouri verdict was returned.
Incorrect due date, child with brain injuries: $1.2M
When a pregnant woman presented for her first prenatal visit, she was unsure of the date of her last menstrual period. During subsequent prenatal visits, she underwent 3 ultrasounds.
Labor was induced on August 1 because she reported gastrointestinal reflux. The infant appeared healthy at birth but soon went into respiratory distress. He was slow to meet developmental goals and was believed to be autistic. At age 5 years, he was given a diagnosis of periventricular leukomalacia.
PARENT’S CLAIM:
The child, 11 years old at the time of trial, has permanent brain injuries due to premature delivery. The mother's due date should have been projected as August 25 according to prenatal US measurements. The ObGyn misinterpreted the US data and estimated a due date of August 15. Therefore induction on August 1st caused him to be premature.
PHYSICIAN’S DEFENSE:
The standard of care was met. Gestational age evaluation using US is an estimate based on the child's size at specific time points, not an exact calculation, especially if the mother is not sure about the date of her last menses.
VERDICT:
A $1.2 million New Jersey verdict was returned.
Related article:
Three good apps for calculating the date of delivery
Bacterial infection blamed for birth injury
A woman was at 28 weeks' gestation when her membranes ruptured on September 28. She began to leak amniotic fluid and was put on bed rest. She saw her ObGyn on October 13 with signs of a bacterial infection of her membranes. The ObGyn decided to induce labor; a baby girl was born 11 hours later. The child had meningitis at birth and other infection-related complications including a brain hemorrhage. She continues to have permanent neurologic deficits.
PARENT’S CLAIM:
The ObGyn was negligent in not immediately delivering the child via cesarean delivery on October 13. The delay exposed the baby to infection for 11 more hours; the extended exposure led to her permanent injury.
PHYSICIAN’S DEFENSE:
The patient's treatment met the standard of care.
VERDICT:
A Virginia defense verdict was returned.
These cases were selected by the editors of OBG Management from Medical Malpractice Verdicts, Settlements & Experts, with permission of the editor, Lewis Laska (www.verdictslaska.com). The information available to the editors about the cases presented here is sometimes incomplete. Moreover, the cases may or may not have merit. Nevertheless, these cases represent the types of clinical situations that typically result in litigation and are meant to illustrate nationwide variation in jury verdicts and awards.
Share your thoughts! Send your Letter to the Editor to [email protected]. Please include your name and the city and state in which you practice.
Food allergy development linked to S. aureus colonization in children with AD
Staphylococcus aureus colonization is associated with development of food allergy in children with atopic dermatitis (AD), according to a letter to the editor from Dr. Andrea L. Jones and her associates.
In a study of 718 patients with AD, median food allergen–specific IgE levels to peanut were highest in patients with methicillin-resistant Staphylococcus aureus (MRSA) at 77.7 kilounits of allergen per liter. Patients with methicillin-sensitive S. aureus (MSSA) had median food allergen–specific IgE (sIgE) levels to peanut of 38.9 kUA/L, and patients without S. aureus had median sIgE levels to peanut of 4.3 kUA/L, below the 95% positive predictive value of oral food challenge reaction in patients of 14 kUA/L.
Total IgE levels were highest in AD patients with MRSA at 4,498 kU/L, but were also elevated in patients with MSSA at 2,709 kU/L, compared with 217 kU/L for patients without S. aureus colonization.
“Studies are needed to assess the association between S. aureus skin colonization and food allergy in patients with AD. Confirmation of our current observations opens up the possibility that therapy directed at eradicating S. aureus colonization will be important in the prevention of food allergen sensitization and possibly food allergy in patients with AD,” the investigators concluded.
Find the full letter in the Journal of Allergy and Clinical Immunology (2016 Apr. doi: 10.1016/j.jaci.2016.01.010).
FROM THE JOURNAL OF ALLERGY AND CLINICAL IMMUNOLOGY
For Patients With Myasthenia Gravis, Stem Cell Transplants May Lead to Long-Term Remission
A report on seven cases of severe myasthenia gravis suggests that autologous hematopoietic stem cell transplantation (HSCT) may result in long-term remission. The report was published online April 4 in JAMA Neurology.
In this retrospective study, each patient who underwent autologous HSCT from January 1, 2001, through December 31, 2014, in the Ottawa Hospital Bone Marrow Transplant Programme Database was observed. Lead author Adam Bryant, MD, of the Division of Hematology at the University of Ottawa, Canada, and colleagues reported that every patient who received HSCT experienced relief of symptoms and a prolonged period of treatment-free remission. Prior to treatment, the condition of each patient in the study was labeled as moderate (grade III) to life threatening (grade V) by the Myasthenia Gravis Foundation of America's classification system.
Treatment consisted of high-dose chemotherapy and antilymphocyte antibodies to eliminate the autoreactive immune system, followed by an infusion of stem cells previously harvested from the patient. No unexpected acute toxic effects were observed, no patient was admitted to the ICU for treatment-related effects, and there were no treatment-related deaths. Viral reactivation occurred in three patients (43%) as a result of the initial immune dysregulation.
This study suggests that autologous HSCT is rigorous enough to eliminate autoreactivity and that it re-establishes a long-lasting immune system that is functional and self-tolerant, thus eliminating the need for maintenance immunosuppression or additional treatment, the researchers said. HSCT has effectively treated other severe autoimmune neurologic conditions and maybe an option for patients with myasthenia gravis who do not respond to conventional treatment.
In an accompanying editorial, Daniel Drachman, MD, of the Johns Hopkins School of Medicine in Baltimore, explained that HSCT "is a major undertaking, involving skilled and experienced management, hospitalization, and important risks."
Current therapies used for myasthenia gravis, including cyclophosphamide and monoclonal antibodies like rituximab, have led to clinical improvement, but complete remission, as was seen with HSCT, is rare.
—Adaeze Stephanie Onyechi
Suggested Reading
Bryant A, Atkins H, Pringle CE, et al. Myasthenia gravis treated with autologous hematopoietic stem cell transplantation. JAMA Neurol. 2016 April 4 [Epub ahead of print].
Drachman DB. Treatment for refractory myasthenia gravis—new lymphs for old. JAMA Neurol. 2016 April 4 [Epub ahead of print].
A report on seven cases of severe myasthenia gravis suggests that autologous hematopoietic stem cell transplantation (HSCT) may result in long-term remission. The report was published online April 4 in JAMA Neurology.
In this retrospective study, each patient who underwent autologous HSCT from January 1, 2001, through December 31, 2014, in the Ottawa Hospital Bone Marrow Transplant Programme Database was observed. Lead author Adam Bryant, MD, of the Division of Hematology at the University of Ottawa, Canada, and colleagues reported that every patient who received HSCT experienced relief of symptoms and a prolonged period of treatment-free remission. Prior to treatment, the condition of each patient in the study was labeled as moderate (grade III) to life threatening (grade V) by the Myasthenia Gravis Foundation of America's classification system.
Treatment consisted of high-dose chemotherapy and antilymphocyte antibodies to eliminate the autoreactive immune system, followed by an infusion of stem cells previously harvested from the patient. No unexpected acute toxic effects were observed, no patient was admitted to the ICU for treatment-related effects, and there were no treatment-related deaths. Viral reactivation occurred in three patients (43%) as a result of the initial immune dysregulation.
This study suggests that autologous HSCT is rigorous enough to eliminate autoreactivity and that it re-establishes a long-lasting immune system that is functional and self-tolerant, thus eliminating the need for maintenance immunosuppression or additional treatment, the researchers said. HSCT has effectively treated other severe autoimmune neurologic conditions and maybe an option for patients with myasthenia gravis who do not respond to conventional treatment.
In an accompanying editorial, Daniel Drachman, MD, of the Johns Hopkins School of Medicine in Baltimore, explained that HSCT "is a major undertaking, involving skilled and experienced management, hospitalization, and important risks."
Current therapies used for myasthenia gravis, including cyclophosphamide and monoclonal antibodies like rituximab, have led to clinical improvement, but complete remission, as was seen with HSCT, is rare.
—Adaeze Stephanie Onyechi
Suggested Reading
Bryant A, Atkins H, Pringle CE, et al. Myasthenia gravis treated with autologous hematopoietic stem cell transplantation. JAMA Neurol. 2016 April 4 [Epub ahead of print].
Drachman DB. Treatment for refractory myasthenia gravis—new lymphs for old. JAMA Neurol. 2016 April 4 [Epub ahead of print].
Ectopic pregnancy misdiagnosed

Ectopic pregnancy misdiagnosed
When a patient called her ObGyn (Dr. A) to report that she was 6 weeks' pregnant and had lower abdominal pain, she was seen by his partner (Dr. B). Dr. B could not identify an intrauterine pregnancy using ultrasonography (US), but the patient's hCG level was highly suggestive of an ectopic pregnancy. The next day, Dr. B performed exploratory laparoscopy, found no evidence of an ectopic pregnancy, and removed the patient's appendix. He continued to be concerned about the possibility of an ectopic pregnancy and suggested that the patient terminate the pregnancy. The next day he prescribed methotrexate. A week later, US revealed a fetus in utero with a beating heart. Because of the likelihood of birth defects after methotrexate use, Dr. B recommended terminating the pregnancy; an abortion was performed a month later.
PATIENT’S CLAIM:
Dr. B should have waited for the pathology report on the appendix and repeated the US before rushing into advising termination of pregnancy.
PHYSICIAN’S CLAIM :
Dr. B acted reasonably based on the patient's symptoms.
VERDICT:
A Kentucky defense verdict was returned.
Related article:
Stop using the hCG discriminatory zone of 1,500 to 2,000 mIU/mL to guide intervention during early pregnancy
Hemorrhage after trocar insertion
A gynecologist performed laparoscopic hysterectomy on his 46-year-old patient. During trocar insertion, the patient's iliac artery, iliac vein, and small bowel were injured. The patient hemorrhaged and went into cardiac arrest. The patient was given several transfusions and the injuries were repaired.
One day after discharge, she returned to the hospital with symptoms of an embolism; she was treated with anticoagulants for 1 year. A year after surgery, she was informed that she was transfused during surgery with HIV-positive blood. Her initial HIV test came back negative.
PATIENT’S CLAIM:
The gynecologist deviated from the standard of care by performing a "blind" trocar insertion, which caused the major vessels to be more susceptible to injury.
PHYSICIAN’S DEFENSE:
There was no deviation from the standard of care. Blind insertion of a trocar is an acceptable procedure.
VERDICT:
A $383,000 Illinois verdict was returned.
Related article:
How to avoid major vessel injury during gynecologic laparoscopy
Delay in ovarian cancer diagnosis: $1.9M settlement
A 64-year-old woman reported worsening abdominal pain, fatigue, and unexplained weight loss to her primary care physician. The physician did not order tests to assess the patient's status; he diagnosed gastritis. Several months later the patient saw another physician, who ordered imaging and identified stage IV ovarian clear cell carcinoma.
PATIENT’S CLAIM:
Timely imaging would have diagnosed ovarian cancer at stage I or II and given her a 90% survival rate at 10 years. Due to the diagnostic delay, her survival rate was less than 10% at 10 years.
PHYSICIAN’S DEFENSE:
The case settled before trial.
VERDICT:
A $1.9 million Illinois settlement was reached.
Late breast cancer diagnosis: $1.7M settlement
When a 25-year-old woman found a lump in her left breast she saw her gynecologist, who recommended US and fine-needle aspiration biopsy. US results indicated possible cancer; biopsy results were reported as negative for cancer. No further action was taken.
Eight months later, a second physician diagnosed stage IV breast cancer requiring chemotherapy, radiation therapy, and multiple surgeries.
PATIENT’S CLAIM:
The radiologist misread the fine-needle aspiration biopsy results. The gynecologist should have ordered a core needle biopsy because it is more reliable.
PHYSICIAN’S DEFENSE:
The case was settled during the trial.
VERDICT:
A $3.5 million Illinois settlement was reached.
Perforated colon after oophorectomy
A 55-year-old woman underwent laparoscopic oophorectomy to address pelvic pain and a right ovarian mass. Following surgery she developed peritonitis and sepsis. She underwent a colon resection with colostomy and had severe keloid scarring.
PATIENT’S CLAIM:
The surgeon was well aware of her history of extensive pelvic adhesions. Given her medical history, he should have performed an open laparotomy.
PHYSICIAN’S DEFENSE:
The case settled during trial.
VERDICT:
A $700,000 Illinois settlement was reached.
These cases were selected by the editors of OBG Management from Medical Malpractice Verdicts, Settlements & Experts, with permission of the editor, Lewis Laska (www.verdictslaska.com). The information available to the editors about the cases presented here is sometimes incomplete. Moreover, the cases may or may not have merit. Nevertheless, these cases represent the types of clinical situations that typically result in litigation and are meant to illustrate nationwide variation in jury verdicts and awards.
Share your thoughts! Send your Letter to the Editor to [email protected]. Please include your name and the city and state in which you practice.
The New Face of Personalized Medicine in Headache Therapy
RIVIERA BEACH, FL—“How do we take care of patients in 2016?” asked Robert Cowan, MD, at the 43rd Annual Meeting of the Southern Clinical Neurological Society. “We’re using the same model for healthcare delivery we have been using since 2500 BC,” he said. In headache medicine, a patient starts out with a headache and goes to see a primary care doctor. Based on the fund of knowledge that the doctor has in headache, he or she will come up with what hopefully is a reasonable differential diagnosis, work-up, and treatment plan. This approach may be successful or it may not. If it isn’t successful, more time will elapse before the patient is referred to a neurologist or headache specialist.

Robert Cowan, MD
At Stanford University, where Dr. Cowan is a Professor of Neurology, they looked at the patients coming in for headache care. “On average, it took 18 months from the time they went to their primary care doctor with a complaint of headache to the time they were seen at Stanford,” Dr. Cowan said. Eighteen months and a cost of around $12,000, he added.
There are just over 500 board-certified headache specialists in the United States. There are about 60 million people with headache, about 37 million people with migraine, and about 4% of those patients have chronic migraine. “Right now there are not enough specialists,” Dr. Cowan said. “The challenges are economic, geographical, and institutional.” And in some areas of the world, the situation is far worse.
Beyond the problem of scale—the patient population versus the health care providers available to diagnose and treat them—there is, according to Dr. Cowan, a triage problem. Which patients with headache are easily managed and which ones require specialist care? “To be seen at Stanford, there is about a three-month wait right now, despite the fact that we have six board-certified headache specialists in our division,” Dr. Cowan said. “We don’t have effective ways of triaging from primary care through subspecialists.” The solution has been to try to turn primary care doctors into specialists. “It doesn’t make sense to keep turning to the primary care doctor as a gatekeeper for every patient.”
From a time-management and economic perspective, headache care can be viewed as neurology’s loss leader. “On average, a physician spends seven to 20 minutes with a patient,” Dr. Cowan said. “With a complex patient, I can’t get a decent history in an hour. I don’t know how I can get a decent history in seven minutes. If I’m practicing in India or China, I have 2.5 minutes to get a decent history and formulate a treatment plan. There is a disincentive to provide good care. If you are a fee-for-service physician, spending more time costs you money. If you are a salary-based physician, why would you want to see more patients per day? We don’t have great incentives for physicians to fix this.”
Online Patient Prescreening
Technology can help address some of these problems. One solution is prescreening, Dr. Cowan said. “We can collect data before the patient gets the appointment.” Dr. Cowan, Alan Rapoport, MD, and Jim Blythe, PhD, have created a detailed online questionnaire that is very detailed. It takes, in general, about an hour to complete. It generates a narrative report that is tied to a rule engine. The elements in the patient history are compared with International Classification of Headache Disorders (ICHD) diagnostic criteria, and a clinical impression similar to a differential diagnosis is generated. It documents diagnostic red flags, medication history, and other elements. For example, “There are elements in your history that suggest you may have a secondary headache. Here they are. You might want to discuss these with your physician.” The patient can either send that report electronically to his or her primary care physician or print it out as a PDF and carry it. The questionnaire can also be done with voice activation over the phone and faxed to the clinic—a benefit in countries without access to computers or smartphones. One benefit of this online tool is that it saves the physician the time of having to ask basic questions that are already covered in the narrative report.
The online questionnaire Dr. Cowan referred to is part of BonTriage, a start-up he and Drs. Rapoport and Blythe created. It is designed to help triage and monitor patients with headache and bring specialized care to underserved patient populations. At present, the service is free to patients.
“This is not intended as a replacement for an in-person history,” Dr. Cowan said. “But it does save a lot of time. The other advantage of it is that you have expert opinion in advance of the visit. You’ve got a differential that you know is tied to hard data.”
Automated Patient Monitoring
Technology can also facilitate patient monitoring between office visits. There are apps in development that give patients a push notification on their phone—a text message—that asks, “Did you have a headache today?” A yes or no response is recorded and, as appropriate, additional questions are asked. For example, “Did you have trigger exposures?” Some patients say, “My headaches are tied to the weather. I have no control over them.” The same app includes technology to monitor barometric pressure changes, so correlations can be drawn between headaches and weather changes. Another example is sleep. “Every smartphone can monitor your sleep. If you have an iPhone, it has that technology in it. If you put the phone under your pillow it can tell you, using movement as a correlation, how well you slept,” Dr. Cowan said. “It is not as good as a sleep study, but it will, at least, in general terms, tell you if you had good quality sleep.” That data can then be correlated with headache days.
Predictive Modeling
Predictive modeling is also currently available. An iPhone can provide a push notification that says, “You didn’t sleep well last night, there’s a storm front coming in, you might want to skip red wine with dinner because all of these are risk factors for you.” Wearable technology such as Fitbit or Up can monitor heart rate variability and other autonomic changes and suggest that there is an imminent migraine ahead. “By imminent, I mean within the next hour,” Dr. Cowan said. If patients were wearing something similar to the Zecuity patch, they could actually have their phone say, “You’ve got a headache coming, do you want medication?” If the patient responds yes, the patch could be activated and medication delivered. “This is off-the-shelf technology that is available now that we don’t take advantage of,” Dr. Cowan said.
“The app that I was just describing can send information to the cloud that can then be accessed by the physician at any point. For example, the physician could receive an email saying, ‘Patient X had 13 headache days this month, and it is only the 13th day of the month. Last month, she had 13 headache days in the whole month. She had five triptan days last month, already nine triptan days this month. Things are not going well.’” Alerts can be generated. “It is possible to monitor patients in real time without having to bring them into the office,” Dr. Cowan said.
Also in development is a calendar app that can correlate data at the end of each month and generate a printout that can, for example, observe, “More headaches this month. Not responding to acute care medication.” The treating physician can then say, “More headaches? Preventive medicine. Not responding? Change the acute care.” And those clinical decisions can be based on the patient’s own personal data.
Patient Compliance
Technology can also help increase compliance. A company called Proteus has an ingestible sensor that can be put on any pill. When the pill reaches the stomach, the sensor sends a message to a smartphone and the cloud. “So, compliance is no longer subjective. You can actually see when patients are taking their medications and tie that information to data from a wearable device and information entered by the patient,” Dr. Cowan said. This technology is also capable of sending messages to patients saying, when appropriate, “Missed your pill. You might want to take that pill.”
In summary, Dr. Cowan said, “That’s a glimpse as to where we are and what is just around the corner. Everything I described could be happening for every patient today. It is not, but this is what we can do technologically.”
—Glenn S. Williams
RIVIERA BEACH, FL—“How do we take care of patients in 2016?” asked Robert Cowan, MD, at the 43rd Annual Meeting of the Southern Clinical Neurological Society. “We’re using the same model for healthcare delivery we have been using since 2500 BC,” he said. In headache medicine, a patient starts out with a headache and goes to see a primary care doctor. Based on the fund of knowledge that the doctor has in headache, he or she will come up with what hopefully is a reasonable differential diagnosis, work-up, and treatment plan. This approach may be successful or it may not. If it isn’t successful, more time will elapse before the patient is referred to a neurologist or headache specialist.
Robert Cowan, MD
At Stanford University, where Dr. Cowan is a Professor of Neurology, they looked at the patients coming in for headache care. “On average, it took 18 months from the time they went to their primary care doctor with a complaint of headache to the time they were seen at Stanford,” Dr. Cowan said. Eighteen months and a cost of around $12,000, he added.
There are just over 500 board-certified headache specialists in the United States. There are about 60 million people with headache, about 37 million people with migraine, and about 4% of those patients have chronic migraine. “Right now there are not enough specialists,” Dr. Cowan said. “The challenges are economic, geographical, and institutional.” And in some areas of the world, the situation is far worse.
Beyond the problem of scale—the patient population versus the health care providers available to diagnose and treat them—there is, according to Dr. Cowan, a triage problem. Which patients with headache are easily managed and which ones require specialist care? “To be seen at Stanford, there is about a three-month wait right now, despite the fact that we have six board-certified headache specialists in our division,” Dr. Cowan said. “We don’t have effective ways of triaging from primary care through subspecialists.” The solution has been to try to turn primary care doctors into specialists. “It doesn’t make sense to keep turning to the primary care doctor as a gatekeeper for every patient.”
From a time-management and economic perspective, headache care can be viewed as neurology’s loss leader. “On average, a physician spends seven to 20 minutes with a patient,” Dr. Cowan said. “With a complex patient, I can’t get a decent history in an hour. I don’t know how I can get a decent history in seven minutes. If I’m practicing in India or China, I have 2.5 minutes to get a decent history and formulate a treatment plan. There is a disincentive to provide good care. If you are a fee-for-service physician, spending more time costs you money. If you are a salary-based physician, why would you want to see more patients per day? We don’t have great incentives for physicians to fix this.”
Online Patient Prescreening
Technology can help address some of these problems. One solution is prescreening, Dr. Cowan said. “We can collect data before the patient gets the appointment.” Dr. Cowan, Alan Rapoport, MD, and Jim Blythe, PhD, have created a detailed online questionnaire that is very detailed. It takes, in general, about an hour to complete. It generates a narrative report that is tied to a rule engine. The elements in the patient history are compared with International Classification of Headache Disorders (ICHD) diagnostic criteria, and a clinical impression similar to a differential diagnosis is generated. It documents diagnostic red flags, medication history, and other elements. For example, “There are elements in your history that suggest you may have a secondary headache. Here they are. You might want to discuss these with your physician.” The patient can either send that report electronically to his or her primary care physician or print it out as a PDF and carry it. The questionnaire can also be done with voice activation over the phone and faxed to the clinic—a benefit in countries without access to computers or smartphones. One benefit of this online tool is that it saves the physician the time of having to ask basic questions that are already covered in the narrative report.
The online questionnaire Dr. Cowan referred to is part of BonTriage, a start-up he and Drs. Rapoport and Blythe created. It is designed to help triage and monitor patients with headache and bring specialized care to underserved patient populations. At present, the service is free to patients.
“This is not intended as a replacement for an in-person history,” Dr. Cowan said. “But it does save a lot of time. The other advantage of it is that you have expert opinion in advance of the visit. You’ve got a differential that you know is tied to hard data.”
Automated Patient Monitoring
Technology can also facilitate patient monitoring between office visits. There are apps in development that give patients a push notification on their phone—a text message—that asks, “Did you have a headache today?” A yes or no response is recorded and, as appropriate, additional questions are asked. For example, “Did you have trigger exposures?” Some patients say, “My headaches are tied to the weather. I have no control over them.” The same app includes technology to monitor barometric pressure changes, so correlations can be drawn between headaches and weather changes. Another example is sleep. “Every smartphone can monitor your sleep. If you have an iPhone, it has that technology in it. If you put the phone under your pillow it can tell you, using movement as a correlation, how well you slept,” Dr. Cowan said. “It is not as good as a sleep study, but it will, at least, in general terms, tell you if you had good quality sleep.” That data can then be correlated with headache days.
Predictive Modeling
Predictive modeling is also currently available. An iPhone can provide a push notification that says, “You didn’t sleep well last night, there’s a storm front coming in, you might want to skip red wine with dinner because all of these are risk factors for you.” Wearable technology such as Fitbit or Up can monitor heart rate variability and other autonomic changes and suggest that there is an imminent migraine ahead. “By imminent, I mean within the next hour,” Dr. Cowan said. If patients were wearing something similar to the Zecuity patch, they could actually have their phone say, “You’ve got a headache coming, do you want medication?” If the patient responds yes, the patch could be activated and medication delivered. “This is off-the-shelf technology that is available now that we don’t take advantage of,” Dr. Cowan said.
“The app that I was just describing can send information to the cloud that can then be accessed by the physician at any point. For example, the physician could receive an email saying, ‘Patient X had 13 headache days this month, and it is only the 13th day of the month. Last month, she had 13 headache days in the whole month. She had five triptan days last month, already nine triptan days this month. Things are not going well.’” Alerts can be generated. “It is possible to monitor patients in real time without having to bring them into the office,” Dr. Cowan said.
Also in development is a calendar app that can correlate data at the end of each month and generate a printout that can, for example, observe, “More headaches this month. Not responding to acute care medication.” The treating physician can then say, “More headaches? Preventive medicine. Not responding? Change the acute care.” And those clinical decisions can be based on the patient’s own personal data.
Patient Compliance
Technology can also help increase compliance. A company called Proteus has an ingestible sensor that can be put on any pill. When the pill reaches the stomach, the sensor sends a message to a smartphone and the cloud. “So, compliance is no longer subjective. You can actually see when patients are taking their medications and tie that information to data from a wearable device and information entered by the patient,” Dr. Cowan said. This technology is also capable of sending messages to patients saying, when appropriate, “Missed your pill. You might want to take that pill.”
In summary, Dr. Cowan said, “That’s a glimpse as to where we are and what is just around the corner. Everything I described could be happening for every patient today. It is not, but this is what we can do technologically.”
—Glenn S. Williams

FDA approves changing brand name of Brintellix to Trintellix
To avoid confusion with another drug, the Food and Drug Administration has approved a name change request for the antidepressant Brintellix (vortioxetine), according to a press release.
In a Medwatch alert in July 2015, the FDA noted that prescribing and dispensing errors had occurred because of the similarity in names of Brintellix and the blood thinner Brilinta (ticagrelor). Because of the large difference in purpose between the two drugs, Brintellix manufacturer Takeda Pharmaceuticals has renamed the drug to Trintellix, expected to become available in June 2016.
No additional changes will be made to the label or packaging of Trintellix, and the medicine will not change. Drug information content publishers and medication-related electronic system administrators should note that Trintellix will receive a new National Drug Code number.
“Health care professionals should check carefully to make sure they have prescribed or dispensed the correct medicine. During the transition to the new name change from Brintellix to Trintellix, prescribers can reduce the risk of name confusion by including the generic name of the medication they are ordering, in addition to the brand name and indication for use,” the FDA said in its press release.
Webcast: Providing LARC methods of contraception to adolescents
The video associated with this article is no longer available on this site. Please view all of our videos on the MDedge YouTube channel
Access Dr. Burkman's Webcasts on contraception:
- Emergency contraception: How to choose the right one for your patient
- Contraceptive considerations for women with headache and migraine
- Hormonal contraception and risk of venous thromboembolism
- Oral contraceptives and breast cancer: What’s the risk?
- Factors that contribute to overall contraceptive efficacy and risks
- Obesity and contraceptive efficacy and risks
- How to use the CDC's online tools to manage complex cases in contraception
Helpful resources for your practice:
- United States Medical Eligibility Criteria for Contraceptive Use, 2016
- United States Medical Eligibility Criteria (US MEC) for Contraceptive Use, 2010
- Summary Chart of US Medical Eligibility for Contraceptive Use
- Book recommendation: Allen RH, Cwiak CA, eds. Contraception for the medically challenging patient. New York, New York: Springer New York; 2014.