User login
New and Noteworthy Information—May 2016
Patients who have type 1 diabetes have an increased risk of developing epilepsy, according to a study published online ahead of print March 31 in Diabetologia. This study cohort included 2,568 patients with type 1 diabetes, each of whom was frequency-matched by sex, residence, and index year with 10 patients without type 1 diabetes. Cox proportional hazard regression analysis was conducted to estimate the effects of type 1 diabetes on epilepsy risk. After adjusting for potential confounders, the type 1 diabetes cohort was 2.84 times more likely to develop epilepsy than the control cohort. “Metabolic abnormalities of type 1 diabetes, such as hyperglycemia and hypoglycemia, may have a damaging effect on the central nervous system and be associated with significant long-term neurological sequelae,” said the authors.
Antipsychotics are associated with a significantly increased mortality risk in patients with Parkinson’s disease, after adjusting for measurable confounders, according to a study published online ahead of print March 21 in JAMA Neurology. This retrospective matched-cohort study used data from the fiscal years of 1999 to 2010. The rates of 180-day mortality were compared in 7,877 patients initiating antipsychotic therapy and in 7,877 patients who did not initiate antipsychotic therapy. Antipsychotic use was associated with more than twice the hazard ratio of death, compared with nonuse. The hazard ratio was significantly higher for patients who used typical versus atypical antipsychotics. Among the atypical antipsychotics used, hazard ratios relative to nonuse of antipsychotics were, in descending order, 2.79 for olanzapine, 2.46 for risperidone, and 2.16 for quetiapine fumarate.
White matter tracts related to regulation of sleep and wakefulness, and limbic cognitive and sensorimotor regions, are disrupted in the right brain in patients with primary insomnia, according to a study published online ahead of print April 5 in Radiology. Investigators used tract-based spatial statistics to compare changes in diffusion parameters of white matter tracts from 23 patients with primary insomnia and 30 healthy controls. They evaluated how accurately these changes could distinguish patients with insomnia from healthy controls. Patients with primary insomnia had lower fractional anisotropy values mainly in the right anterior limb of the internal capsule, the right posterior limb of the internal capsule, the right anterior corona radiata, the right superior corona radiata, the right superior longitudinal fasciculus, the body of the corpus callosum, and the right thalamus.
Among Chinese adults, a higher level of fruit consumption is associated with lower blood pressure and blood glucose levels and, largely independent of these and other factors, with significantly lower risks of major cardiovascular diseases, according to a study published April 7 in the New England Journal of Medicine. Between 2004 and 2008, researchers recruited 512,891 adults between ages 30 and 79 from 10 locations in China. In all, 5,173 deaths from cardiovascular disease, 2,551 incident major coronary events, 14,579 ischemic strokes, and 3,523 intracerebral hemorrhages were recorded among the 451,665 participants without a history of cardiovascular disease or antihypertensive treatments at baseline. The adjusted hazard ratios for daily consumption versus nonconsumption were 0.75 for ischemic stroke and 0.64 for hemorrhagic stroke.
A low level of leisure-time physical activity is independently associated with greater decline in cognitive performance over time, according to a study published online ahead of print March 23 in Neurology. Researchers assessed cognition in participants in the Northern Manhattan Study using a standard neuropsychologic examination. The neuropsychologic examination was repeated five years later and subcategorized using standardized z scores over validated domains. No or low levels of leisure-time physical activity were associated with worse executive function, semantic memory, and processing speed scores on the first neuropsychologic examination. The associations were slightly attenuated and not significant after adjusting for vascular risk factors. Cognitively unimpaired participants who reported no to low leisure-time physical activity versus moderate to high levels declined more over time in processing speed and episodic memory.
Participation in the “Sleep for Success” education program is associated with significant improvement in children’s sleep and academic performance, according to a study published in Sleep Medicine. Using a community-based participatory research approach, researchers composed a program of four modules that addressed the children, their family and community, the school staff, and decision-makers within the school setting. In all, 71 students participated in the evaluation of the program. The effectiveness of the program was evaluated using nonrandomized, controlled before-and-after study groups that were assessed at two time points. In the intervention group, true sleep was extended by 18.2 minutes per night, sleep efficiency improved by 2.3%, and sleep latency was shortened by 2.3 minutes. Report card grades also improved significantly in English and mathematics.
The combination of rosuvastatin, candesartan, and hydrochlorothiazide is associated with a significantly lower rate of cardiovascular events than dual placebo in people who do not have cardiovascular disease, according to a study published online ahead of print April 2 in the New England Journal of Medicine. Researchers randomly assigned 12,705 participants at intermediate risk who did not have cardiovascular disease to 10 mg/day of rosuvastatin or placebo, and to 16 mg/day of candesartan, plus 12.5 mg/day of hydrochlorothiazide or placebo. The decrease in the low-density lipoprotein cholesterol level was 33.7 mg/dL greater in the combined-therapy group than in the dual-placebo group, and the decrease in systolic blood pressure was 6.2 mm Hg greater with combined therapy than with dual placebo.
Right hemisphere white matter integrity is related to speech fluency measures in patients with chronic aphasia, according to a study published online ahead of print March 30 in Neurology. The study included 33 people with an average age of 58 who had a stroke on the left side of their brain. Fractional anisotropy values for the right middle temporal gyrus, precentral gyrus, and pars opercularis significantly predicted speech fluency, but fractional anisotropy values of the pars triangularis and superior parietal lobule did not. A multiple regression analysis showed that combining fractional anisotropy of the significant right hemisphere regions with the lesion load of the left arcuate fasciculus provided the best model for predicting speech fluency. Fractional anisotropy of corpus callosum fibers connecting left and right supplementary motor areas was also correlated with speech fluency.
Differences in white matter microstructure may partially account for the variance in functional outcomes among veterans with combat-related mild traumatic brain injury (mTBI), according to a study published online ahead of print March 29 in Radiology. From 2010 to 2013, an initial post deployment evaluation, including clinical assessment and brain MRI with diffusion tensor imaging, was performed in combat veterans who sustained mTBI while deployed. Veterans who did and did not return to work were also compared for differences in clinical variables by using t and χ2 tests. After a mean follow-up of 1.4 years, 34 of 57 veterans had returned to work. Cumulative health care visits over time were inversely correlated with diffusion anisotropy of the splenium of the corpus callosum and adjacent parietal white matter.
Cognitive status and intelligibility may be associated with everyday communicative outcomes in Parkinson’s disease, according to a study published online ahead of print March 16 in the Journal of Parkinson’s Disease. Investigators searched five online databases in May 2015 and also conducted supplementary searches. In all, 4,816 records were identified through database searches, and 16 additional records were identified through supplementary searches. Forty-one articles were suitable for full-text screening, and 15 articles met the eligibility criteria. Ten studies assessed the role of cognitive status, and nine found that participants with greater cognitive impairment had greater everyday communication difficulties. Four studies assessed the role of intelligibility, and all found that participants with greater intelligibility impairment had greater everyday communication difficulties. Effects often were weak, however, and not consistent.
Common variants near FOXF2 are associated with increased stroke susceptibility, according to a study published online ahead of print April 7 in the Lancet Neurology. Researchers completed a genome-wide analysis of common genetic variants associated with incident stroke risk in 18 population-based cohorts consisting of 84,961 participants, of whom 4,348 had stroke. Investigators completed validation analyses for variants yielding a significant association with all stroke, ischemic stroke, cardioembolic ischemic stroke, or noncardioembolic ischemic stroke. Study authors replicated seven of eight known loci associated with risk for ischemic stroke and identified a novel locus at chromosome 6p25 associated with risk of all stroke. The rs12204590 stroke risk allele was also associated with increased white matter hyperintensity in adults without stroke. Young patients with segmental deletions of FOXF2 showed extensive white matter hyperintensity.
Young women with musculoskeletal pain complaints may have comorbid sleep problems that require treatment, according to a study published in the April issue of Pain. Researchers investigated the cross-sectional and longitudinal relationship between sleep problems and chronic pain, and musculoskeletal pain, headache, and abdominal pain severity in a general population of adults between ages 19 and 22. They studied whether relationships were moderated by sex and whether symptoms of anxiety and depression, fatigue, or physical inactivity mediated these effects. Follow-up data were collected in 1,753 participants. Sleep problems were associated with chronic pain, musculoskeletal pain, headache, and abdominal pain severity. They also predicted chronic pain and an increase in musculoskeletal pain severity at three years of follow-up. The effect was stronger in females than in males.
—Kimberly Williams

Parathyroidectomy before kidney transplant may reduce complications
BALTIMORE – Performing a parathyroidectomy in kidney transplant patients before their transplant can reduce the risk of graft failure and provide other benefits, the findings of a retrospective study of 913 patients suggest.
Uremic hyperparathyroidism (UHPT) is common in patients with end-stage kidney disease, and elevated parathyroid hormone (PTH) levels have been linked with delayed graft function after kidney transplants, but current guidelines for PTH levels may not go far enough to reduce the risk of graft failure and other post–kidney transplant complications in people with elevated PTH before transplant, according to Dr. Glenda G. Callender of Yale University, New Haven, Conn., and her colleagues.

“Uremic hyperparathyroidism was associated with an increased risk of complications in the first year post kidney transplant,” Dr. Callender said at the annual meeting of the American Association of Endocrine Surgeons. “Pre–kidney transplant parathyroidectomy was associated with a decreased risk of post–kidney transplant graft failure. This implies that pre–kidney transplant reduction of PTH levels should be considered in patients with UPHT.”
The Yale researchers reviewed outcomes of 913 patients at their institution who had a kidney transplant from 2005 to 2014. They analyzed biochemical values before kidney transplant and at three intervals post transplant: at 1 month, 6 months, and 1 year. Among the outcomes they evaluated were calcium and PTH levels, estimated glomerular filtration rate, complications, delayed graft function, and graft failure. The overall graft survival rate was 97.8% 1 year after kidney transplantation.
Overall, 49.4% of patients (451) had a diagnosis with UHPT before kidney transplant; 6.2% of all patients (57) had parathyroidectomy before kidney transplant and another 2% (18) had parathyroidectomy at some point after their kidney transplant operations. Median baseline PTH levels were higher in the UHPT patients: 206 pg/mL vs. 159 pg/mL for the non-UHPT group, Dr. Callender reported.
The researchers captured complete data on 37 of the 57 patients who had pretransplant parathyroidectomy. Twenty-four (65% of the group) had subtotal parathyroidectomy in which 3.5 glands were removed, and 12 (32%) had fewer than 3.5 glands removed. One patient had total parathyroidectomy, she said.
Among the patients with UHPT, the median pre–kidney transplant PTH was similar between the pretransplant parathyroidectomy and the no-parathyroidectomy groups: 218 pg/mL and 180 pg/mL, respectively, Dr. Callender said.
Pre–kidney transplant diagnosis of UHPT had an odds ratio of 1.44 for complications in the first year after transplant surgery, but not necessarily a greater risk for graft function or graft failure, she said. However, those relative risks changed with the degree of PTH above normal. Patients with UHPT who had pretransplant parathyroidectomy had a lower risk of graft failure, with an odds ratio of 0.547.
Current Kidney Disease Improving Global Outcomes (KDIGO) guidelines recommend maintaining PTH levels in patients with UHPT before they have kidney transplant surgery at no more than nine times normal. To test the optimal PTH levels before kidney transplant, the researchers analyzed thresholds ranging from two to nine times the normal limit.
“A pre–kidney transplant [PTH] level greater than or equal to six times normal was associated with post-transplant graft failure but not with delayed graft function or complications in the first year post kidney transplant,” Dr. Callender said. “Although the thresholds at two and four times normal were statistically significant, there was a continued risk significant for graft failure above six times normal.”
This finding “suggests that perhaps the current KDIGO guideline of maintaining patient PTH at up to nine times normal is too liberal,” Dr. Callender said.
She acknowledged several limitations of the study: its retrospective nature, small sample size, and “many missing data points” because a wide variety of dialysis centers with varying documentation standards collected information.
“However,” Dr. Callender said, “we believe these findings support the design and implementation of a multi-institutional, prospective, randomized control trial to evaluate whether a change in management of patients with uremic hyperparathyroidism is warranted.”
Dr. Callender and her coauthors had no financial relationships to disclose.
BALTIMORE – Performing a parathyroidectomy in kidney transplant patients before their transplant can reduce the risk of graft failure and provide other benefits, the findings of a retrospective study of 913 patients suggest.
Uremic hyperparathyroidism (UHPT) is common in patients with end-stage kidney disease, and elevated parathyroid hormone (PTH) levels have been linked with delayed graft function after kidney transplants, but current guidelines for PTH levels may not go far enough to reduce the risk of graft failure and other post–kidney transplant complications in people with elevated PTH before transplant, according to Dr. Glenda G. Callender of Yale University, New Haven, Conn., and her colleagues.
“Uremic hyperparathyroidism was associated with an increased risk of complications in the first year post kidney transplant,” Dr. Callender said at the annual meeting of the American Association of Endocrine Surgeons. “Pre–kidney transplant parathyroidectomy was associated with a decreased risk of post–kidney transplant graft failure. This implies that pre–kidney transplant reduction of PTH levels should be considered in patients with UPHT.”
The Yale researchers reviewed outcomes of 913 patients at their institution who had a kidney transplant from 2005 to 2014. They analyzed biochemical values before kidney transplant and at three intervals post transplant: at 1 month, 6 months, and 1 year. Among the outcomes they evaluated were calcium and PTH levels, estimated glomerular filtration rate, complications, delayed graft function, and graft failure. The overall graft survival rate was 97.8% 1 year after kidney transplantation.
Overall, 49.4% of patients (451) had a diagnosis with UHPT before kidney transplant; 6.2% of all patients (57) had parathyroidectomy before kidney transplant and another 2% (18) had parathyroidectomy at some point after their kidney transplant operations. Median baseline PTH levels were higher in the UHPT patients: 206 pg/mL vs. 159 pg/mL for the non-UHPT group, Dr. Callender reported.
The researchers captured complete data on 37 of the 57 patients who had pretransplant parathyroidectomy. Twenty-four (65% of the group) had subtotal parathyroidectomy in which 3.5 glands were removed, and 12 (32%) had fewer than 3.5 glands removed. One patient had total parathyroidectomy, she said.
Among the patients with UHPT, the median pre–kidney transplant PTH was similar between the pretransplant parathyroidectomy and the no-parathyroidectomy groups: 218 pg/mL and 180 pg/mL, respectively, Dr. Callender said.
Pre–kidney transplant diagnosis of UHPT had an odds ratio of 1.44 for complications in the first year after transplant surgery, but not necessarily a greater risk for graft function or graft failure, she said. However, those relative risks changed with the degree of PTH above normal. Patients with UHPT who had pretransplant parathyroidectomy had a lower risk of graft failure, with an odds ratio of 0.547.
Current Kidney Disease Improving Global Outcomes (KDIGO) guidelines recommend maintaining PTH levels in patients with UHPT before they have kidney transplant surgery at no more than nine times normal. To test the optimal PTH levels before kidney transplant, the researchers analyzed thresholds ranging from two to nine times the normal limit.
“A pre–kidney transplant [PTH] level greater than or equal to six times normal was associated with post-transplant graft failure but not with delayed graft function or complications in the first year post kidney transplant,” Dr. Callender said. “Although the thresholds at two and four times normal were statistically significant, there was a continued risk significant for graft failure above six times normal.”
This finding “suggests that perhaps the current KDIGO guideline of maintaining patient PTH at up to nine times normal is too liberal,” Dr. Callender said.
She acknowledged several limitations of the study: its retrospective nature, small sample size, and “many missing data points” because a wide variety of dialysis centers with varying documentation standards collected information.
“However,” Dr. Callender said, “we believe these findings support the design and implementation of a multi-institutional, prospective, randomized control trial to evaluate whether a change in management of patients with uremic hyperparathyroidism is warranted.”
Dr. Callender and her coauthors had no financial relationships to disclose.
AT AAES 2016
Key clinical point: Parathyroidectomy reduces graft failure in individuals with uremic hyperparathyroidism (UHPT) who undergo kidney transplant.
Major finding: Pre–kidney transplant diagnosis of UHPT had an odds ratio of 1.44 of complications a year after transplant; patients who had parathyroidectomy before transplant had a reduced 0.547 odds ratio risk of graft failure.
Data source: Review of 913 patients who had kidney transplant from 2005 to 2014 at a single institution.
Disclosures: Dr. Callender and her coauthors reported having no financial disclosures.

Vitamin D supplementation cuts dust mite atopy
BALTIMORE – Three months of daily, oral treatment with a relatively high but safe dosage of a vitamin D supplement to pregnant mothers during late gestation followed by continued oral supplementation to their neonates during the first 6 months of life led to a significant reduction in the prevalence of dust-mite skin reactivity in those children once they reached 18 months old in a randomized, controlled trial with 259 mothers and infants.
And in a preliminary assessment that tallied the number of children who required primary care office visits for asthma through age 18 months, children who had received the highest vitamin D supplementation also showed a statistically significant reduction of these visits, compared with the placebo control children, Dr. Cameron C. Grant reported at the annual meeting of the Pediatric Academic Societies.

This suggestion that the vitamin D intervention could cut asthma development is not completely certain because in 18-month-old children, diagnosis of asthma is “very insecure,” noted Dr. Grant, a pediatrician at the University of Auckland, New Zealand and at Starship Children’s Hospital, also in Auckland. In addition, a limitation of the observed effect on dust mite atopy on skin-test challenge was that this follow-up occurred in only 186 (72%) of the 259 infants who participated in the study.
The study’s premise was that vitamin D is an immune system modulator, and that New Zealand provides an excellent setting to test the hypothesis that normalized vitamin D levels can help prevent development of atopy and asthma because many of the country’s residents are vitamin D deficient due to their diet and sun avoidance to prevent skin cancers. Results from prior studies had shown that 57% of New Zealand neonates have inadequate levels of vitamin D at birth, defined as a serum level of 25-hydroxyvitamin D of less than 20 ng/ml (less than 50 nmol/L), Dr. Grant noted.
“I think this intervention will only work in populations that are vitamin D deficient,” Dr. Grant said in an interview. In his study, the average serum level of 25-hydroxyvitamin D among control neonates was 38 nmol/L (about 15 ng/mL). In contrast, neonates born to mothers who had received a daily, higher-dose vitamin D supplement during the third trimester had serum measures that were roughly twice that level.
The study enrolled 260 pregnant women from the Auckland area with a single pregnancy at 26-30 weeks’ gestation; average gestational age at baseline was 27 weeks. Dr. Grant and his associates randomized the mothers to receive 1,000 IU oral vitamin D daily, 2,000 oral vitamin D daily, or placebo. The women delivered 259 infants. Infants born to women on the lower dosage supplement then received 400 IU vitamin daily for 6 months, those born to mothers on the higher level supplement received 800 IU vitamin D daily for 6 months, and those born to mothers in the placebo group received placebo supplements daily for 6 months.
Both supplement regimens led to statistically significant increases in serum levels of 25-hydroxyvitamin D in maternal serum at 36 weeks’ gestation, in cord blood at delivery, in the neonates’ serum at ages 2 months and 4 months, and in infant serum in the higher dosage group at 6 months of age, compared with similar measures taken at all these time points in the placebo group.
In addition, the neonates in the higher dosage group had significantly higher serum levels at 2, 4, and 6 months, compared with the lower dosage group. When measured a final time at 18-month follow-up, a year after the end of vitamin D supplementation, average serum levels of 25-hydroxyvitamin D in an three subgroups of children were virtually identical and similar to maternal serum levels at baseline. Dr. Grant and his associates had previously reported these findings and also had documented the safety of both the low and high levels of vitamin D supplements for both mothers and their children (Pediatrics. 2014 Jan;133[1]:e143-53).
The new findings reported by Dr. Grant focused on clinical outcomes at 18 months. He and his colleagues ran skin-prick testing on 186 of the 259 (72%) children in the study (the remaining children weren’t available for this follow-up assessment). They tested three aeroallergens: cat, pollen, and house dust mite. They saw no significant differences in the prevalence of positive skin-prick reactions among the three study groups to cat and pollen, but prevalence levels of positive reactions to dust mite were 9% in the controls, 3% of children in the low-dosage group, and none in the high dosage group. The difference between the controls and high dosage groups was statistically significant; the difference between the controls and the low dosage group was not significant, Dr. Grant said. Additional testing of specific IgE responses to four different dust mite antigens showed statistically significant reductions in responses to each of the four antigens among the high dosage children, compared with the controls and with the low dosage children.
The researchers also tallied the number of acute, primary care office visits during the first 18 months of life among the children in each of the three subgroups for a variety of respiratory diagnoses. The three groups showed no significant differences in total number of office visits for most of these diagnoses, including colds, otitis media, croup, and bronchitis. However, about 12% of children in the control group had been seen in a primary care office for a diagnosis of asthma, compared with none of the children in the low dosage group and about 4% in the high-dosage group. The differences between the two intervention groups and the control group were statistically significant. Dr. Grant cautioned that this finding is very preliminary and that any conclusions about the impact of vitamin D supplements on asthma incidence must await studies with larger numbers of children who are followed to an older age.
Dr. Grant had no disclosures.
On Twitter @mitchelzoler
BALTIMORE – Three months of daily, oral treatment with a relatively high but safe dosage of a vitamin D supplement to pregnant mothers during late gestation followed by continued oral supplementation to their neonates during the first 6 months of life led to a significant reduction in the prevalence of dust-mite skin reactivity in those children once they reached 18 months old in a randomized, controlled trial with 259 mothers and infants.
And in a preliminary assessment that tallied the number of children who required primary care office visits for asthma through age 18 months, children who had received the highest vitamin D supplementation also showed a statistically significant reduction of these visits, compared with the placebo control children, Dr. Cameron C. Grant reported at the annual meeting of the Pediatric Academic Societies.
This suggestion that the vitamin D intervention could cut asthma development is not completely certain because in 18-month-old children, diagnosis of asthma is “very insecure,” noted Dr. Grant, a pediatrician at the University of Auckland, New Zealand and at Starship Children’s Hospital, also in Auckland. In addition, a limitation of the observed effect on dust mite atopy on skin-test challenge was that this follow-up occurred in only 186 (72%) of the 259 infants who participated in the study.
The study’s premise was that vitamin D is an immune system modulator, and that New Zealand provides an excellent setting to test the hypothesis that normalized vitamin D levels can help prevent development of atopy and asthma because many of the country’s residents are vitamin D deficient due to their diet and sun avoidance to prevent skin cancers. Results from prior studies had shown that 57% of New Zealand neonates have inadequate levels of vitamin D at birth, defined as a serum level of 25-hydroxyvitamin D of less than 20 ng/ml (less than 50 nmol/L), Dr. Grant noted.
“I think this intervention will only work in populations that are vitamin D deficient,” Dr. Grant said in an interview. In his study, the average serum level of 25-hydroxyvitamin D among control neonates was 38 nmol/L (about 15 ng/mL). In contrast, neonates born to mothers who had received a daily, higher-dose vitamin D supplement during the third trimester had serum measures that were roughly twice that level.
The study enrolled 260 pregnant women from the Auckland area with a single pregnancy at 26-30 weeks’ gestation; average gestational age at baseline was 27 weeks. Dr. Grant and his associates randomized the mothers to receive 1,000 IU oral vitamin D daily, 2,000 oral vitamin D daily, or placebo. The women delivered 259 infants. Infants born to women on the lower dosage supplement then received 400 IU vitamin daily for 6 months, those born to mothers on the higher level supplement received 800 IU vitamin D daily for 6 months, and those born to mothers in the placebo group received placebo supplements daily for 6 months.
Both supplement regimens led to statistically significant increases in serum levels of 25-hydroxyvitamin D in maternal serum at 36 weeks’ gestation, in cord blood at delivery, in the neonates’ serum at ages 2 months and 4 months, and in infant serum in the higher dosage group at 6 months of age, compared with similar measures taken at all these time points in the placebo group.
In addition, the neonates in the higher dosage group had significantly higher serum levels at 2, 4, and 6 months, compared with the lower dosage group. When measured a final time at 18-month follow-up, a year after the end of vitamin D supplementation, average serum levels of 25-hydroxyvitamin D in an three subgroups of children were virtually identical and similar to maternal serum levels at baseline. Dr. Grant and his associates had previously reported these findings and also had documented the safety of both the low and high levels of vitamin D supplements for both mothers and their children (Pediatrics. 2014 Jan;133[1]:e143-53).
The new findings reported by Dr. Grant focused on clinical outcomes at 18 months. He and his colleagues ran skin-prick testing on 186 of the 259 (72%) children in the study (the remaining children weren’t available for this follow-up assessment). They tested three aeroallergens: cat, pollen, and house dust mite. They saw no significant differences in the prevalence of positive skin-prick reactions among the three study groups to cat and pollen, but prevalence levels of positive reactions to dust mite were 9% in the controls, 3% of children in the low-dosage group, and none in the high dosage group. The difference between the controls and high dosage groups was statistically significant; the difference between the controls and the low dosage group was not significant, Dr. Grant said. Additional testing of specific IgE responses to four different dust mite antigens showed statistically significant reductions in responses to each of the four antigens among the high dosage children, compared with the controls and with the low dosage children.
The researchers also tallied the number of acute, primary care office visits during the first 18 months of life among the children in each of the three subgroups for a variety of respiratory diagnoses. The three groups showed no significant differences in total number of office visits for most of these diagnoses, including colds, otitis media, croup, and bronchitis. However, about 12% of children in the control group had been seen in a primary care office for a diagnosis of asthma, compared with none of the children in the low dosage group and about 4% in the high-dosage group. The differences between the two intervention groups and the control group were statistically significant. Dr. Grant cautioned that this finding is very preliminary and that any conclusions about the impact of vitamin D supplements on asthma incidence must await studies with larger numbers of children who are followed to an older age.
Dr. Grant had no disclosures.
On Twitter @mitchelzoler
AT THE PAS ANNUAL MEETING
Key clinical point: Maternal treatment to achieve adequate vitamin D levels during late gestation followed by neonatal vitamin D supplementation significantly cut dust mite atopy at 18 months of age, along with a suggestion of reduced asthma incidence.
Major finding: Dust mite reactivity at 18 months occurred in no children treated with higher vitamin D supplementation and in 9% of controls.
Data source: A randomized, controlled, single-center study with 260 pregnant women who delivered 259 infants.
Disclosures: Dr. Grant had no disclosures.

Pediatric self-administration drives cough and cold drug mishaps
BALTIMORE – The vast majority of reported U.S. episodes of cough and cold medication serious adverse event episodes in young children occurred by an accidental, self-administration overdose, according to a review of all pediatric episodes collected by the designated national surveillance system during 2008-2014.
This pattern highlights the continued need for diligent education of families about the potential danger posed by these largely OTC products as well as a possible additional need for further improvement in protective packaging, Dr. G. Sam Wang said at the annual meeting of the Pediatric Academic Societies.

Although the manufacturers of these products voluntarily changed their labeling in 2007 to say “do not use” in children younger than 4 years old, the continued vulnerability of very young children and the high rate of self-administration suggests that labeling restrictions alone are “unlikely to have a significant impact” on the problem, he said. “What could be better is storage and [packaging] engineering controls to prevent the accidental ingestions that seem to represent the majority of cases,” Dr. Wang said in an interview.
The good news was that the 4,250 reported U.S. cases during 2008-2014 in children younger than age 12 years and judged by an expert review panel to be at least potentially related to cold and cough medications represents a significant decline, compared with earlier periods, and is also “quite low” when compared with the millions of units in annual U.S. sales.
“The overall adverse event rate compared with the volume sold is in the single digits per million of products sold, and the rate has been declining,” said Dr. Wang, a pediatric toxicologist at the University of Colorado in Denver and a consultant to the Rocky Mountain Poison & Drug Center, also in Denver, the group that maintains and reviews this registry, begun in January 2008. “I think we’re making progress,” but diligent education by physicians and other health care providers about the dangers posed by these drugs must continue, he said.
The analysis also identified that two drugs were by far the top culprits in causing pediatric adverse reactions to cough and cold medications, diphenhydramine and dextromethorphan. Diphenhydramine played a role in 53% of the 4,224 nonfatal adverse reaction cases and 54% of the 26 fatal cases identified by the registry panel as at least potentially related to a cough and cold medication, while dextromethorphan was responsible for 41% of the nonfatal and 19% of the fatal cases. In a majority of cases, these drugs were in products with a single active ingredient, although products with combined ingredients also played a role for some cases. Most often these drugs were in OTC formulations and in pediatric formulations.
Dr. Wang called it unlikely that manufacturers would formulate cold and cough medications without diphenhydramine or dextromethorphan because these drugs have the antitussive and sedative properties that consumers seek from cough and cold medications. He also noted that the addition of bittering agents to formulations have not had a history of reducing accidental self-administrations by children, but added “a good taste doesn’t help.”
During 2008-2014 U.S. surveillance by the registry review panel identified a total of 5,342 unique case reports of serious adverse events in children less than 12 years old and believed related to any of eight drugs commonly found in cold and cough medications. The reports came from any of five sources: the National Poison Data System, the Food and Drug Administration’s adverse event reporting system, safety reports to manufacturers, and through surveillance of the medical literature, and the news media. The panel winnowed these down to 4,250 cases at least potentially related to these drugs.
Among the 26 fatal cases, 16 (62%) occurred in children less than 2 years old and an additional four (15%) were in children aged 2 years to less than 4 years. Nine of these cases (35%) involved parental administration, with only two cases (8%) involving self-administration. An additional nine cases (35%) had no reported source of administration, and the remaining six (23%) cases involved other sources of administration. Seven of the 26 fatalities involved confirmed overdoses, with the dose unknown for the remaining 19 cases, Dr. Wang reported.
Among the 4,224 nonfatal cases, 15% occurred in children less than 2 years, 46% in children ages 2 years to less than 4 years, 19% in children 4 years to less than 6 years and 20% in children 6 years to less than 12 years. These cases involved a confirmed overdose in 73% of cases, a therapeutic range dose in 7%, with the remainder involving a dose of unknown size. Self-administration occurred 75% of the time.
On Twitter @mitchelzoler
BALTIMORE – The vast majority of reported U.S. episodes of cough and cold medication serious adverse event episodes in young children occurred by an accidental, self-administration overdose, according to a review of all pediatric episodes collected by the designated national surveillance system during 2008-2014.
This pattern highlights the continued need for diligent education of families about the potential danger posed by these largely OTC products as well as a possible additional need for further improvement in protective packaging, Dr. G. Sam Wang said at the annual meeting of the Pediatric Academic Societies.
Although the manufacturers of these products voluntarily changed their labeling in 2007 to say “do not use” in children younger than 4 years old, the continued vulnerability of very young children and the high rate of self-administration suggests that labeling restrictions alone are “unlikely to have a significant impact” on the problem, he said. “What could be better is storage and [packaging] engineering controls to prevent the accidental ingestions that seem to represent the majority of cases,” Dr. Wang said in an interview.
The good news was that the 4,250 reported U.S. cases during 2008-2014 in children younger than age 12 years and judged by an expert review panel to be at least potentially related to cold and cough medications represents a significant decline, compared with earlier periods, and is also “quite low” when compared with the millions of units in annual U.S. sales.
“The overall adverse event rate compared with the volume sold is in the single digits per million of products sold, and the rate has been declining,” said Dr. Wang, a pediatric toxicologist at the University of Colorado in Denver and a consultant to the Rocky Mountain Poison & Drug Center, also in Denver, the group that maintains and reviews this registry, begun in January 2008. “I think we’re making progress,” but diligent education by physicians and other health care providers about the dangers posed by these drugs must continue, he said.
The analysis also identified that two drugs were by far the top culprits in causing pediatric adverse reactions to cough and cold medications, diphenhydramine and dextromethorphan. Diphenhydramine played a role in 53% of the 4,224 nonfatal adverse reaction cases and 54% of the 26 fatal cases identified by the registry panel as at least potentially related to a cough and cold medication, while dextromethorphan was responsible for 41% of the nonfatal and 19% of the fatal cases. In a majority of cases, these drugs were in products with a single active ingredient, although products with combined ingredients also played a role for some cases. Most often these drugs were in OTC formulations and in pediatric formulations.
Dr. Wang called it unlikely that manufacturers would formulate cold and cough medications without diphenhydramine or dextromethorphan because these drugs have the antitussive and sedative properties that consumers seek from cough and cold medications. He also noted that the addition of bittering agents to formulations have not had a history of reducing accidental self-administrations by children, but added “a good taste doesn’t help.”
During 2008-2014 U.S. surveillance by the registry review panel identified a total of 5,342 unique case reports of serious adverse events in children less than 12 years old and believed related to any of eight drugs commonly found in cold and cough medications. The reports came from any of five sources: the National Poison Data System, the Food and Drug Administration’s adverse event reporting system, safety reports to manufacturers, and through surveillance of the medical literature, and the news media. The panel winnowed these down to 4,250 cases at least potentially related to these drugs.
Among the 26 fatal cases, 16 (62%) occurred in children less than 2 years old and an additional four (15%) were in children aged 2 years to less than 4 years. Nine of these cases (35%) involved parental administration, with only two cases (8%) involving self-administration. An additional nine cases (35%) had no reported source of administration, and the remaining six (23%) cases involved other sources of administration. Seven of the 26 fatalities involved confirmed overdoses, with the dose unknown for the remaining 19 cases, Dr. Wang reported.
Among the 4,224 nonfatal cases, 15% occurred in children less than 2 years, 46% in children ages 2 years to less than 4 years, 19% in children 4 years to less than 6 years and 20% in children 6 years to less than 12 years. These cases involved a confirmed overdose in 73% of cases, a therapeutic range dose in 7%, with the remainder involving a dose of unknown size. Self-administration occurred 75% of the time.
On Twitter @mitchelzoler
AT THE PAS ANNUAL MEETING
Key clinical point: Serious adverse events in U.S. children caused by cough and cold medications most commonly occur from self-administration in children younger than 4 years old.
Major finding: Three-quarters of serious adverse events occurred by self-administration, with 61% of episodes in children younger than 4 years old.
Data source: Review of 5,342 reported U.S. cough and cold medication serious adverse event episodes in children during 2008-2014.
Disclosures: Dr. Wang had no disclosures.

Palmoplantar Pustular Eruption Due to Dabigatran
To the Editor:
A 71-year-old woman with hypertension and atrial fibrillation due to thyrotoxicosis was prescribed dabigatran for stroke prevention by her cardiologist. She also was taking pantoprazole, methimazole, and amiodarone at the time of presentation, all managed by her endocrinologist. She had no known drug allergies but reported a remote history of a palmar rash after eating shellfish. She otherwise had never had any problems with her skin and had no family history of psoriasis. She had a history of smoking 50 packs per year but had quit 6 months prior to presentation. After two 150-mg doses of dabigatran, she noticed numerous mildly tender and itchy eruptions on the palmar and plantar surfaces with no associated respiratory, oropharyngeal, or constitutional symptoms. She denied any recent shellfish ingestion. On dermatologic examination, numerous discreet pustules were present on the bilateral palmar and plantar surfaces with minimal erythema of the underlying skin (Figure).

A punch biopsy was taken from a newly forming lesion on the right palm. Histopathology revealed mild hyperkeratosis, spongiosis with lymphocyte exocytosis, intraepidermal vesiculation, and a sparse upper dermal and perivascular lymphohistiocytic infiltration. No neutrophils or microabscesses were seen. Staining with periodic acid–Schiff revealed no fungi, and S-100 staining revealed numerous Langerhans cells in the epidermis. Although the skin lesions clinically appeared pustular, the results were consistent with an eczematous drug reaction. Laboratory values, including a complete blood cell count, iron studies, chemistry panels, liver function, thyroid function, and coagulation studies, were remarkable only for mild anemia. The patient declined any topical or systemic skin treatment. Dabigatran was discontinued, and the lesions began to clear immediately thereafter. Dabigatran was not reintroduced. Enoxaparin subsequently was prescribed for anticoagulation. The diagnosis of a drug reaction due to dabigatran was made, which was supported with a score of 7 on the Naranjo scale (0=doubtful; 1–4=possible; 5–8=probable; ≥9=definite) for determining probability of drug-induced adverse reactions.1 The differential diagnosis for the skin eruption included palmoplantar pustular psoriasis, dyshidrotic eczema, and allergic contact dermatitis, but the clinical history did not support these diagnoses.
Dabigatran is a direct thrombin inhibitor used to reduce the risk for stroke and systemic embolism in patients with nonvalvular atrial fibrillation. Based on results of the RE-LY (Randomization Evaluation of Long-term Anticoagulation Therapy) trial published in 2009, dabigatran 150 mg twice daily significantly reduced the risk for stroke and systemic emboli in patients with atrial fibrillation compared to warfarin (annual risk, 1.11% vs 1.69%; relative risk, 0.66; 95% CI, 0.53-0.82; P<.001) with the advantage of not requiring frequent monitoring of the international normalized ratio.2 The most common adverse effect of dabigatran in this trial was dyspepsia (11.3% vs 5.8%). Drug hypersensitivity, allergic edema, and anaphylaxis were reported in less than 0.1% of patients taking dabigatran.2
According to a PubMed search of articles indexed for MEDLINE using the search terms dabigatran cutaneous reaction and dabigatran rash, 4 case reports of cutaneous eruption due to dabigatran were identified. In one report, a 20-year-old man with atrial fibrillation developed an eruption similar to our patient on the thigh and forearm after 2 weeks of taking oral dabigatran 150 mg twice daily. It resolved without complication after topical corticosteroid use and discontinuation of dabigatran.3 In another report, a 78-year-old man presented to the emergency department after taking two 150-mg doses of dabigatran with a diffuse, full-body, pruritic rash that resolved with oral diphenhydramine and discontinuation of dabigatran.4 A third case described a 59-year-old man who was taking 150 mg dabigatran twice daily for 5 days before developing a rash.5 The fourth case involved a 74-year-old woman who developed leukocytoclastic vasculitis 1 week after taking dabigatran 150 mg twice daily.6
It is important to monitor for and report hypersensitivity reactions in patients taking dabigatran. Drug exanthems may cause discomfort or even herald more serious hypersensitivity reactions. Patients experiencing these reactions may discontinue therapy without notifying a physician and consequently place themselves at risk for embolism or stroke.
- Naranjo CA, Busto U, Sellers EM, et al. A method for estimating the probability of adverse drug reactions. Clin Pharmacol Ther. 1981;30:239-245.
- Connolly SJ, Ezekowitz MD, Yusuf S, et al. Dabigatran versus warfarin in patients with atrial fibrillation [published online August 30, 2009]. N Engl J Med. 2009;361:1139-1151.
- Whitehead H, Boyd J, Blais D, et al. Drug induced exanthem following dabigatran. Ann Pharmacother. 2011;45:e53.
- Eid TJ, Shah SA. Dabigatran-induced rash. Am J Health Syst Pharm. 2011;68:1489-1490.
- To K, Reynolds C, Spinler SA. Rash associated with dabigatran etrexilate. Pharmacotherapy. 2013;33:e23-e27.
- Cakmak MA, Sahin S, Cinar N, et al. Adverse skin reaction caused by dabigatran. Eur Rev Med Pharmacol Sci. 2014;18:2595.
To the Editor:
A 71-year-old woman with hypertension and atrial fibrillation due to thyrotoxicosis was prescribed dabigatran for stroke prevention by her cardiologist. She also was taking pantoprazole, methimazole, and amiodarone at the time of presentation, all managed by her endocrinologist. She had no known drug allergies but reported a remote history of a palmar rash after eating shellfish. She otherwise had never had any problems with her skin and had no family history of psoriasis. She had a history of smoking 50 packs per year but had quit 6 months prior to presentation. After two 150-mg doses of dabigatran, she noticed numerous mildly tender and itchy eruptions on the palmar and plantar surfaces with no associated respiratory, oropharyngeal, or constitutional symptoms. She denied any recent shellfish ingestion. On dermatologic examination, numerous discreet pustules were present on the bilateral palmar and plantar surfaces with minimal erythema of the underlying skin (Figure).
A punch biopsy was taken from a newly forming lesion on the right palm. Histopathology revealed mild hyperkeratosis, spongiosis with lymphocyte exocytosis, intraepidermal vesiculation, and a sparse upper dermal and perivascular lymphohistiocytic infiltration. No neutrophils or microabscesses were seen. Staining with periodic acid–Schiff revealed no fungi, and S-100 staining revealed numerous Langerhans cells in the epidermis. Although the skin lesions clinically appeared pustular, the results were consistent with an eczematous drug reaction. Laboratory values, including a complete blood cell count, iron studies, chemistry panels, liver function, thyroid function, and coagulation studies, were remarkable only for mild anemia. The patient declined any topical or systemic skin treatment. Dabigatran was discontinued, and the lesions began to clear immediately thereafter. Dabigatran was not reintroduced. Enoxaparin subsequently was prescribed for anticoagulation. The diagnosis of a drug reaction due to dabigatran was made, which was supported with a score of 7 on the Naranjo scale (0=doubtful; 1–4=possible; 5–8=probable; ≥9=definite) for determining probability of drug-induced adverse reactions.1 The differential diagnosis for the skin eruption included palmoplantar pustular psoriasis, dyshidrotic eczema, and allergic contact dermatitis, but the clinical history did not support these diagnoses.
Dabigatran is a direct thrombin inhibitor used to reduce the risk for stroke and systemic embolism in patients with nonvalvular atrial fibrillation. Based on results of the RE-LY (Randomization Evaluation of Long-term Anticoagulation Therapy) trial published in 2009, dabigatran 150 mg twice daily significantly reduced the risk for stroke and systemic emboli in patients with atrial fibrillation compared to warfarin (annual risk, 1.11% vs 1.69%; relative risk, 0.66; 95% CI, 0.53-0.82; P<.001) with the advantage of not requiring frequent monitoring of the international normalized ratio.2 The most common adverse effect of dabigatran in this trial was dyspepsia (11.3% vs 5.8%). Drug hypersensitivity, allergic edema, and anaphylaxis were reported in less than 0.1% of patients taking dabigatran.2
According to a PubMed search of articles indexed for MEDLINE using the search terms dabigatran cutaneous reaction and dabigatran rash, 4 case reports of cutaneous eruption due to dabigatran were identified. In one report, a 20-year-old man with atrial fibrillation developed an eruption similar to our patient on the thigh and forearm after 2 weeks of taking oral dabigatran 150 mg twice daily. It resolved without complication after topical corticosteroid use and discontinuation of dabigatran.3 In another report, a 78-year-old man presented to the emergency department after taking two 150-mg doses of dabigatran with a diffuse, full-body, pruritic rash that resolved with oral diphenhydramine and discontinuation of dabigatran.4 A third case described a 59-year-old man who was taking 150 mg dabigatran twice daily for 5 days before developing a rash.5 The fourth case involved a 74-year-old woman who developed leukocytoclastic vasculitis 1 week after taking dabigatran 150 mg twice daily.6
It is important to monitor for and report hypersensitivity reactions in patients taking dabigatran. Drug exanthems may cause discomfort or even herald more serious hypersensitivity reactions. Patients experiencing these reactions may discontinue therapy without notifying a physician and consequently place themselves at risk for embolism or stroke.
- Naranjo CA, Busto U, Sellers EM, et al. A method for estimating the probability of adverse drug reactions. Clin Pharmacol Ther. 1981;30:239-245.
- Connolly SJ, Ezekowitz MD, Yusuf S, et al. Dabigatran versus warfarin in patients with atrial fibrillation [published online August 30, 2009]. N Engl J Med. 2009;361:1139-1151.
- Whitehead H, Boyd J, Blais D, et al. Drug induced exanthem following dabigatran. Ann Pharmacother. 2011;45:e53.
- Eid TJ, Shah SA. Dabigatran-induced rash. Am J Health Syst Pharm. 2011;68:1489-1490.
- To K, Reynolds C, Spinler SA. Rash associated with dabigatran etrexilate. Pharmacotherapy. 2013;33:e23-e27.
- Cakmak MA, Sahin S, Cinar N, et al. Adverse skin reaction caused by dabigatran. Eur Rev Med Pharmacol Sci. 2014;18:2595.
Practice Points
- Dabigatran is a direct thrombin inhibitor used in patients with atrial fibrillation to prevent thromboembolic events.
- Although the most common adverse effects of dabigatran are bleeding and dyspepsia, clinicians also should be aware of the potential for cutaneous hypersensitivity reactions to this drug.

Arrange for VAM Housing by May 11
Special room rates at the VAM headquarters hotel, the Gaylord National Resort & Convention Center, are good through Thursday, May 11. Enjoy the stunning 19-story glass atrium, with views of the Potomac River, on-site restaurants, luxury spa and fitness center and more. It’s just steps from National Harbor’s entertainment and shopping district and only eight miles from Washington, D.C.
Special room rates at the VAM headquarters hotel, the Gaylord National Resort & Convention Center, are good through Thursday, May 11. Enjoy the stunning 19-story glass atrium, with views of the Potomac River, on-site restaurants, luxury spa and fitness center and more. It’s just steps from National Harbor’s entertainment and shopping district and only eight miles from Washington, D.C.
Special room rates at the VAM headquarters hotel, the Gaylord National Resort & Convention Center, are good through Thursday, May 11. Enjoy the stunning 19-story glass atrium, with views of the Potomac River, on-site restaurants, luxury spa and fitness center and more. It’s just steps from National Harbor’s entertainment and shopping district and only eight miles from Washington, D.C.

Register for VAM Hands-on Workshops
Register today for hands-on training at the Vascular Annual Meeting’s hands-on-workshop (limit 15 participants each) on Wednesday, June 8. Twelve topics -- with tips, tricks, tools and more -- are offered during four 90-minute sessions.
The workshops are $100 each (preregistration is required) and are not included in the VAM registration fee. Simply add the desired workshops when registering. Already registered? Just return to the registration page and add the workshops separately.
Learn more here.

Apply For VAM 2017 International Scholarships by June 17
Up to four $5,000 scholarships to attend the 2017 Vascular Annual Meeting in San Diego are available to qualified young vascular surgeons living outside of North America.
In addition to the meeting, scholars also will visit clinical, teaching and research programs in the United States and Canada. Applications can be completed online.
The application deadline is June 17, 2016. For questions, email [email protected] or call 312-334-2300. More information is available here.

Vascular Quality Initiative plans first annual meeting at 2016 VAM near Washington DC
Vascular surgeons, clinicians, data managers and quality personnel will find helpful techniques and useful information on using data at the first-ever, day-long meeting of the Vascular Quality Initiative (VQI) June 8, 2016 at the Gaylord National Resort and Convention Center in National Harbor, MD.
Dubbed “VQI@VAM” since it will be held during the larger, 2016 Vascular Annual Meeting (VAM) in the same location, the event will bring a day of programming aimed at helping attendees better understand the data registries and quality improvement skills that will help improve vascular care.
“The intent of VQI@VAM is to bring the physicians, quality officers and data managers together in a team environment where they can learn more about the use of VQI data to promote quality improvement, with practical tools that can be used in their own health system,” said Dr. Jack Cronenwett, VQI’s medical director.
Morning sessions will focus on information for data managers, including vascular anatomy, a review of data definitions, examples of case abstraction and how to produce and interpret reports. In the afternoon, sessions will feature topics such as case studies of successful vascular quality improvement projects and practical training on techniques.
During lunch, Dr. Englesbe, of the University of Michigan and associate director of the Michigan Surgical Quality Collaborative, will provide a keynote speech entitled, “From Registry Report to Bedside: Leveraging Your Quality Data.” This presentation will address challenges and opportunities in using registry data.
Registration is available through the Vascular Annual Meeting’s registration website. Registrants can sign up for both meetings or only VQI, for which there is a $100 fee. Select the box for “Postgraduate Courses, VQI Annual Meeting, and/or RPVI Exam Review Course.” You will see the rates on the next page. Select the “VQI Annual Meeting” box (ID-10) from the list of four options. You should see that the meeting fee of $100 has been added to your cart.
Register now by clicking here.

Start offering aspirin to pregnant women at high risk for preeclampsia
Obstetricians work diligently to anticipate, diagnose, and treat preeclampsia because the maternal and perinatal health burden of the disease is enormous. Many meta-analyses have reported that aspirin treatment of women at high risk for preeclampsia reduces the risk of developing the disease by about 10% to 23%.1–5 In addition, for women at high risk for preeclampsia, aspirin treatment reduces the risk of preterm birth and intrauterine growth restriction (IUGR). In your practice you should start offering aspirin to pregnant women at high risk for preeclampsia.
Aspirin reduces the risk of preeclampsia, preterm birth, and IUGRBased on the results of multiple meta-analyses of clinical trials involving more than 35,000 women, investigators consistently have concluded that aspirin treatment reduces the risk of preeclampsia in women at high risk for the disease.1–5 The magnitude of the effect is difficult to define with precision, but the risk reduction is likely in the range of 10% to 23%.1
In addition to reducing the risk of preeclampsia, aspirin also reduces the risk of 2 associated problems: preterm birth and IUGR. For preterm birth, the risk reduction is estimated to be in the range of 11% to 31%. For IUGR, the estimation for risk reduction is in the range of 7% to 24%.1 Although these benefits are modest, the burden of maternal and perinatal morbidity associated with preeclampsia is great, making even a modest benefit clinically significant.
Potential harms of aspirin treatmentIn the most recent meta-analysis from the US Preventive Services Task Force (USPSTF),1 low-dose aspirin treatment was associated with no significant perinatal or maternal harms, but rare harms could not be ruled out. A small increase in the risk of placental abruption was noted, but this increase did not reach significance (relative risk [RR], 1.17; 95% confidence interval [CI], 0.93–1.48).1 There was no increased risk of maternal postpartum hemorrhage or blood loss at delivery.1 In one meta-analysis, aspirin treatment did not increase the risk of newborn intracranial hemorrhage.1
Other potential adverse effects of aspirin treatment include maternal gastrointestinal bleeding and exacerbation of respiratory disorders such as asthma, but these effects have not been reported as significant associations in clinical trials of preeclampsia prevention.
Dueling recommendations: Restrictive or liberal use of aspirin?The American College of Obstetricians and Gynecologists (ACOG) recommends use of aspirin to prevent preeclampsia in women who have a personal history of early-onset preeclampsia with delivery before 34 weeks of gestation and in women with preeclampsia in 2 or more prior pregnancies.6 The restrictive ACOG guideline recommends aspirin treatment for a very small group of women. In one analysis, using the ACOG guideline, only 0.35% of all pregnant women would be eligible for treatment with aspirin to prevent preeclampsia.7
The USPSTF recommends that all pregnant women with one major risk factor for preeclampsia—including multifetal gestation, chronic hypertension, type 1 or 2 pregestational diabetes, renal disease, autoimmune disease, or prior personal history of preeclampsia—receive treatment with aspirin to prevent preeclampsia.8 The Task Force also recommends that women with multiple moderate risk factors for preeclampsia, such as nulliparity, body mass index greater than 30 kg/m2, family history of preeclampsia in a mother or sister, age 35 years or older, and certain sociodemographic risk factors (African American race, low socioeconomic status) also be offered aspirin treatment.
The USPSTF guideline advises aspirin treatment for many women. According to one analysis, the USPSTFguideline would result in approximately 24% of all pregnant women being offered aspirin treatment.7
The USPSTF guideline would result in 67 times more pregnant women being treated with aspirin than the ACOG guideline. The narrowly focused ACOG recommendation is problematic because it recommends against aspirin treatment in women who are at very high risk for developing preeclampsia, for example, a 41-year-old woman in her first pregnancy with twins and pregestational diabetes. In addition, the ACOG recommendation is not consistent with the recommendations of most other major health organizations.
The World Health Organization,9 the United Kingdom’s National Institute for Health and Care Excellence (NICE),10 and the Society of Obstetricians and Gynaecologists of Canada11 all recommend aspirin treatment to prevent preeclampsia in pregnant women at high risk for the disease and utilize an expanded definition of “high risk” (TABLE). Some experts have observed that, in actual clinical practice, it is often difficult to consistently implement a prevention plan based on a complex assessment of clinical risk factors.7
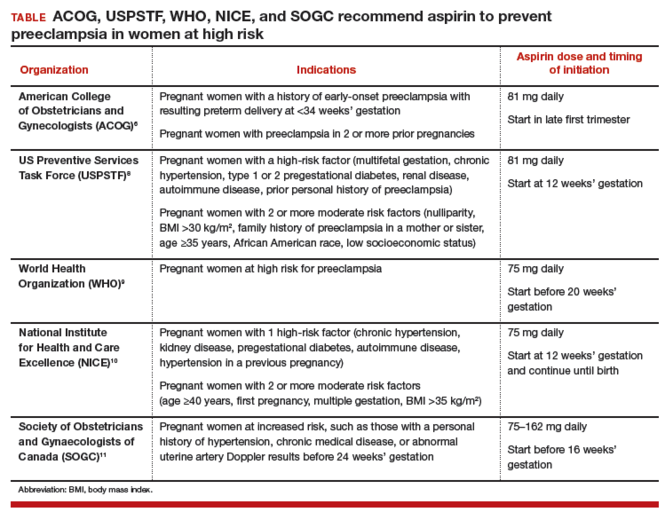
An alternative to guidelines that use clinical risk factors to identify women at high risk is universal treatment. With universal treatment all pregnant women are prescribed aspirin, thereby maximizing the clinical benefit but unnecessarily treating many women with aspirin.7 Universal treatment of pregnant women with aspirin appears to be cost-effective and would be associated with annual health care savings of $365 million.7
Timing of aspirin initiationIn one meta-analysis, initiating aspirin before 16 weeks’ gestation resulted in a greater reduction in preeclampsia than starting aspirin after 16 weeks.12 The USPSTF cautions that meta-analysis of the available data is not well suited for identifying the optimal time to initiate aspirin therapy.13 ACOG, USPSTF, and NICE recommend initiating aspirin therapy at approximately 12 weeks’ gestation—the end of the first trimester.
Ideal aspirin doseThe optimal dose of aspirin to prevent preeclampsia is not precisely defined. Aspirin doses ranging from 50 mg to 162 mg have been proposed for the prevention of preeclampsia. Most authorities recommend a daily dose between 80 mg and less than 300 mg to prevent preeclampsia.14 ACOG and USPSTF recommend aspirin at a dose of 81 mg daily,6,8 because this dose is widely available in the United States.
Let’s close the gap between current and optimal practiceAccording to the USPSTF guidelines, approximately 24% of the pregnant women in our practices have risk factors that would justify the initiation of aspirin treatment for the prevention of preeclampsia.8 This approach would modestly reduce the rate of preeclampsia and the associated problems of preterm birth and IUGR with little cost and few adverse effects. Yet relatively few pregnant women in the United States are currently receiving aspirin therapy. We could close this clinical gap between current and optimal practice by reflecting on the USPSTF recommendations and implementing them in our practices, as appropriate.
Tell us…What are your thoughts about the use of aspirin in pregnant women who are at high risk for preeclampsia?
Send your letter to the editor to [email protected]. Please include the city and state in which you practice.
- Henderson JT, Whitlock EP, O'Connor E, Senger CA, Thompson JH, Rowland MG. Low-dose aspirin for prevention of morbidity and mortality from preeclampsia: a systematic evidence review for the U.S. Preventive Services Task Force. Ann Intern Med. 2014;160(10):695-703.
- Roberge S, Nicolaides KH, Demers S, Villa P, Bujold E. Prevention of perinatal death and adverse perinatal outcome using low-dose aspirin: a meta-analysis. Ultrasound Obstet Gynecol. 2013;41(5):491-499.
- Bujold E, Roberge S, Lacasse Y, et al. Prevention of preeclampsia and intrauterine growth restriction with aspirin started in early pregnancy: a meta-analysis. Obstet Gynecol. 2010;116(2 pt 1):402-414.
- Duley L, Henderson-Smart DJ, Meher S, King JF. Antiplatelet agents for preventing pre-eclampsia and its complications. Cochrane Database Syst Rev. 2007;(2):CD004659.
- Askie LM, Duley L, Henderson-Smart DJ, Stewart LA; PARIS Collaborative Group. Antiplatelet agents for prevention of pre-eclampsia: a meta-analysis of individual patient data. Lancet. 2007;369(9575):1791-1798.
- American College of Obstetricians and Gynecologists, Task Force on Hypertension in Pregnancy. Hypertension in pregnancy. Report of the American College of Obstetricians and Gynecologists' Task Force on Hypertension in Pregnancy. Obstet Gynecol. 2013;122(5):1122-1131.
- Werner EF, Hauspurg AK, Rouse DJ. A cost-benefit analysis of low-dose aspirin prophylaxis for the prevention of preeclampsia in the United States. Obstet Gynecol. 2015;126(6):1242-1250.
- LeFevre ML; US Preventive Services Task Force. Low-dose aspirin use for the prevention of morbidity and mortality from preeclampsia: U.S. Preventive Services Task Force recommendation statement. Ann Intern Med. 2014;161(11):819-826.
- World Health Organization. WHO recommendations for prevention and treatment of pre-eclampsia and eclampsia. Geneva, Switzerland: WHO; 2011:13-15. https://www.preeclampsia.org/images/pdf/2011c-who_pe_final.pdf. Accessed January 4, 2016.
- National Institute for Health and Care Excellence. Hypertension in pregnancy: diagnosis and management. Clinical guideline 107. Manchester, United Kingdom: NICE; 2010:7. https://www.nice.org.uk/guidance/cg107/resources/hypertension-in-pregnancy-diagnosis-and-management-35109334009285. Accessed April 4, 2016.
- Magee LA, Pels A, Helewa M, Rey E, von Dadelszen P; Canadian Hypertensive Disorders of Pregnancy Working Group. Diagnosis, evaluation, and management of hypertensive disorders of pregnancy: executive summary. J Obstet Gynaecol Can. 2014;36(5):416-441.
- Roberge S, Demers S, Bujold E. Low-dose aspirin for prevention of morbidity and mortality from preeclampsia [letter to the editor]. Ann Intern Med. 2014;161(8):613.
- Henderson JT, O'Connor E, Whitlock EP. Low-dose aspirin for prevention of morbidity and mortality from preeclampsia [letter to the editor]. Ann Intern Med. 2014;161(8):613-614.
- Bujold E, Roberge S, Nicolaides KH. Low-dose aspirin for prevention of adverse outcomes related to abnormal placentation. Prenat Diagn. 2014;34(7):642-648.

Dr. Barbieri is Editor in Chief, OBG Management; Chair, Obstetrics and Gynecology, Brigham and Women’s Hospital; and Kate Macy Ladd Professor of Obstetrics, Gynecology, and Reproductive Biology, Harvard Medical School, Boston, Massachusetts.
Dr. Barbieri reports no financial relationships relevant to this article.
Obstetricians work diligently to anticipate, diagnose, and treat preeclampsia because the maternal and perinatal health burden of the disease is enormous. Many meta-analyses have reported that aspirin treatment of women at high risk for preeclampsia reduces the risk of developing the disease by about 10% to 23%.1–5 In addition, for women at high risk for preeclampsia, aspirin treatment reduces the risk of preterm birth and intrauterine growth restriction (IUGR). In your practice you should start offering aspirin to pregnant women at high risk for preeclampsia.
Aspirin reduces the risk of preeclampsia, preterm birth, and IUGRBased on the results of multiple meta-analyses of clinical trials involving more than 35,000 women, investigators consistently have concluded that aspirin treatment reduces the risk of preeclampsia in women at high risk for the disease.1–5 The magnitude of the effect is difficult to define with precision, but the risk reduction is likely in the range of 10% to 23%.1
In addition to reducing the risk of preeclampsia, aspirin also reduces the risk of 2 associated problems: preterm birth and IUGR. For preterm birth, the risk reduction is estimated to be in the range of 11% to 31%. For IUGR, the estimation for risk reduction is in the range of 7% to 24%.1 Although these benefits are modest, the burden of maternal and perinatal morbidity associated with preeclampsia is great, making even a modest benefit clinically significant.
Potential harms of aspirin treatmentIn the most recent meta-analysis from the US Preventive Services Task Force (USPSTF),1 low-dose aspirin treatment was associated with no significant perinatal or maternal harms, but rare harms could not be ruled out. A small increase in the risk of placental abruption was noted, but this increase did not reach significance (relative risk [RR], 1.17; 95% confidence interval [CI], 0.93–1.48).1 There was no increased risk of maternal postpartum hemorrhage or blood loss at delivery.1 In one meta-analysis, aspirin treatment did not increase the risk of newborn intracranial hemorrhage.1
Other potential adverse effects of aspirin treatment include maternal gastrointestinal bleeding and exacerbation of respiratory disorders such as asthma, but these effects have not been reported as significant associations in clinical trials of preeclampsia prevention.
Dueling recommendations: Restrictive or liberal use of aspirin?The American College of Obstetricians and Gynecologists (ACOG) recommends use of aspirin to prevent preeclampsia in women who have a personal history of early-onset preeclampsia with delivery before 34 weeks of gestation and in women with preeclampsia in 2 or more prior pregnancies.6 The restrictive ACOG guideline recommends aspirin treatment for a very small group of women. In one analysis, using the ACOG guideline, only 0.35% of all pregnant women would be eligible for treatment with aspirin to prevent preeclampsia.7
The USPSTF recommends that all pregnant women with one major risk factor for preeclampsia—including multifetal gestation, chronic hypertension, type 1 or 2 pregestational diabetes, renal disease, autoimmune disease, or prior personal history of preeclampsia—receive treatment with aspirin to prevent preeclampsia.8 The Task Force also recommends that women with multiple moderate risk factors for preeclampsia, such as nulliparity, body mass index greater than 30 kg/m2, family history of preeclampsia in a mother or sister, age 35 years or older, and certain sociodemographic risk factors (African American race, low socioeconomic status) also be offered aspirin treatment.
The USPSTF guideline advises aspirin treatment for many women. According to one analysis, the USPSTFguideline would result in approximately 24% of all pregnant women being offered aspirin treatment.7
The USPSTF guideline would result in 67 times more pregnant women being treated with aspirin than the ACOG guideline. The narrowly focused ACOG recommendation is problematic because it recommends against aspirin treatment in women who are at very high risk for developing preeclampsia, for example, a 41-year-old woman in her first pregnancy with twins and pregestational diabetes. In addition, the ACOG recommendation is not consistent with the recommendations of most other major health organizations.
The World Health Organization,9 the United Kingdom’s National Institute for Health and Care Excellence (NICE),10 and the Society of Obstetricians and Gynaecologists of Canada11 all recommend aspirin treatment to prevent preeclampsia in pregnant women at high risk for the disease and utilize an expanded definition of “high risk” (TABLE). Some experts have observed that, in actual clinical practice, it is often difficult to consistently implement a prevention plan based on a complex assessment of clinical risk factors.7
An alternative to guidelines that use clinical risk factors to identify women at high risk is universal treatment. With universal treatment all pregnant women are prescribed aspirin, thereby maximizing the clinical benefit but unnecessarily treating many women with aspirin.7 Universal treatment of pregnant women with aspirin appears to be cost-effective and would be associated with annual health care savings of $365 million.7
Timing of aspirin initiationIn one meta-analysis, initiating aspirin before 16 weeks’ gestation resulted in a greater reduction in preeclampsia than starting aspirin after 16 weeks.12 The USPSTF cautions that meta-analysis of the available data is not well suited for identifying the optimal time to initiate aspirin therapy.13 ACOG, USPSTF, and NICE recommend initiating aspirin therapy at approximately 12 weeks’ gestation—the end of the first trimester.
Ideal aspirin doseThe optimal dose of aspirin to prevent preeclampsia is not precisely defined. Aspirin doses ranging from 50 mg to 162 mg have been proposed for the prevention of preeclampsia. Most authorities recommend a daily dose between 80 mg and less than 300 mg to prevent preeclampsia.14 ACOG and USPSTF recommend aspirin at a dose of 81 mg daily,6,8 because this dose is widely available in the United States.
Let’s close the gap between current and optimal practiceAccording to the USPSTF guidelines, approximately 24% of the pregnant women in our practices have risk factors that would justify the initiation of aspirin treatment for the prevention of preeclampsia.8 This approach would modestly reduce the rate of preeclampsia and the associated problems of preterm birth and IUGR with little cost and few adverse effects. Yet relatively few pregnant women in the United States are currently receiving aspirin therapy. We could close this clinical gap between current and optimal practice by reflecting on the USPSTF recommendations and implementing them in our practices, as appropriate.
Tell us…What are your thoughts about the use of aspirin in pregnant women who are at high risk for preeclampsia?
Send your letter to the editor to [email protected]. Please include the city and state in which you practice.
- Henderson JT, Whitlock EP, O'Connor E, Senger CA, Thompson JH, Rowland MG. Low-dose aspirin for prevention of morbidity and mortality from preeclampsia: a systematic evidence review for the U.S. Preventive Services Task Force. Ann Intern Med. 2014;160(10):695-703.
- Roberge S, Nicolaides KH, Demers S, Villa P, Bujold E. Prevention of perinatal death and adverse perinatal outcome using low-dose aspirin: a meta-analysis. Ultrasound Obstet Gynecol. 2013;41(5):491-499.
- Bujold E, Roberge S, Lacasse Y, et al. Prevention of preeclampsia and intrauterine growth restriction with aspirin started in early pregnancy: a meta-analysis. Obstet Gynecol. 2010;116(2 pt 1):402-414.
- Duley L, Henderson-Smart DJ, Meher S, King JF. Antiplatelet agents for preventing pre-eclampsia and its complications. Cochrane Database Syst Rev. 2007;(2):CD004659.
- Askie LM, Duley L, Henderson-Smart DJ, Stewart LA; PARIS Collaborative Group. Antiplatelet agents for prevention of pre-eclampsia: a meta-analysis of individual patient data. Lancet. 2007;369(9575):1791-1798.
- American College of Obstetricians and Gynecologists, Task Force on Hypertension in Pregnancy. Hypertension in pregnancy. Report of the American College of Obstetricians and Gynecologists' Task Force on Hypertension in Pregnancy. Obstet Gynecol. 2013;122(5):1122-1131.
- Werner EF, Hauspurg AK, Rouse DJ. A cost-benefit analysis of low-dose aspirin prophylaxis for the prevention of preeclampsia in the United States. Obstet Gynecol. 2015;126(6):1242-1250.
- LeFevre ML; US Preventive Services Task Force. Low-dose aspirin use for the prevention of morbidity and mortality from preeclampsia: U.S. Preventive Services Task Force recommendation statement. Ann Intern Med. 2014;161(11):819-826.
- World Health Organization. WHO recommendations for prevention and treatment of pre-eclampsia and eclampsia. Geneva, Switzerland: WHO; 2011:13-15. https://www.preeclampsia.org/images/pdf/2011c-who_pe_final.pdf. Accessed January 4, 2016.
- National Institute for Health and Care Excellence. Hypertension in pregnancy: diagnosis and management. Clinical guideline 107. Manchester, United Kingdom: NICE; 2010:7. https://www.nice.org.uk/guidance/cg107/resources/hypertension-in-pregnancy-diagnosis-and-management-35109334009285. Accessed April 4, 2016.
- Magee LA, Pels A, Helewa M, Rey E, von Dadelszen P; Canadian Hypertensive Disorders of Pregnancy Working Group. Diagnosis, evaluation, and management of hypertensive disorders of pregnancy: executive summary. J Obstet Gynaecol Can. 2014;36(5):416-441.
- Roberge S, Demers S, Bujold E. Low-dose aspirin for prevention of morbidity and mortality from preeclampsia [letter to the editor]. Ann Intern Med. 2014;161(8):613.
- Henderson JT, O'Connor E, Whitlock EP. Low-dose aspirin for prevention of morbidity and mortality from preeclampsia [letter to the editor]. Ann Intern Med. 2014;161(8):613-614.
- Bujold E, Roberge S, Nicolaides KH. Low-dose aspirin for prevention of adverse outcomes related to abnormal placentation. Prenat Diagn. 2014;34(7):642-648.