User login
Make the Diagnosis - May 2016
Diagnosis: Perforating disorder
Histology on this patient revealed compact hyperkeratosis and parakeratosis with an entrapped neutrophilic crust and invaginated epidermis. The epidermis showed collagen fibers and the underlying dermis was fibrotic with inflammatory cells. PAS was negative. A Verhoeff-Van Gieson (VVG) stain failed to reveal elastic tissue fibers within the crusted stratum corneum. The results were consistent with a perforating disorder.
Perforating dermatoses result from the extrusion of dermal substances through epidermal channels without any alteration of nearby histologic structures. The substances in the upper dermis induce epidermal hyperplasia that results in the epidermis surrounding the dermal materials, with eventual elimination secondary to keratinocyte maturation and sloughing. Several different forms of perforating dermatoses exist, including reactive perforating collagenosis and the acquired perforating dermatosis diagnostic group (often associated with diabetes mellitus or chronic renal disease), which includes acquired reactive perforating collagenosis (RPC), elastosis perforans serpiginosa, perforating folliculitis, and Kyrle’s disease. Both RPC and perforating folliculitis may demonstrate koebnerization (a phenomenon in which superficial trauma induces lesion formation), which may help a clinician further delineate the specific perforating dermatosis diagnosis.
Reactive perforating collagenosis (RPC) consists of both a familial and an acquired form. The familial form is typically autosomal recessive and presents in childhood but may persist into adulthood. The acquired form develops in adulthood. Clinically, RPC presents as pruritic papules (1-3 mm) with a central dark keratotic plug, which enlarge but often regress after 2 months. Lesions often occur on the extremities and face with onset after superficial trauma (associated with scratching, arthropod bites, etc.). With acquired RPC, underlying systemic diseases are often present, including renal failure, diabetes, and occasionally liver disease or malignant neoplasm. Laboratory tests to screen for these conditions should be ordered as appropriate. In managing RPC, avoiding skin trauma and controlling itching appear to be the most important interventions. Lesions may resolve without treatment, but topical retinoids also may be useful.
Elastosis perforans serpiginosa (EPS) results from changes in both elastic and collagen fibers within the dermis, resulting in a foreign body reaction with transepidermal elimination. Clinically, EPS presents around the second decade of life as erythematous umbilicated papules (2-3 mm) with a central keratin plug arranged in an annular or serpiginous pattern. Lesions usually only involve one anatomic area (frequently the neck and upper extremities). Some of the associated conditions can be remembered with the mnemonic MADPPORES: Marfan syndrome, Acrogeria, Down syndrome, Penicillamine, Pseudoxanthoma elasticum, Osteogenesis imperfecta, Rothmund-Thomson syndrome, Ehlers-Danlos (some forms), and Scleroderma. Regression of lesions often leaves hypopigmented scars. Treatment with cryotherapy may be useful, but electrocautery, dermabrasion, and surgery should be avoided.
Perforating folliculitis is characterized by adult-onset scaly follicular papules with a white central keratotic plug (may contain curled hair) on the extensor surfaces of the extremities and buttocks. Lesions may be pruritic but are more often asymptomatic. The pathophysiology includes the transfollicular extrusion of dermal debris (keratin, cellular debris, degenerated collagen, or degenerated elastic fibers), which may be expressed when the papule is compressed. Perforating folliculitis is often associated with chronic renal failure, diabetes mellitus, and other systemic diseases. The lesions may resolve after stabilization of the underlying disease, including renal transplantation. Management focuses on controlling pruritus with oral antihistamines and topical soothing lotions (menthol, phenol, or camphor), but other unsubstantiated treatments have been tried, including UVB, oral retinoids, and topical retinoids.
Kyrle’s disease (hyperkeratosis folliculitis) may have both an acquired and autosomal recessive form. In the inherited form, a genetic disturbance may accelerate epidermal keratinization, resulting in dyskeratotic foci and parakeratosis that penetrate the dermis and induce a granulomatous inflammatory reaction. The acquired form may be associated with diabetic nephropathy, hemodialysis secondary to diabetic nephropathy, congestive heart failure, and liver disease. In contrast to other perforating disorders, the extruded material is predominantly keratin rather than elastic fibers or collagen. Clinically, Kyrle’s disease presents around age 30 years as discrete, pruritic, and scaly folliculocentric papules (1-8 mm) with a hyperkeratotic plug (one-third of diameter). With removal of the plug, a cutaneous depression remains (Kyrle’s phenomenon). The lesions also may coalesce into plaques. Typically, the bilateral lower extremities and extensor surfaces are involved, but lesions may present on any area except for plantar, palmar, and mucosal surfaces. Management should focus on treating the associated medical condition, but UVB and tretinoin also have been used. Other treatment options include allopurinol, psoralen plus UVA, acitretin, phenol, doxycycline, surgical debridement, and topical corticosteroids. Regardless, lesions may resolve and leave atrophic scars.
This case and photo were submitted by Dr. Damon McClain of Three Rivers Dermatology in Coraopolis, Pa., and Mark Ash, a medical student at East Carolina University, Greenville, N.C.
Dr. Bilu Martin is in private practice at Premier Dermatology, MD, in Aventura, Fla. More diagnostic cases are available at edermatologynews.com. To submit your case for possible publication, send an email to [email protected].

A 41-year-old black male with a past medical history of a kidney transplant, currently on dialysis and waiting for another kidney transplant, presented with a 2-month history of a pruritic rash on the upper body consisting of erythematous papules with central erosions.

Using videos to educate your ObGyn patients
Patient barriers to optimal health-care outcomes are well documented. According to a 2003 estimate from the National Center for Education Statistics, 9 in 10 individuals do not know how to adequately access information readily available for their own health care.1 A December 7, 2013, report in Modern Healthcare stated, “When patients are in doctors’ offices, they (might) hear 50% of what’s being said and maybe their relative hears another 30%, but they walk away without 20%.”2
In addition, patients often do not fill or refill their prescriptions. More than 31% of about 37,000 prescriptions written in a primary care setting for nearly 16,000 patients were not filled.3 Reasons may be poor health literacy, a medication’s expense, or disappointment with lack of drug efficacy. In a 2010 Commonwealth Fund survey, 23.1% of US patients reported not filling a drug prescription in the previous 12 months due to cost,4 and in 2012, 27% did not follow through with recommended testing or treatment.5
On the physician side, the advent of managed care, electronic health records, and requirements to document extraneous information have shortened “face time” with patients. This means less time to educate patients about their conditions and treatments. And patients who have insufficient information may have trouble adhering with recommendations and experience unsatisfactory outcomes.
Using focused patient-education videos can help you circumvent in-office time constraints and inform patients of their conditions and your recommendations, thereby increasing practice efficiency and improving patient outcomes. There are certain considerations you should keep in mind when implementing and executing videos for patients.
Planning your video
With videos, you can convey to patients the exact message you want them to receive. This is far more effective and more appreciatedthan videos distributed by pharmaceutical companies and vendors of equipment used in your office or hospital. If you do not have the time to create patient videos, purchasing professionally created videos could be worth the cost; however, those created by physicians are far better and can be a source of enhanced communication when patients see their own physician on the screen discussing the condition, procedure, or medications prescribed.
We suggest selecting topics you regularly discuss with patients. If the topic of prolapse arises several times a day or week, a video presentation about it would be appropriate. Other topics of interest to gynecology patients are shown in the TABLE. The topics included are those that many of our colleagues find that they discuss with patients frequently and are in need of an instructional video.
Example video topics for patient viewing
• Evaluation of urinary incontinence
• Recurrent urinary tract infection
• Infertility evaluation
• Options for hysterectomy
• Management of menometrorrhagia
• Contraception options (including bilateral tubal ligation)
• Pros and cons of hormone replacement therapy
• Breast self examination
One of us (NB) likes to select topics that are receiving lots of publicity. For example, when flibanserin was approved by the US Food and Drug Administration in 2015 and patients were asking about it, we created a video with a handout that summarized the drug’s actions and its adverse effects and that emphasized the precaution about using flibanserin in conjunction with alcohol.
Production elements
The script.
- Define the problem/condition
- Offer how the problem is evaluated
- Discuss treatment options
- Go over risks and complications
- Include a summary.
Embedding details of these bullet points into a PowerPoint presentation can serve as your teleprompter. Each video might end with the statement, “I hope you have found this video on <name of topic> informative. If you open the door at the end of the video, I will return to the examination room and provide you with a summary of the <topic> and answer any questions you may have.” We refer to this as the “sandwich technique,” in which the physician interacts with the patient first and performs the examination, invites the patient to watch the video, and returns to the room to conclude the patient visit.
The recording device. Recording can be accomplished easily with technology available in nearly every ObGyn office. You can use a video camera, the webcam on your computer, or a smart phone (probably the easiest choice). The quality of video created with the Apple, Samsung, or Motorola devices is excellent. The only other piece of equipment we recommend is a flexible tripod to hold the phone. Several such tripod stands are available for purchase, but the type with a flexible stand can be beneficial (FIGURE 1). These are available for purchase on Amazon.
| FIGURE 1 Our recommended tripod stand | ||
| ||
The TriFlex Mini Phone Tripod Stand, available for purchase at retailers and at Amazon (http://www.amazon.com/dp/B017NA7V1U?psc=1). | ||

Putting it all together. With the smartphone in the tripod attached to the computer and the PowerPoint program serving as your notes, you are ready to create a video. We suggest limiting the recording to 5 to 7 minutes, the attention span of most patients. Those who want to produce a more professional looking video can use the editing programs iMovie on the Mac or Movie Maker on the PC.
Videos can be uploaded to your website, your EMR, or onto separate computers in each of your examination rooms. Depending on where you upload your videos (your own website or YouTube), patients can access them from home. An advantage of your own website and YouTube is that the videos can be viewed again and by patients’ significant others (which patients often inquire about the ability to do).
Other considerations
Videos that are conversational in nature, using the pronouns “I” and “we” and using such language as “my opinion” and “our patients” may hold the attention of viewers more than didactic “talking head” videos. In addition, creating videos on controversial topics that patients are interested in and need more information about can benefit patients and your practice.
Creating videos in other languages for your patients is an option as well. If you speak the language, then create your video in both English and the other language. Or you can create the script and ask a patient who speaks the non-English language to assist with the video production or voiceover. Also, there are other language videos for patients on YouTube. An excellent example of a Spanish-language gynecologic video on the pelvic examination is available (https://www.youtube.com/watch?v=IKsGYc-dCSI). It is easy to create a link from your website to a YouTube video. This requires requesting permission from the creator of the video. (We do not recommend showcasing another physician on your website.)
Example Patient education videos
Examples of videos on stress urinary incontinence and treatment with a midurethral sling can be viewed at: https://www.youtube.com/watch?v=BFZj8x3-oCA and https://www.youtube.com/watch?v=-gnOqkXiye0.
Dr. Neil Baum is the author of Social Media for the Healthcare Professional (Greenbranch Publishing, 2012).
Advantages of creating videos
When patients are watching the video, you can conduct visits with other patients and even perform brief office procedures. You can anticipate an up to 15% to 20% improvement in office efficiency by using educational videos. And patients will appreciate the information and the written summary accompanying each video.
Videos and medical-legal protection
Documentation is necessary to protect yourself from litigation. Record the viewing of a video in a patient’s chart, as well as the receipt of pertinent written information. We suggest you also note that all of the patient’s questions were answered before the patient left the office. To confirm that the patient understood the condition, procedure, or surgery, you can ask the patient to fill out a true/false questionnaire after watching the video and also include it in the chart. A questionnaire I (NB) use after the patient watches a video on stress incontinence is shown in FIGURE 2.
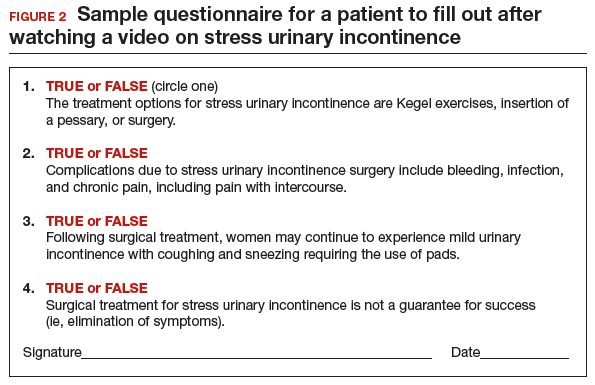
A statement to accompany the questionnaire is also a good idea. Example: “<name of patient> watched a video on the treatment of stress incontinence. The video discussed the procedure and its risks and complications, and alternate treatments, including the option to have no treatment. She agrees to proceeding with a midurethral sling using synthetic mesh and understands the risks and complications associated with the use of mesh.”
An additional helpful option is to end your videos with a comment that addresses the statement and consent form you will ask the patient to sign. For instance, “I will return to the examination room and provide you with a summary of the <topic> and answer any questions you may have. I also will ask you to sign a procedure or operative consent form as well as sign a statement that says you have watched the video, understand the content, and have had your questions answered.”
We believe that this makes the video an excellent medical-legal protection tool for the physician and that the video enhances the informed consent process.
Bottom line
We are challenged today to provide quality care in an efficient and cost-effective manner. This is a concern for every ObGyn practice regardless of its size or location or whether it is a solo or group practice or academic or private. We can improve our efficiency and our productivity, maintain quality of care, improve patient adherence, and even improve outcomes using patient videos. So get ready for lights, camera, and action!
Share your thoughts! Send your Letter to the Editor to [email protected]. Please include your name and the city and state in which you practice.
- Kutner M, Greenberg E, Jin Y, et al. The Health Literacy of America’s Adults: Results from the 2003 National Assessment of Adult Literacy. Washington, DC: National Center for Education Statistics, US Dept of Education, 2006.
- 1NCES publication 2006-483.2. Modern Healthcare. Providers help patients address emotion, money, health literacy. Available at: http://www.modernhealthcare.com/article/20131207/MAGAZINE/312079983. Accessed April 15, 2016.
- Tamblyn R, Eguale T, Huang A, Winsdale N, Doran P. The incidence and determinants of primary nonadherence with prescribed medication in primary care: a cohort study. Ann Intern Med. 2014;160(7):441–450.
- Morgan S, Kennedy J. Prescription drug accessibility and affordability in the United States and abroad. Issue Brief (Commonw Fund). 2010;89:1012.
- Collins SR, Robertson R, Garber T, et al. Insuring the future. Current trends in health coverage and the effects of implementing the Affordable Care Act. Available at: http://www.commonwealthfund.org/~/media/Files/Publications/Fund%20Report/2013/Apr/1681_Collins_insuring_future_biennial_survey_2012_FINAL.pdf. Accessed April 15, 2016.
Neil H. Baum, MD, and Mickey M. Karram, MD

Dr. Baum practices urology in New Orleans, Louisiana, and is Associate Clinical Professor of Urology, Tulane Medical School and Louisiana State University School of Medicine, New Orleans. Dr. Baum is an OBG Management Contributing Editor.

Dr. Karram is Professor of Obstetrics and Gynecology and Urology, University of Cincinnati School of Medicine, and Director, Urogynecology, The Christ Hospital, Cincinnati, Ohio.
The authors report no financial relationships relevant to this article.
Neil H. Baum, MD, and Mickey M. Karram, MD
Dr. Baum practices urology in New Orleans, Louisiana, and is Associate Clinical Professor of Urology, Tulane Medical School and Louisiana State University School of Medicine, New Orleans. Dr. Baum is an OBG Management Contributing Editor.
Dr. Karram is Professor of Obstetrics and Gynecology and Urology, University of Cincinnati School of Medicine, and Director, Urogynecology, The Christ Hospital, Cincinnati, Ohio.
The authors report no financial relationships relevant to this article.
Patient barriers to optimal health-care outcomes are well documented. According to a 2003 estimate from the National Center for Education Statistics, 9 in 10 individuals do not know how to adequately access information readily available for their own health care.1 A December 7, 2013, report in Modern Healthcare stated, “When patients are in doctors’ offices, they (might) hear 50% of what’s being said and maybe their relative hears another 30%, but they walk away without 20%.”2
In addition, patients often do not fill or refill their prescriptions. More than 31% of about 37,000 prescriptions written in a primary care setting for nearly 16,000 patients were not filled.3 Reasons may be poor health literacy, a medication’s expense, or disappointment with lack of drug efficacy. In a 2010 Commonwealth Fund survey, 23.1% of US patients reported not filling a drug prescription in the previous 12 months due to cost,4 and in 2012, 27% did not follow through with recommended testing or treatment.5
On the physician side, the advent of managed care, electronic health records, and requirements to document extraneous information have shortened “face time” with patients. This means less time to educate patients about their conditions and treatments. And patients who have insufficient information may have trouble adhering with recommendations and experience unsatisfactory outcomes.
Using focused patient-education videos can help you circumvent in-office time constraints and inform patients of their conditions and your recommendations, thereby increasing practice efficiency and improving patient outcomes. There are certain considerations you should keep in mind when implementing and executing videos for patients.
Planning your video
With videos, you can convey to patients the exact message you want them to receive. This is far more effective and more appreciatedthan videos distributed by pharmaceutical companies and vendors of equipment used in your office or hospital. If you do not have the time to create patient videos, purchasing professionally created videos could be worth the cost; however, those created by physicians are far better and can be a source of enhanced communication when patients see their own physician on the screen discussing the condition, procedure, or medications prescribed.
We suggest selecting topics you regularly discuss with patients. If the topic of prolapse arises several times a day or week, a video presentation about it would be appropriate. Other topics of interest to gynecology patients are shown in the TABLE. The topics included are those that many of our colleagues find that they discuss with patients frequently and are in need of an instructional video.
Example video topics for patient viewing
• Evaluation of urinary incontinence
• Recurrent urinary tract infection
• Infertility evaluation
• Options for hysterectomy
• Management of menometrorrhagia
• Contraception options (including bilateral tubal ligation)
• Pros and cons of hormone replacement therapy
• Breast self examination
One of us (NB) likes to select topics that are receiving lots of publicity. For example, when flibanserin was approved by the US Food and Drug Administration in 2015 and patients were asking about it, we created a video with a handout that summarized the drug’s actions and its adverse effects and that emphasized the precaution about using flibanserin in conjunction with alcohol.
Production elements
The script.
- Define the problem/condition
- Offer how the problem is evaluated
- Discuss treatment options
- Go over risks and complications
- Include a summary.
Embedding details of these bullet points into a PowerPoint presentation can serve as your teleprompter. Each video might end with the statement, “I hope you have found this video on <name of topic> informative. If you open the door at the end of the video, I will return to the examination room and provide you with a summary of the <topic> and answer any questions you may have.” We refer to this as the “sandwich technique,” in which the physician interacts with the patient first and performs the examination, invites the patient to watch the video, and returns to the room to conclude the patient visit.
The recording device. Recording can be accomplished easily with technology available in nearly every ObGyn office. You can use a video camera, the webcam on your computer, or a smart phone (probably the easiest choice). The quality of video created with the Apple, Samsung, or Motorola devices is excellent. The only other piece of equipment we recommend is a flexible tripod to hold the phone. Several such tripod stands are available for purchase, but the type with a flexible stand can be beneficial (FIGURE 1). These are available for purchase on Amazon.
| FIGURE 1 Our recommended tripod stand | ||
| ||
The TriFlex Mini Phone Tripod Stand, available for purchase at retailers and at Amazon (http://www.amazon.com/dp/B017NA7V1U?psc=1). | ||
Putting it all together. With the smartphone in the tripod attached to the computer and the PowerPoint program serving as your notes, you are ready to create a video. We suggest limiting the recording to 5 to 7 minutes, the attention span of most patients. Those who want to produce a more professional looking video can use the editing programs iMovie on the Mac or Movie Maker on the PC.
Videos can be uploaded to your website, your EMR, or onto separate computers in each of your examination rooms. Depending on where you upload your videos (your own website or YouTube), patients can access them from home. An advantage of your own website and YouTube is that the videos can be viewed again and by patients’ significant others (which patients often inquire about the ability to do).
Other considerations
Videos that are conversational in nature, using the pronouns “I” and “we” and using such language as “my opinion” and “our patients” may hold the attention of viewers more than didactic “talking head” videos. In addition, creating videos on controversial topics that patients are interested in and need more information about can benefit patients and your practice.
Creating videos in other languages for your patients is an option as well. If you speak the language, then create your video in both English and the other language. Or you can create the script and ask a patient who speaks the non-English language to assist with the video production or voiceover. Also, there are other language videos for patients on YouTube. An excellent example of a Spanish-language gynecologic video on the pelvic examination is available (https://www.youtube.com/watch?v=IKsGYc-dCSI). It is easy to create a link from your website to a YouTube video. This requires requesting permission from the creator of the video. (We do not recommend showcasing another physician on your website.)
Example Patient education videos
Examples of videos on stress urinary incontinence and treatment with a midurethral sling can be viewed at: https://www.youtube.com/watch?v=BFZj8x3-oCA and https://www.youtube.com/watch?v=-gnOqkXiye0.
Dr. Neil Baum is the author of Social Media for the Healthcare Professional (Greenbranch Publishing, 2012).
Advantages of creating videos
When patients are watching the video, you can conduct visits with other patients and even perform brief office procedures. You can anticipate an up to 15% to 20% improvement in office efficiency by using educational videos. And patients will appreciate the information and the written summary accompanying each video.
Videos and medical-legal protection
Documentation is necessary to protect yourself from litigation. Record the viewing of a video in a patient’s chart, as well as the receipt of pertinent written information. We suggest you also note that all of the patient’s questions were answered before the patient left the office. To confirm that the patient understood the condition, procedure, or surgery, you can ask the patient to fill out a true/false questionnaire after watching the video and also include it in the chart. A questionnaire I (NB) use after the patient watches a video on stress incontinence is shown in FIGURE 2.
A statement to accompany the questionnaire is also a good idea. Example: “<name of patient> watched a video on the treatment of stress incontinence. The video discussed the procedure and its risks and complications, and alternate treatments, including the option to have no treatment. She agrees to proceeding with a midurethral sling using synthetic mesh and understands the risks and complications associated with the use of mesh.”
An additional helpful option is to end your videos with a comment that addresses the statement and consent form you will ask the patient to sign. For instance, “I will return to the examination room and provide you with a summary of the <topic> and answer any questions you may have. I also will ask you to sign a procedure or operative consent form as well as sign a statement that says you have watched the video, understand the content, and have had your questions answered.”
We believe that this makes the video an excellent medical-legal protection tool for the physician and that the video enhances the informed consent process.
Bottom line
We are challenged today to provide quality care in an efficient and cost-effective manner. This is a concern for every ObGyn practice regardless of its size or location or whether it is a solo or group practice or academic or private. We can improve our efficiency and our productivity, maintain quality of care, improve patient adherence, and even improve outcomes using patient videos. So get ready for lights, camera, and action!
Share your thoughts! Send your Letter to the Editor to [email protected]. Please include your name and the city and state in which you practice.
- Kutner M, Greenberg E, Jin Y, et al. The Health Literacy of America’s Adults: Results from the 2003 National Assessment of Adult Literacy. Washington, DC: National Center for Education Statistics, US Dept of Education, 2006.
- 1NCES publication 2006-483.2. Modern Healthcare. Providers help patients address emotion, money, health literacy. Available at: http://www.modernhealthcare.com/article/20131207/MAGAZINE/312079983. Accessed April 15, 2016.
- Tamblyn R, Eguale T, Huang A, Winsdale N, Doran P. The incidence and determinants of primary nonadherence with prescribed medication in primary care: a cohort study. Ann Intern Med. 2014;160(7):441–450.
- Morgan S, Kennedy J. Prescription drug accessibility and affordability in the United States and abroad. Issue Brief (Commonw Fund). 2010;89:1012.
- Collins SR, Robertson R, Garber T, et al. Insuring the future. Current trends in health coverage and the effects of implementing the Affordable Care Act. Available at: http://www.commonwealthfund.org/~/media/Files/Publications/Fund%20Report/2013/Apr/1681_Collins_insuring_future_biennial_survey_2012_FINAL.pdf. Accessed April 15, 2016.
In this article
• Videos and medical-legal protection
• Patient questionnaire post-video viewing

Aprepitant Protects Against Chemo-Induced Nausea and Vomiting
According to international guidelines, > 90% of patients on a cisplatin regimen experience chemotherapy-induced nausea and vomiting (CINV). Antiemetic prophylaxis with a 5 hydroxytryptamine receptor-3 antagonist (5-HT3RA) plus dexamethasone still leaves about 20% of patients with acute or delayed vomiting and nausea during the first cycle of chemotherapy. However, researchers from Chang Gung University in Taiwan found that adding aprepitant provided about 70% complete protection against emesis when the primary prophylaxis did not work. Those findings led them to conduct a study that evaluated the antiemetic efficacy of a combination of 3 drugs: palonosetron (a long-acting second-generation 5-HT3RA), 3-day oral aprepitant (a neurokinin-1 receptor antagonist), and dexamethasone.
Related: Delayed Adjuvant Chemotherapy Significantly Affects Breast Cancer Recovery
Patients in the study were scheduled to receive at least 50 mg/m2 cisplatin followed by a continuous infusion of 5-fluorouracil (5-FU) with or without other chemotherapeutic agents. Cisplatin was given on day 1; the other drugs were given on day 1 and subsequent days. All 69 patients who received palonosetron, aprepitant, and dexamethasone were evaluated in the first cycle of chemotherapy.
No patients experienced acute vomiting; nearly all (98.6%) were protected against nausea. Moreover, 97.1% had no delayed vomiting, and 87% had no delayed nausea. Most episodes of delayed nausea were rated as mild. Overall, 97.1% of patients had no vomiting, and 85.5% of patients had no nausea.
Related: FDA Approves Rescue Drug for Chemotherapy Overdose
The effects were sustained. In the second cycle of chemotherapy, again, none of 61 evaluated patients experienced acute vomiting, and 96.7% were free of nausea. Most patients also were protected against delayed vomiting or nausea (96.7% and 83.6%, respectively). Of patients who underwent 2 cycles, 45 did not experience nausea or vomiting in either cycle.
The combination of drugs was generally well tolerated; most adverse events were mild.
Yang C-K, Wu C-E, Liaw C-C. Biomed J. 2016;39(1):60-66.
doi: 10.1016/j.bj.2015.08.006.
Baseline King-Devick concussion score skewed by English proficiency issues
VANCOUVER – In a study at New York University, it took 27 healthy, native English–speaking volunteers 42.8 seconds to complete the King-Devick concussion screening test, which is about average for nonconcussed subjects.
However, it took 27 other volunteers with English as a second language 54.4 seconds (P = .001). Had the test been given on the sidelines instead of in a laboratory, the extra 12 seconds might easily have been mistaken as a sign of serious concussion because concussions generally add about 5 seconds to the King-Devick score.

“A prolongation of 12 seconds in non-native English speakers has real clinical implications,” said lead investigator Katharine Dempsey, a medical student and member of the eye movement research team in the department of neurology at New York University.
King-Devick (KD) is an increasingly popular sideline screening tool used widely in professional sports. Subjects are timed on how long it takes to read out loud and in English three sets of 40 numbers, with each set progressively more difficult to read. It’s administered by flashcards or, as in the study, by computer screen.
All of the non-native speakers at NYU were largely proficient in English, but their native languages – 18 in total, most often Spanish or Chinese – were often dominant, meaning they were used at home and to work out mental arithmetic. Some subjects did not use Roman numerals or right-to-left reading in their native tongues.
KD instructions recommend testing subjects against their own preseason baseline scores; the NYU findings emphasize how important that is when subjects aren’t native English speakers. The investigators are concerned that when baseline scores are unavailable, non-native English speakers will be scored against reference ranges for native speakers.
“There’s incredible utility in using a sideline concussion screening test, but we definitely have to get out the message that the best practice is to take an athlete’s own preseason baseline. We have to be incredibly cautious when comparing test times of non-native English speakers to a normative database for native speakers,” Ms. Dempsey said at the annual meeting of the American Academy of Neurology.
The participants were in their early 30s, on average, and had no histories of concussion. The majority were women, and most were NYU employees or their friends.
The team also tracked eye movements during testing. Non-native speakers had more quick eye movement (149 vs. 135; P = .03), but also fixated longer on numbers before initiating eye movement (345.4 milliseconds vs. 288.0; P = .007). Lag time correlated with native language dominance and suggests longer processing time.
The next step is to test how well patients do with KD testing in their native language, Ms. Dempsey said.
Ms. Dempsey had no disclosures.
VANCOUVER – In a study at New York University, it took 27 healthy, native English–speaking volunteers 42.8 seconds to complete the King-Devick concussion screening test, which is about average for nonconcussed subjects.
However, it took 27 other volunteers with English as a second language 54.4 seconds (P = .001). Had the test been given on the sidelines instead of in a laboratory, the extra 12 seconds might easily have been mistaken as a sign of serious concussion because concussions generally add about 5 seconds to the King-Devick score.
“A prolongation of 12 seconds in non-native English speakers has real clinical implications,” said lead investigator Katharine Dempsey, a medical student and member of the eye movement research team in the department of neurology at New York University.
King-Devick (KD) is an increasingly popular sideline screening tool used widely in professional sports. Subjects are timed on how long it takes to read out loud and in English three sets of 40 numbers, with each set progressively more difficult to read. It’s administered by flashcards or, as in the study, by computer screen.
All of the non-native speakers at NYU were largely proficient in English, but their native languages – 18 in total, most often Spanish or Chinese – were often dominant, meaning they were used at home and to work out mental arithmetic. Some subjects did not use Roman numerals or right-to-left reading in their native tongues.
KD instructions recommend testing subjects against their own preseason baseline scores; the NYU findings emphasize how important that is when subjects aren’t native English speakers. The investigators are concerned that when baseline scores are unavailable, non-native English speakers will be scored against reference ranges for native speakers.
“There’s incredible utility in using a sideline concussion screening test, but we definitely have to get out the message that the best practice is to take an athlete’s own preseason baseline. We have to be incredibly cautious when comparing test times of non-native English speakers to a normative database for native speakers,” Ms. Dempsey said at the annual meeting of the American Academy of Neurology.
The participants were in their early 30s, on average, and had no histories of concussion. The majority were women, and most were NYU employees or their friends.
The team also tracked eye movements during testing. Non-native speakers had more quick eye movement (149 vs. 135; P = .03), but also fixated longer on numbers before initiating eye movement (345.4 milliseconds vs. 288.0; P = .007). Lag time correlated with native language dominance and suggests longer processing time.
The next step is to test how well patients do with KD testing in their native language, Ms. Dempsey said.
Ms. Dempsey had no disclosures.
AT THE AAN 2016 ANNUAL MEETING
Key clinical point: King-Devick instructions recommend testing subjects against their own preseason baseline scores; the NYU findings emphasize how important that is when subjects aren’t native English speakers.
Major finding: It took 27 healthy, native English–speaking volunteers 42.8 seconds to complete the King-Devick concussion screening test, but 27 other volunteers with English as a second language 54.4 seconds (P = .001).
Data source: Prospective screening of 54 healthy volunteers.
Disclosures: The presenter had no disclosures.

Five Situations Where Hospitalists Need a Healthcare Attorney
It is inevitable that, at some point in your career, you will need to hire a healthcare attorney. Proper representation is the best way to ensure a positive outcome in any situation.

Physicians often consider tackling certain issues on their own to reduce costs and avoid complicating matters. However, there are at least five situations in which you must retain an experienced healthcare attorney, or you could end up underpaid, subject to overreaching restrictive covenants, severely fined, or responsible for a large settlement.
1. Negotiating an Employment Contract
Whether you are considering a position as an employee of a physician group, hospital, or health system, it is critical that you understand the employment agreement presented to you so you can be sure it is fair and represents your best interests. The agreement itself defines the scope and conditions of your employment and consequently impacts your personal and professional satisfaction. It usually contains confusing legal terminology, such as noncompetition and nonsolicitation clauses. If you do not understand these terms, problems may arise in the future regarding your rights and capabilities upon termination of employment.

For these reasons, it is critical to engage a healthcare attorney who is well-versed in physician employment agreements. At a minimum, an attorney can confirm whether the compensation offered is comparable to that of physicians with similar experience and skills in your geographical area. The attorney can decipher confusing bonus compensation and may be able to negotiate more favorable terms. The same is true of understanding the benefits offered and establishing your call coverage.
An attorney will be able to advise you when it is appropriate to push back and request additional benefits or propose more favorable changes to your call coverage. Most important, the attorney will clarify the term of the employment agreement, the corresponding termination provisions, and any restrictions on your ability to practice upon termination of the agreement. Although the ultimate decision to accept the employment offer rests solely with you, an experienced healthcare attorney can help you understand the agreement and give you confidence in that decision.
2. Leaving a Practice for New Opportunities or Retirement
Whether you decide to leave a practice to pursue a new opportunity or because you are retiring, it is critical that you engage a healthcare attorney to help you navigate this road. If you are leaving to pursue new opportunities, an attorney can help you understand any restrictive covenants that may apply upon your departure and who retains ownership of the medical records of patients you treated while employed by the practice. In addition, you’ll be assisted in drafting any required notifications to patients alerting them of your departure.
If you are leaving the practice due to retirement, there are additional concerns. If you own the practice, you will need to decide whether to sell the practice or wind it down. If you decide to sell, an attorney can help you negotiate a favorable merger agreement and file any required change of ownership forms. If you choose to wind down your practice, your employee agreements and service and vendor contracts, including managed care participation agreements, will need to be reviewed for specific termination and notice requirements.
As with departure from a practice, there are certain notifications that must be issued to your patients detailing the closure of your practice and addressing patient options for continuity of care. An attorney can draft such notifications for you and, in addition, will be able to assist with notifying your malpractice carrier of your retirement and ensuring you have proper continuing coverage.
Finally, an attorney can arrange custody of your medical records in accordance with applicable state record retention requirements, help wind down your financial matters, and terminate your practice’s professional entity.
3. Practice Mergers
Engaging a healthcare transaction attorney protects your investment in your practice and in the practice with which you decide to merge. Healthcare mergers, due to the complex rules and regulations governing the industry, are uniquely complicated. A traditional business lawyer with merger experience likely will not understand regulations that solely impact healthcare mergers, which can lead to regulatory fines and penalties.
Therefore, if you are considering merging your practice, it is critical that you engage an attorney who is highly experienced in the legal implications of healthcare transactions and who has a deep understanding of the Anti-Kickback Statute, Stark Law, and other applicable regulations. Doing so is the only way to ensure compliance with healthcare rules and regulations.
4. Payor Audits
The number of payor audits is increasing dramatically. Payor audits can involve Medicare, Medicaid, or third-party payors. When an audit notice is received, there often is a limited time period to respond. Therefore, it is imperative that you engage an experienced healthcare attorney upon receipt of such a notice to draft a professional response to the audit request and help you gather the requested documents in accordance with the time frames specified in the notice.
In addition, an attorney can address procedural, legal, or factual flaws in the auditor’s position, which can prevent repayment of significant monetary penalties and suspension or revocation of billing privileges.
5. Malpractice Allegations
Without question, if you are subject to a medical malpractice lawsuit, you absolutely must retain an experienced healthcare attorney. Your insurance company will usually hire one for you, but that is not always the case.
Medical malpractice cases are extremely complicated. To prevail, you need an attorney who not only understands the law but also the practice of medicine. A healthcare attorney will not only know what litigation filings are required but will be able to arrange expert witnesses to help prove that you acted in accordance with professional standards.
In Sum
It is critical that an experienced healthcare attorney be hired to help manage these situations and many more. There is no better way to protect the professional and personal interests you have worked so hard to build. TH
It is inevitable that, at some point in your career, you will need to hire a healthcare attorney. Proper representation is the best way to ensure a positive outcome in any situation.
Physicians often consider tackling certain issues on their own to reduce costs and avoid complicating matters. However, there are at least five situations in which you must retain an experienced healthcare attorney, or you could end up underpaid, subject to overreaching restrictive covenants, severely fined, or responsible for a large settlement.
1. Negotiating an Employment Contract
Whether you are considering a position as an employee of a physician group, hospital, or health system, it is critical that you understand the employment agreement presented to you so you can be sure it is fair and represents your best interests. The agreement itself defines the scope and conditions of your employment and consequently impacts your personal and professional satisfaction. It usually contains confusing legal terminology, such as noncompetition and nonsolicitation clauses. If you do not understand these terms, problems may arise in the future regarding your rights and capabilities upon termination of employment.
For these reasons, it is critical to engage a healthcare attorney who is well-versed in physician employment agreements. At a minimum, an attorney can confirm whether the compensation offered is comparable to that of physicians with similar experience and skills in your geographical area. The attorney can decipher confusing bonus compensation and may be able to negotiate more favorable terms. The same is true of understanding the benefits offered and establishing your call coverage.
An attorney will be able to advise you when it is appropriate to push back and request additional benefits or propose more favorable changes to your call coverage. Most important, the attorney will clarify the term of the employment agreement, the corresponding termination provisions, and any restrictions on your ability to practice upon termination of the agreement. Although the ultimate decision to accept the employment offer rests solely with you, an experienced healthcare attorney can help you understand the agreement and give you confidence in that decision.
2. Leaving a Practice for New Opportunities or Retirement
Whether you decide to leave a practice to pursue a new opportunity or because you are retiring, it is critical that you engage a healthcare attorney to help you navigate this road. If you are leaving to pursue new opportunities, an attorney can help you understand any restrictive covenants that may apply upon your departure and who retains ownership of the medical records of patients you treated while employed by the practice. In addition, you’ll be assisted in drafting any required notifications to patients alerting them of your departure.
If you are leaving the practice due to retirement, there are additional concerns. If you own the practice, you will need to decide whether to sell the practice or wind it down. If you decide to sell, an attorney can help you negotiate a favorable merger agreement and file any required change of ownership forms. If you choose to wind down your practice, your employee agreements and service and vendor contracts, including managed care participation agreements, will need to be reviewed for specific termination and notice requirements.
As with departure from a practice, there are certain notifications that must be issued to your patients detailing the closure of your practice and addressing patient options for continuity of care. An attorney can draft such notifications for you and, in addition, will be able to assist with notifying your malpractice carrier of your retirement and ensuring you have proper continuing coverage.
Finally, an attorney can arrange custody of your medical records in accordance with applicable state record retention requirements, help wind down your financial matters, and terminate your practice’s professional entity.
3. Practice Mergers
Engaging a healthcare transaction attorney protects your investment in your practice and in the practice with which you decide to merge. Healthcare mergers, due to the complex rules and regulations governing the industry, are uniquely complicated. A traditional business lawyer with merger experience likely will not understand regulations that solely impact healthcare mergers, which can lead to regulatory fines and penalties.
Therefore, if you are considering merging your practice, it is critical that you engage an attorney who is highly experienced in the legal implications of healthcare transactions and who has a deep understanding of the Anti-Kickback Statute, Stark Law, and other applicable regulations. Doing so is the only way to ensure compliance with healthcare rules and regulations.
4. Payor Audits
The number of payor audits is increasing dramatically. Payor audits can involve Medicare, Medicaid, or third-party payors. When an audit notice is received, there often is a limited time period to respond. Therefore, it is imperative that you engage an experienced healthcare attorney upon receipt of such a notice to draft a professional response to the audit request and help you gather the requested documents in accordance with the time frames specified in the notice.
In addition, an attorney can address procedural, legal, or factual flaws in the auditor’s position, which can prevent repayment of significant monetary penalties and suspension or revocation of billing privileges.
5. Malpractice Allegations
Without question, if you are subject to a medical malpractice lawsuit, you absolutely must retain an experienced healthcare attorney. Your insurance company will usually hire one for you, but that is not always the case.
Medical malpractice cases are extremely complicated. To prevail, you need an attorney who not only understands the law but also the practice of medicine. A healthcare attorney will not only know what litigation filings are required but will be able to arrange expert witnesses to help prove that you acted in accordance with professional standards.
In Sum
It is critical that an experienced healthcare attorney be hired to help manage these situations and many more. There is no better way to protect the professional and personal interests you have worked so hard to build. TH
Drug produces similar results in older and younger ALL patients

Photo from MD Anderson
Data from two phase 2 studies suggests single-agent blinatumomab produces similar outcomes in adults with relapsed/refractory acute lymphoblastic leukemia (ALL), regardless of age.
Patients age 65 and older had similar hematologic response rates and relapse-free survival rates as patients younger than 65.
The incidence of grade 3 or higher adverse events (AEs) was similar between the age groups as well.
Older patients did have more serious AEs, however. And they had more neurologic events, but these were reversible.
Hagop M. Kantarjian, MD, of the University of Texas MD Anderson Cancer Center in Houston, and his colleagues reported these results in Cancer. The research was funded by Amgen Inc., makers of blinatumomab.
Patients
The researchers examined 261 adults with relapsed/refractory ALL who were enrolled in 2 different studies. There were 36 patients who were 65 or older and 225 patients who were younger than 65. The median ages were 70 (range, 65-79) and 34 (range, 18-64), respectively.
Among the older patients, 14% had primary refractory disease, 67% had 1 prior relapse, 14% had 2 prior relapses, and 6% had 3 or more. Among the younger patients, 9% had primary refractory disease, 55% had 1 prior relapse, 26% had 2 prior relapses, and 10% had 3 or more.
The younger patients were more likely to have received an allogeneic hematopoietic stem cell transplant (allo-HSCT) than the older patients—37% and 11%, respectively.
But older patients were more likely to have mild renal impairment (42% vs 13%) or moderate renal impairment (22% vs 1%).
Treatment
All patients received blinatumomab, and stepwise dosing was used to reduce the risk of cytokine release syndrome. A treatment cycle consisted of 4 weeks of continuous intravenous infusions, followed by a 2-week treatment-free interval.
The patients received 2 initial cycles. If they achieved a complete remission (CR) or CR with partial hematologic recovery (CRh) at this point, they could receive an additional 3 cycles as consolidation, unless they were scheduled to receive an allo-HSCT.
Patients also received intrathecal prophylaxis with dexamethasone and/or steroids, cytarabine, and methotrexate. And patients with a high blast percentage at baseline received a pre-phase treatment with dexamethasone and/or cyclophosphamide.
Older patients received a median of 2 cycles of blinatumomab (range, 1-6), as did the younger patients (range, 1-7).
Response and survival
Fifty-six percent of the older patients (20/36) achieved a CR/CRh during the first 2 cycles of blinatumomab, as did 46% of the younger patients (46/225). There were 14 CRs among the older patients (39%) and 78 CRs among the younger patients (35%).
There were 12 complete minimal residual disease responses among older patients (60% of responders) and 73 among the younger patients (70% of responders).
Of the responders, 3 older patients (15%) and 61 younger patients (59%) went on to allo-HSCT. Most of the patients received a transplant while in remission. However, 1 of the older patients and 8 of the younger patients went to transplant after an initial response to blinatumomab that was followed by a relapse.
The median relapse-free survival was 7.4 months for both age groups. The median overall survival was 5.5 months for older patients and 7.6 months for younger patients.
Safety
All of the older patients had at least 1 AE, and all but 1 of the younger patients had at least 1 AE. Older patients had higher rates of peripheral edema (42% vs 24%), fatigue (28% vs 18%), and dizziness (25% vs 11%) of any grade.
The incidence of grade 3 or higher AEs was similar between the groups—86% in the older group and 80% in the younger group. The same was true for AEs leading to treatment discontinuation—22% and 19%, respectively.
However, there was a higher incidence of serious AEs in the older patients (72% vs 64%). Device-related infection and encephalopathy were more common among older patients than younger patients (both 11% vs 3%).
The incidence of cytokine release syndrome was higher in the older group than the younger group—19% and 10%, respectively.
Older patients also had more neurologic events of any grade (72% vs 48%) and more grade 3 or higher neurologic events (28% vs 13%). However, all neurologic events were reversed by temporarily or permanently discontinuing blinatumomab.
There were 7 fatal treatment-emergent AEs in the older adults, including pneumonia (n=3), B-cell lymphoma (n=1), and disease progression (n=3). None of the fatal AEs were considered treatment-related. And none of the patients who were in remission died during treatment with blinatumomab. ![]()
Team identifies new function of Fanconi anemia genes

Image by Sarah Pfau
Research published in Cell has revealed a new function of genes in the Fanconi anemia (FA) pathway, and investigators believe this finding could have
implications for the treatment of FA and related disorders.
The team found that FA genes are required for selective autophagy.
In particular, the FANCC gene plays a key role in 2 types of selective autophagy: virophagy (the removal of viruses inside the cell) and mitophagy (the removal of mitochondria).
Experiments in mice showed that genetic deletion of FANCC blocks virophagy and increases the animals’ susceptibility to lethal viral encephalitis.
The investigators also found that FANCC protein is required for the clearance of damaged mitochondria and decreases the production of mitochondrial reactive oxygen species and inflammasome activation.
And other genes in the FA pathway are required for mitophagy as well—FANCA, FANCF, FANCL, FANCD2, BRCA1, and BRCA2.
“There’s increasing evidence that the failure of cells to appropriately clear damaged mitochondria leads to abnormal activation of the inflammasome—a process that is emerging as an important contributor to many different diseases,” said study author Beth Levine, MD, of UT Southwestern Medical Center in Dallas, Texas.
“The finding that FA genes function in clearing mitochondria and decreasing inflammasome activation provides a potential new inflammasome-targeted avenue of therapy for patients with diseases related to mutations in the FA genes.”
FA pathway genes were already known to play a role in DNA repair. The investigators said this new link to autophagy opens up unexplored horizons for understanding the function of these genes in human health and disease.
“Our findings suggest a novel mechanism by which mutations in FA genes may lead to the clinical manifestations in patients with FA and to cancers in patients with mutations in FA genes,” said study author Rhea Sumpter, MD, PhD, of UT Southwestern Medical Center.
“We’ve shown that this new function of the FA genes in the selective autophagy pathways does not depend on their role in DNA repair.”
In addition, the autophagy function may partly explain why patients with FA are highly susceptible to infection and cancer, Dr Levine said.
While further research is needed to understand how these findings may be used to treat disease, the investigators said they have identified a novel avenue for developing potential therapies for FA and cancer patients.
“I believe the clearest therapeutic possibilities to come from our study results are the development of new FA agents that target the inflammasome and production of interleukin 1 beta (IL-1β), a pro-inflammatory cytokine,” Dr Sumpter said.
“Clinically, IL-1β signaling has been targeted with FDA-approved drugs very successfully in several auto-inflammatory diseases that involve excessive inflammasome activation. Our results suggest that FA patients may also benefit from these therapies.” ![]()
Medical errors among leading causes of death in US

while another looks on
Photo courtesy of NCI
In recent years, medical errors may have become one of the top causes of death in the US, according to a study published in The BMJ.
Investigators analyzed medical death rate data over an 8-year period and calculated that more than 250,000 deaths per year may be due to medical error.
That figure surpasses the US Centers for Disease Control and Prevention’s (CDC) third leading cause of death—respiratory disease, which kills close to 150,000 people per year.
The investigators said the CDC’s way of collecting national health statistics fails to classify medical errors separately on the death certificate. So the team is advocating for updated criteria for classifying deaths.
“Incidence rates for deaths directly attributable to medical care gone awry haven’t been recognized in any standardized method for collecting national statistics,” said study author Martin Makary, MD, of the Johns Hopkins University School of Medicine in Baltimore, Maryland.
“The medical coding system was designed to maximize billing for physician services, not to collect national health statistics, as it is currently being used.”
Dr Makary noted that, in 1949, the US adopted an international form that used International Classification of Diseases (ICD) billing codes to tally causes of death.
“At that time, it was under-recognized that diagnostic errors, medical mistakes, and the absence of safety nets could result in someone’s death, and because of that, medical errors were unintentionally excluded from national health statistics,” Dr Makary said.
He pointed out that, since that time, national mortality statistics have been tabulated using billing codes, which don’t have a built-in way to recognize incidence rates of mortality due to medical care gone wrong.
For the current study, Dr Makary and Michael Daniel, also of Johns Hopkins, examined 4 separate studies that analyzed medical death rate data from 2000 to 2008.
Then, using hospital admission rates from 2013, the investigators extrapolated that, based on a total of 35,416,020 hospitalizations, 251,454 deaths stemmed from medical error. This translates to 9.5% of all deaths each year in the US.
According to the CDC, in 2013, 611,105 people died of heart disease, 584,881 died of cancer, and 149,205 died of chronic respiratory disease.
These were the top 3 causes of death in the US. The newly calculated figure for medical errors puts this cause of death behind cancer but ahead of respiratory disease.
“Top-ranked causes of death as reported by the CDC inform our country’s research funding and public health priorities,” Dr Makary said. “Right now, cancer and heart disease get a ton of attention, but since medical errors don’t appear on the list, the problem doesn’t get the funding and attention it deserves.”
The investigators said most medical errors aren’t due to inherently bad doctors, and reporting these errors shouldn’t be addressed by punishment or legal action.
Rather, the pair believes that most errors represent systemic problems, including poorly coordinated care, fragmented insurance networks, the absence or underuse of safety nets, and other protocols, in addition to unwarranted variation in physician practice patterns that lack accountability.
“Unwarranted variation is endemic in healthcare,” Dr Makary said. “Developing consensus protocols that streamline the delivery of medicine and reduce variability can improve quality and lower costs in healthcare. More research on preventing medical errors from occurring is needed to address the problem.” ![]()
CAR T-cell therapy granted orphan designation

The US Food and Drug Administration (FDA) has granted orphan drug designation for the chimeric antigen receptor (CAR) T-cell therapy KTE-C19 as a treatment for several hematologic malignancies.
This includes primary mediastinal B-cell lymphoma (PMBCL), mantle cell lymphoma (MCL), follicular lymphoma (FL), acute lymphoblastic leukemia (ALL), and chronic lymphocytic leukemia (CLL).
KTE-C19 previously received orphan designation from the FDA for the treatment of diffuse large B-cell lymphoma (DLBCL).
The FDA grants orphan designation to drugs and biologics intended to treat, diagnose, or prevent diseases/disorders that affect fewer than 200,000 people in the US.
The designation provides incentives for sponsors to develop products for rare diseases. This may include tax credits toward the cost of clinical trials, prescription drug user fee waivers, and 7 years of market exclusivity.
KTE-C19 also has breakthrough therapy designation from the FDA as a treatment for DLBCL, PMBCL, and transformed FL.
About KTE-C19
KTE-C19 is an investigational therapy in which a patient’s T cells are genetically modified to express a CAR designed to target CD19. The product is being developed by Kite Pharma, Inc.
In a study published in the Journal of Clinical Oncology, researchers evaluated KTE-C19 in 15 patients with advanced B-cell malignancies.
The patients received a conditioning regimen of cyclophosphamide and fludarabine, followed 1 day later by a single infusion of KTE-C19. The researchers noted that the conditioning regimen is known to be active against B-cell malignancies and could have made a direct contribution to patient responses.
Thirteen patients were evaluable for response. The overall response rate was 92%. Eight patients achieved a complete response (CR), and 4 had a partial response (PR).
Of the 7 patients with DLBCL, 4 achieved a CR, 2 achieved a PR, and 1 had stable disease. Three of the CRs were ongoing at the time of publication, with the duration ranging from 9 months to 22 months.
Of the 4 patients with CLL, 3 had a CR, and 1 had a PR. All 3 CRs were ongoing at the time of publication, with the duration ranging from 14 months to 23 months.
Among the 2 patients with indolent lymphomas, 1 achieved a CR, and 1 had a PR. The duration of the CR was 11 months at the time of publication.
KTE-C19 elicited a number of adverse events, including fever, hypotension, delirium, and other neurologic toxicities. All but 2 patients experienced grade 3/4 adverse events.
Three patients developed unexpected neurologic abnormalities. One patient experienced aphasia and right-sided facial paresis. One patient developed aphasia, confusion, and severe, generalized myoclonus. And 1 patient had aphasia, confusion, hemifacial spasms, apraxia, and gait disturbances.
KTE-C19 is currently under investigation in a phase 2 trial of refractory DLBCL, PMBCL, and transformed FL (ZUMA-1), a phase 2 trial of relapsed/refractory MCL (ZUMA-2), a phase 1/2 trial of relapsed/refractory adult ALL (ZUMA-3), and a phase 1/2 trial of relapsed/refractory pediatric ALL (ZUMA-4).
Results from ZUMA-1 were recently presented at the 2016 AACR Annual Meeting (abstract CT135). ![]()
Autism screening rises after process-based training
A 3- to 6-month learning program for pediatric and family medicine providers significantly improved their screening for autism spectrum disorders (ASD) at 18- and 24-month well child visits, based on data from 26 primary care practices that participated in the program and from 43 physicians who completed surveys before and after the program, according to findings published online May 5 in Pediatrics.
“Unlike traditional continuing medical education, the LC [learning collaborative] focused on improvement of processes of care at the practice level,” wrote Dr. Paul S. Carbone and his colleagues of the University of Utah, Salt Lake City. The first signs of ASD can be present as early as 2 years of age, but often remain undiagnosed for lack of screening at 18- and 24-month visits, they noted.

Rates of documented ASD screening among toddlers increased from 16% before starting the program to 91% during the last month of the program, and 70% of the practices sustained the 91% screening rate 4 years later.
Physician self-efficacy improved significantly from baseline to after the program on the nine autism conditions (such as sleep problems, constipation, and attention deficit/hyperactivity disorder [ADHD]) and seven autism needs (such as making referrals, addressing developmental concerns, and identifying community support services) included in the survey. On a scale of 1 to 10, the average physician’s progress rating was 6.5 after completing the program.
“A LC using the methods we describe is a successful approach to improving the early identification and ongoing care of children with ASD in primary care practices,” they researchers said.
Read the whole article at Pediatrics (2016 May. doi: 10.1542/peds.2015-1850).
A 3- to 6-month learning program for pediatric and family medicine providers significantly improved their screening for autism spectrum disorders (ASD) at 18- and 24-month well child visits, based on data from 26 primary care practices that participated in the program and from 43 physicians who completed surveys before and after the program, according to findings published online May 5 in Pediatrics.
“Unlike traditional continuing medical education, the LC [learning collaborative] focused on improvement of processes of care at the practice level,” wrote Dr. Paul S. Carbone and his colleagues of the University of Utah, Salt Lake City. The first signs of ASD can be present as early as 2 years of age, but often remain undiagnosed for lack of screening at 18- and 24-month visits, they noted.
Rates of documented ASD screening among toddlers increased from 16% before starting the program to 91% during the last month of the program, and 70% of the practices sustained the 91% screening rate 4 years later.
Physician self-efficacy improved significantly from baseline to after the program on the nine autism conditions (such as sleep problems, constipation, and attention deficit/hyperactivity disorder [ADHD]) and seven autism needs (such as making referrals, addressing developmental concerns, and identifying community support services) included in the survey. On a scale of 1 to 10, the average physician’s progress rating was 6.5 after completing the program.
“A LC using the methods we describe is a successful approach to improving the early identification and ongoing care of children with ASD in primary care practices,” they researchers said.
Read the whole article at Pediatrics (2016 May. doi: 10.1542/peds.2015-1850).
FROM PEDIATRICS