User login
People With HIV Are Less Likely To Get Cancer Treatment
We’ve made great progress treating people who are infected with HIV, but if they get cancer they’re less likely to get the care they need, a recent study found.
Researchers examined treatment for a variety of cancers, including upper gastrointestinal tract, colorectal, prostate, lung, head and neck, cervix, breast, anal and two blood cancers. With the exception of anal cancer, treatment rates differed significantly between HIV-infected people and those who weren’t infected, according to the study.
For example, 33 percent of patients with HIV and lung cancer failed to receive any treatment for the cancer compared with 14 percent of those who weren’t infected. Similarly, 44 percent of people who were HIV positive didn’t receive treatment for upper GI cancer versus 18 percent of those who weren’t infected with HIV. Twenty-four percent of men with prostate cancer who were HIV positive didn’t get treatment compared with 7 percent of non-HIV infected men.
Cancer treatment was defined as radiation, chemotherapy and/or surgery.
“To have made such great strides with treating HIV only to have them succumb to cancer is devastating,” said Dr. Gita Suneja, a radiation oncologist at the University of Utah’s Huntsman Cancer Institute in Salt Lake City and the lead author of the study. It was published online this month in the journal Cancer.
The study used the National Cancer Data Base to analyze treatment for adults younger than 65 who were diagnosed with any of the 10 most common cancers to affect HIV patients between 2003 and 2011. The study included 10,265 HIV-infected adults and 2.2 million without HIV.
The data base, which is sponsored by the American Cancer Society and the American College of Surgeons, captures roughly 70 percent of newly diagnosed cancer cases in the United States.
The study noted that more than a third of the patients with HIV had stage 4 cancer — cancer that has metastasized — when they were diagnosed, while only 19 percent of those without HIV did.
Improvements in antiretroviral therapy to treat HIV have helped reduce the incidence of cancers such as Kaposi sarcoma that are closely linked to AIDS, but rates for other cancers often associated with normal aging have increased among HIV patients. In addition, people with HIV have a higher incidence of some lifestyle-related cancers, such as lung cancer, which could be linked to higher rates of smoking. Cancer is now the second most common cause of death among HIV-infected people, behind AIDS-related causes.
HIV patients are more likely to be uninsured or underinsured, and lack of coverage can affect access to cancer care. But having insurance didn’t eliminate the problem: privately insured people with HIV were significantly more likely to be untreated for many cancers than were privately insured people without HIV, the study found.
“We know that people with Medicaid or who are uninsured receive subpar cancer treatment, and that’s a big public health issue,” said Suneja. “But even factoring that in, HIV-infected people are still less likely to receive cancer treatment. That means there are other drivers that we couldn’t measure in the study.”
Disparities in cancer treatment could exist for several reasons. For one thing, for most cancers there are no national treatment guidelines for HIV-infected patients, Suneja said. One of the few exceptions is anal cancer, the only cancer for which the study found little discrepancy in treatment among HIV-infected and non-infected patients. According to the research, the difference among those not receiving treatment was 4.8 percent for HIV patients versus 3.1 percent for others.
For other cancers, “the oncologist may pause and ask, ‘Does the HIV infection mean they shouldn’t get standard cancer treatment?’” Suneja added.
This story was produced by Kaiser Health News, which publishes California Healthline, a service of the California Health Care Foundation.
Please contact Kaiser Health News to send comments or ideas for future topics for the Insuring Your Health column.
We’ve made great progress treating people who are infected with HIV, but if they get cancer they’re less likely to get the care they need, a recent study found.
Researchers examined treatment for a variety of cancers, including upper gastrointestinal tract, colorectal, prostate, lung, head and neck, cervix, breast, anal and two blood cancers. With the exception of anal cancer, treatment rates differed significantly between HIV-infected people and those who weren’t infected, according to the study.
For example, 33 percent of patients with HIV and lung cancer failed to receive any treatment for the cancer compared with 14 percent of those who weren’t infected. Similarly, 44 percent of people who were HIV positive didn’t receive treatment for upper GI cancer versus 18 percent of those who weren’t infected with HIV. Twenty-four percent of men with prostate cancer who were HIV positive didn’t get treatment compared with 7 percent of non-HIV infected men.
Cancer treatment was defined as radiation, chemotherapy and/or surgery.
“To have made such great strides with treating HIV only to have them succumb to cancer is devastating,” said Dr. Gita Suneja, a radiation oncologist at the University of Utah’s Huntsman Cancer Institute in Salt Lake City and the lead author of the study. It was published online this month in the journal Cancer.
The study used the National Cancer Data Base to analyze treatment for adults younger than 65 who were diagnosed with any of the 10 most common cancers to affect HIV patients between 2003 and 2011. The study included 10,265 HIV-infected adults and 2.2 million without HIV.
The data base, which is sponsored by the American Cancer Society and the American College of Surgeons, captures roughly 70 percent of newly diagnosed cancer cases in the United States.
The study noted that more than a third of the patients with HIV had stage 4 cancer — cancer that has metastasized — when they were diagnosed, while only 19 percent of those without HIV did.
Improvements in antiretroviral therapy to treat HIV have helped reduce the incidence of cancers such as Kaposi sarcoma that are closely linked to AIDS, but rates for other cancers often associated with normal aging have increased among HIV patients. In addition, people with HIV have a higher incidence of some lifestyle-related cancers, such as lung cancer, which could be linked to higher rates of smoking. Cancer is now the second most common cause of death among HIV-infected people, behind AIDS-related causes.
HIV patients are more likely to be uninsured or underinsured, and lack of coverage can affect access to cancer care. But having insurance didn’t eliminate the problem: privately insured people with HIV were significantly more likely to be untreated for many cancers than were privately insured people without HIV, the study found.
“We know that people with Medicaid or who are uninsured receive subpar cancer treatment, and that’s a big public health issue,” said Suneja. “But even factoring that in, HIV-infected people are still less likely to receive cancer treatment. That means there are other drivers that we couldn’t measure in the study.”
Disparities in cancer treatment could exist for several reasons. For one thing, for most cancers there are no national treatment guidelines for HIV-infected patients, Suneja said. One of the few exceptions is anal cancer, the only cancer for which the study found little discrepancy in treatment among HIV-infected and non-infected patients. According to the research, the difference among those not receiving treatment was 4.8 percent for HIV patients versus 3.1 percent for others.
For other cancers, “the oncologist may pause and ask, ‘Does the HIV infection mean they shouldn’t get standard cancer treatment?’” Suneja added.
This story was produced by Kaiser Health News, which publishes California Healthline, a service of the California Health Care Foundation.
Please contact Kaiser Health News to send comments or ideas for future topics for the Insuring Your Health column.
We’ve made great progress treating people who are infected with HIV, but if they get cancer they’re less likely to get the care they need, a recent study found.
Researchers examined treatment for a variety of cancers, including upper gastrointestinal tract, colorectal, prostate, lung, head and neck, cervix, breast, anal and two blood cancers. With the exception of anal cancer, treatment rates differed significantly between HIV-infected people and those who weren’t infected, according to the study.
For example, 33 percent of patients with HIV and lung cancer failed to receive any treatment for the cancer compared with 14 percent of those who weren’t infected. Similarly, 44 percent of people who were HIV positive didn’t receive treatment for upper GI cancer versus 18 percent of those who weren’t infected with HIV. Twenty-four percent of men with prostate cancer who were HIV positive didn’t get treatment compared with 7 percent of non-HIV infected men.
Cancer treatment was defined as radiation, chemotherapy and/or surgery.
“To have made such great strides with treating HIV only to have them succumb to cancer is devastating,” said Dr. Gita Suneja, a radiation oncologist at the University of Utah’s Huntsman Cancer Institute in Salt Lake City and the lead author of the study. It was published online this month in the journal Cancer.
The study used the National Cancer Data Base to analyze treatment for adults younger than 65 who were diagnosed with any of the 10 most common cancers to affect HIV patients between 2003 and 2011. The study included 10,265 HIV-infected adults and 2.2 million without HIV.
The data base, which is sponsored by the American Cancer Society and the American College of Surgeons, captures roughly 70 percent of newly diagnosed cancer cases in the United States.
The study noted that more than a third of the patients with HIV had stage 4 cancer — cancer that has metastasized — when they were diagnosed, while only 19 percent of those without HIV did.
Improvements in antiretroviral therapy to treat HIV have helped reduce the incidence of cancers such as Kaposi sarcoma that are closely linked to AIDS, but rates for other cancers often associated with normal aging have increased among HIV patients. In addition, people with HIV have a higher incidence of some lifestyle-related cancers, such as lung cancer, which could be linked to higher rates of smoking. Cancer is now the second most common cause of death among HIV-infected people, behind AIDS-related causes.
HIV patients are more likely to be uninsured or underinsured, and lack of coverage can affect access to cancer care. But having insurance didn’t eliminate the problem: privately insured people with HIV were significantly more likely to be untreated for many cancers than were privately insured people without HIV, the study found.
“We know that people with Medicaid or who are uninsured receive subpar cancer treatment, and that’s a big public health issue,” said Suneja. “But even factoring that in, HIV-infected people are still less likely to receive cancer treatment. That means there are other drivers that we couldn’t measure in the study.”
Disparities in cancer treatment could exist for several reasons. For one thing, for most cancers there are no national treatment guidelines for HIV-infected patients, Suneja said. One of the few exceptions is anal cancer, the only cancer for which the study found little discrepancy in treatment among HIV-infected and non-infected patients. According to the research, the difference among those not receiving treatment was 4.8 percent for HIV patients versus 3.1 percent for others.
For other cancers, “the oncologist may pause and ask, ‘Does the HIV infection mean they shouldn’t get standard cancer treatment?’” Suneja added.
This story was produced by Kaiser Health News, which publishes California Healthline, a service of the California Health Care Foundation.
Please contact Kaiser Health News to send comments or ideas for future topics for the Insuring Your Health column.
VA to Reexamine 24,000 Veterans for TBI
More than 24,000 veterans who received examinations but were not diagnosed with traumatic brain injuries (TBIs) will be eligible for new medical examinations, the VA has announced. Due to confusing guidance documents, the original examinations were not conducted by a psychiatrist, physiatrist, neurosurgeon, or neurologist as mandated by VA policy. The 24,000 veterans may be eligible for additional benefits and service-connected compensation based on the results of the new examinations.
“Traumatic Brain Injury is a signature injury in veterans returning from the conflicts in Iraq and Afghanistan, and VA is proud to be an organization that sets the bar high for supporting these, and all, veterans,” said Secretary of Veterans Affairs Robert McDonald in a statement. “Providing support for veterans suffering from a TBI is a priority and a privilege, and we must make certain they receive a just and fair rating for their disabilities.”
The current VA policy dates to 2007 and requires that a specialist complete a TBI examination when VA does not have a prior diagnosis. However, given the rapidly changing science around TBI since 2007, the VA has issued multiple additional guidance documents. These additional guidance documents, the VA notes, “created confusion regarding the policy.”
“We let these veterans down,” Secretary McDonald said. “That is why we are taking every step necessary to grant equitable relief to those affected to ensure they receive the full benefits to which they are entitled.”
Veterans will not be required to submit new claims and the VA has pledged to contact the identified patients to offer them a new examination. According to the VA > 13,000 veterans are already receiving 10% or higher service-connected compensation benefits for TBI.
More than 24,000 veterans who received examinations but were not diagnosed with traumatic brain injuries (TBIs) will be eligible for new medical examinations, the VA has announced. Due to confusing guidance documents, the original examinations were not conducted by a psychiatrist, physiatrist, neurosurgeon, or neurologist as mandated by VA policy. The 24,000 veterans may be eligible for additional benefits and service-connected compensation based on the results of the new examinations.
“Traumatic Brain Injury is a signature injury in veterans returning from the conflicts in Iraq and Afghanistan, and VA is proud to be an organization that sets the bar high for supporting these, and all, veterans,” said Secretary of Veterans Affairs Robert McDonald in a statement. “Providing support for veterans suffering from a TBI is a priority and a privilege, and we must make certain they receive a just and fair rating for their disabilities.”
The current VA policy dates to 2007 and requires that a specialist complete a TBI examination when VA does not have a prior diagnosis. However, given the rapidly changing science around TBI since 2007, the VA has issued multiple additional guidance documents. These additional guidance documents, the VA notes, “created confusion regarding the policy.”
“We let these veterans down,” Secretary McDonald said. “That is why we are taking every step necessary to grant equitable relief to those affected to ensure they receive the full benefits to which they are entitled.”
Veterans will not be required to submit new claims and the VA has pledged to contact the identified patients to offer them a new examination. According to the VA > 13,000 veterans are already receiving 10% or higher service-connected compensation benefits for TBI.
More than 24,000 veterans who received examinations but were not diagnosed with traumatic brain injuries (TBIs) will be eligible for new medical examinations, the VA has announced. Due to confusing guidance documents, the original examinations were not conducted by a psychiatrist, physiatrist, neurosurgeon, or neurologist as mandated by VA policy. The 24,000 veterans may be eligible for additional benefits and service-connected compensation based on the results of the new examinations.
“Traumatic Brain Injury is a signature injury in veterans returning from the conflicts in Iraq and Afghanistan, and VA is proud to be an organization that sets the bar high for supporting these, and all, veterans,” said Secretary of Veterans Affairs Robert McDonald in a statement. “Providing support for veterans suffering from a TBI is a priority and a privilege, and we must make certain they receive a just and fair rating for their disabilities.”
The current VA policy dates to 2007 and requires that a specialist complete a TBI examination when VA does not have a prior diagnosis. However, given the rapidly changing science around TBI since 2007, the VA has issued multiple additional guidance documents. These additional guidance documents, the VA notes, “created confusion regarding the policy.”
“We let these veterans down,” Secretary McDonald said. “That is why we are taking every step necessary to grant equitable relief to those affected to ensure they receive the full benefits to which they are entitled.”
Veterans will not be required to submit new claims and the VA has pledged to contact the identified patients to offer them a new examination. According to the VA > 13,000 veterans are already receiving 10% or higher service-connected compensation benefits for TBI.
Two-step UTI screening cuts catheterization rate in half
After implementation of a quality improvement initiative to more effectively screen febrile children for urinary tract infections (UTIs) in the emergency department, catheterization rates dropped from 63% to 30% over a 6-month period, a study found.
The sustained drop prevented more than 350 young children from catheterization without increasing revisit rates or missing UTIs in the 39% of children who were followed in the care network. This was in a study that compared catheterization rates in 1,520 children aged 6-24 months in the year before the intervention and 828 children in the 6 months during the intervention.
“Although urine catheterization remains the gold standard in diagnosing UTIs, it is an invasive procedure that may be avoided in most patients who are being screened,” wrote Dr. Jane M. Lavelle of Children’s Hospital of Philadelphia (CHOP) and her associates. UTI screening by this method can be “painful, time consuming, and costly,” they added (Pediatrics. 2016 June 2. doi: 10.1542/peds.2015-3023).

An alternative method to automatic catheterization is a two-step process already included as an option in American Academy of Pediatrics guidelines: Instead of collecting urine through catheterization just once for screening and culture, an emergency department first noninvasively collects urine with a urine bag for screening in those indicated with evidence-based risk factors, and then catheterizes only those who screen positive (Pediatrics. 2011;128[3]:595-610).
“Due to the predictive models’ higher sensitivity than specificity for screening, most urine samples will have a negative screen for pyuria or bacteriuria by urine dipstick or microscopy,” the authors wrote.
At baseline, CHOP’s ED was screening 63% of febrile children under age 24 months using catheterization, but screens were most commonly negative and only 4.3% had positive cultures. The authors therefore initiated a switch to the two-step method as a pilot run in one ED area before educating all ED personnel and expanding to the full department in the second month, using three cycles of Plan-Do-Study-Act protocol.
Children aged 6-24 months comprised approximately 20% of the ED’s more than 90,000 annual patients, and about 22% of these children presented with fever as the primary concern. Children with a history of genitourinary problems or immune deficiency were excluded.
The pilot ran in an “urgent care section of ED where there are typically more children with less complex medical histories and where ‘fever’ is a common complaint,” the investigators said. The staff completed a learning module with assessment and then received in-person and visual reminders of the procedure. Nurse feedback was then used to develop a nursing-specific educational module before expanding the intervention to all ED areas.
While 69% of 828 febrile young children still underwent screening during the 6-month intervention period, only 16% still underwent urethral catheterization as the initial screening step, typically because of strong clinical indications for a UTI. Another 14% underwent catheterization only after a positive urine screen from an initial noninvasive urine collection or because of an inability to get an adequate urine specimen with the bag. The reduction in catheterization dropped to 55% within 2 weeks of the intervention’s start and spread to other hospital departments. The drop to a 30% catheterization rate remained throughout 18 additional months of monitoring.
“Through online education modules, staff meetings, printed and EHR reminders, family involvement, team review of weekly data, individual and group feedback, and nurse scripting, the ED was able to achieve our aim of reducing catheterization rates among febrile young children ages 6-24 months by half over a 6-month period with sustained results,” Dr. Lavelle and her associates reported.
The research did not use external funding, and the researchers reported they had no financial disclosures.
When children are febrile and younger than 24 months old and they go to a pediatric emergency department, a pretty big work-up can be anticipated, taking several hours and including a test for possible UTI.

|
Dr. Michael E. Pichichero |
In this report from investigators at Children’s Hospital of Philadelphia, we learn the results of a study undertaken to reduce the frequency of bladder catheterization by using a urine bag collection as a screening tool. It worked! Before the study, 63% of 1,520 young children got catheterized, and 4.3% had a UTI. With the screening method, only those with a positive screen for a possible UTI (16% of 828) proceeded to be catheterized, reducing catheterization rates significantly. Only 4.4% of the 69% of children screened by either method had a UTI. So by screening with a bag urine specimen first, many of the children who would have been catheterized did not undergo the procedure.
A hidden gem of information in the study was the length of a visit to the emergency department. The kids were there an average of 4.7 hours whether the provider waited for the bag urine and then catheterized or went straight to the procedure! If only they had gone to their primary care provider, I wonder how much time could have been saved?
Dr. Michael E. Pichichero, a specialist in pediatric infectious diseases, is director of the Research Institute, Rochester (N.Y.) General Hospital. He is also a pediatrician at Legacy Pediatrics in Rochester. Dr. Pichichero said he had no relevant financial disclosures.
When children are febrile and younger than 24 months old and they go to a pediatric emergency department, a pretty big work-up can be anticipated, taking several hours and including a test for possible UTI.
|
|
Dr. Michael E. Pichichero |
In this report from investigators at Children’s Hospital of Philadelphia, we learn the results of a study undertaken to reduce the frequency of bladder catheterization by using a urine bag collection as a screening tool. It worked! Before the study, 63% of 1,520 young children got catheterized, and 4.3% had a UTI. With the screening method, only those with a positive screen for a possible UTI (16% of 828) proceeded to be catheterized, reducing catheterization rates significantly. Only 4.4% of the 69% of children screened by either method had a UTI. So by screening with a bag urine specimen first, many of the children who would have been catheterized did not undergo the procedure.
A hidden gem of information in the study was the length of a visit to the emergency department. The kids were there an average of 4.7 hours whether the provider waited for the bag urine and then catheterized or went straight to the procedure! If only they had gone to their primary care provider, I wonder how much time could have been saved?
Dr. Michael E. Pichichero, a specialist in pediatric infectious diseases, is director of the Research Institute, Rochester (N.Y.) General Hospital. He is also a pediatrician at Legacy Pediatrics in Rochester. Dr. Pichichero said he had no relevant financial disclosures.
When children are febrile and younger than 24 months old and they go to a pediatric emergency department, a pretty big work-up can be anticipated, taking several hours and including a test for possible UTI.
|
|
Dr. Michael E. Pichichero |
In this report from investigators at Children’s Hospital of Philadelphia, we learn the results of a study undertaken to reduce the frequency of bladder catheterization by using a urine bag collection as a screening tool. It worked! Before the study, 63% of 1,520 young children got catheterized, and 4.3% had a UTI. With the screening method, only those with a positive screen for a possible UTI (16% of 828) proceeded to be catheterized, reducing catheterization rates significantly. Only 4.4% of the 69% of children screened by either method had a UTI. So by screening with a bag urine specimen first, many of the children who would have been catheterized did not undergo the procedure.
A hidden gem of information in the study was the length of a visit to the emergency department. The kids were there an average of 4.7 hours whether the provider waited for the bag urine and then catheterized or went straight to the procedure! If only they had gone to their primary care provider, I wonder how much time could have been saved?
Dr. Michael E. Pichichero, a specialist in pediatric infectious diseases, is director of the Research Institute, Rochester (N.Y.) General Hospital. He is also a pediatrician at Legacy Pediatrics in Rochester. Dr. Pichichero said he had no relevant financial disclosures.
After implementation of a quality improvement initiative to more effectively screen febrile children for urinary tract infections (UTIs) in the emergency department, catheterization rates dropped from 63% to 30% over a 6-month period, a study found.
The sustained drop prevented more than 350 young children from catheterization without increasing revisit rates or missing UTIs in the 39% of children who were followed in the care network. This was in a study that compared catheterization rates in 1,520 children aged 6-24 months in the year before the intervention and 828 children in the 6 months during the intervention.
“Although urine catheterization remains the gold standard in diagnosing UTIs, it is an invasive procedure that may be avoided in most patients who are being screened,” wrote Dr. Jane M. Lavelle of Children’s Hospital of Philadelphia (CHOP) and her associates. UTI screening by this method can be “painful, time consuming, and costly,” they added (Pediatrics. 2016 June 2. doi: 10.1542/peds.2015-3023).
An alternative method to automatic catheterization is a two-step process already included as an option in American Academy of Pediatrics guidelines: Instead of collecting urine through catheterization just once for screening and culture, an emergency department first noninvasively collects urine with a urine bag for screening in those indicated with evidence-based risk factors, and then catheterizes only those who screen positive (Pediatrics. 2011;128[3]:595-610).
“Due to the predictive models’ higher sensitivity than specificity for screening, most urine samples will have a negative screen for pyuria or bacteriuria by urine dipstick or microscopy,” the authors wrote.
At baseline, CHOP’s ED was screening 63% of febrile children under age 24 months using catheterization, but screens were most commonly negative and only 4.3% had positive cultures. The authors therefore initiated a switch to the two-step method as a pilot run in one ED area before educating all ED personnel and expanding to the full department in the second month, using three cycles of Plan-Do-Study-Act protocol.
Children aged 6-24 months comprised approximately 20% of the ED’s more than 90,000 annual patients, and about 22% of these children presented with fever as the primary concern. Children with a history of genitourinary problems or immune deficiency were excluded.
The pilot ran in an “urgent care section of ED where there are typically more children with less complex medical histories and where ‘fever’ is a common complaint,” the investigators said. The staff completed a learning module with assessment and then received in-person and visual reminders of the procedure. Nurse feedback was then used to develop a nursing-specific educational module before expanding the intervention to all ED areas.
While 69% of 828 febrile young children still underwent screening during the 6-month intervention period, only 16% still underwent urethral catheterization as the initial screening step, typically because of strong clinical indications for a UTI. Another 14% underwent catheterization only after a positive urine screen from an initial noninvasive urine collection or because of an inability to get an adequate urine specimen with the bag. The reduction in catheterization dropped to 55% within 2 weeks of the intervention’s start and spread to other hospital departments. The drop to a 30% catheterization rate remained throughout 18 additional months of monitoring.
“Through online education modules, staff meetings, printed and EHR reminders, family involvement, team review of weekly data, individual and group feedback, and nurse scripting, the ED was able to achieve our aim of reducing catheterization rates among febrile young children ages 6-24 months by half over a 6-month period with sustained results,” Dr. Lavelle and her associates reported.
The research did not use external funding, and the researchers reported they had no financial disclosures.
After implementation of a quality improvement initiative to more effectively screen febrile children for urinary tract infections (UTIs) in the emergency department, catheterization rates dropped from 63% to 30% over a 6-month period, a study found.
The sustained drop prevented more than 350 young children from catheterization without increasing revisit rates or missing UTIs in the 39% of children who were followed in the care network. This was in a study that compared catheterization rates in 1,520 children aged 6-24 months in the year before the intervention and 828 children in the 6 months during the intervention.
“Although urine catheterization remains the gold standard in diagnosing UTIs, it is an invasive procedure that may be avoided in most patients who are being screened,” wrote Dr. Jane M. Lavelle of Children’s Hospital of Philadelphia (CHOP) and her associates. UTI screening by this method can be “painful, time consuming, and costly,” they added (Pediatrics. 2016 June 2. doi: 10.1542/peds.2015-3023).
An alternative method to automatic catheterization is a two-step process already included as an option in American Academy of Pediatrics guidelines: Instead of collecting urine through catheterization just once for screening and culture, an emergency department first noninvasively collects urine with a urine bag for screening in those indicated with evidence-based risk factors, and then catheterizes only those who screen positive (Pediatrics. 2011;128[3]:595-610).
“Due to the predictive models’ higher sensitivity than specificity for screening, most urine samples will have a negative screen for pyuria or bacteriuria by urine dipstick or microscopy,” the authors wrote.
At baseline, CHOP’s ED was screening 63% of febrile children under age 24 months using catheterization, but screens were most commonly negative and only 4.3% had positive cultures. The authors therefore initiated a switch to the two-step method as a pilot run in one ED area before educating all ED personnel and expanding to the full department in the second month, using three cycles of Plan-Do-Study-Act protocol.
Children aged 6-24 months comprised approximately 20% of the ED’s more than 90,000 annual patients, and about 22% of these children presented with fever as the primary concern. Children with a history of genitourinary problems or immune deficiency were excluded.
The pilot ran in an “urgent care section of ED where there are typically more children with less complex medical histories and where ‘fever’ is a common complaint,” the investigators said. The staff completed a learning module with assessment and then received in-person and visual reminders of the procedure. Nurse feedback was then used to develop a nursing-specific educational module before expanding the intervention to all ED areas.
While 69% of 828 febrile young children still underwent screening during the 6-month intervention period, only 16% still underwent urethral catheterization as the initial screening step, typically because of strong clinical indications for a UTI. Another 14% underwent catheterization only after a positive urine screen from an initial noninvasive urine collection or because of an inability to get an adequate urine specimen with the bag. The reduction in catheterization dropped to 55% within 2 weeks of the intervention’s start and spread to other hospital departments. The drop to a 30% catheterization rate remained throughout 18 additional months of monitoring.
“Through online education modules, staff meetings, printed and EHR reminders, family involvement, team review of weekly data, individual and group feedback, and nurse scripting, the ED was able to achieve our aim of reducing catheterization rates among febrile young children ages 6-24 months by half over a 6-month period with sustained results,” Dr. Lavelle and her associates reported.
The research did not use external funding, and the researchers reported they had no financial disclosures.
FROM PEDIATRICS
Key clinical point: Use of a two-step UTI screening process reduced unnecessary catheterizations by half.
Major finding: The ED catheterization rate in febrile children suspected of a UTI dropped from 63% to 30% over a 6-month period.
Data source: An assessment of a quality improvement initiative in the Children’s Hospital of Philadelphia ED that compared catheterization rates in 1,520 children aged 6-24 months in the year before the intervention and 828 children in the 6 months during the intervention.
Disclosures: The research did not use external funding, and the researchers reported they had no financial disclosures.

Maternal vaccination against pertussis can protect premature infants
Maternal immunization in the early third trimester (from 28 weeks’ gestation) may protect premature infants from pertussis, study results found.
This was the finding of an observational substudy of a larger multicenter, randomized, controlled vaccination trial of premature infants (the PUNS trial), which compared pertussis antibody concentrations before and after primary immunization in premature infants born to mothers who were or were not vaccinated with Repevax. Dr. Alison Kent of St George’s, University of London, and colleagues assessed the levels of the five vaccine antigens present in the maternal combination Repevax vaccine (pertussis toxoid, filamentous hemagglutinin, fimbriae types 2 and 3, diphtheria toxoid, tetanus toxoid, and inactivated poliovirus) in premature infants born to mothers who either received or did not receive Repevax from 28 weeks’ gestation. Antigen quantifications were conducted in these premature infants at approximately 2, 5, and 12 months of age.
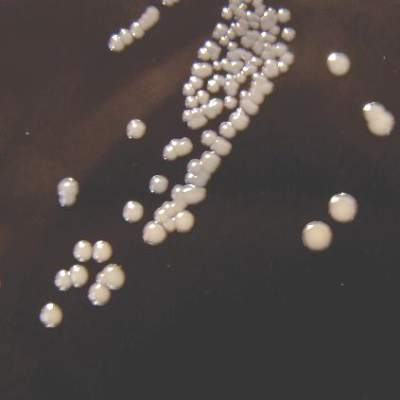
Thirty-one (19%) of the 160 premature infants in the substudy were born to mothers who had been vaccinated. Two months after their premature birth, infants born to vaccinated mothers had significantly higher concentrations of all five measured antigens, compared with those born to unvaccinated mothers (all P values less than .001). Although fewer infants were sampled at 5 months of age, significantly higher concentrations of filamentous hemagglutinin and diphtheria toxoid were still found in those born to vaccinated mothers (both P = .003). Data collected at the 12-month assessment indicated that only tetanus antibody concentrations remained significantly higher in those born to vaccinated mothers (P = .015). A positive correlation between the number of days from maternal vaccination to delivery was found for all measured antigens, with the exception of fimbriae types 2 and 3.
“The emergency introduction of a maternal immunization program to control a national pertussis outbreak serendipitously provided an opportunity to assess antibody concentrations to maternal vaccine antigens in premature infants,” Dr. Kent and associates noted in Pediatrics (June 2016 doi: 10.1542/peds.2015-3854). This unexpected opportunity resulted in evidence supporting a protective effect against pertussis in the early lives of infants born prematurely to mothers immunized in their early third trimester.
Pfizer and the National Institute for Health Research Clinical Research Network funded the study. Professor Heath and Dr. Ladhani disclosed conducting studies on behalf of St George’s, University of London funded by vaccine manufacturers without receiving personal payments or travel support. The other authors reported no conflicts of interest.
Maternal immunization in the early third trimester (from 28 weeks’ gestation) may protect premature infants from pertussis, study results found.
This was the finding of an observational substudy of a larger multicenter, randomized, controlled vaccination trial of premature infants (the PUNS trial), which compared pertussis antibody concentrations before and after primary immunization in premature infants born to mothers who were or were not vaccinated with Repevax. Dr. Alison Kent of St George’s, University of London, and colleagues assessed the levels of the five vaccine antigens present in the maternal combination Repevax vaccine (pertussis toxoid, filamentous hemagglutinin, fimbriae types 2 and 3, diphtheria toxoid, tetanus toxoid, and inactivated poliovirus) in premature infants born to mothers who either received or did not receive Repevax from 28 weeks’ gestation. Antigen quantifications were conducted in these premature infants at approximately 2, 5, and 12 months of age.
Thirty-one (19%) of the 160 premature infants in the substudy were born to mothers who had been vaccinated. Two months after their premature birth, infants born to vaccinated mothers had significantly higher concentrations of all five measured antigens, compared with those born to unvaccinated mothers (all P values less than .001). Although fewer infants were sampled at 5 months of age, significantly higher concentrations of filamentous hemagglutinin and diphtheria toxoid were still found in those born to vaccinated mothers (both P = .003). Data collected at the 12-month assessment indicated that only tetanus antibody concentrations remained significantly higher in those born to vaccinated mothers (P = .015). A positive correlation between the number of days from maternal vaccination to delivery was found for all measured antigens, with the exception of fimbriae types 2 and 3.
“The emergency introduction of a maternal immunization program to control a national pertussis outbreak serendipitously provided an opportunity to assess antibody concentrations to maternal vaccine antigens in premature infants,” Dr. Kent and associates noted in Pediatrics (June 2016 doi: 10.1542/peds.2015-3854). This unexpected opportunity resulted in evidence supporting a protective effect against pertussis in the early lives of infants born prematurely to mothers immunized in their early third trimester.
Pfizer and the National Institute for Health Research Clinical Research Network funded the study. Professor Heath and Dr. Ladhani disclosed conducting studies on behalf of St George’s, University of London funded by vaccine manufacturers without receiving personal payments or travel support. The other authors reported no conflicts of interest.
Maternal immunization in the early third trimester (from 28 weeks’ gestation) may protect premature infants from pertussis, study results found.
This was the finding of an observational substudy of a larger multicenter, randomized, controlled vaccination trial of premature infants (the PUNS trial), which compared pertussis antibody concentrations before and after primary immunization in premature infants born to mothers who were or were not vaccinated with Repevax. Dr. Alison Kent of St George’s, University of London, and colleagues assessed the levels of the five vaccine antigens present in the maternal combination Repevax vaccine (pertussis toxoid, filamentous hemagglutinin, fimbriae types 2 and 3, diphtheria toxoid, tetanus toxoid, and inactivated poliovirus) in premature infants born to mothers who either received or did not receive Repevax from 28 weeks’ gestation. Antigen quantifications were conducted in these premature infants at approximately 2, 5, and 12 months of age.
Thirty-one (19%) of the 160 premature infants in the substudy were born to mothers who had been vaccinated. Two months after their premature birth, infants born to vaccinated mothers had significantly higher concentrations of all five measured antigens, compared with those born to unvaccinated mothers (all P values less than .001). Although fewer infants were sampled at 5 months of age, significantly higher concentrations of filamentous hemagglutinin and diphtheria toxoid were still found in those born to vaccinated mothers (both P = .003). Data collected at the 12-month assessment indicated that only tetanus antibody concentrations remained significantly higher in those born to vaccinated mothers (P = .015). A positive correlation between the number of days from maternal vaccination to delivery was found for all measured antigens, with the exception of fimbriae types 2 and 3.
“The emergency introduction of a maternal immunization program to control a national pertussis outbreak serendipitously provided an opportunity to assess antibody concentrations to maternal vaccine antigens in premature infants,” Dr. Kent and associates noted in Pediatrics (June 2016 doi: 10.1542/peds.2015-3854). This unexpected opportunity resulted in evidence supporting a protective effect against pertussis in the early lives of infants born prematurely to mothers immunized in their early third trimester.
Pfizer and the National Institute for Health Research Clinical Research Network funded the study. Professor Heath and Dr. Ladhani disclosed conducting studies on behalf of St George’s, University of London funded by vaccine manufacturers without receiving personal payments or travel support. The other authors reported no conflicts of interest.
FROM PEDIATRICS
Become an SHM Ambassador for a Chance at Free HM17 Registration
Now through December 31, all active SHM members can earn 2017–2018 dues credits and special recognition for recruiting new physician, physician assistant, nurse practitioner, pharmacist, or affiliate members. Active members will be eligible for:
- A $35 credit toward 2017–2018 dues when recruiting 1 new member
- A $50 credit toward 2017–2018 dues when recruiting 2–4 new members
- A $75 credit toward 2017–2018 dues when recruiting 5–9 new members
- A $125 credit toward 2017–2018 dues when recruiting 10+ new members
For each member recruited, referrers will receive one entry into a grand-prize drawing to receive complimentary registration to HM17 in Las Vegas. To be counted as a referral, the new member must:
- Be a brand-new member to SHM. (Past members whose membership has lapsed do not qualify.)
- Register as a physician, physician assistant, nurse practitioner, pharmacist, or affiliate member.
- Include an active member’s name in the “referred by” field on a printed application or the online join form.
- Join before December 31, 2016.
Note: SHM members are not eligible for dues credits through the Membership Ambassador Program for member referrals attributed to free memberships received as a result of HM17 registrations.
Now through December 31, all active SHM members can earn 2017–2018 dues credits and special recognition for recruiting new physician, physician assistant, nurse practitioner, pharmacist, or affiliate members. Active members will be eligible for:
- A $35 credit toward 2017–2018 dues when recruiting 1 new member
- A $50 credit toward 2017–2018 dues when recruiting 2–4 new members
- A $75 credit toward 2017–2018 dues when recruiting 5–9 new members
- A $125 credit toward 2017–2018 dues when recruiting 10+ new members
For each member recruited, referrers will receive one entry into a grand-prize drawing to receive complimentary registration to HM17 in Las Vegas. To be counted as a referral, the new member must:
- Be a brand-new member to SHM. (Past members whose membership has lapsed do not qualify.)
- Register as a physician, physician assistant, nurse practitioner, pharmacist, or affiliate member.
- Include an active member’s name in the “referred by” field on a printed application or the online join form.
- Join before December 31, 2016.
Note: SHM members are not eligible for dues credits through the Membership Ambassador Program for member referrals attributed to free memberships received as a result of HM17 registrations.
Now through December 31, all active SHM members can earn 2017–2018 dues credits and special recognition for recruiting new physician, physician assistant, nurse practitioner, pharmacist, or affiliate members. Active members will be eligible for:
- A $35 credit toward 2017–2018 dues when recruiting 1 new member
- A $50 credit toward 2017–2018 dues when recruiting 2–4 new members
- A $75 credit toward 2017–2018 dues when recruiting 5–9 new members
- A $125 credit toward 2017–2018 dues when recruiting 10+ new members
For each member recruited, referrers will receive one entry into a grand-prize drawing to receive complimentary registration to HM17 in Las Vegas. To be counted as a referral, the new member must:
- Be a brand-new member to SHM. (Past members whose membership has lapsed do not qualify.)
- Register as a physician, physician assistant, nurse practitioner, pharmacist, or affiliate member.
- Include an active member’s name in the “referred by” field on a printed application or the online join form.
- Join before December 31, 2016.
Note: SHM members are not eligible for dues credits through the Membership Ambassador Program for member referrals attributed to free memberships received as a result of HM17 registrations.
Hospitalist Chief Finds Value in SHM’s Hospitalist Engagement Benchmarking Service
Rachel Lovins, MD, SFHM, CPE, is the chief of hospital medicine and vice chair of the Department of Medicine at Middlesex Hospital in Middletown, Conn. In 2015, she read about the Hospitalist Engagement Benchmarking Service, a new offering from SHM that assesses the engagement level of approximately 1,500 hospitalists nationwide. Soon thereafter, she enrolled her hospital medicine group.

The service provides a snapshot and benchmark comparison of physician attitudes toward a wide range of aspects, including organizational climate, care quality, effective motivation, burnout risk, and more.
Dr. Lovins recently shared her thoughts on the survey with The Hospitalist and explained how she and her team are using the results of the survey to improve the engagement of their hospitalist group. More than 80% of survey respondents indicated they will utilize the service again and plan to recommend the service to a colleague. Learn more and join the second cohort at www.hospitalmedicine.org/pmad3.
Question: How did you become aware of the Hospitalist Engagement Benchmarking Service?
Answer: Last year, I read a blog post written by practice management expert Leslie Flores, MHA, SFHM, about happiness. In the post, she shared information about the country of Bhutan and its Gross National Happiness Index. She proceeded to relate it to practice management, stressing the importance of “paying deliberate attention to hospitalist personal and professional well-being” to ensure sustainability in our field.
As she reflected on the implications of Bhutan’s happiness index and its relation to hospital medicine, she suggested having hospital medicine groups complete SHM’s Hospitalist Engagement Benchmarking Survey to know where they stood with their own happiness indices. As the chief of hospital medicine in my hospital, it truly resonated with me. (As an aside, I often joke that I do whatever Leslie says—because she is pretty much always right!)
Q: What factors inspired you to enroll your group in the service?
A: I’m a total believer in the philosophy of Leslie and her consulting partner, John Nelson, MD, MHM, that a healthy hospital medicine group needs a culture of ownership. If members don’t feel engaged, burnout and isolation are not far behind. Hospitalist work is not easy, and the hours can be long. If you don’t feel empowered, safe, and engaged, it’s going to be unhappy work and an unhappy group.
The leadership team in my program sincerely wants our members to feel satisfied professionally and personally at work. In addition to having a high-performing group, we want people to feel like they belong and that they have some control over what goes on in their daily practice.
Q: How would you describe your experience throughout the survey, including findings and follow-up?
A: I found the survey very easy. I supplied the emails of the participating hospitalists to SHM, and their team took care of the rest, including consistent follow-up. A few months after our group completed the survey, I received the results, which were extremely helpful. It was particularly interesting to see where we scored compared to other hospitalist groups.
Q: What were the main findings upon completion for your team at Middlesex Hospital? How did you implement the takeaways/changes following the service? What were/are the results?
A: I was happy to see that our group felt like they made a difference to our patients and the hospital and that the leadership provided good support. I was, however, discouraged that there were issues with perceived fairness in patient distribution and that our percentages for folks looking forward to and being excited by their jobs were somewhat low.
These two issues—and risk for burnout specifically—are part of our strategic plan moving forward. We need to find ways to make patient distribution more transparent and make people feel happier about coming to work, partially through quarterly “think tanks,” which we just started this year. Because of the results of this survey and another hospital survey, we created an anonymous internal survey to get more specific information. Through that, I was able to target some very specific issues and to reach out to members of the group to try and resolve them.
This is an ongoing process, and we have to keep working on it. It’s like a marriage; you can’t just sit back and assume a relationship will work out on its own. You have to constantly reassess your partner’s needs and be concerned about their happiness as well as your own. We certainly don’t do a perfect job meeting everyone’s needs, but we strive to do so. Having a tool that is validated and easy to use is extremely beneficial to us, and I will definitely use it again. I’d recommend it to anyone who manages a hospitalist group. TH
Brett Radler is SHM’s communications coordinator.
Rachel Lovins, MD, SFHM, CPE, is the chief of hospital medicine and vice chair of the Department of Medicine at Middlesex Hospital in Middletown, Conn. In 2015, she read about the Hospitalist Engagement Benchmarking Service, a new offering from SHM that assesses the engagement level of approximately 1,500 hospitalists nationwide. Soon thereafter, she enrolled her hospital medicine group.
The service provides a snapshot and benchmark comparison of physician attitudes toward a wide range of aspects, including organizational climate, care quality, effective motivation, burnout risk, and more.
Dr. Lovins recently shared her thoughts on the survey with The Hospitalist and explained how she and her team are using the results of the survey to improve the engagement of their hospitalist group. More than 80% of survey respondents indicated they will utilize the service again and plan to recommend the service to a colleague. Learn more and join the second cohort at www.hospitalmedicine.org/pmad3.
Question: How did you become aware of the Hospitalist Engagement Benchmarking Service?
Answer: Last year, I read a blog post written by practice management expert Leslie Flores, MHA, SFHM, about happiness. In the post, she shared information about the country of Bhutan and its Gross National Happiness Index. She proceeded to relate it to practice management, stressing the importance of “paying deliberate attention to hospitalist personal and professional well-being” to ensure sustainability in our field.
As she reflected on the implications of Bhutan’s happiness index and its relation to hospital medicine, she suggested having hospital medicine groups complete SHM’s Hospitalist Engagement Benchmarking Survey to know where they stood with their own happiness indices. As the chief of hospital medicine in my hospital, it truly resonated with me. (As an aside, I often joke that I do whatever Leslie says—because she is pretty much always right!)
Q: What factors inspired you to enroll your group in the service?
A: I’m a total believer in the philosophy of Leslie and her consulting partner, John Nelson, MD, MHM, that a healthy hospital medicine group needs a culture of ownership. If members don’t feel engaged, burnout and isolation are not far behind. Hospitalist work is not easy, and the hours can be long. If you don’t feel empowered, safe, and engaged, it’s going to be unhappy work and an unhappy group.
The leadership team in my program sincerely wants our members to feel satisfied professionally and personally at work. In addition to having a high-performing group, we want people to feel like they belong and that they have some control over what goes on in their daily practice.
Q: How would you describe your experience throughout the survey, including findings and follow-up?
A: I found the survey very easy. I supplied the emails of the participating hospitalists to SHM, and their team took care of the rest, including consistent follow-up. A few months after our group completed the survey, I received the results, which were extremely helpful. It was particularly interesting to see where we scored compared to other hospitalist groups.
Q: What were the main findings upon completion for your team at Middlesex Hospital? How did you implement the takeaways/changes following the service? What were/are the results?
A: I was happy to see that our group felt like they made a difference to our patients and the hospital and that the leadership provided good support. I was, however, discouraged that there were issues with perceived fairness in patient distribution and that our percentages for folks looking forward to and being excited by their jobs were somewhat low.
These two issues—and risk for burnout specifically—are part of our strategic plan moving forward. We need to find ways to make patient distribution more transparent and make people feel happier about coming to work, partially through quarterly “think tanks,” which we just started this year. Because of the results of this survey and another hospital survey, we created an anonymous internal survey to get more specific information. Through that, I was able to target some very specific issues and to reach out to members of the group to try and resolve them.
This is an ongoing process, and we have to keep working on it. It’s like a marriage; you can’t just sit back and assume a relationship will work out on its own. You have to constantly reassess your partner’s needs and be concerned about their happiness as well as your own. We certainly don’t do a perfect job meeting everyone’s needs, but we strive to do so. Having a tool that is validated and easy to use is extremely beneficial to us, and I will definitely use it again. I’d recommend it to anyone who manages a hospitalist group. TH
Brett Radler is SHM’s communications coordinator.
Rachel Lovins, MD, SFHM, CPE, is the chief of hospital medicine and vice chair of the Department of Medicine at Middlesex Hospital in Middletown, Conn. In 2015, she read about the Hospitalist Engagement Benchmarking Service, a new offering from SHM that assesses the engagement level of approximately 1,500 hospitalists nationwide. Soon thereafter, she enrolled her hospital medicine group.
The service provides a snapshot and benchmark comparison of physician attitudes toward a wide range of aspects, including organizational climate, care quality, effective motivation, burnout risk, and more.
Dr. Lovins recently shared her thoughts on the survey with The Hospitalist and explained how she and her team are using the results of the survey to improve the engagement of their hospitalist group. More than 80% of survey respondents indicated they will utilize the service again and plan to recommend the service to a colleague. Learn more and join the second cohort at www.hospitalmedicine.org/pmad3.
Question: How did you become aware of the Hospitalist Engagement Benchmarking Service?
Answer: Last year, I read a blog post written by practice management expert Leslie Flores, MHA, SFHM, about happiness. In the post, she shared information about the country of Bhutan and its Gross National Happiness Index. She proceeded to relate it to practice management, stressing the importance of “paying deliberate attention to hospitalist personal and professional well-being” to ensure sustainability in our field.
As she reflected on the implications of Bhutan’s happiness index and its relation to hospital medicine, she suggested having hospital medicine groups complete SHM’s Hospitalist Engagement Benchmarking Survey to know where they stood with their own happiness indices. As the chief of hospital medicine in my hospital, it truly resonated with me. (As an aside, I often joke that I do whatever Leslie says—because she is pretty much always right!)
Q: What factors inspired you to enroll your group in the service?
A: I’m a total believer in the philosophy of Leslie and her consulting partner, John Nelson, MD, MHM, that a healthy hospital medicine group needs a culture of ownership. If members don’t feel engaged, burnout and isolation are not far behind. Hospitalist work is not easy, and the hours can be long. If you don’t feel empowered, safe, and engaged, it’s going to be unhappy work and an unhappy group.
The leadership team in my program sincerely wants our members to feel satisfied professionally and personally at work. In addition to having a high-performing group, we want people to feel like they belong and that they have some control over what goes on in their daily practice.
Q: How would you describe your experience throughout the survey, including findings and follow-up?
A: I found the survey very easy. I supplied the emails of the participating hospitalists to SHM, and their team took care of the rest, including consistent follow-up. A few months after our group completed the survey, I received the results, which were extremely helpful. It was particularly interesting to see where we scored compared to other hospitalist groups.
Q: What were the main findings upon completion for your team at Middlesex Hospital? How did you implement the takeaways/changes following the service? What were/are the results?
A: I was happy to see that our group felt like they made a difference to our patients and the hospital and that the leadership provided good support. I was, however, discouraged that there were issues with perceived fairness in patient distribution and that our percentages for folks looking forward to and being excited by their jobs were somewhat low.
These two issues—and risk for burnout specifically—are part of our strategic plan moving forward. We need to find ways to make patient distribution more transparent and make people feel happier about coming to work, partially through quarterly “think tanks,” which we just started this year. Because of the results of this survey and another hospital survey, we created an anonymous internal survey to get more specific information. Through that, I was able to target some very specific issues and to reach out to members of the group to try and resolve them.
This is an ongoing process, and we have to keep working on it. It’s like a marriage; you can’t just sit back and assume a relationship will work out on its own. You have to constantly reassess your partner’s needs and be concerned about their happiness as well as your own. We certainly don’t do a perfect job meeting everyone’s needs, but we strive to do so. Having a tool that is validated and easy to use is extremely beneficial to us, and I will definitely use it again. I’d recommend it to anyone who manages a hospitalist group. TH
Brett Radler is SHM’s communications coordinator.
Growths on face and scalp
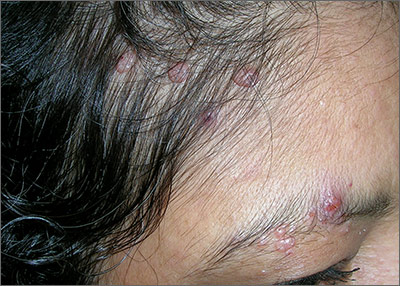
The FP diagnosed molluscum contagiosum and recognized that some of the larger lesions on the scalp were related to the patient’s altered immune status. Molluscum contagiosum is a viral skin infection that produces pearly papules that often have central umbilication. This skin infection is most commonly seen in children, but can also be transmitted sexually among adults. The number of cases in adults increased in the 1980s in the United States, probably as a result of the HIV/AIDS epidemic. Since the introduction of highly active antiretroviral therapy (HAART), the number of molluscum contagiosum cases in HIV/AIDS patients has decreased substantially. However, the prevalence of molluscum contagiosum in patients who are HIV-positive may still be as high as 5% to 18%.
The FP encouraged the patient to take her antiretroviral medication as prescribed and suggested that she return to her HIV specialist to see if her therapeutic regimen required any adjustments. He also offered her cryotherapy, with a follow-up appointment one month later. The patient agreed to the cryotherapy, which was performed with a cryogun using a bent tip spray. The patient’s eye was protected using a tongue depressor, while her eyelid was sprayed with liquid nitrogen.
At the follow-up visit, the molluscum lesions had improved and a second round of cryotherapy was performed. Although it was not offered to this patient, topical imiquimod is another treatment option for molluscum contagiosum. This treatment has not, however, been approved by the Food and Drug Administration for this diagnosis.
Photos and text for Photo Rounds Friday courtesy of Richard P. Usatine, MD. This case was adapted from: Mayeaux, EJ. Molluscum contagiosum. In: Usatine R, Smith M, Mayeaux EJ, et al, eds. Color Atlas of Family Medicine. 2nd ed. New York, NY: McGraw-Hill; 2013:743-748.
To learn more about the Color Atlas of Family Medicine, see: www.amazon.com/Color-Family-Medicine-Richard-Usatine/dp/0071769641/
You can now get the second edition of the Color Atlas of Family Medicine as an app by clicking on this link: usatinemedia.com
The FP diagnosed molluscum contagiosum and recognized that some of the larger lesions on the scalp were related to the patient’s altered immune status. Molluscum contagiosum is a viral skin infection that produces pearly papules that often have central umbilication. This skin infection is most commonly seen in children, but can also be transmitted sexually among adults. The number of cases in adults increased in the 1980s in the United States, probably as a result of the HIV/AIDS epidemic. Since the introduction of highly active antiretroviral therapy (HAART), the number of molluscum contagiosum cases in HIV/AIDS patients has decreased substantially. However, the prevalence of molluscum contagiosum in patients who are HIV-positive may still be as high as 5% to 18%.
The FP encouraged the patient to take her antiretroviral medication as prescribed and suggested that she return to her HIV specialist to see if her therapeutic regimen required any adjustments. He also offered her cryotherapy, with a follow-up appointment one month later. The patient agreed to the cryotherapy, which was performed with a cryogun using a bent tip spray. The patient’s eye was protected using a tongue depressor, while her eyelid was sprayed with liquid nitrogen.
At the follow-up visit, the molluscum lesions had improved and a second round of cryotherapy was performed. Although it was not offered to this patient, topical imiquimod is another treatment option for molluscum contagiosum. This treatment has not, however, been approved by the Food and Drug Administration for this diagnosis.
Photos and text for Photo Rounds Friday courtesy of Richard P. Usatine, MD. This case was adapted from: Mayeaux, EJ. Molluscum contagiosum. In: Usatine R, Smith M, Mayeaux EJ, et al, eds. Color Atlas of Family Medicine. 2nd ed. New York, NY: McGraw-Hill; 2013:743-748.
To learn more about the Color Atlas of Family Medicine, see: www.amazon.com/Color-Family-Medicine-Richard-Usatine/dp/0071769641/
You can now get the second edition of the Color Atlas of Family Medicine as an app by clicking on this link: usatinemedia.com
The FP diagnosed molluscum contagiosum and recognized that some of the larger lesions on the scalp were related to the patient’s altered immune status. Molluscum contagiosum is a viral skin infection that produces pearly papules that often have central umbilication. This skin infection is most commonly seen in children, but can also be transmitted sexually among adults. The number of cases in adults increased in the 1980s in the United States, probably as a result of the HIV/AIDS epidemic. Since the introduction of highly active antiretroviral therapy (HAART), the number of molluscum contagiosum cases in HIV/AIDS patients has decreased substantially. However, the prevalence of molluscum contagiosum in patients who are HIV-positive may still be as high as 5% to 18%.
The FP encouraged the patient to take her antiretroviral medication as prescribed and suggested that she return to her HIV specialist to see if her therapeutic regimen required any adjustments. He also offered her cryotherapy, with a follow-up appointment one month later. The patient agreed to the cryotherapy, which was performed with a cryogun using a bent tip spray. The patient’s eye was protected using a tongue depressor, while her eyelid was sprayed with liquid nitrogen.
At the follow-up visit, the molluscum lesions had improved and a second round of cryotherapy was performed. Although it was not offered to this patient, topical imiquimod is another treatment option for molluscum contagiosum. This treatment has not, however, been approved by the Food and Drug Administration for this diagnosis.
Photos and text for Photo Rounds Friday courtesy of Richard P. Usatine, MD. This case was adapted from: Mayeaux, EJ. Molluscum contagiosum. In: Usatine R, Smith M, Mayeaux EJ, et al, eds. Color Atlas of Family Medicine. 2nd ed. New York, NY: McGraw-Hill; 2013:743-748.
To learn more about the Color Atlas of Family Medicine, see: www.amazon.com/Color-Family-Medicine-Richard-Usatine/dp/0071769641/
You can now get the second edition of the Color Atlas of Family Medicine as an app by clicking on this link: usatinemedia.com

Two compounds show promise against Zika virus

Photo courtesy of
Muhammad Mahdi Karim
Two compounds have shown activity against the Zika virus, according to Biotech Biotron, a company that develops compounds to fight viral diseases such as HIV and hepatitis C. The two compounds from its library killed the Zika virus in vitro, as determined by an independent USA laboratory facility.
“These early results are encouraging,” Michelle Miller, PhD, of Biotron, said. “Identification of these active compounds in our library is a starting point for designing potent drugs against Zika.”
At present, there is no approved vaccine or treatment for Zika virus, whose common symptoms include fever, rash, joint pain, and conjunctivitis.
While the symptoms are generally mild, Zika infection during pregnancy has been associated with microcephaly and other severe brain defects in the newborn.
In addition, Zika infection may be associated with an increased risk of Guillain-Barré syndrome, which is being investigated by the Centers for Disease Control and Prevention.
Biotron is planning to carry out more tests on the Zika virus to determine whether the compounds are likely to be safe and effective in humans.
The Zika virus is primarily spread by infected mosquitoes. But exposure to an infected person’s blood or other body fluids may also result in transmission. 
Photo courtesy of
Muhammad Mahdi Karim
Two compounds have shown activity against the Zika virus, according to Biotech Biotron, a company that develops compounds to fight viral diseases such as HIV and hepatitis C. The two compounds from its library killed the Zika virus in vitro, as determined by an independent USA laboratory facility.
“These early results are encouraging,” Michelle Miller, PhD, of Biotron, said. “Identification of these active compounds in our library is a starting point for designing potent drugs against Zika.”
At present, there is no approved vaccine or treatment for Zika virus, whose common symptoms include fever, rash, joint pain, and conjunctivitis.
While the symptoms are generally mild, Zika infection during pregnancy has been associated with microcephaly and other severe brain defects in the newborn.
In addition, Zika infection may be associated with an increased risk of Guillain-Barré syndrome, which is being investigated by the Centers for Disease Control and Prevention.
Biotron is planning to carry out more tests on the Zika virus to determine whether the compounds are likely to be safe and effective in humans.
The Zika virus is primarily spread by infected mosquitoes. But exposure to an infected person’s blood or other body fluids may also result in transmission.
Photo courtesy of
Muhammad Mahdi Karim
Two compounds have shown activity against the Zika virus, according to Biotech Biotron, a company that develops compounds to fight viral diseases such as HIV and hepatitis C. The two compounds from its library killed the Zika virus in vitro, as determined by an independent USA laboratory facility.
“These early results are encouraging,” Michelle Miller, PhD, of Biotron, said. “Identification of these active compounds in our library is a starting point for designing potent drugs against Zika.”
At present, there is no approved vaccine or treatment for Zika virus, whose common symptoms include fever, rash, joint pain, and conjunctivitis.
While the symptoms are generally mild, Zika infection during pregnancy has been associated with microcephaly and other severe brain defects in the newborn.
In addition, Zika infection may be associated with an increased risk of Guillain-Barré syndrome, which is being investigated by the Centers for Disease Control and Prevention.
Biotron is planning to carry out more tests on the Zika virus to determine whether the compounds are likely to be safe and effective in humans.
The Zika virus is primarily spread by infected mosquitoes. But exposure to an infected person’s blood or other body fluids may also result in transmission.
Platelet transfusions do not reduce IVH risk in VLBW infants
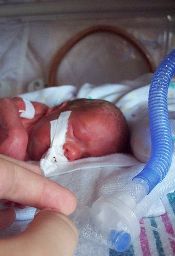
A retrospective, multicenter study of 972 very-low-birth-weight (VLBW) infants treated in 6 US neonatal intensive care units (NICUs) has shown that platelet transfusions do not significantly affect the incidence of intraventricular hemorrhage (IVH).
Thrombocytopenia is a risk factor for IVH, but investigators found no correlation between its severity and risk for IVH. Nor did they find platelet transfusions to have a significant effect on the incidence of IVH.
To describe platelet transfusion practices in US NICUs, senior author Martha Sola-Visner, MD, of Boston Children’s Hospital in Massachusetts, and colleagues studied NICU admissions from January 1, 2006, to December 31, 2007. They collected the last data on December 4, 2008.
Of the 972 VLBW infants, 231 (23.8%) received at least 1 platelet transfusion. And more males received transfusions (61%) than females.
Infants who received transfusions were more premature at 26.3 weeks’ gestation age compared with 28.8 weeks for those who did not receive transfusions, P<0.001.
Transfused infants were also smaller, with a mean birth weight of 805 g compared with 1113 g in the group that did not receive a transfusion, P<0.001.
Platelet transfusions
The 231 transfused infants received a total of 1002 platelet transfusions, with a mean of 4.3 per infant (range 1 to 63 transfusions).
Forty-one percent of infants had transfusions during the first 7 days of life only, amounting to 281 transfusions; 32.9% had transfusions after the first 7 days only, and 26.4% had transfusions during both periods. Seven hundred twenty-one transfusions were administered after day 7.
Almost two thirds of the transfusions, 65.4% or 653 of 998 transfusions, were given to infants who had a pre-transfusion platelet count of at least 50,000/μL.
The investigators poined out that this finding “was in contrast to UK NICUs,” where transfusions are administered at a median platelet count of 27,000/μL.
Illness severity
The investigators found significant differences among NICU sites in terms of clinical markers for transfusions.
Overall, 189 VLBW infants had platelet counts less than 100,000/μL in the first 7 days of life for a total of 402 days. And at least 1 platelet transfusion was given on 212 of those days. Of these, 198 transfusions (93.4%) had a marker of severe illness or bleeding.
On the other hand, of the 190 patient days without a transfusion, 113 (59.5%) had at least 1 of these markers (P<0.001).
Thrombocytopenia and IVH risk
The investigators evaluated the risk for IVH based on the lowest platelet count before the diagnosis of IVH was made.
They found that infants with thrombocytopenia were at higher risk for IVH, with a hazard ratio of 2.17 for any platelet count less than 150,000/μL (P<0.001).
Nevertheless, for the 314 infants with at least 1 platelet count less than 150,000/μL during the first 7 days of life, they found no association between severity of thrombocytopenia and the risk for subsequent IVH (P=0.70).
Transfusion and IVH risk
To determine whether platelet transfusions protected VLBW infants from IVH during their first 7 days of life, the investigators performed a Cox regression analysis in 756 infants.
They found that 134 infants (17.7%) had an IVH, including 62 (8.2%) with grade III or IV. So in the unadjusted model, they found a significant association between platelet transfusion and subsequent IVH, P=0.004.
However, when they adjusted the model for clinical covariates, only infants with grade III or IV IVH had a significantly greater risk with platelet transfusion, P=0.01.
Clinical covariates included sex, gestational age less than 28 weeks, 5-minute Apgar score less than 7, antenatal corticosteroid treatment, and pregnancy-induced hypertension as an indication for delivery.
The investigators also adjusted the model for clinical covariates and nadir platelet count of less than 15,000/μL. In this model, platelet transfusion became nonsignificant, even for IVH of grade III or IV.
The investigators noted that the degree to which their results are generalizable to infants with more severe thrombocytopenia is unclear, since infants in this analysis often had transfusions at platelet levels between 50,000/μL and 150,000/μL. They also collected the data approximately 8 years ago, and transfusion practices may have changed since then.
The 6 NICU study sites included Boston Children’s Hospital, Boston, Massachusetts; University of Iowa Children’s Hospital, Iowa City, Iowa; and 4 NICUs affiliated with Intermountain Health Care in Utah.
The investigators published their findings in JAMA Pediatrics.
A retrospective, multicenter study of 972 very-low-birth-weight (VLBW) infants treated in 6 US neonatal intensive care units (NICUs) has shown that platelet transfusions do not significantly affect the incidence of intraventricular hemorrhage (IVH).
Thrombocytopenia is a risk factor for IVH, but investigators found no correlation between its severity and risk for IVH. Nor did they find platelet transfusions to have a significant effect on the incidence of IVH.
To describe platelet transfusion practices in US NICUs, senior author Martha Sola-Visner, MD, of Boston Children’s Hospital in Massachusetts, and colleagues studied NICU admissions from January 1, 2006, to December 31, 2007. They collected the last data on December 4, 2008.
Of the 972 VLBW infants, 231 (23.8%) received at least 1 platelet transfusion. And more males received transfusions (61%) than females.
Infants who received transfusions were more premature at 26.3 weeks’ gestation age compared with 28.8 weeks for those who did not receive transfusions, P<0.001.
Transfused infants were also smaller, with a mean birth weight of 805 g compared with 1113 g in the group that did not receive a transfusion, P<0.001.
Platelet transfusions
The 231 transfused infants received a total of 1002 platelet transfusions, with a mean of 4.3 per infant (range 1 to 63 transfusions).
Forty-one percent of infants had transfusions during the first 7 days of life only, amounting to 281 transfusions; 32.9% had transfusions after the first 7 days only, and 26.4% had transfusions during both periods. Seven hundred twenty-one transfusions were administered after day 7.
Almost two thirds of the transfusions, 65.4% or 653 of 998 transfusions, were given to infants who had a pre-transfusion platelet count of at least 50,000/μL.
The investigators poined out that this finding “was in contrast to UK NICUs,” where transfusions are administered at a median platelet count of 27,000/μL.
Illness severity
The investigators found significant differences among NICU sites in terms of clinical markers for transfusions.
Overall, 189 VLBW infants had platelet counts less than 100,000/μL in the first 7 days of life for a total of 402 days. And at least 1 platelet transfusion was given on 212 of those days. Of these, 198 transfusions (93.4%) had a marker of severe illness or bleeding.
On the other hand, of the 190 patient days without a transfusion, 113 (59.5%) had at least 1 of these markers (P<0.001).
Thrombocytopenia and IVH risk
The investigators evaluated the risk for IVH based on the lowest platelet count before the diagnosis of IVH was made.
They found that infants with thrombocytopenia were at higher risk for IVH, with a hazard ratio of 2.17 for any platelet count less than 150,000/μL (P<0.001).
Nevertheless, for the 314 infants with at least 1 platelet count less than 150,000/μL during the first 7 days of life, they found no association between severity of thrombocytopenia and the risk for subsequent IVH (P=0.70).
Transfusion and IVH risk
To determine whether platelet transfusions protected VLBW infants from IVH during their first 7 days of life, the investigators performed a Cox regression analysis in 756 infants.
They found that 134 infants (17.7%) had an IVH, including 62 (8.2%) with grade III or IV. So in the unadjusted model, they found a significant association between platelet transfusion and subsequent IVH, P=0.004.
However, when they adjusted the model for clinical covariates, only infants with grade III or IV IVH had a significantly greater risk with platelet transfusion, P=0.01.
Clinical covariates included sex, gestational age less than 28 weeks, 5-minute Apgar score less than 7, antenatal corticosteroid treatment, and pregnancy-induced hypertension as an indication for delivery.
The investigators also adjusted the model for clinical covariates and nadir platelet count of less than 15,000/μL. In this model, platelet transfusion became nonsignificant, even for IVH of grade III or IV.
The investigators noted that the degree to which their results are generalizable to infants with more severe thrombocytopenia is unclear, since infants in this analysis often had transfusions at platelet levels between 50,000/μL and 150,000/μL. They also collected the data approximately 8 years ago, and transfusion practices may have changed since then.
The 6 NICU study sites included Boston Children’s Hospital, Boston, Massachusetts; University of Iowa Children’s Hospital, Iowa City, Iowa; and 4 NICUs affiliated with Intermountain Health Care in Utah.
The investigators published their findings in JAMA Pediatrics.
A retrospective, multicenter study of 972 very-low-birth-weight (VLBW) infants treated in 6 US neonatal intensive care units (NICUs) has shown that platelet transfusions do not significantly affect the incidence of intraventricular hemorrhage (IVH).
Thrombocytopenia is a risk factor for IVH, but investigators found no correlation between its severity and risk for IVH. Nor did they find platelet transfusions to have a significant effect on the incidence of IVH.
To describe platelet transfusion practices in US NICUs, senior author Martha Sola-Visner, MD, of Boston Children’s Hospital in Massachusetts, and colleagues studied NICU admissions from January 1, 2006, to December 31, 2007. They collected the last data on December 4, 2008.
Of the 972 VLBW infants, 231 (23.8%) received at least 1 platelet transfusion. And more males received transfusions (61%) than females.
Infants who received transfusions were more premature at 26.3 weeks’ gestation age compared with 28.8 weeks for those who did not receive transfusions, P<0.001.
Transfused infants were also smaller, with a mean birth weight of 805 g compared with 1113 g in the group that did not receive a transfusion, P<0.001.
Platelet transfusions
The 231 transfused infants received a total of 1002 platelet transfusions, with a mean of 4.3 per infant (range 1 to 63 transfusions).
Forty-one percent of infants had transfusions during the first 7 days of life only, amounting to 281 transfusions; 32.9% had transfusions after the first 7 days only, and 26.4% had transfusions during both periods. Seven hundred twenty-one transfusions were administered after day 7.
Almost two thirds of the transfusions, 65.4% or 653 of 998 transfusions, were given to infants who had a pre-transfusion platelet count of at least 50,000/μL.
The investigators poined out that this finding “was in contrast to UK NICUs,” where transfusions are administered at a median platelet count of 27,000/μL.
Illness severity
The investigators found significant differences among NICU sites in terms of clinical markers for transfusions.
Overall, 189 VLBW infants had platelet counts less than 100,000/μL in the first 7 days of life for a total of 402 days. And at least 1 platelet transfusion was given on 212 of those days. Of these, 198 transfusions (93.4%) had a marker of severe illness or bleeding.
On the other hand, of the 190 patient days without a transfusion, 113 (59.5%) had at least 1 of these markers (P<0.001).
Thrombocytopenia and IVH risk
The investigators evaluated the risk for IVH based on the lowest platelet count before the diagnosis of IVH was made.
They found that infants with thrombocytopenia were at higher risk for IVH, with a hazard ratio of 2.17 for any platelet count less than 150,000/μL (P<0.001).
Nevertheless, for the 314 infants with at least 1 platelet count less than 150,000/μL during the first 7 days of life, they found no association between severity of thrombocytopenia and the risk for subsequent IVH (P=0.70).
Transfusion and IVH risk
To determine whether platelet transfusions protected VLBW infants from IVH during their first 7 days of life, the investigators performed a Cox regression analysis in 756 infants.
They found that 134 infants (17.7%) had an IVH, including 62 (8.2%) with grade III or IV. So in the unadjusted model, they found a significant association between platelet transfusion and subsequent IVH, P=0.004.
However, when they adjusted the model for clinical covariates, only infants with grade III or IV IVH had a significantly greater risk with platelet transfusion, P=0.01.
Clinical covariates included sex, gestational age less than 28 weeks, 5-minute Apgar score less than 7, antenatal corticosteroid treatment, and pregnancy-induced hypertension as an indication for delivery.
The investigators also adjusted the model for clinical covariates and nadir platelet count of less than 15,000/μL. In this model, platelet transfusion became nonsignificant, even for IVH of grade III or IV.
The investigators noted that the degree to which their results are generalizable to infants with more severe thrombocytopenia is unclear, since infants in this analysis often had transfusions at platelet levels between 50,000/μL and 150,000/μL. They also collected the data approximately 8 years ago, and transfusion practices may have changed since then.
The 6 NICU study sites included Boston Children’s Hospital, Boston, Massachusetts; University of Iowa Children’s Hospital, Iowa City, Iowa; and 4 NICUs affiliated with Intermountain Health Care in Utah.
The investigators published their findings in JAMA Pediatrics.
Mortality Risk and Patient Experience
Few today deny the importance of the Hospital Consumer Assessment of Healthcare Providers and Systems (HCAHPS) survey.[1, 2] The Centers for Medicare and Medicaid Services' (CMS) Value Based Purchasing incentive, sympathy for the ill, and relationships between the patient experience and quality of care provide sufficient justification.[3, 4] How to improve the experience scores is not well understood. The national scores have improved only modestly over the past 3 years.[5, 6]
Clinicians may not typically compartmentalize what they do to improve outcomes versus the patient experience. A possible source for new improvement strategies is to understand the types of patients in which both adverse outcomes and suboptimal experiences are likely to occur, then redesign the multidisciplinary care processes to address both concurrently.[7] Previous studies support the existence of a relationship between a higher mortality risk on admission and subsequent worse outcomes, as well as a relationship between worse outcomes and lower HCAHPS scores.[8, 9, 10, 11, 12, 13] We hypothesized the mortality risk on admission, patient experience, and outcomes might share a triad relationship (Figure 1). In this article we explore the third edge of this triangle, the association between the mortality risk on admission and the subsequent patient experience.
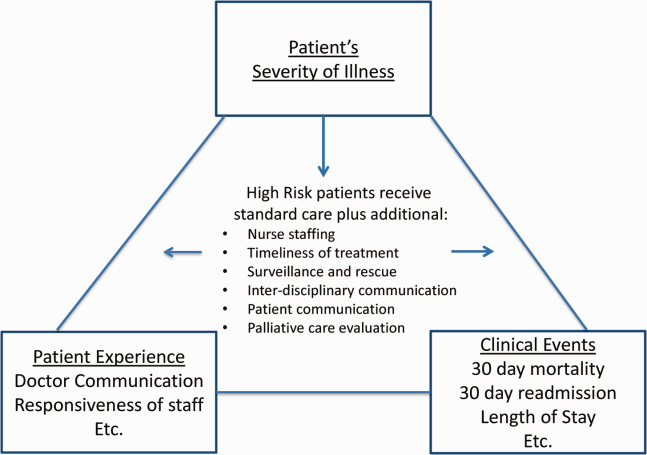
METHODS
We studied HCAHPS from 5 midwestern US hospitals having 113, 136, 304, 443, and 537 licensed beds, affiliated with the same multistate healthcare system. HCAHPS telephone surveys were administered via a vendor to a random sample of inpatients 18 years of age or older discharged from January 1, 2012 through June 30, 2014. Per CMS guidelines, surveyed patients must have been discharged alive after a hospital stay of at least 1 night.[14] Patients ineligible to be surveyed included those discharged to skilled nursing facilities or hospice care.[14] Because not all study hospitals provided obstetrical services, we restricted the analyses to medical and surgical respondents. With the permission of the local institutional review board, subjects' survey responses were linked confidentially to their clinical data.
We focused on the 8 dimensions of the care experience used in the CMS Value Based Purchasing program: communication with doctors, communication with nurses, responsiveness of hospital staff, pain management, communication about medicines, discharge information, hospital environment, and an overall rating of the hospital.[2] Following the scoring convention for publicly reported results, we dichotomized the 4‐level Likert scales into the most favorable response possible (always) versus all other responses.[15] Similarly we dichotomized the hospital rating scale at 9 and above for the most favorable response.
Our unit of analysis was an individual hospitalization. Our primary outcome of interest was whether or not the respondent provided the most favorable response for all questions answered within a given domain. For example, for the physician communication domain, the patient must have answered always to each of the 3 questions answered within the domain. This approach is appropriate for learning which patient‐level factors influence the survey responses, but differs from that used for the publically reported domain scores for which the relative performance of hospitals is the focus.[16] For the latter, the hospital was the unit of analysis, and the domain score was basically the average of the percentages of top box scores for the questions within a domain. For example, if 90% respondents from a hospital provided a top box response for courtesy, 80% for listening, and 70% for explanation, the hospital's physician communication score would be (90 + 80 + 70)/3 = 80%.[17]
Our primary explanatory variable was a binary high versus low mortality‐risk status of the respondent on admission based on age, gender, prior hospitalizations, clinical laboratory values, and diagnoses present on admission.[12] The calculated mortality risk was then dichotomized prior to the analysis at a probability of dying equal to 0.07 or higher. This corresponded roughly to the top quintile of predicted risk found in prior studies.[12, 13] During the study period, only 2 of the hospitals had the capability of generating mortality scores in real time, so for this study the mortality risk was calculated retrospectively, using information deemed present on admission.[12]
To estimate the sample size, we assumed that the high‐risk strata contained approximately 13% of respondents, and that the true percent of top box responses from patients in the lower‐risk stratum was approximately 80% for each domain. A meaningful difference in the proportion of most favorable responses was considered as an odds ratio (OR) of 0.75 for high risk versus low risk. A significance level of P 0.003 was set to control study‐wide type I error due to multiple comparisons. We determined that for each dimension, approximately 8583 survey responses would be required for low‐risk patients and approximately 1116 responses for high‐risk patients to achieve 80% power under these assumptions. We were able to accrue the target number of surveys for all but 3 domains (pain management, communication about medicines, and hospital environment) because of data availability, and because patients are allowed to skip questions that do not apply. Univariate relationships were examined with 2, t test, and Fisher exact tests where indicated. Generalized linear mixed regression models with a logit link were fit to determine the association between patient mortality risk and the top box experience for each of the HCAHPS domains and for the overall rating. The patient's hospital was considered a random intercept to account for the patient‐hospital hierarchy and the unmeasured hospital‐specific practices. The multivariable models controlled for gender plus the HCAHPS patient‐mix adjustment variables of age, education, self‐rated health, language spoken at home, service line, and the number of days elapsed between the date of discharge and date of the survey.[18, 19, 20, 21] In keeping with the industry analyses, a second order interaction variable was included between surgery patients and age.[19] We considered the potential collinearity between the mortality risk status, age, and patient self‐reported health. We found the variance inflation factors were small, so we drew inference from the full multivariable model.
We also performed a post hoc sensitivity analysis to determine if our conclusions were biased due to missing patient responses for the risk‐adjustment variables. Accordingly, we imputed the response level most negatively associated with most HCAHPS domains as previously reported and reran the multivariable models.[19] We did not find a meaningful change in our conclusions (see Supporting Figure 1 in the online version of this article).
RESULTS
The hospitals discharged 152,333 patients during the study period, 39,905 of whom (26.2 %) had a predicted 30‐day mortality risk greater or equal to 0.07 (Table 1). Of the 36,280 high‐risk patients discharged alive, 5901 (16.3%) died in the ensuing 30 days, and 7951 (22%) were readmitted.
| Characteristic | Low‐Risk Stratum, No./Discharged (%) or Mean (SD) | High‐Risk Stratum, No./Discharged (%) or Mean (SD) | P Value* |
|---|---|---|---|
| |||
| Total discharges (row percent) | 112,428/152,333 (74) | 39,905/152,333 (26) | 0.001 |
| Total alive discharges (row percent) | 111,600/147,880 (75) | 36,280/147,880 (25) | 0.001 |
| No. of respondents (row percent) | 14,996/17,509 (86) | 2,513/17,509 (14) | |
| HCAHPS surveys completed | 14,996/111,600 (13) | 2,513/36,280 (7) | 0.001 |
| Readmissions within 30 days (total discharges) | 12,311/112,428 (11) | 7,951/39,905 (20) | 0.001 |
| Readmissions within 30 days (alive discharges) | 12,311/111,600 (11) | 7,951/36,280 (22) | 0.001 |
| Readmissions within 30 days (respondents) | 1,220/14,996 (8) | 424/2,513 (17) | 0.001 |
| Mean predicted probability of 30‐day mortality (total discharges) | 0.022 (0.018) | 0.200 (0.151) | 0.001 |
| Mean predicted probability of 30‐day mortality (alive discharges) | 0.022 (0.018) | 0.187 (0.136) | 0.001 |
| Mean predicted probability of 30‐day mortality (respondents) | 0.020 (0.017) | 0.151 (0.098) | 0.001 |
| In‐hospital death (total discharges) | 828/112,428 (0.74) | 3,625/39,905 (9) | 0.001 |
| Mortality within 30 days (total discharges) | 2,455/112,428 (2) | 9,526/39,905 (24) | 0.001 |
| Mortality within 30 days (alive discharges) | 1,627/111,600 (1.5) | 5,901/36,280 (16) | 0.001 |
| Mortality within 30 days (respondents) | 9/14,996 (0.06) | 16/2,513 (0.64) | 0.001 |
| Female (total discharges) | 62,681/112,368 (56) | 21,058/39,897 (53) | 0.001 |
| Female (alive discharges) | 62,216/111,540 (56) | 19,164/36,272 (53) | 0.001 |
| Female (respondents) | 8,684/14,996 (58) | 1,318/2,513 (52) | 0.001 |
| Age (total discharges) | 61.3 (16.8) | 78.3 (12.5) | 0.001 |
| Age (alive discharges) | 61.2 (16.8) | 78.4 (12.5) | 0.001 |
| Age (respondents) | 63.1 (15.2) | 76.6 (11.5) | 0.001 |
| Highest education attained | |||
| 8th grade or less | 297/14,996 (2) | 98/2,513 (4) | |
| Some high school | 1,190/14,996 (8) | 267/2,513 (11) | |
| High school grad | 4,648/14,996 (31) | 930/2,513 (37) | 0.001 |
| Some college | 6,338/14,996 (42) | 768/2,513 (31) | |
| 4‐year college grad | 1,502/14,996 (10) | 183/2,513 (7) | |
| Missing response | 1,021/14,996 (7) | 267/2,513 (11) | |
| Language spoken at home | |||
| English | 13,763/14,996 (92) | 2,208/2,513 (88) | |
| Spanish | 56/14,996 (0.37) | 8/2,513 (0.32) | 0.47 |
| Chinese | 153/14,996 (1) | 31/2,513 (1) | |
| Missing response | 1,024/14,996 (7) | 266/2,513 (11) | |
| Self‐rated health | |||
| Excellent | 1,399/14,996 (9) | 114/2,513 (5) | |
| Very good | 3,916/14,996 (26) | 405/2,513 (16) | |
| Good | 4,861/14,996 (32) | 713/2,513 (28) | |
| Fair | 2,900/14,996 (19) | 652/2,513 (26) | 0.001 |
| Poor | 1,065/14,996 (7) | 396/2,513 (16) | |
| Missing response | 855/14,996 (6) | 233/2,513 (9) | |
| Length of hospitalization, d (respondents) | 3.5 (2.8) | 4.6 (3.6) | 0.001 |
| Consulting specialties (respondents) | 1.7 (1.0) | 2.2 (1.3) | 0.001 |
| Service line | |||
| Surgical | 6,380/14,996 (43) | 346/2,513 (14) | 0.001 |
| Medical | 8,616/14,996 (57) | 2,167/2,513 (86) | |
| HCAHPS | |||
| Domain 1: Communication With Doctors | 9,564/14,731 (65) | 1,339/2,462 (54) | 0.001 |
| Domain 2: Communication With Nurses | 10,097/14,991 (67) | 1,531/2,511 (61) | 0.001 |
| Domain 3: Responsiveness of Hospital Staff | 7,813/12,964 (60) | 1,158/2,277 (51) | 0.001 |
| Domain 4: Pain Management | 6,565/10,424 (63) | 786/1,328 (59) | 00.007 |
| Domain 5: Communication About Medicines | 3,769/8,088 (47) | 456/1,143 (40) | 0.001 |
| Domain 6: Discharge Information | 11,331/14,033 (81) | 1,767/2,230 (79) | 0.09 |
| Domain 7: Hospital Environment | 6,981/14,687 (48) | 1,093/2,451 (45) | 0.007 |
| Overall rating | 10,708/14,996 (71) | 1,695/2,513 (67) | 0.001 |
The high‐risk subset was under‐represented in those who completed the HCAHPS survey with 7% (2513/36,280) completing surveys compared to 13% of low‐risk patients (14,996/111,600) (P 0.0001). Moreover, compared to high‐risk patients who were alive at discharge but did not complete surveys, high‐risk survey respondents were less likely to die within 30 days (16/2513 = 0.64% vs 5885/33,767 = 17.4%, P 0.0001), and less likely to be readmitted (424/2513 = 16.9% vs 7527/33,767 = 22.3%, P 0.0001).
On average, high‐risk respondents (compared to low risk) were slightly less likely to be female (52.4% vs 57.9%), less educated (30.6% with some college vs 42.3%), less likely to have been on a surgical service (13.8% vs 42.5%), and less likely to report good or better health (49.0% vs 68.0%, all P 0.0001). High‐risk respondents were also older (76.6 vs 63.1 years), stayed in the hospital longer (4.6 vs 3.5 days), and received care from more specialties (2.2 vs 1.7 specialties) (all P 0.0001). High‐risk respondents experienced more 30‐day readmissions (16.9% vs 8.1%) and deaths within 30 days (0.6 % vs 0.1 %, all P 0.0001) than their low‐risk counterparts.
High‐risk respondents were less likely to provide the most favorable response (unadjusted) for all HCAHPS domains compared to low‐risk respondents, although the difference was not significant for discharge information (Table 1, Figure 2A). The gradient between high‐risk and low‐risk patients was seen for all domains within each hospital except for pain management, hospital environment, and overall rating (Figure 3).
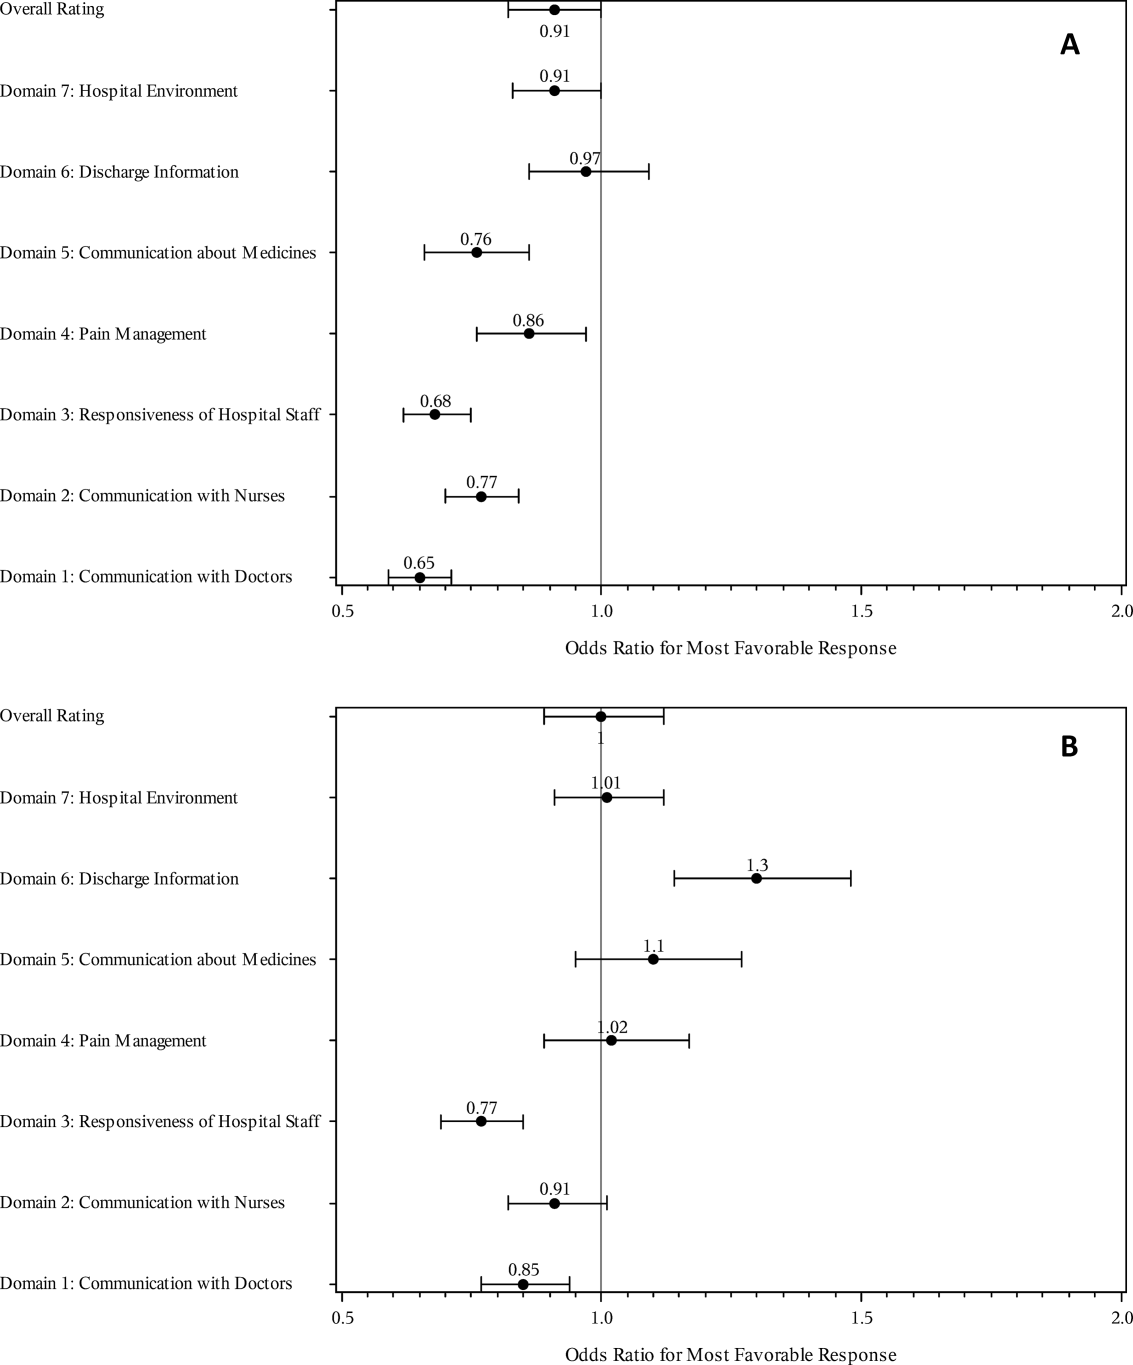
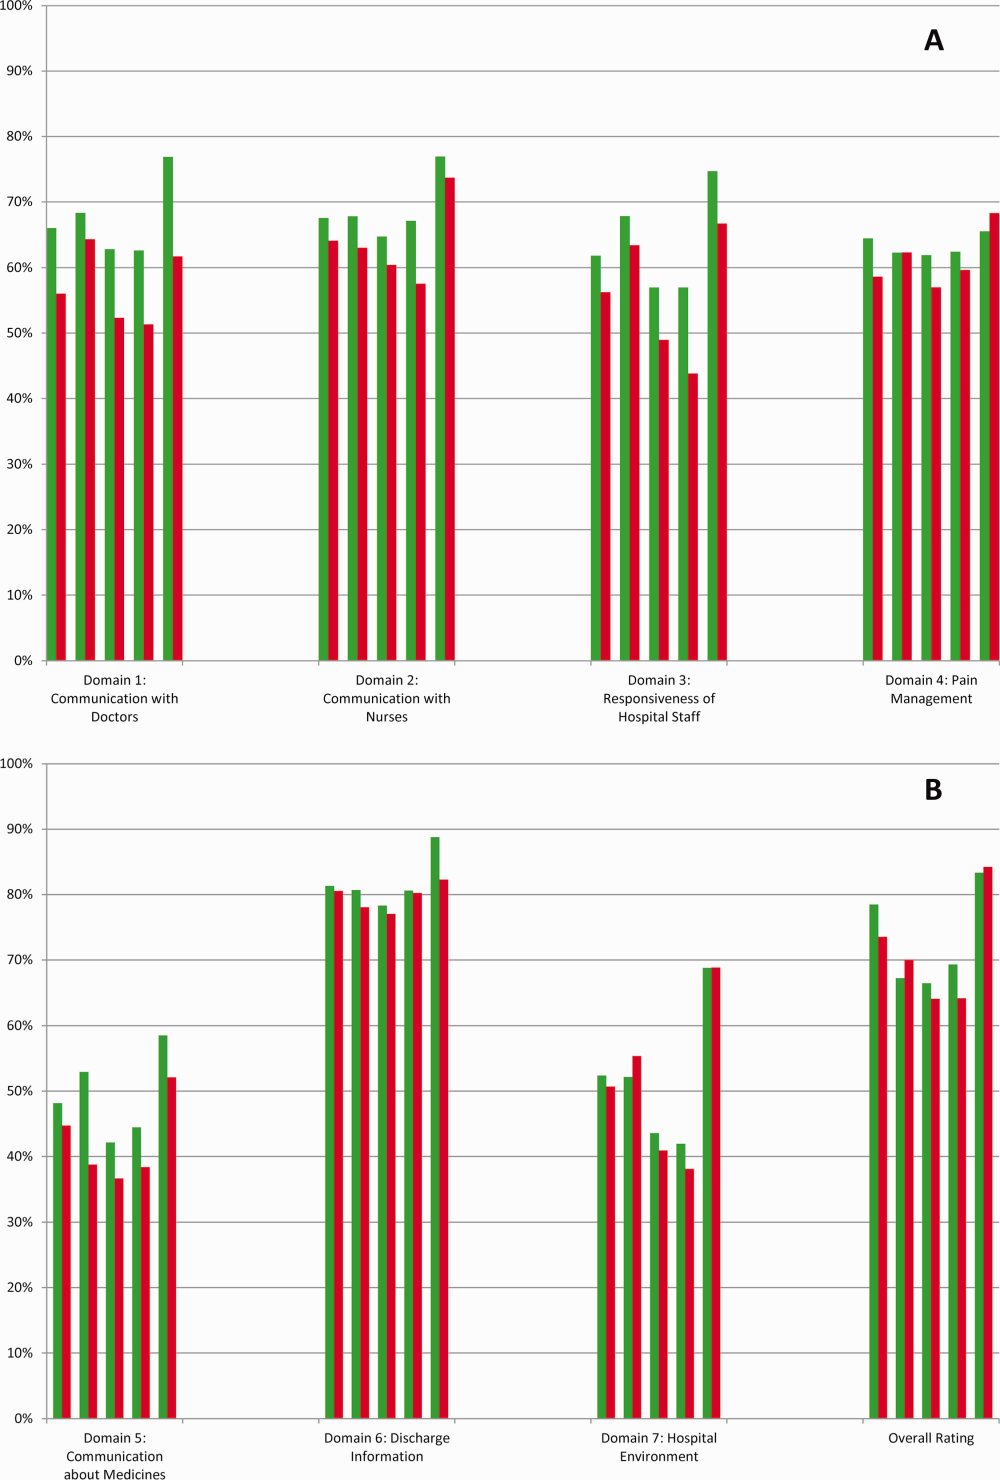
The multivariable regression models examined whether the mortality risk on admission simply represented older medical patients and/or those who considered themselves unhealthy (Figure 2B) (see Supporting Table 1 in the online version of this article). Accounting for hospital, age, gender, language, self‐reported health, educational level, service line, and days elapsed from discharge, respondents in the high‐mortality‐risk stratum were still less likely to report an always experience for doctor communication (OR: 0.85; 95% confidence interval [CI]: 0.77‐0.94) and responsiveness of hospital staff (OR: 0.77; 95% CI: 0.69‐0.85). Higher‐risk patients also tended to have less favorable experiences with nursing communication, although the CI crossed 1 (OR: 0.91; 95% CI: 0.82‐1.01). In contrast, higher‐risk patients were more likely to provide top box responses for having received discharge information (OR: 1.30; 95% CI: 1.14‐1.48). We did not find independent associations between mortality risk and the other domains when the patient risk‐adjustment factors were considered.[18, 19, 20, 21]
DISCUSSION
The high‐mortality‐risk stratum on admission contained a subset of patients who provided less favorable responses for almost all incentivized HCAHPS domains when other risk‐adjustment variables were not taken into consideration (Figure 2A). These univariate relationships weakened when we controlled for gender, the standard HCAHPS risk‐adjustment variables, and individual hospital influences (Figure 2B).[18, 19, 20, 21] After multivariable adjustment, survey respondents in the high‐risk category remained less likely to report their physicians always communicated well and to experience hospital staff responding quickly, but were more likely to report receiving discharge information. We did not find an independent association between the underlying mortality risk and the other incentivized HCAHPS domains after risk adjustment.
We are cautious with initial interpretations of our findings in light of the relatively small number of hospitals studied and the substantial survey response bias of healthier patients. Undoubtedly, the CMS exclusions of patients discharged to hospice or skilled nursing facilities provide a partial explanation for the selection bias, but the experience of those at high risk who did not complete surveys remains conjecture at this point.[14] Previous evidence suggests sicker patients and those with worse experiences are less likely to respond to the HCAHPS survey.[18, 22] On the other hand, it is possible that high‐risk nonrespondents who died could have received better communication and staff responsiveness.[23, 24] We were unable to find a previous, patient‐level study that explicitly tested the association between the admission mortality risk and the subsequent patient experience, yet our findings are consistent with a previous single‐site study of a surgical population showing lower overall ratings from patients with higher Injury Severity Scores.[25]
Our findings provide evidence of complex relationships among admission mortality risk, the 3 domains of the patient experience, and adverse outcomes, at least within the study hospitals (Figure 1). The developing field of palliative care has found very ill patients have special communication needs regarding goals of care, as well as physical symptoms, anxiety, and depression that might prompt more calls for help.[26] If these needs were more important for high‐risk compared to low‐risk patients, and were either not recognized or adequately addressed by the clinical teams at the study hospitals, then the high‐risk patients may have been less likely to perceive their physicians listened and explained things well, or that staff responded promptly to their requests for help.[27] On the other hand, the higher ratings for discharge information suggest the needs of the high‐risk patients were relatively easier to address by current practices at these hospitals. The lack of association between the mortality risk and the other HCAHPS domains may reflect the relatively stronger influence of age, gender, educational level, provider variability, and other unmeasured influences within the study sites, or that the level of patient need was similar among high‐risk and low‐risk patients within these domains.[27]
There are several possible confounders of our observed relationship between mortality risk and HCAHPS scores. The first category of confounders represents patient level variables that might impact the communication scores, some of which are part of the formula of our mortality prediction rule, for example, cognitive impairment and emergent admission.[18, 22, 27] The effect of the mortality risk could also be confounded by unmeasured patient‐level factors such as lower socioeconomic status.[28] A second category of confounders pertains to clinical outcomes and processes of care associated with serious illness irrespective of the risk of dying. More physicians involved in the care of the seriously ill (Table 1) may impact the communication scores, due to the larger opportunity for conflicting or confusing information presented to patients and their families.[29] The longer hospital stays, readmissions, and adverse events of the seriously ill may also underlie the apparent association between mortality risk and HCAHPS scores.[8, 9, 10]
Even if we do not understand precisely if and how the mortality risk might be associated with suboptimal physician communication and staff responsiveness, there may still be some value in considering how these possible relationships could be leveraged to improve patient care. We recall Berwick's insight that every system is perfectly designed to achieve the results it achieves.[7] We have previously argued for the use of mortality‐risk strata to initiate concurrent, multidisciplinary care processes to reduce adverse outcomes.[12, 13] Others have used risk‐based approaches for anticipating clinical deterioration of surgical patients, and determining the intensity of individualized case management services.[30, 31] In this framework, all patients receive a standard set of care processes, but higher‐risk patients receive additional efforts to promote better outcomes. An efficient extension of this approach is to assume patients at risk for adverse outcomes also have additional needs for communication, coordination of specialty care, and timely response to the call button. The admission mortality risk could be used as a determinant for the level of nurse staffing to reduce deaths plus shorten response time to the call button.[32, 33] Hospitalists and specialists could work together on a standard way to conference among themselves for high‐risk patients above that needed for less‐complex cases. Patients in the high‐risk strata could be screened early to see if they might benefit from the involvement of the palliative care team.[26]
Our study has limitations in addition to those already noted. First, our use of the top box as the formulation of the outcome of interest could be challenged. We chose this to be relevant to the Value‐Based Purchasing environment, but other formulations or use of other survey instruments may be needed to tease out the complex relationships we hypothesize. Next, we do not know the extent to which the patients and care processes reflected in our study represent other settings. The literature indicates some hospitals are more effective in providing care for certain subgroups of patients than for others, and that there is substantial regional variation in care intensity that is in turn associated with the patient experience.[29, 34] The mortality‐risk experience relationship for nonstudy hospitals could be weaker or stronger than what we found. Third, many hospitals may not have the capability to generate mortality scores on admission, although more hospitals may be able to do so in the future.[35] Explicit risk strata have the benefit of providing members of the multidisciplinary team with a quick preview of the clinical needs and prognoses of patients in much the way that the term baroque alerts the audience to the genre of music. Still, clinicians in any hospital could attempt to improve outcomes and experience through the use of informal risk assessment during interdisciplinary care rounds or by simply asking the team if they would be surprised if this patient died in the next year.[30, 36] Finally, we do not know if awareness of an experience risk will identify remediable practices that actually improve the experience. Clearly, future studies are needed to answer all of these concerns.
We have provided evidence that a group of patients who were at elevated risk for dying at the time of admission were more likely to have issues with physician communication and staff responsiveness than their lower‐risk counterparts. While we await future studies to confirm these findings, clinical teams can consider whether or not their patients' HCAHPS scores reflect how their system of care addresses the needs of these vulnerable people.
Acknowledgements
The authors thank Steven Lewis for assistance in the interpretation of the HCAHPS scores, Bonita Singal, MD, PhD, for initial statistical consultation, and Frank Smith, MD, for reviewing an earlier version of the manuscript. The authors acknowledge the input of the peer reviewers.
Disclosures: Dr. Cowen and Mr. Kabara had full access to all of the data in the study and take responsibility for the integrity of the data and the accuracy of the data analysis. Study concept and design: all authors. Acquisition, analysis or interpretation of data: all authors. Drafting of the manuscript: Dr. Cowen and Mr. Kabara. Critical revision of the manuscript for important intellectual content: all authors. Statistical analysis: Dr. Cowen and Mr. Kabara. Administrative, technical or material support: Ms. Czerwinski. Study supervision: Dr. Cowen and Ms. Czerwinski. Funding/support: internal. Conflicts of interest disclosures: no potential conflicts reported.
Disclosures
Dr. Cowen and Mr. Kabara had full access to all of the data in the study and take responsibility for the integrity of the data and the accuracy of the data analysis. Study concept and design: all authors. Acquisition, analysis or interpretation of data: all authors. Drafting of the manuscript: Dr. Cowen and Mr. Kabara. Critical revision of the manuscript for important intellectual content: all authors. Statistical analysis: Dr. Cowen and Mr. Kabara. Administrative, technical or material support: Ms. Czerwinski. Study supervision: Dr. Cowen and Ms. Czerwinski. Funding/support: internal. Conflicts of interest disclosures: no potential conflicts reported.
- , , , , . Measuring hospital care from the patients' perspective: an overview of the CAHPS hospital survey development process. Health Serv Res. 2005;40 (6 part 2):1977–1995.
- Centers for Medicare 79(163):49854–50449.
- , , , . The relationship between patients' perception of care and measures of hospital quality and safety. Health Serv Res. 2010;45(4):1024–1040.
- Centers for Medicare 312(7031):619–622.
- , , , , . Relationship between patient satisfaction with inpatient care and hospital readmission within 30 days. Am J Manag Care. 2011;17(1):41–48.
- , , , , , . Getting satisfaction: drivers of surgical Hospital Consumer Assessment of Health care Providers and Systems survey scores. J Surg Res. 2015;197(1):155–161.
- , , . Patient satisfaction and quality of surgical care in US hospitals. Ann Surg. 2015;261(1):2–8.
- , , . Is there a relationship between patient satisfaction and favorable outcomes? Ann Surg. 2014;260(4):592–598; discussion 598–600.
- , , , , . Mortality predictions on admission as a context for organizing care activities. J Hosp Med. 2013;8(5):229–235.
- , , , et al. Implementation of a mortality prediction rule for real‐time decision making: feasibility and validity. J Hosp Med. 2014;9(11):720–726.
- Centers for Medicare 40(6 pt 2):2078–2095.
- Centers for Medicare 44(2 pt 1):501–518.
- Patient‐mix coefficients for October 2015 (1Q14 through 4Q14 discharges) publicly reported HCAHPS Results. Available at: http://www.hcahpsonline.org/Files/October_2015_PMA_Web_Document_a.pdf. Published July 2, 2015. Accessed August 4, 2015.
- , , , , . Case‐mix adjustment of the CAHPS hospital survey. Health Serv Res. 2005;40(6):2162–2181.
- , , , et.al. Gender differences in patients' perceptions of inpatient care. Health Serv Res. 2012;47(4):1482–1501.
- , , , et al. Patterns of unit and item nonresponse in the CAHPS hospital survey. Health Serv Res. 2005;40(6 pt 2):2096–2119.
- , , , . The cost of satisfaction: a national study of patient satisfaction, health care utilization, expenditures, and mortality. Arch Intern Med. 2012;172(5):405–411.
- , , , et al. Care experiences of managed care Medicare enrollees near the end of life. J Am Geriatr Soc. 2013;61(3):407–412.
- , , , , . Measuring satisfaction: factors that drive hospital consumer assessment of healthcare providers and systems survey responses in a trauma and acute care surgery population. Am Surg. 2015;81(5):537–543.
- , . Palliative care for the seriously ill. N Engl J Med. 2015;373(8):747–755.
- , , , et.al. Components of care vary in importance for overall patient‐reported experience by type of hospitalization. Med Care. 2009;47(8):842–849.
- , , , et al. Socioeconomic status, structural and functional measures of social support, and mortality: the British Whitehall II cohort study, 1985–2009. Am J Epidemiol. 2012;175(12):1275–1283.
- , , , et al. Inpatient care intensity and patients' ratings of their hospital experiences. Health Aff (Millwood). 2009;28(1):103–112.
- , , , et al. A validated value‐based model to improve hospital‐wide perioperative outcomes. Ann Surg. 2010;252(3):486–498.
- , , , et al. Allocating scare resources in real‐time to reduce heart failure readmissions: a prospective, controlled study. BMJ Qual Saf. 2013;22(12):998–1005.
- , , , . Patients' perception of hospital care in the United States. N Engl J Med. 2008;359(18):1921–1931.
- , , , , , . Nurse staffing and inpatient hospital mortality. N Engl J Med. 2011;364(11):1037–1045.
- , , , et al. Do hospitals rank differently on HCAHPS for different patient subgroups? Med Care Res Rev. 2010;67(1):56–73.
- , , , , , . Risk‐adjusting hospital inpatient mortality using automated inpatient, outpatient, and laboratory databases. Med Care. 2008;46(3):232–239.
- , , , et al. Utility of the “surprise” question to identify dialysis patients with high mortality. Clin J Am Soc Nephrol. 2008;3(5):1379–1384.
Few today deny the importance of the Hospital Consumer Assessment of Healthcare Providers and Systems (HCAHPS) survey.[1, 2] The Centers for Medicare and Medicaid Services' (CMS) Value Based Purchasing incentive, sympathy for the ill, and relationships between the patient experience and quality of care provide sufficient justification.[3, 4] How to improve the experience scores is not well understood. The national scores have improved only modestly over the past 3 years.[5, 6]
Clinicians may not typically compartmentalize what they do to improve outcomes versus the patient experience. A possible source for new improvement strategies is to understand the types of patients in which both adverse outcomes and suboptimal experiences are likely to occur, then redesign the multidisciplinary care processes to address both concurrently.[7] Previous studies support the existence of a relationship between a higher mortality risk on admission and subsequent worse outcomes, as well as a relationship between worse outcomes and lower HCAHPS scores.[8, 9, 10, 11, 12, 13] We hypothesized the mortality risk on admission, patient experience, and outcomes might share a triad relationship (Figure 1). In this article we explore the third edge of this triangle, the association between the mortality risk on admission and the subsequent patient experience.
METHODS
We studied HCAHPS from 5 midwestern US hospitals having 113, 136, 304, 443, and 537 licensed beds, affiliated with the same multistate healthcare system. HCAHPS telephone surveys were administered via a vendor to a random sample of inpatients 18 years of age or older discharged from January 1, 2012 through June 30, 2014. Per CMS guidelines, surveyed patients must have been discharged alive after a hospital stay of at least 1 night.[14] Patients ineligible to be surveyed included those discharged to skilled nursing facilities or hospice care.[14] Because not all study hospitals provided obstetrical services, we restricted the analyses to medical and surgical respondents. With the permission of the local institutional review board, subjects' survey responses were linked confidentially to their clinical data.
We focused on the 8 dimensions of the care experience used in the CMS Value Based Purchasing program: communication with doctors, communication with nurses, responsiveness of hospital staff, pain management, communication about medicines, discharge information, hospital environment, and an overall rating of the hospital.[2] Following the scoring convention for publicly reported results, we dichotomized the 4‐level Likert scales into the most favorable response possible (always) versus all other responses.[15] Similarly we dichotomized the hospital rating scale at 9 and above for the most favorable response.
Our unit of analysis was an individual hospitalization. Our primary outcome of interest was whether or not the respondent provided the most favorable response for all questions answered within a given domain. For example, for the physician communication domain, the patient must have answered always to each of the 3 questions answered within the domain. This approach is appropriate for learning which patient‐level factors influence the survey responses, but differs from that used for the publically reported domain scores for which the relative performance of hospitals is the focus.[16] For the latter, the hospital was the unit of analysis, and the domain score was basically the average of the percentages of top box scores for the questions within a domain. For example, if 90% respondents from a hospital provided a top box response for courtesy, 80% for listening, and 70% for explanation, the hospital's physician communication score would be (90 + 80 + 70)/3 = 80%.[17]
Our primary explanatory variable was a binary high versus low mortality‐risk status of the respondent on admission based on age, gender, prior hospitalizations, clinical laboratory values, and diagnoses present on admission.[12] The calculated mortality risk was then dichotomized prior to the analysis at a probability of dying equal to 0.07 or higher. This corresponded roughly to the top quintile of predicted risk found in prior studies.[12, 13] During the study period, only 2 of the hospitals had the capability of generating mortality scores in real time, so for this study the mortality risk was calculated retrospectively, using information deemed present on admission.[12]
To estimate the sample size, we assumed that the high‐risk strata contained approximately 13% of respondents, and that the true percent of top box responses from patients in the lower‐risk stratum was approximately 80% for each domain. A meaningful difference in the proportion of most favorable responses was considered as an odds ratio (OR) of 0.75 for high risk versus low risk. A significance level of P 0.003 was set to control study‐wide type I error due to multiple comparisons. We determined that for each dimension, approximately 8583 survey responses would be required for low‐risk patients and approximately 1116 responses for high‐risk patients to achieve 80% power under these assumptions. We were able to accrue the target number of surveys for all but 3 domains (pain management, communication about medicines, and hospital environment) because of data availability, and because patients are allowed to skip questions that do not apply. Univariate relationships were examined with 2, t test, and Fisher exact tests where indicated. Generalized linear mixed regression models with a logit link were fit to determine the association between patient mortality risk and the top box experience for each of the HCAHPS domains and for the overall rating. The patient's hospital was considered a random intercept to account for the patient‐hospital hierarchy and the unmeasured hospital‐specific practices. The multivariable models controlled for gender plus the HCAHPS patient‐mix adjustment variables of age, education, self‐rated health, language spoken at home, service line, and the number of days elapsed between the date of discharge and date of the survey.[18, 19, 20, 21] In keeping with the industry analyses, a second order interaction variable was included between surgery patients and age.[19] We considered the potential collinearity between the mortality risk status, age, and patient self‐reported health. We found the variance inflation factors were small, so we drew inference from the full multivariable model.
We also performed a post hoc sensitivity analysis to determine if our conclusions were biased due to missing patient responses for the risk‐adjustment variables. Accordingly, we imputed the response level most negatively associated with most HCAHPS domains as previously reported and reran the multivariable models.[19] We did not find a meaningful change in our conclusions (see Supporting Figure 1 in the online version of this article).
RESULTS
The hospitals discharged 152,333 patients during the study period, 39,905 of whom (26.2 %) had a predicted 30‐day mortality risk greater or equal to 0.07 (Table 1). Of the 36,280 high‐risk patients discharged alive, 5901 (16.3%) died in the ensuing 30 days, and 7951 (22%) were readmitted.
| Characteristic | Low‐Risk Stratum, No./Discharged (%) or Mean (SD) | High‐Risk Stratum, No./Discharged (%) or Mean (SD) | P Value* |
|---|---|---|---|
| |||
| Total discharges (row percent) | 112,428/152,333 (74) | 39,905/152,333 (26) | 0.001 |
| Total alive discharges (row percent) | 111,600/147,880 (75) | 36,280/147,880 (25) | 0.001 |
| No. of respondents (row percent) | 14,996/17,509 (86) | 2,513/17,509 (14) | |
| HCAHPS surveys completed | 14,996/111,600 (13) | 2,513/36,280 (7) | 0.001 |
| Readmissions within 30 days (total discharges) | 12,311/112,428 (11) | 7,951/39,905 (20) | 0.001 |
| Readmissions within 30 days (alive discharges) | 12,311/111,600 (11) | 7,951/36,280 (22) | 0.001 |
| Readmissions within 30 days (respondents) | 1,220/14,996 (8) | 424/2,513 (17) | 0.001 |
| Mean predicted probability of 30‐day mortality (total discharges) | 0.022 (0.018) | 0.200 (0.151) | 0.001 |
| Mean predicted probability of 30‐day mortality (alive discharges) | 0.022 (0.018) | 0.187 (0.136) | 0.001 |
| Mean predicted probability of 30‐day mortality (respondents) | 0.020 (0.017) | 0.151 (0.098) | 0.001 |
| In‐hospital death (total discharges) | 828/112,428 (0.74) | 3,625/39,905 (9) | 0.001 |
| Mortality within 30 days (total discharges) | 2,455/112,428 (2) | 9,526/39,905 (24) | 0.001 |
| Mortality within 30 days (alive discharges) | 1,627/111,600 (1.5) | 5,901/36,280 (16) | 0.001 |
| Mortality within 30 days (respondents) | 9/14,996 (0.06) | 16/2,513 (0.64) | 0.001 |
| Female (total discharges) | 62,681/112,368 (56) | 21,058/39,897 (53) | 0.001 |
| Female (alive discharges) | 62,216/111,540 (56) | 19,164/36,272 (53) | 0.001 |
| Female (respondents) | 8,684/14,996 (58) | 1,318/2,513 (52) | 0.001 |
| Age (total discharges) | 61.3 (16.8) | 78.3 (12.5) | 0.001 |
| Age (alive discharges) | 61.2 (16.8) | 78.4 (12.5) | 0.001 |
| Age (respondents) | 63.1 (15.2) | 76.6 (11.5) | 0.001 |
| Highest education attained | |||
| 8th grade or less | 297/14,996 (2) | 98/2,513 (4) | |
| Some high school | 1,190/14,996 (8) | 267/2,513 (11) | |
| High school grad | 4,648/14,996 (31) | 930/2,513 (37) | 0.001 |
| Some college | 6,338/14,996 (42) | 768/2,513 (31) | |
| 4‐year college grad | 1,502/14,996 (10) | 183/2,513 (7) | |
| Missing response | 1,021/14,996 (7) | 267/2,513 (11) | |
| Language spoken at home | |||
| English | 13,763/14,996 (92) | 2,208/2,513 (88) | |
| Spanish | 56/14,996 (0.37) | 8/2,513 (0.32) | 0.47 |
| Chinese | 153/14,996 (1) | 31/2,513 (1) | |
| Missing response | 1,024/14,996 (7) | 266/2,513 (11) | |
| Self‐rated health | |||
| Excellent | 1,399/14,996 (9) | 114/2,513 (5) | |
| Very good | 3,916/14,996 (26) | 405/2,513 (16) | |
| Good | 4,861/14,996 (32) | 713/2,513 (28) | |
| Fair | 2,900/14,996 (19) | 652/2,513 (26) | 0.001 |
| Poor | 1,065/14,996 (7) | 396/2,513 (16) | |
| Missing response | 855/14,996 (6) | 233/2,513 (9) | |
| Length of hospitalization, d (respondents) | 3.5 (2.8) | 4.6 (3.6) | 0.001 |
| Consulting specialties (respondents) | 1.7 (1.0) | 2.2 (1.3) | 0.001 |
| Service line | |||
| Surgical | 6,380/14,996 (43) | 346/2,513 (14) | 0.001 |
| Medical | 8,616/14,996 (57) | 2,167/2,513 (86) | |
| HCAHPS | |||
| Domain 1: Communication With Doctors | 9,564/14,731 (65) | 1,339/2,462 (54) | 0.001 |
| Domain 2: Communication With Nurses | 10,097/14,991 (67) | 1,531/2,511 (61) | 0.001 |
| Domain 3: Responsiveness of Hospital Staff | 7,813/12,964 (60) | 1,158/2,277 (51) | 0.001 |
| Domain 4: Pain Management | 6,565/10,424 (63) | 786/1,328 (59) | 00.007 |
| Domain 5: Communication About Medicines | 3,769/8,088 (47) | 456/1,143 (40) | 0.001 |
| Domain 6: Discharge Information | 11,331/14,033 (81) | 1,767/2,230 (79) | 0.09 |
| Domain 7: Hospital Environment | 6,981/14,687 (48) | 1,093/2,451 (45) | 0.007 |
| Overall rating | 10,708/14,996 (71) | 1,695/2,513 (67) | 0.001 |
The high‐risk subset was under‐represented in those who completed the HCAHPS survey with 7% (2513/36,280) completing surveys compared to 13% of low‐risk patients (14,996/111,600) (P 0.0001). Moreover, compared to high‐risk patients who were alive at discharge but did not complete surveys, high‐risk survey respondents were less likely to die within 30 days (16/2513 = 0.64% vs 5885/33,767 = 17.4%, P 0.0001), and less likely to be readmitted (424/2513 = 16.9% vs 7527/33,767 = 22.3%, P 0.0001).
On average, high‐risk respondents (compared to low risk) were slightly less likely to be female (52.4% vs 57.9%), less educated (30.6% with some college vs 42.3%), less likely to have been on a surgical service (13.8% vs 42.5%), and less likely to report good or better health (49.0% vs 68.0%, all P 0.0001). High‐risk respondents were also older (76.6 vs 63.1 years), stayed in the hospital longer (4.6 vs 3.5 days), and received care from more specialties (2.2 vs 1.7 specialties) (all P 0.0001). High‐risk respondents experienced more 30‐day readmissions (16.9% vs 8.1%) and deaths within 30 days (0.6 % vs 0.1 %, all P 0.0001) than their low‐risk counterparts.
High‐risk respondents were less likely to provide the most favorable response (unadjusted) for all HCAHPS domains compared to low‐risk respondents, although the difference was not significant for discharge information (Table 1, Figure 2A). The gradient between high‐risk and low‐risk patients was seen for all domains within each hospital except for pain management, hospital environment, and overall rating (Figure 3).
The multivariable regression models examined whether the mortality risk on admission simply represented older medical patients and/or those who considered themselves unhealthy (Figure 2B) (see Supporting Table 1 in the online version of this article). Accounting for hospital, age, gender, language, self‐reported health, educational level, service line, and days elapsed from discharge, respondents in the high‐mortality‐risk stratum were still less likely to report an always experience for doctor communication (OR: 0.85; 95% confidence interval [CI]: 0.77‐0.94) and responsiveness of hospital staff (OR: 0.77; 95% CI: 0.69‐0.85). Higher‐risk patients also tended to have less favorable experiences with nursing communication, although the CI crossed 1 (OR: 0.91; 95% CI: 0.82‐1.01). In contrast, higher‐risk patients were more likely to provide top box responses for having received discharge information (OR: 1.30; 95% CI: 1.14‐1.48). We did not find independent associations between mortality risk and the other domains when the patient risk‐adjustment factors were considered.[18, 19, 20, 21]
DISCUSSION
The high‐mortality‐risk stratum on admission contained a subset of patients who provided less favorable responses for almost all incentivized HCAHPS domains when other risk‐adjustment variables were not taken into consideration (Figure 2A). These univariate relationships weakened when we controlled for gender, the standard HCAHPS risk‐adjustment variables, and individual hospital influences (Figure 2B).[18, 19, 20, 21] After multivariable adjustment, survey respondents in the high‐risk category remained less likely to report their physicians always communicated well and to experience hospital staff responding quickly, but were more likely to report receiving discharge information. We did not find an independent association between the underlying mortality risk and the other incentivized HCAHPS domains after risk adjustment.
We are cautious with initial interpretations of our findings in light of the relatively small number of hospitals studied and the substantial survey response bias of healthier patients. Undoubtedly, the CMS exclusions of patients discharged to hospice or skilled nursing facilities provide a partial explanation for the selection bias, but the experience of those at high risk who did not complete surveys remains conjecture at this point.[14] Previous evidence suggests sicker patients and those with worse experiences are less likely to respond to the HCAHPS survey.[18, 22] On the other hand, it is possible that high‐risk nonrespondents who died could have received better communication and staff responsiveness.[23, 24] We were unable to find a previous, patient‐level study that explicitly tested the association between the admission mortality risk and the subsequent patient experience, yet our findings are consistent with a previous single‐site study of a surgical population showing lower overall ratings from patients with higher Injury Severity Scores.[25]
Our findings provide evidence of complex relationships among admission mortality risk, the 3 domains of the patient experience, and adverse outcomes, at least within the study hospitals (Figure 1). The developing field of palliative care has found very ill patients have special communication needs regarding goals of care, as well as physical symptoms, anxiety, and depression that might prompt more calls for help.[26] If these needs were more important for high‐risk compared to low‐risk patients, and were either not recognized or adequately addressed by the clinical teams at the study hospitals, then the high‐risk patients may have been less likely to perceive their physicians listened and explained things well, or that staff responded promptly to their requests for help.[27] On the other hand, the higher ratings for discharge information suggest the needs of the high‐risk patients were relatively easier to address by current practices at these hospitals. The lack of association between the mortality risk and the other HCAHPS domains may reflect the relatively stronger influence of age, gender, educational level, provider variability, and other unmeasured influences within the study sites, or that the level of patient need was similar among high‐risk and low‐risk patients within these domains.[27]
There are several possible confounders of our observed relationship between mortality risk and HCAHPS scores. The first category of confounders represents patient level variables that might impact the communication scores, some of which are part of the formula of our mortality prediction rule, for example, cognitive impairment and emergent admission.[18, 22, 27] The effect of the mortality risk could also be confounded by unmeasured patient‐level factors such as lower socioeconomic status.[28] A second category of confounders pertains to clinical outcomes and processes of care associated with serious illness irrespective of the risk of dying. More physicians involved in the care of the seriously ill (Table 1) may impact the communication scores, due to the larger opportunity for conflicting or confusing information presented to patients and their families.[29] The longer hospital stays, readmissions, and adverse events of the seriously ill may also underlie the apparent association between mortality risk and HCAHPS scores.[8, 9, 10]
Even if we do not understand precisely if and how the mortality risk might be associated with suboptimal physician communication and staff responsiveness, there may still be some value in considering how these possible relationships could be leveraged to improve patient care. We recall Berwick's insight that every system is perfectly designed to achieve the results it achieves.[7] We have previously argued for the use of mortality‐risk strata to initiate concurrent, multidisciplinary care processes to reduce adverse outcomes.[12, 13] Others have used risk‐based approaches for anticipating clinical deterioration of surgical patients, and determining the intensity of individualized case management services.[30, 31] In this framework, all patients receive a standard set of care processes, but higher‐risk patients receive additional efforts to promote better outcomes. An efficient extension of this approach is to assume patients at risk for adverse outcomes also have additional needs for communication, coordination of specialty care, and timely response to the call button. The admission mortality risk could be used as a determinant for the level of nurse staffing to reduce deaths plus shorten response time to the call button.[32, 33] Hospitalists and specialists could work together on a standard way to conference among themselves for high‐risk patients above that needed for less‐complex cases. Patients in the high‐risk strata could be screened early to see if they might benefit from the involvement of the palliative care team.[26]
Our study has limitations in addition to those already noted. First, our use of the top box as the formulation of the outcome of interest could be challenged. We chose this to be relevant to the Value‐Based Purchasing environment, but other formulations or use of other survey instruments may be needed to tease out the complex relationships we hypothesize. Next, we do not know the extent to which the patients and care processes reflected in our study represent other settings. The literature indicates some hospitals are more effective in providing care for certain subgroups of patients than for others, and that there is substantial regional variation in care intensity that is in turn associated with the patient experience.[29, 34] The mortality‐risk experience relationship for nonstudy hospitals could be weaker or stronger than what we found. Third, many hospitals may not have the capability to generate mortality scores on admission, although more hospitals may be able to do so in the future.[35] Explicit risk strata have the benefit of providing members of the multidisciplinary team with a quick preview of the clinical needs and prognoses of patients in much the way that the term baroque alerts the audience to the genre of music. Still, clinicians in any hospital could attempt to improve outcomes and experience through the use of informal risk assessment during interdisciplinary care rounds or by simply asking the team if they would be surprised if this patient died in the next year.[30, 36] Finally, we do not know if awareness of an experience risk will identify remediable practices that actually improve the experience. Clearly, future studies are needed to answer all of these concerns.
We have provided evidence that a group of patients who were at elevated risk for dying at the time of admission were more likely to have issues with physician communication and staff responsiveness than their lower‐risk counterparts. While we await future studies to confirm these findings, clinical teams can consider whether or not their patients' HCAHPS scores reflect how their system of care addresses the needs of these vulnerable people.
Acknowledgements
The authors thank Steven Lewis for assistance in the interpretation of the HCAHPS scores, Bonita Singal, MD, PhD, for initial statistical consultation, and Frank Smith, MD, for reviewing an earlier version of the manuscript. The authors acknowledge the input of the peer reviewers.
Disclosures: Dr. Cowen and Mr. Kabara had full access to all of the data in the study and take responsibility for the integrity of the data and the accuracy of the data analysis. Study concept and design: all authors. Acquisition, analysis or interpretation of data: all authors. Drafting of the manuscript: Dr. Cowen and Mr. Kabara. Critical revision of the manuscript for important intellectual content: all authors. Statistical analysis: Dr. Cowen and Mr. Kabara. Administrative, technical or material support: Ms. Czerwinski. Study supervision: Dr. Cowen and Ms. Czerwinski. Funding/support: internal. Conflicts of interest disclosures: no potential conflicts reported.
Disclosures
Dr. Cowen and Mr. Kabara had full access to all of the data in the study and take responsibility for the integrity of the data and the accuracy of the data analysis. Study concept and design: all authors. Acquisition, analysis or interpretation of data: all authors. Drafting of the manuscript: Dr. Cowen and Mr. Kabara. Critical revision of the manuscript for important intellectual content: all authors. Statistical analysis: Dr. Cowen and Mr. Kabara. Administrative, technical or material support: Ms. Czerwinski. Study supervision: Dr. Cowen and Ms. Czerwinski. Funding/support: internal. Conflicts of interest disclosures: no potential conflicts reported.
Few today deny the importance of the Hospital Consumer Assessment of Healthcare Providers and Systems (HCAHPS) survey.[1, 2] The Centers for Medicare and Medicaid Services' (CMS) Value Based Purchasing incentive, sympathy for the ill, and relationships between the patient experience and quality of care provide sufficient justification.[3, 4] How to improve the experience scores is not well understood. The national scores have improved only modestly over the past 3 years.[5, 6]
Clinicians may not typically compartmentalize what they do to improve outcomes versus the patient experience. A possible source for new improvement strategies is to understand the types of patients in which both adverse outcomes and suboptimal experiences are likely to occur, then redesign the multidisciplinary care processes to address both concurrently.[7] Previous studies support the existence of a relationship between a higher mortality risk on admission and subsequent worse outcomes, as well as a relationship between worse outcomes and lower HCAHPS scores.[8, 9, 10, 11, 12, 13] We hypothesized the mortality risk on admission, patient experience, and outcomes might share a triad relationship (Figure 1). In this article we explore the third edge of this triangle, the association between the mortality risk on admission and the subsequent patient experience.
METHODS
We studied HCAHPS from 5 midwestern US hospitals having 113, 136, 304, 443, and 537 licensed beds, affiliated with the same multistate healthcare system. HCAHPS telephone surveys were administered via a vendor to a random sample of inpatients 18 years of age or older discharged from January 1, 2012 through June 30, 2014. Per CMS guidelines, surveyed patients must have been discharged alive after a hospital stay of at least 1 night.[14] Patients ineligible to be surveyed included those discharged to skilled nursing facilities or hospice care.[14] Because not all study hospitals provided obstetrical services, we restricted the analyses to medical and surgical respondents. With the permission of the local institutional review board, subjects' survey responses were linked confidentially to their clinical data.
We focused on the 8 dimensions of the care experience used in the CMS Value Based Purchasing program: communication with doctors, communication with nurses, responsiveness of hospital staff, pain management, communication about medicines, discharge information, hospital environment, and an overall rating of the hospital.[2] Following the scoring convention for publicly reported results, we dichotomized the 4‐level Likert scales into the most favorable response possible (always) versus all other responses.[15] Similarly we dichotomized the hospital rating scale at 9 and above for the most favorable response.
Our unit of analysis was an individual hospitalization. Our primary outcome of interest was whether or not the respondent provided the most favorable response for all questions answered within a given domain. For example, for the physician communication domain, the patient must have answered always to each of the 3 questions answered within the domain. This approach is appropriate for learning which patient‐level factors influence the survey responses, but differs from that used for the publically reported domain scores for which the relative performance of hospitals is the focus.[16] For the latter, the hospital was the unit of analysis, and the domain score was basically the average of the percentages of top box scores for the questions within a domain. For example, if 90% respondents from a hospital provided a top box response for courtesy, 80% for listening, and 70% for explanation, the hospital's physician communication score would be (90 + 80 + 70)/3 = 80%.[17]
Our primary explanatory variable was a binary high versus low mortality‐risk status of the respondent on admission based on age, gender, prior hospitalizations, clinical laboratory values, and diagnoses present on admission.[12] The calculated mortality risk was then dichotomized prior to the analysis at a probability of dying equal to 0.07 or higher. This corresponded roughly to the top quintile of predicted risk found in prior studies.[12, 13] During the study period, only 2 of the hospitals had the capability of generating mortality scores in real time, so for this study the mortality risk was calculated retrospectively, using information deemed present on admission.[12]
To estimate the sample size, we assumed that the high‐risk strata contained approximately 13% of respondents, and that the true percent of top box responses from patients in the lower‐risk stratum was approximately 80% for each domain. A meaningful difference in the proportion of most favorable responses was considered as an odds ratio (OR) of 0.75 for high risk versus low risk. A significance level of P 0.003 was set to control study‐wide type I error due to multiple comparisons. We determined that for each dimension, approximately 8583 survey responses would be required for low‐risk patients and approximately 1116 responses for high‐risk patients to achieve 80% power under these assumptions. We were able to accrue the target number of surveys for all but 3 domains (pain management, communication about medicines, and hospital environment) because of data availability, and because patients are allowed to skip questions that do not apply. Univariate relationships were examined with 2, t test, and Fisher exact tests where indicated. Generalized linear mixed regression models with a logit link were fit to determine the association between patient mortality risk and the top box experience for each of the HCAHPS domains and for the overall rating. The patient's hospital was considered a random intercept to account for the patient‐hospital hierarchy and the unmeasured hospital‐specific practices. The multivariable models controlled for gender plus the HCAHPS patient‐mix adjustment variables of age, education, self‐rated health, language spoken at home, service line, and the number of days elapsed between the date of discharge and date of the survey.[18, 19, 20, 21] In keeping with the industry analyses, a second order interaction variable was included between surgery patients and age.[19] We considered the potential collinearity between the mortality risk status, age, and patient self‐reported health. We found the variance inflation factors were small, so we drew inference from the full multivariable model.
We also performed a post hoc sensitivity analysis to determine if our conclusions were biased due to missing patient responses for the risk‐adjustment variables. Accordingly, we imputed the response level most negatively associated with most HCAHPS domains as previously reported and reran the multivariable models.[19] We did not find a meaningful change in our conclusions (see Supporting Figure 1 in the online version of this article).
RESULTS
The hospitals discharged 152,333 patients during the study period, 39,905 of whom (26.2 %) had a predicted 30‐day mortality risk greater or equal to 0.07 (Table 1). Of the 36,280 high‐risk patients discharged alive, 5901 (16.3%) died in the ensuing 30 days, and 7951 (22%) were readmitted.
| Characteristic | Low‐Risk Stratum, No./Discharged (%) or Mean (SD) | High‐Risk Stratum, No./Discharged (%) or Mean (SD) | P Value* |
|---|---|---|---|
| |||
| Total discharges (row percent) | 112,428/152,333 (74) | 39,905/152,333 (26) | 0.001 |
| Total alive discharges (row percent) | 111,600/147,880 (75) | 36,280/147,880 (25) | 0.001 |
| No. of respondents (row percent) | 14,996/17,509 (86) | 2,513/17,509 (14) | |
| HCAHPS surveys completed | 14,996/111,600 (13) | 2,513/36,280 (7) | 0.001 |
| Readmissions within 30 days (total discharges) | 12,311/112,428 (11) | 7,951/39,905 (20) | 0.001 |
| Readmissions within 30 days (alive discharges) | 12,311/111,600 (11) | 7,951/36,280 (22) | 0.001 |
| Readmissions within 30 days (respondents) | 1,220/14,996 (8) | 424/2,513 (17) | 0.001 |
| Mean predicted probability of 30‐day mortality (total discharges) | 0.022 (0.018) | 0.200 (0.151) | 0.001 |
| Mean predicted probability of 30‐day mortality (alive discharges) | 0.022 (0.018) | 0.187 (0.136) | 0.001 |
| Mean predicted probability of 30‐day mortality (respondents) | 0.020 (0.017) | 0.151 (0.098) | 0.001 |
| In‐hospital death (total discharges) | 828/112,428 (0.74) | 3,625/39,905 (9) | 0.001 |
| Mortality within 30 days (total discharges) | 2,455/112,428 (2) | 9,526/39,905 (24) | 0.001 |
| Mortality within 30 days (alive discharges) | 1,627/111,600 (1.5) | 5,901/36,280 (16) | 0.001 |
| Mortality within 30 days (respondents) | 9/14,996 (0.06) | 16/2,513 (0.64) | 0.001 |
| Female (total discharges) | 62,681/112,368 (56) | 21,058/39,897 (53) | 0.001 |
| Female (alive discharges) | 62,216/111,540 (56) | 19,164/36,272 (53) | 0.001 |
| Female (respondents) | 8,684/14,996 (58) | 1,318/2,513 (52) | 0.001 |
| Age (total discharges) | 61.3 (16.8) | 78.3 (12.5) | 0.001 |
| Age (alive discharges) | 61.2 (16.8) | 78.4 (12.5) | 0.001 |
| Age (respondents) | 63.1 (15.2) | 76.6 (11.5) | 0.001 |
| Highest education attained | |||
| 8th grade or less | 297/14,996 (2) | 98/2,513 (4) | |
| Some high school | 1,190/14,996 (8) | 267/2,513 (11) | |
| High school grad | 4,648/14,996 (31) | 930/2,513 (37) | 0.001 |
| Some college | 6,338/14,996 (42) | 768/2,513 (31) | |
| 4‐year college grad | 1,502/14,996 (10) | 183/2,513 (7) | |
| Missing response | 1,021/14,996 (7) | 267/2,513 (11) | |
| Language spoken at home | |||
| English | 13,763/14,996 (92) | 2,208/2,513 (88) | |
| Spanish | 56/14,996 (0.37) | 8/2,513 (0.32) | 0.47 |
| Chinese | 153/14,996 (1) | 31/2,513 (1) | |
| Missing response | 1,024/14,996 (7) | 266/2,513 (11) | |
| Self‐rated health | |||
| Excellent | 1,399/14,996 (9) | 114/2,513 (5) | |
| Very good | 3,916/14,996 (26) | 405/2,513 (16) | |
| Good | 4,861/14,996 (32) | 713/2,513 (28) | |
| Fair | 2,900/14,996 (19) | 652/2,513 (26) | 0.001 |
| Poor | 1,065/14,996 (7) | 396/2,513 (16) | |
| Missing response | 855/14,996 (6) | 233/2,513 (9) | |
| Length of hospitalization, d (respondents) | 3.5 (2.8) | 4.6 (3.6) | 0.001 |
| Consulting specialties (respondents) | 1.7 (1.0) | 2.2 (1.3) | 0.001 |
| Service line | |||
| Surgical | 6,380/14,996 (43) | 346/2,513 (14) | 0.001 |
| Medical | 8,616/14,996 (57) | 2,167/2,513 (86) | |
| HCAHPS | |||
| Domain 1: Communication With Doctors | 9,564/14,731 (65) | 1,339/2,462 (54) | 0.001 |
| Domain 2: Communication With Nurses | 10,097/14,991 (67) | 1,531/2,511 (61) | 0.001 |
| Domain 3: Responsiveness of Hospital Staff | 7,813/12,964 (60) | 1,158/2,277 (51) | 0.001 |
| Domain 4: Pain Management | 6,565/10,424 (63) | 786/1,328 (59) | 00.007 |
| Domain 5: Communication About Medicines | 3,769/8,088 (47) | 456/1,143 (40) | 0.001 |
| Domain 6: Discharge Information | 11,331/14,033 (81) | 1,767/2,230 (79) | 0.09 |
| Domain 7: Hospital Environment | 6,981/14,687 (48) | 1,093/2,451 (45) | 0.007 |
| Overall rating | 10,708/14,996 (71) | 1,695/2,513 (67) | 0.001 |
The high‐risk subset was under‐represented in those who completed the HCAHPS survey with 7% (2513/36,280) completing surveys compared to 13% of low‐risk patients (14,996/111,600) (P 0.0001). Moreover, compared to high‐risk patients who were alive at discharge but did not complete surveys, high‐risk survey respondents were less likely to die within 30 days (16/2513 = 0.64% vs 5885/33,767 = 17.4%, P 0.0001), and less likely to be readmitted (424/2513 = 16.9% vs 7527/33,767 = 22.3%, P 0.0001).
On average, high‐risk respondents (compared to low risk) were slightly less likely to be female (52.4% vs 57.9%), less educated (30.6% with some college vs 42.3%), less likely to have been on a surgical service (13.8% vs 42.5%), and less likely to report good or better health (49.0% vs 68.0%, all P 0.0001). High‐risk respondents were also older (76.6 vs 63.1 years), stayed in the hospital longer (4.6 vs 3.5 days), and received care from more specialties (2.2 vs 1.7 specialties) (all P 0.0001). High‐risk respondents experienced more 30‐day readmissions (16.9% vs 8.1%) and deaths within 30 days (0.6 % vs 0.1 %, all P 0.0001) than their low‐risk counterparts.
High‐risk respondents were less likely to provide the most favorable response (unadjusted) for all HCAHPS domains compared to low‐risk respondents, although the difference was not significant for discharge information (Table 1, Figure 2A). The gradient between high‐risk and low‐risk patients was seen for all domains within each hospital except for pain management, hospital environment, and overall rating (Figure 3).
The multivariable regression models examined whether the mortality risk on admission simply represented older medical patients and/or those who considered themselves unhealthy (Figure 2B) (see Supporting Table 1 in the online version of this article). Accounting for hospital, age, gender, language, self‐reported health, educational level, service line, and days elapsed from discharge, respondents in the high‐mortality‐risk stratum were still less likely to report an always experience for doctor communication (OR: 0.85; 95% confidence interval [CI]: 0.77‐0.94) and responsiveness of hospital staff (OR: 0.77; 95% CI: 0.69‐0.85). Higher‐risk patients also tended to have less favorable experiences with nursing communication, although the CI crossed 1 (OR: 0.91; 95% CI: 0.82‐1.01). In contrast, higher‐risk patients were more likely to provide top box responses for having received discharge information (OR: 1.30; 95% CI: 1.14‐1.48). We did not find independent associations between mortality risk and the other domains when the patient risk‐adjustment factors were considered.[18, 19, 20, 21]
DISCUSSION
The high‐mortality‐risk stratum on admission contained a subset of patients who provided less favorable responses for almost all incentivized HCAHPS domains when other risk‐adjustment variables were not taken into consideration (Figure 2A). These univariate relationships weakened when we controlled for gender, the standard HCAHPS risk‐adjustment variables, and individual hospital influences (Figure 2B).[18, 19, 20, 21] After multivariable adjustment, survey respondents in the high‐risk category remained less likely to report their physicians always communicated well and to experience hospital staff responding quickly, but were more likely to report receiving discharge information. We did not find an independent association between the underlying mortality risk and the other incentivized HCAHPS domains after risk adjustment.
We are cautious with initial interpretations of our findings in light of the relatively small number of hospitals studied and the substantial survey response bias of healthier patients. Undoubtedly, the CMS exclusions of patients discharged to hospice or skilled nursing facilities provide a partial explanation for the selection bias, but the experience of those at high risk who did not complete surveys remains conjecture at this point.[14] Previous evidence suggests sicker patients and those with worse experiences are less likely to respond to the HCAHPS survey.[18, 22] On the other hand, it is possible that high‐risk nonrespondents who died could have received better communication and staff responsiveness.[23, 24] We were unable to find a previous, patient‐level study that explicitly tested the association between the admission mortality risk and the subsequent patient experience, yet our findings are consistent with a previous single‐site study of a surgical population showing lower overall ratings from patients with higher Injury Severity Scores.[25]
Our findings provide evidence of complex relationships among admission mortality risk, the 3 domains of the patient experience, and adverse outcomes, at least within the study hospitals (Figure 1). The developing field of palliative care has found very ill patients have special communication needs regarding goals of care, as well as physical symptoms, anxiety, and depression that might prompt more calls for help.[26] If these needs were more important for high‐risk compared to low‐risk patients, and were either not recognized or adequately addressed by the clinical teams at the study hospitals, then the high‐risk patients may have been less likely to perceive their physicians listened and explained things well, or that staff responded promptly to their requests for help.[27] On the other hand, the higher ratings for discharge information suggest the needs of the high‐risk patients were relatively easier to address by current practices at these hospitals. The lack of association between the mortality risk and the other HCAHPS domains may reflect the relatively stronger influence of age, gender, educational level, provider variability, and other unmeasured influences within the study sites, or that the level of patient need was similar among high‐risk and low‐risk patients within these domains.[27]
There are several possible confounders of our observed relationship between mortality risk and HCAHPS scores. The first category of confounders represents patient level variables that might impact the communication scores, some of which are part of the formula of our mortality prediction rule, for example, cognitive impairment and emergent admission.[18, 22, 27] The effect of the mortality risk could also be confounded by unmeasured patient‐level factors such as lower socioeconomic status.[28] A second category of confounders pertains to clinical outcomes and processes of care associated with serious illness irrespective of the risk of dying. More physicians involved in the care of the seriously ill (Table 1) may impact the communication scores, due to the larger opportunity for conflicting or confusing information presented to patients and their families.[29] The longer hospital stays, readmissions, and adverse events of the seriously ill may also underlie the apparent association between mortality risk and HCAHPS scores.[8, 9, 10]
Even if we do not understand precisely if and how the mortality risk might be associated with suboptimal physician communication and staff responsiveness, there may still be some value in considering how these possible relationships could be leveraged to improve patient care. We recall Berwick's insight that every system is perfectly designed to achieve the results it achieves.[7] We have previously argued for the use of mortality‐risk strata to initiate concurrent, multidisciplinary care processes to reduce adverse outcomes.[12, 13] Others have used risk‐based approaches for anticipating clinical deterioration of surgical patients, and determining the intensity of individualized case management services.[30, 31] In this framework, all patients receive a standard set of care processes, but higher‐risk patients receive additional efforts to promote better outcomes. An efficient extension of this approach is to assume patients at risk for adverse outcomes also have additional needs for communication, coordination of specialty care, and timely response to the call button. The admission mortality risk could be used as a determinant for the level of nurse staffing to reduce deaths plus shorten response time to the call button.[32, 33] Hospitalists and specialists could work together on a standard way to conference among themselves for high‐risk patients above that needed for less‐complex cases. Patients in the high‐risk strata could be screened early to see if they might benefit from the involvement of the palliative care team.[26]
Our study has limitations in addition to those already noted. First, our use of the top box as the formulation of the outcome of interest could be challenged. We chose this to be relevant to the Value‐Based Purchasing environment, but other formulations or use of other survey instruments may be needed to tease out the complex relationships we hypothesize. Next, we do not know the extent to which the patients and care processes reflected in our study represent other settings. The literature indicates some hospitals are more effective in providing care for certain subgroups of patients than for others, and that there is substantial regional variation in care intensity that is in turn associated with the patient experience.[29, 34] The mortality‐risk experience relationship for nonstudy hospitals could be weaker or stronger than what we found. Third, many hospitals may not have the capability to generate mortality scores on admission, although more hospitals may be able to do so in the future.[35] Explicit risk strata have the benefit of providing members of the multidisciplinary team with a quick preview of the clinical needs and prognoses of patients in much the way that the term baroque alerts the audience to the genre of music. Still, clinicians in any hospital could attempt to improve outcomes and experience through the use of informal risk assessment during interdisciplinary care rounds or by simply asking the team if they would be surprised if this patient died in the next year.[30, 36] Finally, we do not know if awareness of an experience risk will identify remediable practices that actually improve the experience. Clearly, future studies are needed to answer all of these concerns.
We have provided evidence that a group of patients who were at elevated risk for dying at the time of admission were more likely to have issues with physician communication and staff responsiveness than their lower‐risk counterparts. While we await future studies to confirm these findings, clinical teams can consider whether or not their patients' HCAHPS scores reflect how their system of care addresses the needs of these vulnerable people.
Acknowledgements
The authors thank Steven Lewis for assistance in the interpretation of the HCAHPS scores, Bonita Singal, MD, PhD, for initial statistical consultation, and Frank Smith, MD, for reviewing an earlier version of the manuscript. The authors acknowledge the input of the peer reviewers.
Disclosures: Dr. Cowen and Mr. Kabara had full access to all of the data in the study and take responsibility for the integrity of the data and the accuracy of the data analysis. Study concept and design: all authors. Acquisition, analysis or interpretation of data: all authors. Drafting of the manuscript: Dr. Cowen and Mr. Kabara. Critical revision of the manuscript for important intellectual content: all authors. Statistical analysis: Dr. Cowen and Mr. Kabara. Administrative, technical or material support: Ms. Czerwinski. Study supervision: Dr. Cowen and Ms. Czerwinski. Funding/support: internal. Conflicts of interest disclosures: no potential conflicts reported.
Disclosures
Dr. Cowen and Mr. Kabara had full access to all of the data in the study and take responsibility for the integrity of the data and the accuracy of the data analysis. Study concept and design: all authors. Acquisition, analysis or interpretation of data: all authors. Drafting of the manuscript: Dr. Cowen and Mr. Kabara. Critical revision of the manuscript for important intellectual content: all authors. Statistical analysis: Dr. Cowen and Mr. Kabara. Administrative, technical or material support: Ms. Czerwinski. Study supervision: Dr. Cowen and Ms. Czerwinski. Funding/support: internal. Conflicts of interest disclosures: no potential conflicts reported.
- , , , , . Measuring hospital care from the patients' perspective: an overview of the CAHPS hospital survey development process. Health Serv Res. 2005;40 (6 part 2):1977–1995.
- Centers for Medicare 79(163):49854–50449.
- , , , . The relationship between patients' perception of care and measures of hospital quality and safety. Health Serv Res. 2010;45(4):1024–1040.
- Centers for Medicare 312(7031):619–622.
- , , , , . Relationship between patient satisfaction with inpatient care and hospital readmission within 30 days. Am J Manag Care. 2011;17(1):41–48.
- , , , , , . Getting satisfaction: drivers of surgical Hospital Consumer Assessment of Health care Providers and Systems survey scores. J Surg Res. 2015;197(1):155–161.
- , , . Patient satisfaction and quality of surgical care in US hospitals. Ann Surg. 2015;261(1):2–8.
- , , . Is there a relationship between patient satisfaction and favorable outcomes? Ann Surg. 2014;260(4):592–598; discussion 598–600.
- , , , , . Mortality predictions on admission as a context for organizing care activities. J Hosp Med. 2013;8(5):229–235.
- , , , et al. Implementation of a mortality prediction rule for real‐time decision making: feasibility and validity. J Hosp Med. 2014;9(11):720–726.
- Centers for Medicare 40(6 pt 2):2078–2095.
- Centers for Medicare 44(2 pt 1):501–518.
- Patient‐mix coefficients for October 2015 (1Q14 through 4Q14 discharges) publicly reported HCAHPS Results. Available at: http://www.hcahpsonline.org/Files/October_2015_PMA_Web_Document_a.pdf. Published July 2, 2015. Accessed August 4, 2015.
- , , , , . Case‐mix adjustment of the CAHPS hospital survey. Health Serv Res. 2005;40(6):2162–2181.
- , , , et.al. Gender differences in patients' perceptions of inpatient care. Health Serv Res. 2012;47(4):1482–1501.
- , , , et al. Patterns of unit and item nonresponse in the CAHPS hospital survey. Health Serv Res. 2005;40(6 pt 2):2096–2119.
- , , , . The cost of satisfaction: a national study of patient satisfaction, health care utilization, expenditures, and mortality. Arch Intern Med. 2012;172(5):405–411.
- , , , et al. Care experiences of managed care Medicare enrollees near the end of life. J Am Geriatr Soc. 2013;61(3):407–412.
- , , , , . Measuring satisfaction: factors that drive hospital consumer assessment of healthcare providers and systems survey responses in a trauma and acute care surgery population. Am Surg. 2015;81(5):537–543.
- , . Palliative care for the seriously ill. N Engl J Med. 2015;373(8):747–755.
- , , , et.al. Components of care vary in importance for overall patient‐reported experience by type of hospitalization. Med Care. 2009;47(8):842–849.
- , , , et al. Socioeconomic status, structural and functional measures of social support, and mortality: the British Whitehall II cohort study, 1985–2009. Am J Epidemiol. 2012;175(12):1275–1283.
- , , , et al. Inpatient care intensity and patients' ratings of their hospital experiences. Health Aff (Millwood). 2009;28(1):103–112.
- , , , et al. A validated value‐based model to improve hospital‐wide perioperative outcomes. Ann Surg. 2010;252(3):486–498.
- , , , et al. Allocating scare resources in real‐time to reduce heart failure readmissions: a prospective, controlled study. BMJ Qual Saf. 2013;22(12):998–1005.
- , , , . Patients' perception of hospital care in the United States. N Engl J Med. 2008;359(18):1921–1931.
- , , , , , . Nurse staffing and inpatient hospital mortality. N Engl J Med. 2011;364(11):1037–1045.
- , , , et al. Do hospitals rank differently on HCAHPS for different patient subgroups? Med Care Res Rev. 2010;67(1):56–73.
- , , , , , . Risk‐adjusting hospital inpatient mortality using automated inpatient, outpatient, and laboratory databases. Med Care. 2008;46(3):232–239.
- , , , et al. Utility of the “surprise” question to identify dialysis patients with high mortality. Clin J Am Soc Nephrol. 2008;3(5):1379–1384.
- , , , , . Measuring hospital care from the patients' perspective: an overview of the CAHPS hospital survey development process. Health Serv Res. 2005;40 (6 part 2):1977–1995.
- Centers for Medicare 79(163):49854–50449.
- , , , . The relationship between patients' perception of care and measures of hospital quality and safety. Health Serv Res. 2010;45(4):1024–1040.
- Centers for Medicare 312(7031):619–622.
- , , , , . Relationship between patient satisfaction with inpatient care and hospital readmission within 30 days. Am J Manag Care. 2011;17(1):41–48.
- , , , , , . Getting satisfaction: drivers of surgical Hospital Consumer Assessment of Health care Providers and Systems survey scores. J Surg Res. 2015;197(1):155–161.
- , , . Patient satisfaction and quality of surgical care in US hospitals. Ann Surg. 2015;261(1):2–8.
- , , . Is there a relationship between patient satisfaction and favorable outcomes? Ann Surg. 2014;260(4):592–598; discussion 598–600.
- , , , , . Mortality predictions on admission as a context for organizing care activities. J Hosp Med. 2013;8(5):229–235.
- , , , et al. Implementation of a mortality prediction rule for real‐time decision making: feasibility and validity. J Hosp Med. 2014;9(11):720–726.
- Centers for Medicare 40(6 pt 2):2078–2095.
- Centers for Medicare 44(2 pt 1):501–518.
- Patient‐mix coefficients for October 2015 (1Q14 through 4Q14 discharges) publicly reported HCAHPS Results. Available at: http://www.hcahpsonline.org/Files/October_2015_PMA_Web_Document_a.pdf. Published July 2, 2015. Accessed August 4, 2015.
- , , , , . Case‐mix adjustment of the CAHPS hospital survey. Health Serv Res. 2005;40(6):2162–2181.
- , , , et.al. Gender differences in patients' perceptions of inpatient care. Health Serv Res. 2012;47(4):1482–1501.
- , , , et al. Patterns of unit and item nonresponse in the CAHPS hospital survey. Health Serv Res. 2005;40(6 pt 2):2096–2119.
- , , , . The cost of satisfaction: a national study of patient satisfaction, health care utilization, expenditures, and mortality. Arch Intern Med. 2012;172(5):405–411.
- , , , et al. Care experiences of managed care Medicare enrollees near the end of life. J Am Geriatr Soc. 2013;61(3):407–412.
- , , , , . Measuring satisfaction: factors that drive hospital consumer assessment of healthcare providers and systems survey responses in a trauma and acute care surgery population. Am Surg. 2015;81(5):537–543.
- , . Palliative care for the seriously ill. N Engl J Med. 2015;373(8):747–755.
- , , , et.al. Components of care vary in importance for overall patient‐reported experience by type of hospitalization. Med Care. 2009;47(8):842–849.
- , , , et al. Socioeconomic status, structural and functional measures of social support, and mortality: the British Whitehall II cohort study, 1985–2009. Am J Epidemiol. 2012;175(12):1275–1283.
- , , , et al. Inpatient care intensity and patients' ratings of their hospital experiences. Health Aff (Millwood). 2009;28(1):103–112.
- , , , et al. A validated value‐based model to improve hospital‐wide perioperative outcomes. Ann Surg. 2010;252(3):486–498.
- , , , et al. Allocating scare resources in real‐time to reduce heart failure readmissions: a prospective, controlled study. BMJ Qual Saf. 2013;22(12):998–1005.
- , , , . Patients' perception of hospital care in the United States. N Engl J Med. 2008;359(18):1921–1931.
- , , , , , . Nurse staffing and inpatient hospital mortality. N Engl J Med. 2011;364(11):1037–1045.
- , , , et al. Do hospitals rank differently on HCAHPS for different patient subgroups? Med Care Res Rev. 2010;67(1):56–73.
- , , , , , . Risk‐adjusting hospital inpatient mortality using automated inpatient, outpatient, and laboratory databases. Med Care. 2008;46(3):232–239.
- , , , et al. Utility of the “surprise” question to identify dialysis patients with high mortality. Clin J Am Soc Nephrol. 2008;3(5):1379–1384.