User login
Enhancing Mobility Reduces Length of Stay
Clinical question: Can a nurse-driven early ambulation program aimed at all hospitalized adults increase patient mobility and decrease length of stay?

Background: Many adults experience decline of functional abilities during their hospitalization. Interventions to increase early mobilization of patients in the ICU have been associated with decreased length of stay, decreased costs, and improved patient satisfaction. Previous studies of interventions in non-ICU patients have used specialized staff or have targeted select patient populations.
Study design: Before-after cohort study.
Setting: Patients admitted to two general medical units at a single large academic hospital.
Synopsis: The authors implemented a 12-month multidisciplinary quality improvement project in 3,352 patients, with the goal of mobilizing patients three times per day. Additional goals included consistently documenting daily mobility, setting daily goals to increase activity, and standardizing the description of mobility across disciplines. Ambulation, documentation, and goal setting were assigned to regular nursing staff and targeted at each of the patients admitted to these units during the study period. Highest level of mobility was documented using a locally derived simple eight-point ordinal scale. Daily documentation rate of mobility averaged 85% over the 12 months of the project. Comparing the four-month study period at the beginning of the project implementation to the four-month period after implementation, more patients ambulated (70% versus 43%), patients with improved mobility scores increased from 32% to 45%, and length of stay declined by 0.40 days. All of these differences were statistically significant. There was no increase in falls with injury.
Bottom line: A nurse-driven early mobility program aimed at all patients admitted to general medical services may improve mobility and decrease length of stay.
Citation: Hoyer EH, Friedman M, Lavezza A, et al. Promoting mobility and reducing length of stay in hospitalized general medicine patients: a quality-improvement project [published online ahead of print February 5, 2016]. J Hosp Med. doi:10.1002/jhm.2546.
Short Take
Prednisolone is Equivalent to NSAIDs in the Treatment of Acute Gout
In a multicenter, double-blind, randomized equivalence trial of 416 patients presenting to the emergency department with symptoms of acute gout, treatment with prednisolone was equivalent to indomethacin for pain treatment without any difference in adverse events.
Citation: Rainer TH, Cheng CH, Janssens HJEM, et al. Oral prednisolone in the treatment of acute gout: a pragmatic, multicenter, double-blind, randomized trial. Ann Intern Med. 2016;164(7):464-471. doi:10.7326/M14-2070.
Clinical question: Can a nurse-driven early ambulation program aimed at all hospitalized adults increase patient mobility and decrease length of stay?
Background: Many adults experience decline of functional abilities during their hospitalization. Interventions to increase early mobilization of patients in the ICU have been associated with decreased length of stay, decreased costs, and improved patient satisfaction. Previous studies of interventions in non-ICU patients have used specialized staff or have targeted select patient populations.
Study design: Before-after cohort study.
Setting: Patients admitted to two general medical units at a single large academic hospital.
Synopsis: The authors implemented a 12-month multidisciplinary quality improvement project in 3,352 patients, with the goal of mobilizing patients three times per day. Additional goals included consistently documenting daily mobility, setting daily goals to increase activity, and standardizing the description of mobility across disciplines. Ambulation, documentation, and goal setting were assigned to regular nursing staff and targeted at each of the patients admitted to these units during the study period. Highest level of mobility was documented using a locally derived simple eight-point ordinal scale. Daily documentation rate of mobility averaged 85% over the 12 months of the project. Comparing the four-month study period at the beginning of the project implementation to the four-month period after implementation, more patients ambulated (70% versus 43%), patients with improved mobility scores increased from 32% to 45%, and length of stay declined by 0.40 days. All of these differences were statistically significant. There was no increase in falls with injury.
Bottom line: A nurse-driven early mobility program aimed at all patients admitted to general medical services may improve mobility and decrease length of stay.
Citation: Hoyer EH, Friedman M, Lavezza A, et al. Promoting mobility and reducing length of stay in hospitalized general medicine patients: a quality-improvement project [published online ahead of print February 5, 2016]. J Hosp Med. doi:10.1002/jhm.2546.
Short Take
Prednisolone is Equivalent to NSAIDs in the Treatment of Acute Gout
In a multicenter, double-blind, randomized equivalence trial of 416 patients presenting to the emergency department with symptoms of acute gout, treatment with prednisolone was equivalent to indomethacin for pain treatment without any difference in adverse events.
Citation: Rainer TH, Cheng CH, Janssens HJEM, et al. Oral prednisolone in the treatment of acute gout: a pragmatic, multicenter, double-blind, randomized trial. Ann Intern Med. 2016;164(7):464-471. doi:10.7326/M14-2070.

Can Sepsis Be Better Defined?
Clinical question: Given advances in the understanding and treatment of sepsis, can sepsis be better defined?
Background: Definitions of sepsis and septic shock were last revised in 2001. The current definitions are based on a constellation of clinical signs and symptoms in a patient with suspected infection. Recent studies suggest that the definitions have low sensitivity and specificity, and they do not correlate well with patient outcomes.
Study design: Consensus guidelines.
Setting: Task force of 19 critical care, infectious disease, surgical, and pulmonary specialists convened in 2014 by the European Society of Intensive Care Medicine and the Society of Critical Care Medicine.
Synopsis: The task force recommended that sepsis be defined as life-threatening organ dysfunction caused by a dysregulated host response to infection and that it be identified by a change of more than one point in the Sequential Organ Failure Assessment (SOFA) score. This score incorporates the Glasgow Coma Scale, mean arterial blood pressure (MAP), PaO2/FiO2, platelet count, creatinine, and bilirubin. Septic shock is defined as a subset of sepsis with profound circulatory, cellular, and metabolic abnormalities, and it’s identified by serum lactate level >2 mmol/L and vasopressor requirement to maintain a MAP of ≥65 mm Hg in the absence of hypovolemia. These new definitions have higher sensitivity and specificity and can predict mortality more accurately. Patients with these definitions of sepsis and septic shock have in-hospital mortality >10% and >40%, respectively. The presence of two or more quick SOFA (qSOFA) elements (altered mentation, systolic blood pressure ≤100 mm Hg, and respiratory rate ≥22/min) identifies adult patients with suspected infection who need more extensive laboratory testing to exclude sepsis.
Bottom line: Defining sepsis now requires more laboratory testing but provides more diagnostic consistency and more accurately predicts outcomes.
Citation: Singer M, Deutschman CS, Seymour CW, et al. The Third International Consensus definitions for sepsis and septic shock (sepsis-3). JAMA. 2016;315(8):801-810. doi:10.1001/jama.2016.0287.
Team develops new approach to programming T cells

Using mouse models, researchers have developed a new cellular programming approach to create alloreactive T cells they say eliminate leukemic cells without causing graft-versus-host disease (GVHD).
They created the T cells using the donor key immune cell. When used in allogeneic hematopoietic stem cell transplantation and anti-leukemia therapy, the new approach reduced the toxicities that cause GVHD while preserving the anti-leukemia activity of the immune cell.
“This approach will be useful in the future when developing novel methods for immunotherapy,” said Yi Zhang, MD, PhD, of Temple University in Philadelphia, Pennsylvania.
Dr Zhang and colleagues took murine bone marrow using Flt3 ligand and Toll-like receptor agonists to produce δ-like ligand 4-positive dendritic cells (Dll4hiDCs). When the dendritic cells were stimulated, CD4+ naïve T cells underwent effector differentiation and produced high levels of IFN-γ and IL-17 in vitro.
The team then transferred the allogeneic Dll4hiDC-induced T cells into the mice. The cells did not induce severe GVHD and preserved anti-leukemic activity, “significantly improving the survival of leukemic mice undergoing allogeneic HSCT,” they said.
They noted that the IFN-γ was important for Dll4hiDC programming in reducing the GVHD toxicities of alloreactive T cells. When the researchers transferred unstimulated T cells into mice, 5 of 8 mice died from GVHD and 3 of 8 died with tumor. Those that received Dll4hiDC-induced T cells did not develop GVHD.
They also emphasized that this platform does not require transfection with viral vectors, which has limitations of safety and efficiency.
“This system will not only be useful for reducing GvHD,” Dr Zhang said, “but can also be used in the identification of T cells for the improvement of other types of immunotherapy for advanced cancer.”
The team published this research in Blood. ![]()
Young HCT survivors have increased risk for frailty
for transplant
Photo credit: Chad McNeeley
Frailty among young adult hematopoietic cell transplant (HCT) survivors is high and approaches that of a community-based elderly population, according to results of the Bone Marrow Transplant Survivor Study.
Of the 998 HCT participants, frailty exceeded 8%, and they were 8.4 times more likely to be frail than their siblings.
Investigators defined frailty as exhibiting 3 or more of the following traits: clinically underweight, exhaustion, low energy expenditure, slow walking speed, and muscle weakness.
Because HCT recipients are exposed to high-intensity chemotherapy, radiation, and immunosuppression at points before, during, and after transplant, the investigators set out to determine whether non-elderly HCT recipients who have survived 2 years or more after transplant were at a higher risk of frailty compared with a sibling comparator group.
Smita Bhatia, MD, of the University of Alabama at Birmingham, and colleagues conducted the study of HCT survivors between the ages of 18 and 64 and compared the results to a sibling control group. The authors also looked at the subsequent mortality of HCT survivors.
They reported their findings in JAMA Oncology.
The 998 HCT survivors who participated in the study received their transplants at City of Hope in Duarte, California, or at the University of Minnesota in Minneapolis, between 1974 and 1998. The survivors and the 297 siblings completed questionnaires between February 1999 and June 2005.
Demographics
The HCT survivors were a mean age of 42.5 years, and 911 (93%) had health insurance coverage.
This was comparable to the sibling controls, who were a mean age of 43.8 years (P=0.09) and 279 (95%) had health insurance coverage.
However, more siblings were female (64%), non-Hispanic white (88%), college graduates (56%), and 92% had annual household incomes of $20,000 or more.
In the HCT survivor group, 46% were female (P<0.001), 81% non-Hispanic white (P=0.004), 49% college graduates (P<0.001), and 80% had annual incomes of $20,000 or more (P<0.001).
HCT survivors were a mean age of 33.8 years when they had their transplants and the interval between HCT and participation in the study was 8.7 years.
Hematologic malignancies were the major diagnoses leading to HCT. Twenty-three percent had a primary diagnosis of chronic myeloid leukemia, 24% had acute myeloid leukemia, 19% had non-Hodgkin lymphoma, 10% had acute lymphoblastic leukemia, and 9% had Hodgkin lymphoma.
Seventy-seven percent of the HCT survivors had total body irradiation, and 300 of the 562 who received allogeneic transplants had chronic GVHD, with 24% of them reporting active GVHD at the time they participated in the study.
Frailty
Only 2 siblings (0.7%) considered themselves frail compared to 84 (8.4%) HCT survivors.
More survivors were underweight and reported low energy expenditure compared to the sibling group, but the differences were not statistically significant, P=0.26 and P=0.14, respectively.
However, significantly more survivors reported exhaustion (P<0.001), slowness (P<0.001), and weakness (P<0.001) compared to the sibling group,
The investigators then adjusted the data for age at study participation, sex, race/ethnicity, education, household income, health insurance, presence of grades 3 or 4 chronic health conditions, and transplant institution. They then found the HCT survivors to be 8.35 times more likely to be frail than their siblings (P=0.003).
HCT survivors with low annual incomes (P=0.03), less than a college education (P=0.002), with grades 3 or 4 chronic health conditions (P=0.02), with multiple myeloma (P=0.05), or with resolved chronic (P=0.04) or active chronic GVHD (P<0.001) were more likely to be frail compared to the other HCT survivors.
Mortality
The investigators followed the patients for a median of 10.3 years from the time participants completed the survey. At that time, 182 (18%) patients had died.
The 10-year cumulative all-cause mortality was 39.3% for patients with frailty and 14.7% for patients without frailty (P<0.001).
The 10-year cumulative relapse-related mortality was 15.5% among frail HCT patients and 4.5% for non-frail HCT patients.
And the 10-year cumulative non-relapse mortality was also higher among frail HCT recipients, 23.9% compared to 10.2% of the non-frail HCT recipients (P<0.001).
Multivariate analysis revealed that frailty was associated with a 2.76-fold increase in death. The variables included age at study participation, sex, presence of grades 3 to 4 chronic health conditions, primary diagnosis, annual household income, and risk of relapse at transplant.
The investigators concluded that the therapies transplant patients undergo and post-transplant complications constitute a substantial stressor, placing HCT survivors at risk for frailty and premature aging.
“These findings demonstrate the need for interventions,” they added, “including personalized assessments and multidisciplinary efforts targeting both pre-frail and frail individuals to improve outcomes.” ![]()
Mortality Due to Elevated Troponin
Acute coronary syndromes (ACS) are potentially lethal and present with a wide variety of symptoms. As such, physicians frequently order cardiac biomarkers, such as cardiac troponin, for patients with acute complaints. Elevated troponin is associated with higher risk of mortality regardless of the causes, which can be myriad, both chronic and acute.[1] Among patients with an elevated troponin, distinguishing ACS from non‐ACS can be challenging.
Making the distinction between ACS and non‐ACS troponin elevation is crucial because the underlying pathophysiology and subsequent management strategies are markedly different.[2] According to evidence‐based practice guidelines, ACS is managed with antiplatelet drugs, statins, and percutaneous coronary intervention, improving clinical outcomes.[3] In contrast, care for patients with non‐ACS troponin elevations is usually supportive, with a focus on the underlying conditions. The lack of specific treatment options for such patients is concerning given that several series have suggested that non‐ACS troponin patients may have a higher mortality risk than ACS patients.[4, 5, 6] Non‐ACS troponin elevation can be the result of a multitude of conditions.[7, 8] What remains unclear at this point is whether the excess mortality observed with non‐ACS troponin elevation is due to myocardial damage or to the underlying conditions that predispose to troponin release.
Using data from a quality improvement (QI) project collected at our Veterans Affairs (VA) medical center, we investigated the mortality risk associated with ACS and non‐ACS troponin elevation including an analysis of factors associated with mortality. We hypothesized that non‐ACS troponin elevation will have a higher mortality risk than troponin elevation due to ACS, and that important contributors to this relationship could be identified to provide direction for future investigation directed at modifying this mortality risk.
METHODS
We analyzed data that were prospectively collected for a quality initiative between 2006 and 2007. The project was a collaborative endeavor between cardiology, hospital medicine, and emergency medicine with the process goal of better identifying patients with ACS to hopefully improve outcomes. The QI team was consulted in real time to assist with treatment recommendations; no retrospective decisions were made regarding whether or not ACS was present. As the goal of the project was to improve cardiovascular outcomes, consultative advice was freely provided, and no physicians or teams were subject to any adverse repercussions for their diagnoses or management decisions.
A cardiologist‐led team was created to improve quality of care for myocardial infarction patients by evaluating all patients at our facility with an elevated troponin. On a daily basis, a specialist clinical coordinator (nurse practitioner or physician assistant) received a list of all patients with elevated troponin from the chemistry lab. The coordinator reviewed the patients' medical records with a cardiologist. A positive troponin was defined as a troponin T level of greater than 0.03 ng/mL (99th percentile at our facility). Each attending cardiologist prospectively determined if troponin elevation was related to clinical findings consistent with an ACS based on review of the patients' symptoms (duration, quality, severity, chronicity, and alleviating/aggravating factors), medical history, and noninvasive cardiac testing including electrocardiograms, cardiac biomarkers, and any other available imaging tests.
We have previously demonstrated that the cardiologists at our facility have a similar rate of diagnosing ACS.[9] All cardiologists at our facility maintain current American Board of Internal Medicine certification in cardiovascular disease and have academic appointments at the University of Florida College of Medicine. All patients were followed prospectively, and data on their medical history, acute evaluation, and outcomes were tracked in an electronic database. Given the higher risk of mortality with ST‐elevation myocardial infarction, such patients were excluded from this investigation. By definition, patients with unstable angina do not have elevated biomarkers and thus would not have been included in the database to begin with. Prospectively recorded data elements included: age, gender, chief complaint, tobacco use, presence of hypertension, hyperlipidemia, prior coronary disease, chronic kidney disease, diabetes mellitus, cardiac troponin values, serum creatinine, electrocardiogram (ECG) variables, Thrombolysis in Myocardial Infarction (TIMI) score, and if the patient was placed under hospice care or an active do‐not‐resuscitate (DNR) order. Additional data elements gathered at a later date included maximum temperature, white blood cell count, N‐terminal pro‐brain natriuretic peptide (NT‐proBNP), administration of advanced cardiac life support (ACLS), and admission to an intensive care unit (ICU). All consecutive patients with elevated troponin were included in the database; if patients were included more than once, we used their index evaluation only. All patients with troponin elevation after revascularization (percutaneous coronary intervention or coronary bypass surgery) were excluded. Our investigational design was reviewed by our institutional review board, who waived the requirement for formal written informed consent and approved use of data from this QI project for research purposes.
We focused this investigation on an analysis of all‐cause mortality in February 2014. We analyzed mortality at 30 days, 1 year, and 6 years. As secondary outcomes we analyzed the likelihood of the patients' chief complaint for the diagnosis of ACS and evaluated predictors of mortality based on Cox proportional hazard modeling. Mortality within the VA system is reliably tracked and compares favorably to the Social Security National Death Index Master File for accuracy.[10, 11]
Categorical variables were compared by 2 test. The Student t test was used to compare normally distributed continuous variables, and nonparametric tests were used for non‐normal distributions as appropriate. Mortality data at 30 days, 1 year, and 6 years were compared by log‐rank test and Kaplan‐Meier graphs. A formal power analysis was not performed; the entire available population was included. A Cox proportional hazard model was created to estimate mortality risk at each time point. Variables included in our Cox regression model were age, gender, history of coronary artery disease (CAD), hypertension, diabetes mellitus or hyperlipidemia, ACS diagnosis, dynamic ECG changes, TIMI risk score, initial troponin level, creatinine level at time of initial troponin (per mg/dL), presence of fever, maximum white blood cell count, NT‐proBNP level (per 1000 pg/mL), if ACLS was performed, if the patient was under hospice care, if there was a DNR order, and if they required ICU admission. This model was also constructed independently for the ACS and non‐ACS cohorts for mortality at 1 year. A forward stepwise model was used. Statistical results were considered significant at P 0.05. Statistical analyses were performed using SPSS version 21 (IBM, Armonk, NY).
RESULTS
Among the 761 patients, 502 (66.0%) were classified as non‐ACS and 259 (34.0%) as ACS (Table 1). The mean age was higher in the non‐ACS group (71 years vs 69 years in the ACS group, P = 0.006). Hypertension, diabetes mellitus, and prior CAD were frequent in both groups and not significantly different. Median initial troponin T was higher in the ACS group (0.12 ng/mL vs 0.06 ng/mL, P 0.001) as were the frequency of a TIMI risk score >2 (92.5% vs 74.3%, P 0.001) and new ECG changes (29.7% vs 8.2%, P 0.001). Hospice, DNR orders, and administration of ACLS were not different between groups; however, admission to the ICU was more frequent in the ACS group (44.8% vs 31.9%, P 0.001). Chest pain was the symptom with the highest positive predictive value for the diagnosis of ACS (63.3%), whereas the least predictive was altered mental status or confusion (18.0%) (Figure 1).
| Non‐ACS, N = 502 | ACS, N = 259 | P Value | |
|---|---|---|---|
| |||
| Baseline characteristics, n (%) | |||
| Age, y | 71 11 | 69 11 | 0.006 |
| Female | 6 (1.2%) | 1 (0.4%) | 0.27 |
| Coronary artery disease | 244 (48.6%) | 141 (54.4%) | 0.13 |
| Hypertension | 381 (75.9%) | 203 (78.4%) | 0.44 |
| Diabetes mellitus | 220 (43.8%) | 119 (45.9%) | 0.58 |
| Hyperlipidemia | 268 (53.4%) | 170 (65.6%) | 0.001 |
| Current smoker | 24 (4.8%) | 49 (18.9%) | 0.001 |
| Clinical presentation | |||
| Initial troponin T, ng/mL, median [IQR] | 0.06 [0.040.11] | 0.12 [0.050.32] | 0.001 |
| White cell count, 109/L, median [IQR] | 10 [8.014.0] | 11 [8.015.0] | 0.005 |
| NT‐proBNP, pg/mL, median [IQR] | 3,531 [1,20110,519] | 1,932 [3199,100] | 0.001 |
| Creatinine, mg/dL, median [IQR] | 1.6 [1.12.4] | 1.1 [0.91.5] | 0.001 |
| New ECG changes, no. (%) | 41 (8.2%) | 77 (29.7%) | 0.001 |
| TIMI score over 2, no. (%) | 365 (74.3%) | 235 (92.5%) | 0.001 |
| Fever (over 100.4 F), no. (%) | 75 (15.0%) | 38 (14.7%) | 0.91 |
| Hospice, no. (%) | 8 (1.6%) | 5 (1.9%) | 0.73 |
| Do not resuscitate, no. (%) | 62 (12.4%) | 30 (11.6%) | 0.76 |
| Intensive care admission, no. (%) | 160 (31.9%) | 116 (44.8%) | 0.001 |
| ACLS administered, no. (%) | 38 (7.6%) | 17 (6.6%) | 0.6 |
| Outcomes, no. (%) | |||
| Death, 30 days | 67 (13.3%) | 30 (11.6%) | 0.49 |
| Death, 1 year | 211 (42.0%) | 75 (29.0%) | 0.001 |
| Death, 6 years | 390 (77.7%) | 152 (58.7%) | 0.001 |

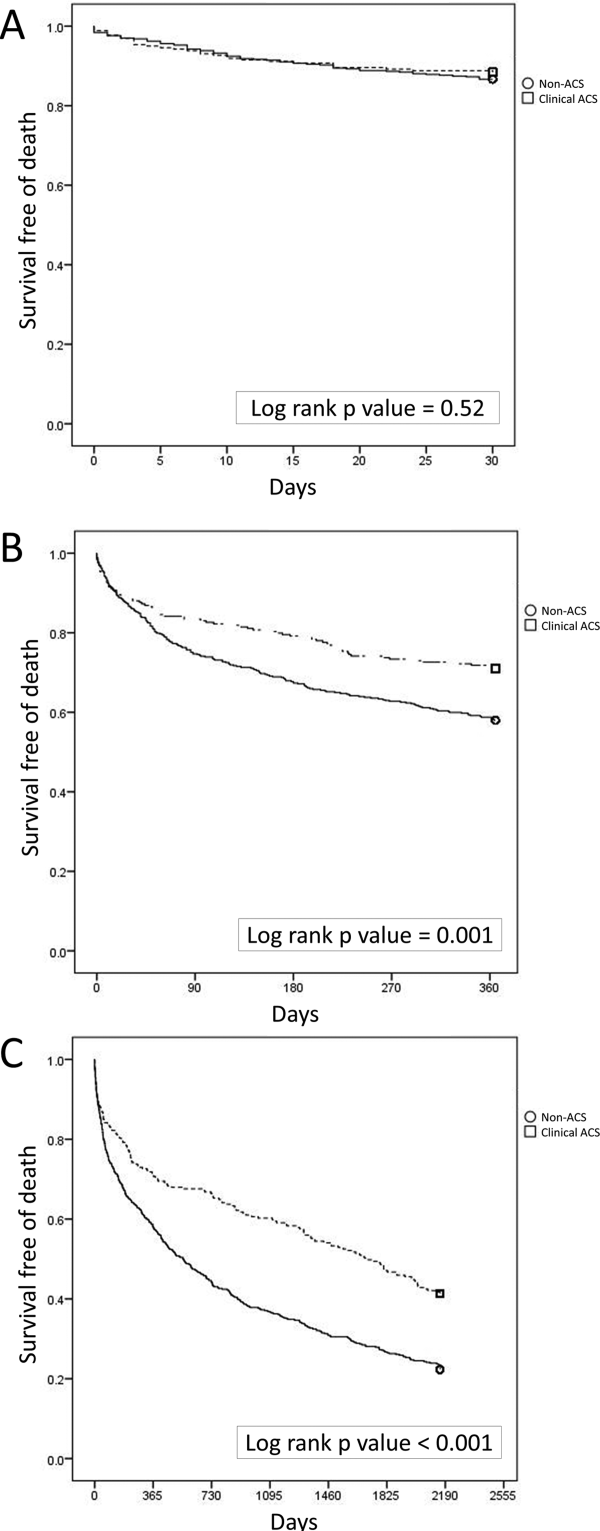
Mortality at 30 days was not different between the 2 groups, but mortality was higher for the non‐ACS cohort at 1 year and at 6 years (Table 1). Kaplan‐Meier curves demonstrate that mortality for the 2 cohorts begins to diverge between 30 and 60 days until approximately 2 years when the curves again are parallel (Figure 2).
In Cox proportional hazards models, 5 factors were associated with higher mortality at 30 days, 1 year, and at 6 years: age, hospice, DNR order, need for ACLS, and admission to the ICU (Table 2). Additionally, at 1 and 6 years, NT‐proBNP and non‐ACS were associated with higher mortality. At 6 years, creatinine was an additional significant factor. We separated the ACS and non‐ACS cohorts and performed the same model for 1‐year mortality (Table 3). The models yielded similar factors associated with higher mortality: hospice, DNR order, need for ACLS, age, and NT‐proBNP, with ICU admission being significant only in the non‐ACS cohort.
| P Value | Hazard Ratio | 95% CI | |
|---|---|---|---|
| |||
| 30 days | |||
| Intensive care unit admission | 0.0001 | 2.18 | 1.283.72 |
| Hospice | 0.0001 | 4.67 | 1.9111.40 |
| Do not resuscitate | 0.0001 | 3.19 | 1.945.24 |
| ACLS performed | 0.0001 | 10.17 | 6.0317.17 |
| Age, per year | 0.0001 | 1.04 | 1.021.06 |
| 1 year | |||
| Intensive care unit admission | 0.0001 | 1.66 | 1.262.20 |
| Hospice | 0.0001 | 4.98 | 2.699.21 |
| Do not resuscitate | 0.0001 | 2.52 | 1.833.47 |
| Non‐ACS | 0.0001 | 1.57 | 1.192.08 |
| ACLS performed | 0.0001 | 6.03 | 4.178.72 |
| Age, per year | 0.0001 | 1.03 | 1.021.04 |
| NT‐proBNP, per 1,000 pg/mL | 0.0001 | 1.02 | 1.011.03 |
| Extended follow‐up | |||
| Intensive care unit admission | 0.0001 | 1.35 | 1.111.65 |
| Hospice | 0.0001 | 3.81 | 2.136.81 |
| Do not resuscitate | 0.0001 | 2.11 | 1.622.74 |
| Non‐ACS | 0.0001 | 1.53 | 1.251.88 |
| ACLS performed | 0.0001 | 4.19 | 3.015.84 |
| Age, per year | 0.0001 | 1.03 | 1.031.04 |
| Creatinine, per mg/dL | 0.02 | 1.06 | 1.011.12 |
| NT‐proBNP, per 1,000 pg/mL | 0.0001 | 1.02 | 1.021.03 |
| P Value | Hazard Ratio | 95% CI | |
|---|---|---|---|
| |||
| Non‐ACS | |||
| Intensive care unit admission | 0.0001 | 1.86 | 1.352.58 |
| Hospice | 0.0001 | 7.55 | 3.5715.93 |
| Do not resuscitate | 0.0001 | 2.33 | 1.603.41 |
| ACLS performed | 0.0001 | 4.42 | 2.836.92 |
| Age, per year | 0.0001 | 1.03 | 1.011.04 |
| NT‐proBNP, per 1,000 pg/mL | 0.002 | 1.02 | 1.011.03 |
| Clinical ACS | |||
| Hospice | 0.036 | 3.17 | 1.089.32 |
| Do not resuscitate | 0.003 | 2.49 | 1.364.55 |
| ACLS performed | 0.0001 | 12.04 | 6.3322.91 |
| Age, per year | 0.0001 | 1.05 | 1.021.07 |
| NT‐proBNP, per 1,000 pg/mL | 0.001 | 1.04 | 1.011.06 |
DISCUSSION
Our findings confirm the important, but perhaps not well‐recognized, fact that an elevated troponin without ACS is associated with higher mortality than with ACS. This has been previously observed in veteran and nonveteran populations.[4, 6, 8, 12] The novel finding from our investigation is that mortality risk with troponin elevation is most strongly associated with unmodifiable clinical factors that are plausible explanations of risk. Furthermore, the distribution of these factors between our 2 cohorts does not sufficiently explain the difference in risk between ACS and non‐ACS patients.
At each time point we evaluated, ICU admission and need for ACLS were associated with mortality. These are indicators of a severely ill population and are not surprising to find associated with mortality. Many hospitals have instituted some form of pre‐code approach or rapid response team to identify patients before they need ACLS. These efforts, although well meaning, have not yielded convincing results of effectiveness.[13] Hospice and DNR patients were also, not surprisingly, associated with higher mortality. Although these factors were statistically significant, the low prevalence suggests that they are not clinically impactful on the primary questions of the investigation. These factors can be altered but are not intended as modifiable as they reflect the wishes of patients and their decision makers. The distribution of the factors in our model, however, did not adequately explain the higher risk of death with non‐ACS troponin elevation. For example, ACLS administration, hospice care, and DNR orders were strong predictors but were similar between the groups. ICU admission was actually more common with ACS patients, despite strong association with mortality. Age and NT‐proBNP were associated with mortality and higher in the non‐ACS group; however the magnitude of hazard was less than for the other factors. These findings lead us back to the possible explanation that non‐ACS troponin elevation stands as an independent risk factor, and that ACS patients have a distinct advantage in the myriad treatments available. If ACS patients were misdiagnosed as non‐ACS and failed to receive appropriate treatments, that might have contributed to higher mortality; however, we consider that unlikely given that the goal of the QI project was to minimize missed ACS diagnoses.
The overall mortality risk in our study was high: 12.7% at 30 days and 37.6% at 1 year. This reflects the high‐risk population with elevated troponin seen at our facility with ages nearly 70 years and high prevalence of multiple cardiovascular risk factors. Despite a high event rate, many clinically relevant risk factors were not retained in our Cox hazard model. Among sepsis patients, elevation in troponin is associated with mortality[14]; however, in our population neither fever or white blood cell count were significant mortality factors. The relationship between chronic kidney disease and troponin is complex. Renal dysfunction may result in troponin elevation and troponin elevation is a predictor of risk within kidney disease patients.[15] In our study, we did not evaluate chronic kidney disease as a predictor, instead opting to use the serum creatinine. This was not associated with mortality except at the 6‐year time point.
The TIMI score was not associated with mortality in either the overall population or the ACS cohort. The proportion of patients in our cohort with TIMI score under 3 was 16.5% as compared with 21.6% in the original derivation study.[16] The limited data on the prognostic value of the TIMI score within a veteran population suggest a modest predictive capacity.[17] Our data raises the possibility that TIMI is not an optimal choice; however, our analysis only includes all‐cause mortality, different from the original intended use of TIMI, predicting a variety of major cardiac events.
Our data confirm that ACS can be detected in a wide range of clinical presentations. Within our population of troponin positive patients, those with chest pain were most likely to be diagnosed with ACS, although one‐third of chest pain patients were felt to have a non‐ACS diagnosis. On the opposite end of the spectrum, an elevation in troponin with altered mental status or confusion was rarely diagnosed as ACSonly 18% of the time. Many symptoms were poor predictors of ACS; however, none were low enough to disregard. Our data would suggest that most patients with elevated troponin warrant evaluation by a cardiovascular expert.
Our study population came from a single VA hospital that is comprised of elderly and predominantly male patients limiting applicability to other populations. Despite this, other investigations in younger populations and with a higher proportion of women have found similar mortality trends.[4, 8, 12] We did not have sufficient data to determine the cause of death or to further classify as cardiac versus noncardiac; knowledge of the cause of the specific death may better inform future investigations into this important clinical question. Our investigation did not use a standardized definition to determine ACS, a notable limitation that could introduce bias or variation in care. Because all determinations about ACS were made prospectively as part of a QI project, we have little reason to suspect any systematic bias to the determination of ACS. With regard to variation in care, we have previously presented data demonstrating consistent rates of ACS diagnosis across the physicians at our facility.
Based on our investigation and others on this topic, non‐ACS troponin elevation is a common, high‐risk clinical scenario. In our cohort, non‐ACS troponin elevation is about twice as frequent as ACS, and the problem is likely to grow dramatically within the next few years as ultrasensitive troponin assays are eventually approved for use in the United States. These assays are much more sensitive than the current assays, and may make it challenging to distinguish between someone with an acute supply/demand mismatch from someone with an elevated troponin due to chronic, but stable, illness such as CAD, heart failure, or diabetes. Non‐ACS troponin elevation remains poorly understood, with no viable treatment options other than addressing the pathophysiology resulting in the troponin elevation. Due to the heterogeneity of the diagnoses and pathophysiological conditions that result in elevated troponin, a unifying treatment is not likely feasible.
In conclusion, in this elderly, male veteran population, the mortality impact associated with a cardiac troponin elevation was not limited to ACS, as mortality was high among those without ACS. Factors independently associated with this non‐ACS mortality risk were plausible, but did not elucidate the reasons why non‐ACS troponin elevation carries a higher risk. Attempting to better understand the biological basis for the troponin elevation in these non‐ACS patients is a critical unmet need.
Disclosure
Nothing to report.
- , , , , . Prognostic significance of elevated troponin in non‐cardiac hospitalized patients: a systematic review and meta‐analysis. Ann Med. 2014;46:653–663.
- , , , , , ; Joint ESC/ACCF/AHA/WHF Task Force for Universal Definition of Myocardial Infarction. Third universal definition of myocardial infarction. J Am Coll Cardiol. 2012;60:1581–1598.
- , , , et al.; ACC/AHA Task Force Members; Society for Cardiovascular Angiography and Interventions and the Society of Thoracic Surgeons. 2014 AHA/ACC guideline for the management of patients with non‐st‐elevation acute coronary syndromes: executive summary: a report of the American College of Cardiology/American Heart Association Task Force on Practice Guidelines. Circulation. 2014;130:2354–2394.
- , , , , , . Acute coronary syndrome vs nonspecific troponin elevation: clinical predictors and survival analysis. Arch Intern Med. 2007;167:276–281.
- , , , , , , TOTAL‐AMI study group. Type 2 myocardial infarction in clinical practice. Heart. 2015;101:101–106.
- , , , et al. Outcomes of hospitalized patients with non‐acute coronary syndrome and elevated cardiac troponin level. Am J Med. 2011;124:630–635.
- , , , et al. Classification of myocardial infarction: frequency and features of type 2 myocardial infarction. Am J Med. 2013;126:789–797.
- , , , , . Cardiac troponin I elevation in hospitalized patients without acute coronary syndromes. Am J Cardiol. 2008;101:1384–1388.
- , , , . Inter‐provider variation in diagnoses and cardiac catheterization use (abstract). Cardiology. 2014;128:346.
- , , , . A primer and comparative review of major us mortality databases. Ann Epidemiol. 2002;12:462–468.
- , , . Assessment of vital status in department of veterans affairs national databases. Comparison with state death certificates. Ann Epidemiol. 2001;11:286–291.
- , , , , , . Raised cardiac troponin T levels in patients without acute coronary syndrome. Postgrad Med J. 2007;83:200–205.
- , , , , . Rapid response teams: a systematic review and meta‐analysis. Arch Intern Med. 2010;170:18–26.
- , , , , . Prognostic value of troponins in sepsis: a meta‐analysis. Intensive Care Med. 2013;39:1181–1189.
- , , , et al. Prognostic value of cardiac troponin in patients with chronic kidney disease without suspected acute coronary syndrome: a systematic review and meta‐analysis. Ann Intern Med. 2014;161:491–501.
- , , , et al. The TIMI risk score for unstable angina/non‐ST elevation MI: a method for prognostication and therapeutic decision making. JAMA. 2000;284:835–842.
- , , , , , . Usefulness of the TIMI risk score in predicting both short‐ and long‐term outcomes in the Veterans Affairs non‐Q‐wave myocardial infarction strategies in‐hospital (VANQWISH) trial. Am J Cardiol. 2002;90:922–926.
Acute coronary syndromes (ACS) are potentially lethal and present with a wide variety of symptoms. As such, physicians frequently order cardiac biomarkers, such as cardiac troponin, for patients with acute complaints. Elevated troponin is associated with higher risk of mortality regardless of the causes, which can be myriad, both chronic and acute.[1] Among patients with an elevated troponin, distinguishing ACS from non‐ACS can be challenging.
Making the distinction between ACS and non‐ACS troponin elevation is crucial because the underlying pathophysiology and subsequent management strategies are markedly different.[2] According to evidence‐based practice guidelines, ACS is managed with antiplatelet drugs, statins, and percutaneous coronary intervention, improving clinical outcomes.[3] In contrast, care for patients with non‐ACS troponin elevations is usually supportive, with a focus on the underlying conditions. The lack of specific treatment options for such patients is concerning given that several series have suggested that non‐ACS troponin patients may have a higher mortality risk than ACS patients.[4, 5, 6] Non‐ACS troponin elevation can be the result of a multitude of conditions.[7, 8] What remains unclear at this point is whether the excess mortality observed with non‐ACS troponin elevation is due to myocardial damage or to the underlying conditions that predispose to troponin release.
Using data from a quality improvement (QI) project collected at our Veterans Affairs (VA) medical center, we investigated the mortality risk associated with ACS and non‐ACS troponin elevation including an analysis of factors associated with mortality. We hypothesized that non‐ACS troponin elevation will have a higher mortality risk than troponin elevation due to ACS, and that important contributors to this relationship could be identified to provide direction for future investigation directed at modifying this mortality risk.
METHODS
We analyzed data that were prospectively collected for a quality initiative between 2006 and 2007. The project was a collaborative endeavor between cardiology, hospital medicine, and emergency medicine with the process goal of better identifying patients with ACS to hopefully improve outcomes. The QI team was consulted in real time to assist with treatment recommendations; no retrospective decisions were made regarding whether or not ACS was present. As the goal of the project was to improve cardiovascular outcomes, consultative advice was freely provided, and no physicians or teams were subject to any adverse repercussions for their diagnoses or management decisions.
A cardiologist‐led team was created to improve quality of care for myocardial infarction patients by evaluating all patients at our facility with an elevated troponin. On a daily basis, a specialist clinical coordinator (nurse practitioner or physician assistant) received a list of all patients with elevated troponin from the chemistry lab. The coordinator reviewed the patients' medical records with a cardiologist. A positive troponin was defined as a troponin T level of greater than 0.03 ng/mL (99th percentile at our facility). Each attending cardiologist prospectively determined if troponin elevation was related to clinical findings consistent with an ACS based on review of the patients' symptoms (duration, quality, severity, chronicity, and alleviating/aggravating factors), medical history, and noninvasive cardiac testing including electrocardiograms, cardiac biomarkers, and any other available imaging tests.
We have previously demonstrated that the cardiologists at our facility have a similar rate of diagnosing ACS.[9] All cardiologists at our facility maintain current American Board of Internal Medicine certification in cardiovascular disease and have academic appointments at the University of Florida College of Medicine. All patients were followed prospectively, and data on their medical history, acute evaluation, and outcomes were tracked in an electronic database. Given the higher risk of mortality with ST‐elevation myocardial infarction, such patients were excluded from this investigation. By definition, patients with unstable angina do not have elevated biomarkers and thus would not have been included in the database to begin with. Prospectively recorded data elements included: age, gender, chief complaint, tobacco use, presence of hypertension, hyperlipidemia, prior coronary disease, chronic kidney disease, diabetes mellitus, cardiac troponin values, serum creatinine, electrocardiogram (ECG) variables, Thrombolysis in Myocardial Infarction (TIMI) score, and if the patient was placed under hospice care or an active do‐not‐resuscitate (DNR) order. Additional data elements gathered at a later date included maximum temperature, white blood cell count, N‐terminal pro‐brain natriuretic peptide (NT‐proBNP), administration of advanced cardiac life support (ACLS), and admission to an intensive care unit (ICU). All consecutive patients with elevated troponin were included in the database; if patients were included more than once, we used their index evaluation only. All patients with troponin elevation after revascularization (percutaneous coronary intervention or coronary bypass surgery) were excluded. Our investigational design was reviewed by our institutional review board, who waived the requirement for formal written informed consent and approved use of data from this QI project for research purposes.
We focused this investigation on an analysis of all‐cause mortality in February 2014. We analyzed mortality at 30 days, 1 year, and 6 years. As secondary outcomes we analyzed the likelihood of the patients' chief complaint for the diagnosis of ACS and evaluated predictors of mortality based on Cox proportional hazard modeling. Mortality within the VA system is reliably tracked and compares favorably to the Social Security National Death Index Master File for accuracy.[10, 11]
Categorical variables were compared by 2 test. The Student t test was used to compare normally distributed continuous variables, and nonparametric tests were used for non‐normal distributions as appropriate. Mortality data at 30 days, 1 year, and 6 years were compared by log‐rank test and Kaplan‐Meier graphs. A formal power analysis was not performed; the entire available population was included. A Cox proportional hazard model was created to estimate mortality risk at each time point. Variables included in our Cox regression model were age, gender, history of coronary artery disease (CAD), hypertension, diabetes mellitus or hyperlipidemia, ACS diagnosis, dynamic ECG changes, TIMI risk score, initial troponin level, creatinine level at time of initial troponin (per mg/dL), presence of fever, maximum white blood cell count, NT‐proBNP level (per 1000 pg/mL), if ACLS was performed, if the patient was under hospice care, if there was a DNR order, and if they required ICU admission. This model was also constructed independently for the ACS and non‐ACS cohorts for mortality at 1 year. A forward stepwise model was used. Statistical results were considered significant at P 0.05. Statistical analyses were performed using SPSS version 21 (IBM, Armonk, NY).
RESULTS
Among the 761 patients, 502 (66.0%) were classified as non‐ACS and 259 (34.0%) as ACS (Table 1). The mean age was higher in the non‐ACS group (71 years vs 69 years in the ACS group, P = 0.006). Hypertension, diabetes mellitus, and prior CAD were frequent in both groups and not significantly different. Median initial troponin T was higher in the ACS group (0.12 ng/mL vs 0.06 ng/mL, P 0.001) as were the frequency of a TIMI risk score >2 (92.5% vs 74.3%, P 0.001) and new ECG changes (29.7% vs 8.2%, P 0.001). Hospice, DNR orders, and administration of ACLS were not different between groups; however, admission to the ICU was more frequent in the ACS group (44.8% vs 31.9%, P 0.001). Chest pain was the symptom with the highest positive predictive value for the diagnosis of ACS (63.3%), whereas the least predictive was altered mental status or confusion (18.0%) (Figure 1).
| Non‐ACS, N = 502 | ACS, N = 259 | P Value | |
|---|---|---|---|
| |||
| Baseline characteristics, n (%) | |||
| Age, y | 71 11 | 69 11 | 0.006 |
| Female | 6 (1.2%) | 1 (0.4%) | 0.27 |
| Coronary artery disease | 244 (48.6%) | 141 (54.4%) | 0.13 |
| Hypertension | 381 (75.9%) | 203 (78.4%) | 0.44 |
| Diabetes mellitus | 220 (43.8%) | 119 (45.9%) | 0.58 |
| Hyperlipidemia | 268 (53.4%) | 170 (65.6%) | 0.001 |
| Current smoker | 24 (4.8%) | 49 (18.9%) | 0.001 |
| Clinical presentation | |||
| Initial troponin T, ng/mL, median [IQR] | 0.06 [0.040.11] | 0.12 [0.050.32] | 0.001 |
| White cell count, 109/L, median [IQR] | 10 [8.014.0] | 11 [8.015.0] | 0.005 |
| NT‐proBNP, pg/mL, median [IQR] | 3,531 [1,20110,519] | 1,932 [3199,100] | 0.001 |
| Creatinine, mg/dL, median [IQR] | 1.6 [1.12.4] | 1.1 [0.91.5] | 0.001 |
| New ECG changes, no. (%) | 41 (8.2%) | 77 (29.7%) | 0.001 |
| TIMI score over 2, no. (%) | 365 (74.3%) | 235 (92.5%) | 0.001 |
| Fever (over 100.4 F), no. (%) | 75 (15.0%) | 38 (14.7%) | 0.91 |
| Hospice, no. (%) | 8 (1.6%) | 5 (1.9%) | 0.73 |
| Do not resuscitate, no. (%) | 62 (12.4%) | 30 (11.6%) | 0.76 |
| Intensive care admission, no. (%) | 160 (31.9%) | 116 (44.8%) | 0.001 |
| ACLS administered, no. (%) | 38 (7.6%) | 17 (6.6%) | 0.6 |
| Outcomes, no. (%) | |||
| Death, 30 days | 67 (13.3%) | 30 (11.6%) | 0.49 |
| Death, 1 year | 211 (42.0%) | 75 (29.0%) | 0.001 |
| Death, 6 years | 390 (77.7%) | 152 (58.7%) | 0.001 |
Mortality at 30 days was not different between the 2 groups, but mortality was higher for the non‐ACS cohort at 1 year and at 6 years (Table 1). Kaplan‐Meier curves demonstrate that mortality for the 2 cohorts begins to diverge between 30 and 60 days until approximately 2 years when the curves again are parallel (Figure 2).
In Cox proportional hazards models, 5 factors were associated with higher mortality at 30 days, 1 year, and at 6 years: age, hospice, DNR order, need for ACLS, and admission to the ICU (Table 2). Additionally, at 1 and 6 years, NT‐proBNP and non‐ACS were associated with higher mortality. At 6 years, creatinine was an additional significant factor. We separated the ACS and non‐ACS cohorts and performed the same model for 1‐year mortality (Table 3). The models yielded similar factors associated with higher mortality: hospice, DNR order, need for ACLS, age, and NT‐proBNP, with ICU admission being significant only in the non‐ACS cohort.
| P Value | Hazard Ratio | 95% CI | |
|---|---|---|---|
| |||
| 30 days | |||
| Intensive care unit admission | 0.0001 | 2.18 | 1.283.72 |
| Hospice | 0.0001 | 4.67 | 1.9111.40 |
| Do not resuscitate | 0.0001 | 3.19 | 1.945.24 |
| ACLS performed | 0.0001 | 10.17 | 6.0317.17 |
| Age, per year | 0.0001 | 1.04 | 1.021.06 |
| 1 year | |||
| Intensive care unit admission | 0.0001 | 1.66 | 1.262.20 |
| Hospice | 0.0001 | 4.98 | 2.699.21 |
| Do not resuscitate | 0.0001 | 2.52 | 1.833.47 |
| Non‐ACS | 0.0001 | 1.57 | 1.192.08 |
| ACLS performed | 0.0001 | 6.03 | 4.178.72 |
| Age, per year | 0.0001 | 1.03 | 1.021.04 |
| NT‐proBNP, per 1,000 pg/mL | 0.0001 | 1.02 | 1.011.03 |
| Extended follow‐up | |||
| Intensive care unit admission | 0.0001 | 1.35 | 1.111.65 |
| Hospice | 0.0001 | 3.81 | 2.136.81 |
| Do not resuscitate | 0.0001 | 2.11 | 1.622.74 |
| Non‐ACS | 0.0001 | 1.53 | 1.251.88 |
| ACLS performed | 0.0001 | 4.19 | 3.015.84 |
| Age, per year | 0.0001 | 1.03 | 1.031.04 |
| Creatinine, per mg/dL | 0.02 | 1.06 | 1.011.12 |
| NT‐proBNP, per 1,000 pg/mL | 0.0001 | 1.02 | 1.021.03 |
| P Value | Hazard Ratio | 95% CI | |
|---|---|---|---|
| |||
| Non‐ACS | |||
| Intensive care unit admission | 0.0001 | 1.86 | 1.352.58 |
| Hospice | 0.0001 | 7.55 | 3.5715.93 |
| Do not resuscitate | 0.0001 | 2.33 | 1.603.41 |
| ACLS performed | 0.0001 | 4.42 | 2.836.92 |
| Age, per year | 0.0001 | 1.03 | 1.011.04 |
| NT‐proBNP, per 1,000 pg/mL | 0.002 | 1.02 | 1.011.03 |
| Clinical ACS | |||
| Hospice | 0.036 | 3.17 | 1.089.32 |
| Do not resuscitate | 0.003 | 2.49 | 1.364.55 |
| ACLS performed | 0.0001 | 12.04 | 6.3322.91 |
| Age, per year | 0.0001 | 1.05 | 1.021.07 |
| NT‐proBNP, per 1,000 pg/mL | 0.001 | 1.04 | 1.011.06 |
DISCUSSION
Our findings confirm the important, but perhaps not well‐recognized, fact that an elevated troponin without ACS is associated with higher mortality than with ACS. This has been previously observed in veteran and nonveteran populations.[4, 6, 8, 12] The novel finding from our investigation is that mortality risk with troponin elevation is most strongly associated with unmodifiable clinical factors that are plausible explanations of risk. Furthermore, the distribution of these factors between our 2 cohorts does not sufficiently explain the difference in risk between ACS and non‐ACS patients.
At each time point we evaluated, ICU admission and need for ACLS were associated with mortality. These are indicators of a severely ill population and are not surprising to find associated with mortality. Many hospitals have instituted some form of pre‐code approach or rapid response team to identify patients before they need ACLS. These efforts, although well meaning, have not yielded convincing results of effectiveness.[13] Hospice and DNR patients were also, not surprisingly, associated with higher mortality. Although these factors were statistically significant, the low prevalence suggests that they are not clinically impactful on the primary questions of the investigation. These factors can be altered but are not intended as modifiable as they reflect the wishes of patients and their decision makers. The distribution of the factors in our model, however, did not adequately explain the higher risk of death with non‐ACS troponin elevation. For example, ACLS administration, hospice care, and DNR orders were strong predictors but were similar between the groups. ICU admission was actually more common with ACS patients, despite strong association with mortality. Age and NT‐proBNP were associated with mortality and higher in the non‐ACS group; however the magnitude of hazard was less than for the other factors. These findings lead us back to the possible explanation that non‐ACS troponin elevation stands as an independent risk factor, and that ACS patients have a distinct advantage in the myriad treatments available. If ACS patients were misdiagnosed as non‐ACS and failed to receive appropriate treatments, that might have contributed to higher mortality; however, we consider that unlikely given that the goal of the QI project was to minimize missed ACS diagnoses.
The overall mortality risk in our study was high: 12.7% at 30 days and 37.6% at 1 year. This reflects the high‐risk population with elevated troponin seen at our facility with ages nearly 70 years and high prevalence of multiple cardiovascular risk factors. Despite a high event rate, many clinically relevant risk factors were not retained in our Cox hazard model. Among sepsis patients, elevation in troponin is associated with mortality[14]; however, in our population neither fever or white blood cell count were significant mortality factors. The relationship between chronic kidney disease and troponin is complex. Renal dysfunction may result in troponin elevation and troponin elevation is a predictor of risk within kidney disease patients.[15] In our study, we did not evaluate chronic kidney disease as a predictor, instead opting to use the serum creatinine. This was not associated with mortality except at the 6‐year time point.
The TIMI score was not associated with mortality in either the overall population or the ACS cohort. The proportion of patients in our cohort with TIMI score under 3 was 16.5% as compared with 21.6% in the original derivation study.[16] The limited data on the prognostic value of the TIMI score within a veteran population suggest a modest predictive capacity.[17] Our data raises the possibility that TIMI is not an optimal choice; however, our analysis only includes all‐cause mortality, different from the original intended use of TIMI, predicting a variety of major cardiac events.
Our data confirm that ACS can be detected in a wide range of clinical presentations. Within our population of troponin positive patients, those with chest pain were most likely to be diagnosed with ACS, although one‐third of chest pain patients were felt to have a non‐ACS diagnosis. On the opposite end of the spectrum, an elevation in troponin with altered mental status or confusion was rarely diagnosed as ACSonly 18% of the time. Many symptoms were poor predictors of ACS; however, none were low enough to disregard. Our data would suggest that most patients with elevated troponin warrant evaluation by a cardiovascular expert.
Our study population came from a single VA hospital that is comprised of elderly and predominantly male patients limiting applicability to other populations. Despite this, other investigations in younger populations and with a higher proportion of women have found similar mortality trends.[4, 8, 12] We did not have sufficient data to determine the cause of death or to further classify as cardiac versus noncardiac; knowledge of the cause of the specific death may better inform future investigations into this important clinical question. Our investigation did not use a standardized definition to determine ACS, a notable limitation that could introduce bias or variation in care. Because all determinations about ACS were made prospectively as part of a QI project, we have little reason to suspect any systematic bias to the determination of ACS. With regard to variation in care, we have previously presented data demonstrating consistent rates of ACS diagnosis across the physicians at our facility.
Based on our investigation and others on this topic, non‐ACS troponin elevation is a common, high‐risk clinical scenario. In our cohort, non‐ACS troponin elevation is about twice as frequent as ACS, and the problem is likely to grow dramatically within the next few years as ultrasensitive troponin assays are eventually approved for use in the United States. These assays are much more sensitive than the current assays, and may make it challenging to distinguish between someone with an acute supply/demand mismatch from someone with an elevated troponin due to chronic, but stable, illness such as CAD, heart failure, or diabetes. Non‐ACS troponin elevation remains poorly understood, with no viable treatment options other than addressing the pathophysiology resulting in the troponin elevation. Due to the heterogeneity of the diagnoses and pathophysiological conditions that result in elevated troponin, a unifying treatment is not likely feasible.
In conclusion, in this elderly, male veteran population, the mortality impact associated with a cardiac troponin elevation was not limited to ACS, as mortality was high among those without ACS. Factors independently associated with this non‐ACS mortality risk were plausible, but did not elucidate the reasons why non‐ACS troponin elevation carries a higher risk. Attempting to better understand the biological basis for the troponin elevation in these non‐ACS patients is a critical unmet need.
Disclosure
Nothing to report.
- , , , , . Prognostic significance of elevated troponin in non‐cardiac hospitalized patients: a systematic review and meta‐analysis. Ann Med. 2014;46:653–663.
- , , , , , ; Joint ESC/ACCF/AHA/WHF Task Force for Universal Definition of Myocardial Infarction. Third universal definition of myocardial infarction. J Am Coll Cardiol. 2012;60:1581–1598.
- , , , et al.; ACC/AHA Task Force Members; Society for Cardiovascular Angiography and Interventions and the Society of Thoracic Surgeons. 2014 AHA/ACC guideline for the management of patients with non‐st‐elevation acute coronary syndromes: executive summary: a report of the American College of Cardiology/American Heart Association Task Force on Practice Guidelines. Circulation. 2014;130:2354–2394.
- , , , , , . Acute coronary syndrome vs nonspecific troponin elevation: clinical predictors and survival analysis. Arch Intern Med. 2007;167:276–281.
- , , , , , , TOTAL‐AMI study group. Type 2 myocardial infarction in clinical practice. Heart. 2015;101:101–106.
- , , , et al. Outcomes of hospitalized patients with non‐acute coronary syndrome and elevated cardiac troponin level. Am J Med. 2011;124:630–635.
- , , , et al. Classification of myocardial infarction: frequency and features of type 2 myocardial infarction. Am J Med. 2013;126:789–797.
- , , , , . Cardiac troponin I elevation in hospitalized patients without acute coronary syndromes. Am J Cardiol. 2008;101:1384–1388.
- , , , . Inter‐provider variation in diagnoses and cardiac catheterization use (abstract). Cardiology. 2014;128:346.
- , , , . A primer and comparative review of major us mortality databases. Ann Epidemiol. 2002;12:462–468.
- , , . Assessment of vital status in department of veterans affairs national databases. Comparison with state death certificates. Ann Epidemiol. 2001;11:286–291.
- , , , , , . Raised cardiac troponin T levels in patients without acute coronary syndrome. Postgrad Med J. 2007;83:200–205.
- , , , , . Rapid response teams: a systematic review and meta‐analysis. Arch Intern Med. 2010;170:18–26.
- , , , , . Prognostic value of troponins in sepsis: a meta‐analysis. Intensive Care Med. 2013;39:1181–1189.
- , , , et al. Prognostic value of cardiac troponin in patients with chronic kidney disease without suspected acute coronary syndrome: a systematic review and meta‐analysis. Ann Intern Med. 2014;161:491–501.
- , , , et al. The TIMI risk score for unstable angina/non‐ST elevation MI: a method for prognostication and therapeutic decision making. JAMA. 2000;284:835–842.
- , , , , , . Usefulness of the TIMI risk score in predicting both short‐ and long‐term outcomes in the Veterans Affairs non‐Q‐wave myocardial infarction strategies in‐hospital (VANQWISH) trial. Am J Cardiol. 2002;90:922–926.
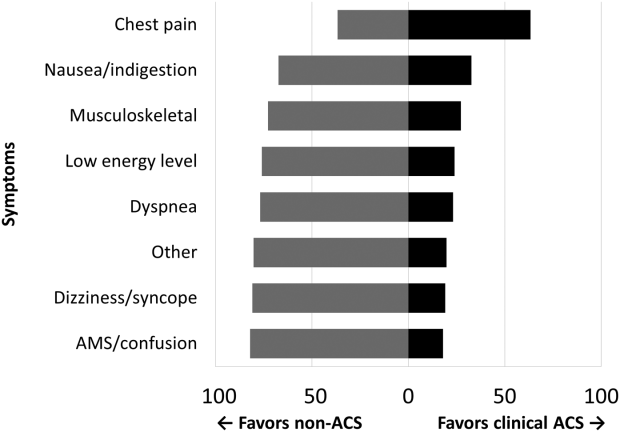
Clinical Alerts Predict Readmission
Rapid response systems (RRSs) have been developed to identify and treat deteriorating patients on general hospital units.[1] The most commonly proposed approach to the problem of identifying and stabilizing deteriorating hospitalized patients includes some combination of an early warning system to detect the deterioration and an RRS to deal with it. We previously demonstrated that a relatively simple hospital‐specific prediction model employing routine laboratory values and vital sign data is capable of predicting clinical deterioration, the need for intensive care unit (ICU) transfer, and hospital mortality in patients admitted to general medicine units.[2, 3, 4, 5, 6]
Hospital readmissions within 30 days of hospital discharge occur often and are difficult to predict. Starting in 2013, readmission penalties have been applied to specific conditions in the United States (acute myocardial infarction, heart failure, and pneumonia), with the expectation that additional conditions will be added to this group in years to come.[7, 8] Unfortunately, interventions developed to date have not been universally successful in preventing hospital readmissions for various medical conditions and patient types.[9] One potential explanation for this is the inability to reliably predict which patients are at risk for readmission to better target preventative interventions. Predictors of hospital readmission can be disease specific, such as the presence of multivessel disease in patients hospitalized with myocardial infarction,[10] or more general, such as lack of available medical follow‐up postdischarge.[11] Therefore, we performed a study to determine whether the occurrence of automated clinical deterioration alerts (CDAs) predicted 30‐day hospital readmission.
METHODS
Study Location
The study was conducted on 8 general medicine units of Barnes‐Jewish Hospital, a 1250‐bed academic medical center in St. Louis, Missouri (January 15, 2015December 12, 2015). Patient care on the inpatient medicine units is delivered by either attending hospitalist physicians or housestaff physicians under the supervision of an attending physician. The study was approved by the Washington University School of Medicine Human Studies Committee, and informed consent was waived.
Study Overview
We retrospectively evaluated all adult patients (aged >18 years) admitted through the emergency department or transferred directly to the general medicine units from other institutions. We excluded patients who died while hospitalized. All data were derived from the hospital informatics database provided by the Center for Clinical Excellence, BJC HealthCare.
Primary End Point
Readmission for any reason (ie, all‐cause readmission) to an acute care facility in the 30 days following discharge after the index hospitalization served as the primary end point. Barnes‐Jewish Hospital serves as the main teaching institution for BJC Healthcare, a large integrated healthcare system of both inpatient and outpatient care. The system includes a total of 12 hospitals and multiple community health locations in a compact geographic region surrounding and including St. Louis, Missouri, and we included readmission to any of these hospitals in our analysis. Persons treated within this healthcare system are, in nearly all cases, readmitted to 1 of the system's participating 12 hospitals. If a patient who receives healthcare in the system presents to a nonsystem hospital, he/she is often transferred back into the integrated system because of issues of insurance coverage. Patients with a 30‐day readmission were compared to those without a 30‐day readmission.
Variables
We recorded information regarding demographics, median income of the zip code of residence as a marker of socioeconomic status, admission to any BJC Healthcare facility within 6 months of the index admission, and comorbidities. To represent the global burden of comorbidities in each patient, we calculated their Charlson Comorbidity Index score.[12] Severity of illness was assessed using the All Patient RefinedDiagnosis Related Groups severity of illness score.
CDA Algorithm Overview
Details regarding the CDA model development and its implementation have been previously described in detail.[4, 5, 6] In brief, we applied logistic regression techniques to develop the CDA algorithm. Manually obtained vital signs, laboratory data, and pharmacy data inputted real time into the electronic medical record (EMR) were continuously assessed. The CDA algorithm searched for the 36 input variables (Table 1) as previously described from the EMR for all patients admitted to the 8 medicine units 24 hours per day and 7 days a week.[4, 5, 6] Values for every continuous parameter were scaled so that all measurements lay in the interval (0, 1) and were normalized by the minimum and maximum of the parameter. To capture the temporal effects in our data, we retain a sliding window of all the collected data points within the last 24 hours. We then subdivide these data into a series of n equally sized buckets (eg, 6 sequential buckets of 4 hours each). To capture variations within a bucket, we compute 3 values for each bucket: the minimum, maximum, and mean data points. Each of the resulting 3 n values are input to the logistic regression equation as separate variables.
| Age |
| Alanine aminotransferase |
| Alternative medicines |
| Anion gap |
| Anti‐infectives |
| Antineoplastics |
| Aspartate aminotransferase |
| Biologicals |
| Blood pressure, diastolic |
| Blood pressure, systolic |
| Calcium, serum |
| Calcium, serum, ionized |
| Cardiovascular agents |
| Central nervous system agents |
| Charlson Comorbidity Index |
| Coagulation modifiers |
| Estimated creatinine clearance |
| Gastrointestinal agents |
| Genitourinary tract agents |
| Hormones/hormone modifiers |
| Immunologic agents |
| Magnesium, serum |
| Metabolic agents |
| Miscellaneous agents |
| Nutritional products |
| Oxygen saturation, pulse oximetry |
| Phosphate, serum |
| Potassium, serum |
| Psychotherapeutic agents |
| Pulse |
| Radiologic agents |
| Respirations |
| Respiratory agents |
| Shock Index |
| Temperature |
| Topical agents |
The algorithm was first implemented in MATLAB (MathWorks, Natick, MA). For the purposes of training, we used a single 24‐hour window of data from each patient. The dataset's 36 input variables were divided into buckets and minimum/mean/maximum features wherever applicable, resulting in 398 variables. The first half of the original dataset was used to train the model. We then used the second half of the dataset as the validation dataset. We generated a predicted outcome for each case in the validation data, using the model parameter coefficients derived from the training data. We also employed bootstrap aggregation to improve classification accuracy and to address overfitting. We then applied various threshold cut points to convert these predictions into binary values and compared the results against the ICU transfer outcome. A threshold of 0.9760 for specificity was chosen to achieve a sensitivity of approximately 40%. These operating characteristics were chosen in turn to generate a manageable number of alerts per hospital nursing unit per day (estimated at 12 per nursing unit per day). At this cut point the C statistic was 0.8834, with an overall accuracy of 0.9292.[5] Patients with inputted data meeting the CDA threshold had a real‐time alert sent to the hospital rapid response team prompting a patient evaluation.
Statistical Analysis
The number of patients admitted to the 8 general medicine units of Barnes‐Jewish Hospital during the study period determined the sample size. Categorical variables were compared using 2 or Fisher exact test as appropriate. Continuous variables were compared using the Mann‐Whitney U test. All analyses were 2‐tailed, and a P value of 0.05 was assumed to represent statistical significance. We relied on logistic regression for identifying variables independently associated with 30‐day readmission. Based on univariate analysis, variables significant at P 0.15 were entered into the model. To arrive at the most parsimonious model, we utilized a stepwise backward elimination approach. We evaluated collinearity with the variance inflation factor. We report adjusted odds ratios (ORs) and 95% confidence intervals (CIs) where appropriate. The model's goodness of fit was assessed via calculation of the Hosmer‐Lemeshow test. Receiver operating characteristic (ROC) curves were used to compare the predictive models for 30‐day readmission with or without the CDA variable. All statistical analyses were performed using SPSS (version 22.0; IBM, Armonk, NY).
RESULTS
The final cohort had 3015 patients with a mean age of 57.5 17.5 years and 47.8% males. The most common reasons for hospital admission were infection or sepsis syndrome including pneumonia and urinary tract infections (23.6%), congestive heart failure or other cardiac conditions (18.4%), respiratory distress including chronic obstructive pulmonary disease (16.2%), acute or chronic renal failure (9.7%), gastrointestinal disorders (8.4%), and diabetes mellitus management (7.4%). Overall, there were 567 (18.8%) patients who were readmitted within 30 days of their hospital discharge date.
Table 2 shows the characteristics of patients readmitted within 30 days and of patients not requiring hospital readmission within 30 days. Patients requiring hospital readmission within 30 days were younger and had significantly more comorbidities as manifested by significantly greater Charlson scores and individual comorbidities including coronary artery disease, congestive heart disease, peripheral vascular disease, connective tissue disease, cirrhosis, diabetes mellitus with end‐organ complications, renal failure, and metastatic cancer. Patients with a 30‐day readmission had significantly longer duration of hospitalization, more emergency department visits in the 6 months prior to the index hospitalization, lower minimum hemoglobin measurements, higher minimum serum creatinine values, and were more likely to have Medicare or Medicaid insurance compared to patients without a 30‐day readmission.
| Variable | 30‐Day Readmission | P Value | |
|---|---|---|---|
| Yes (n = 567) | No (n = 2,448) | ||
| |||
| Age, y | 56.1 17.0 | 57.8 17.6 | 0.046 |
| Gender | |||
| Male | 252 (44.4) | 1,188 (48.5) | 0.079 |
| Female | 315 (55.6) | 1,260 (51.5) | |
| Race | |||
| Caucasian | 277 (48.9) | 1,234 (50.4) | 0.800 |
| African American | 257 (45.3) | 1,076 (44.0) | |
| Other | 33 (5.8) | 138 (5.6) | |
| Median income, dollars | 30,149 [25,23436,453] | 29,271 [24,83037,026] | 0.903 |
| BMI | 29.4 10.0 | 29.0 9.2 | 0.393 |
| APR‐DRG Severity of Illness Score | 2.6 0.4 | 2.5 0.5 | 0.152 |
| Charlson Comorbidity Index | 6 [39] | 5 [27] | 0.001 |
| ICU transfer during admission | 93 (16.4) | 410 (16.7) | 0.842 |
| Myocardial infarction | 83 (14.6) | 256 (10.5) | 0.005 |
| Congestive heart failure | 177 (31.2) | 540 (22.1) | 0.001 |
| Peripheral vascular disease | 76 (13.4) | 214 (8.7) | 0.001 |
| Cardiovascular disease | 69 (12.2) | 224 (9.2) | 0.029 |
| Dementia | 15 (2.6) | 80 (3.3) | 0.445 |
| Chronic obstructive pulmonary disease | 220 (38.8) | 855 (34.9) | 0.083 |
| Connective tissue disease | 45 (7.9) | 118 (4.8) | 0.003 |
| Peptic ulcer disease | 26 (4.6) | 111 (4.5) | 0.958 |
| Cirrhosis | 60 (10.6) | 141 (5.8) | 0.001 |
| Diabetes mellitus without end‐organ complications | 148 (26.1) | 625 (25.5) | 0.779 |
| Diabetes mellitus with end‐organ complications | 92 (16.2) | 197 (8.0) | 0.001 |
| Paralysis | 25 (4.4) | 77 (3.1) | 0.134 |
| Renal failure | 214 (37.7) | 620 (25.3) | 0.001 |
| Underlying malignancy | 85 (15.0) | 314 (12.8) | 0.171 |
| Metastatic cancer | 64 (11.3) | 163 (6.7) | 0.001 |
| Human immunodeficiency virus | 10 (1.8) | 47 (1.9) | 0.806 |
| Minimum hemoglobin, g/dL | 9.1 [7.411.4] | 10.7 [8.712.4] | 0.001 |
| Minimum creatinine, mg/dL | 1.12 [0.792.35] | 1.03 [0.791.63] | 0.006 |
| Length of stay, d | 3.8 [1.97.8] | 3.3 [1.85.9] | 0.001 |
| ED visit in the past year | 1 [03] | 0 [01] | 0.001 |
| Clinical deterioration alert triggered | 269 (47.4) | 872 (35.6%) | 0.001 |
| Insurance | |||
| Private | 111 (19.6) | 528 (21.6) | 0.020 |
| Medicare | 299 (52.7) | 1,217 (49.7) | |
| Medicaid | 129 (22.8) | 499 (20.4) | |
| Patient pay | 28 (4.9) | 204 (8.3) | |
There were 1141 (34.4%) patients that triggered a CDA. Patients triggering a CDA were significantly more likely to have a 30‐day readmission compared to those who did not trigger a CDA (23.6% vs 15.9%; P 0.001). Patients triggering a CDA were also significantly more likely to be readmitted within 60 days (31.7% vs 22.1%; P 0.001) and 90 days (35.8% vs 26.2%; P 0.001) compared to patients who did not trigger a CDA. Multiple logistic regression identified the triggering of a CDA to be independently associated with 30‐day readmission (OR: 1.40; 95% CI: 1.26‐1.55; P = 0.001) (Table 3). Other independent predictors of 30‐day readmission were: an emergency department visit in the previous 6 months, increasing age in 1‐year increments, presence of connective tissue disease, diabetes mellitus with end‐organ complications, chronic renal disease, cirrhosis, and metastatic cancer (Hosmer‐Lemeshow goodness of fit test, 0.363). Figure 1 reveals the ROC curves for the logistic regression model (Table 3) with and without the CDA variable. As the ROC curves document, the 2 models had similar sensitivity for the entire range of specificities. Reflecting this, the area under the ROC curve for the model inclusive of the CDA variable equaled 0.675 (95% CI: 0.649‐0.700), whereas the area under the ROC curve for the model excluding the CDA variable equaled 0.658 (95% CI: 0.632‐0.684).
| Variables | OR | 95% CI | P Value |
|---|---|---|---|
| |||
| Clinical deterioration alert | 1.40 | 1.261.55 | 0.001 |
| Age (1‐point increments) | 1.01 | 1.011.02 | 0.003 |
| Connective tissue disease | 1.63 | 1.341.98 | 0.012 |
| Cirrhosis | 1.25 | 1.171.33 | 0.001 |
| Diabetes mellitus with end‐organ complications | 1.23 | 1.131.33 | 0.010 |
| Chronic renal disease | 1.16 | 1.081.24 | 0.034 |
| Metastatic cancer | 1.12 | 1.081.17 | 0.002 |
| Emergency department visit in previous 6 months | 1.23 | 1.201.26 | 0.001 |

DISCUSSION
We demonstrated that the occurrence of an automated CDA is associated with increased risk for 30‐day hospital readmission. However, the addition of the CDA variable to the other variables identified to be independently associated with 30‐day readmission (Table 3) did not significantly add to the overall predictive accuracy of the derived logistic regression model. Other investigators have previously attempted to develop automated predictors of hospital readmission. Amarasingham et al. developed a real‐time electronic predictive model that identifies hospitalized heart failure patients at high risk for readmission or death from clinical and nonclinical risk factors present on admission.[13] Their electronic model demonstrated good discrimination for 30‐day mortality and readmission and performed as well, or better than, models developed by the Center for Medicaid and Medicare Services and the Acute Decompensated Heart Failure Registry. Similarly, Baillie et al. developed an automated prediction model that was effectively integrated into an existing EMR and identified patients on admission who were at risk for readmission within 30 days of discharge.[14] Our automated CDA differs from these previous risk predictors by surveying patients throughout their hospital stay as opposed to identifying risk for readmission at a single time point.
Several limitations of our study should be recognized. First, this was a noninterventional study aimed at examining the ability of CDAs to predict hospital readmission. Future studies are needed to assess whether the use of enhanced readmission prediction algorithms can be utilized to avert hospital readmissions. Second, the data derive from a single center, and this necessarily limits the generalizability of our findings. As such, our results may not reflect what one might see at other institutions. For example, Barnes‐Jewish Hospital has a regional referral pattern that includes community hospitals, regional long‐term acute care hospitals, nursing homes, and chronic wound, dialysis, and infusion clinics. This may explain, in part, the relatively high rate of hospital readmission observed in our cohort. Third, there is the possibility that CDAs were associated with readmission by chance given the number of potential predictor variables examined. The importance of CDAs as a determinant of rehospitalization requires confirmation in other independent populations. Fourth, it is likely that we did not capture all hospital readmissions, primarily those occurring outside of our hospital system. Therefore, we may have underestimated the actual rates of readmission for this cohort. Finally, we cannot be certain that all important predictors of hospital readmission were captured in this study.
The development of an accurate real‐time early warning system has the potential to identify patients at risk for various adverse outcomes including clinical deterioration, hospital death, and postdischarge readmission. By identifying patients at greatest risk for readmission, valuable healthcare resources can be better targeted to such populations. Our findings suggest that existing readmission predictors may suboptimally risk‐stratify patients, and it may be important to include additional clinical variables if pay for performance and other across‐institution comparisons are to be fair to institutions that care for more seriously ill patients. The variables identified as predictors of 30‐day hospital readmission in our study, with the exception of a CDA, are all readily identifiable clinical characteristics. The modest incremental value of a CDA to these clinical characteristics suggests that they would suffice for the identification of patients at high risk for hospital readmission. This is especially important for safety‐net institutions not routinely employing automated CDAs. These safety‐net hospitals provide a disproportionate level of care for patients who otherwise would have difficulty obtaining inpatient medical care and disproportionately carry the greatest burden of hospital readmissions.[15]
Disclosure
This study was funded in part by the Barnes‐Jewish Hospital Foundation and by grant number UL1 RR024992 from the National Center for Research Resources (NCRR), a component of the National Institutes of Health (NIH), and NIH Roadmap for Medical Research. Its contents are solely the responsibility of the authors and do not necessarily represent the official views of the NCRR or NIH.
- , , . Rapid‐response teams. N Engl J Med. 2011;365:139–146.
- , , , , , . Early prediction of septic shock in hospitalized patients. J Hosp Med. 2010;5:19–25.
- , , , et al. Implementation of a real‐time computerized sepsis alert in nonintensive care unit patients. Crit Care Med. 2011;39:469–473.
- , , , et al. Toward a two‐tier clinical warning system for hospitalized patients. AMIA Annu Symp Proc. 2011;2011:511–519.
- , , , et al. A trial of a real‐time alert for clinical deterioration in patients hospitalized on general medical wards. J Hosp Med. 2013;8:236–242.
- , , , et al. A randomized trial of real‐time automated clinical deterioration alerts sent to a rapid response team. J Hosp Med. 2014;9:424–429.
- , . Revisiting hospital readmissions JAMA. 2013;309:398–400.
- , , , . Adverse outcomes associated with delayed intensive care unit transfers in an integrated healthcare system. J Hosp Med. 2012;7:224–230.
- , , , , . Interventions to reduce 30‐day rehospitalization: a systematic review. Ann Intern Med. 2011; 155:520–528.
- , , , et al. International variation in and factors associated with hospital readmission after myocardial infarction. JAMA. 2012;307:66–74.
- , , , , . Predictors of early readmission among patients 40 to 64 years of age hospitalized for chronic obstructive pulmonary disease. Ann Am Thorac Soc. 2014;11:685–694.
- , , , , , . Assessing illness severity: does clinical judgement work? J Chronic Dis. 1986;39:439–452.
- , , , et al. An automated model to identify heart failure patients at risk for 30‐day readmission or death using electronic medical record data. Med Care. 2010;48:981–988.
- , , , et al. The readmission risk flag: using the electronic health record to automatically identify patients at risk for 30‐day readmission. J Hosp Med. 2013;8:689–695.
- , , . The Medicare hospital readmissions reduction program: time for reform. JAMA. 2015;314:347–348.
Rapid response systems (RRSs) have been developed to identify and treat deteriorating patients on general hospital units.[1] The most commonly proposed approach to the problem of identifying and stabilizing deteriorating hospitalized patients includes some combination of an early warning system to detect the deterioration and an RRS to deal with it. We previously demonstrated that a relatively simple hospital‐specific prediction model employing routine laboratory values and vital sign data is capable of predicting clinical deterioration, the need for intensive care unit (ICU) transfer, and hospital mortality in patients admitted to general medicine units.[2, 3, 4, 5, 6]
Hospital readmissions within 30 days of hospital discharge occur often and are difficult to predict. Starting in 2013, readmission penalties have been applied to specific conditions in the United States (acute myocardial infarction, heart failure, and pneumonia), with the expectation that additional conditions will be added to this group in years to come.[7, 8] Unfortunately, interventions developed to date have not been universally successful in preventing hospital readmissions for various medical conditions and patient types.[9] One potential explanation for this is the inability to reliably predict which patients are at risk for readmission to better target preventative interventions. Predictors of hospital readmission can be disease specific, such as the presence of multivessel disease in patients hospitalized with myocardial infarction,[10] or more general, such as lack of available medical follow‐up postdischarge.[11] Therefore, we performed a study to determine whether the occurrence of automated clinical deterioration alerts (CDAs) predicted 30‐day hospital readmission.
METHODS
Study Location
The study was conducted on 8 general medicine units of Barnes‐Jewish Hospital, a 1250‐bed academic medical center in St. Louis, Missouri (January 15, 2015December 12, 2015). Patient care on the inpatient medicine units is delivered by either attending hospitalist physicians or housestaff physicians under the supervision of an attending physician. The study was approved by the Washington University School of Medicine Human Studies Committee, and informed consent was waived.
Study Overview
We retrospectively evaluated all adult patients (aged >18 years) admitted through the emergency department or transferred directly to the general medicine units from other institutions. We excluded patients who died while hospitalized. All data were derived from the hospital informatics database provided by the Center for Clinical Excellence, BJC HealthCare.
Primary End Point
Readmission for any reason (ie, all‐cause readmission) to an acute care facility in the 30 days following discharge after the index hospitalization served as the primary end point. Barnes‐Jewish Hospital serves as the main teaching institution for BJC Healthcare, a large integrated healthcare system of both inpatient and outpatient care. The system includes a total of 12 hospitals and multiple community health locations in a compact geographic region surrounding and including St. Louis, Missouri, and we included readmission to any of these hospitals in our analysis. Persons treated within this healthcare system are, in nearly all cases, readmitted to 1 of the system's participating 12 hospitals. If a patient who receives healthcare in the system presents to a nonsystem hospital, he/she is often transferred back into the integrated system because of issues of insurance coverage. Patients with a 30‐day readmission were compared to those without a 30‐day readmission.
Variables
We recorded information regarding demographics, median income of the zip code of residence as a marker of socioeconomic status, admission to any BJC Healthcare facility within 6 months of the index admission, and comorbidities. To represent the global burden of comorbidities in each patient, we calculated their Charlson Comorbidity Index score.[12] Severity of illness was assessed using the All Patient RefinedDiagnosis Related Groups severity of illness score.
CDA Algorithm Overview
Details regarding the CDA model development and its implementation have been previously described in detail.[4, 5, 6] In brief, we applied logistic regression techniques to develop the CDA algorithm. Manually obtained vital signs, laboratory data, and pharmacy data inputted real time into the electronic medical record (EMR) were continuously assessed. The CDA algorithm searched for the 36 input variables (Table 1) as previously described from the EMR for all patients admitted to the 8 medicine units 24 hours per day and 7 days a week.[4, 5, 6] Values for every continuous parameter were scaled so that all measurements lay in the interval (0, 1) and were normalized by the minimum and maximum of the parameter. To capture the temporal effects in our data, we retain a sliding window of all the collected data points within the last 24 hours. We then subdivide these data into a series of n equally sized buckets (eg, 6 sequential buckets of 4 hours each). To capture variations within a bucket, we compute 3 values for each bucket: the minimum, maximum, and mean data points. Each of the resulting 3 n values are input to the logistic regression equation as separate variables.
| Age |
| Alanine aminotransferase |
| Alternative medicines |
| Anion gap |
| Anti‐infectives |
| Antineoplastics |
| Aspartate aminotransferase |
| Biologicals |
| Blood pressure, diastolic |
| Blood pressure, systolic |
| Calcium, serum |
| Calcium, serum, ionized |
| Cardiovascular agents |
| Central nervous system agents |
| Charlson Comorbidity Index |
| Coagulation modifiers |
| Estimated creatinine clearance |
| Gastrointestinal agents |
| Genitourinary tract agents |
| Hormones/hormone modifiers |
| Immunologic agents |
| Magnesium, serum |
| Metabolic agents |
| Miscellaneous agents |
| Nutritional products |
| Oxygen saturation, pulse oximetry |
| Phosphate, serum |
| Potassium, serum |
| Psychotherapeutic agents |
| Pulse |
| Radiologic agents |
| Respirations |
| Respiratory agents |
| Shock Index |
| Temperature |
| Topical agents |
The algorithm was first implemented in MATLAB (MathWorks, Natick, MA). For the purposes of training, we used a single 24‐hour window of data from each patient. The dataset's 36 input variables were divided into buckets and minimum/mean/maximum features wherever applicable, resulting in 398 variables. The first half of the original dataset was used to train the model. We then used the second half of the dataset as the validation dataset. We generated a predicted outcome for each case in the validation data, using the model parameter coefficients derived from the training data. We also employed bootstrap aggregation to improve classification accuracy and to address overfitting. We then applied various threshold cut points to convert these predictions into binary values and compared the results against the ICU transfer outcome. A threshold of 0.9760 for specificity was chosen to achieve a sensitivity of approximately 40%. These operating characteristics were chosen in turn to generate a manageable number of alerts per hospital nursing unit per day (estimated at 12 per nursing unit per day). At this cut point the C statistic was 0.8834, with an overall accuracy of 0.9292.[5] Patients with inputted data meeting the CDA threshold had a real‐time alert sent to the hospital rapid response team prompting a patient evaluation.
Statistical Analysis
The number of patients admitted to the 8 general medicine units of Barnes‐Jewish Hospital during the study period determined the sample size. Categorical variables were compared using 2 or Fisher exact test as appropriate. Continuous variables were compared using the Mann‐Whitney U test. All analyses were 2‐tailed, and a P value of 0.05 was assumed to represent statistical significance. We relied on logistic regression for identifying variables independently associated with 30‐day readmission. Based on univariate analysis, variables significant at P 0.15 were entered into the model. To arrive at the most parsimonious model, we utilized a stepwise backward elimination approach. We evaluated collinearity with the variance inflation factor. We report adjusted odds ratios (ORs) and 95% confidence intervals (CIs) where appropriate. The model's goodness of fit was assessed via calculation of the Hosmer‐Lemeshow test. Receiver operating characteristic (ROC) curves were used to compare the predictive models for 30‐day readmission with or without the CDA variable. All statistical analyses were performed using SPSS (version 22.0; IBM, Armonk, NY).
RESULTS
The final cohort had 3015 patients with a mean age of 57.5 17.5 years and 47.8% males. The most common reasons for hospital admission were infection or sepsis syndrome including pneumonia and urinary tract infections (23.6%), congestive heart failure or other cardiac conditions (18.4%), respiratory distress including chronic obstructive pulmonary disease (16.2%), acute or chronic renal failure (9.7%), gastrointestinal disorders (8.4%), and diabetes mellitus management (7.4%). Overall, there were 567 (18.8%) patients who were readmitted within 30 days of their hospital discharge date.
Table 2 shows the characteristics of patients readmitted within 30 days and of patients not requiring hospital readmission within 30 days. Patients requiring hospital readmission within 30 days were younger and had significantly more comorbidities as manifested by significantly greater Charlson scores and individual comorbidities including coronary artery disease, congestive heart disease, peripheral vascular disease, connective tissue disease, cirrhosis, diabetes mellitus with end‐organ complications, renal failure, and metastatic cancer. Patients with a 30‐day readmission had significantly longer duration of hospitalization, more emergency department visits in the 6 months prior to the index hospitalization, lower minimum hemoglobin measurements, higher minimum serum creatinine values, and were more likely to have Medicare or Medicaid insurance compared to patients without a 30‐day readmission.
| Variable | 30‐Day Readmission | P Value | |
|---|---|---|---|
| Yes (n = 567) | No (n = 2,448) | ||
| |||
| Age, y | 56.1 17.0 | 57.8 17.6 | 0.046 |
| Gender | |||
| Male | 252 (44.4) | 1,188 (48.5) | 0.079 |
| Female | 315 (55.6) | 1,260 (51.5) | |
| Race | |||
| Caucasian | 277 (48.9) | 1,234 (50.4) | 0.800 |
| African American | 257 (45.3) | 1,076 (44.0) | |
| Other | 33 (5.8) | 138 (5.6) | |
| Median income, dollars | 30,149 [25,23436,453] | 29,271 [24,83037,026] | 0.903 |
| BMI | 29.4 10.0 | 29.0 9.2 | 0.393 |
| APR‐DRG Severity of Illness Score | 2.6 0.4 | 2.5 0.5 | 0.152 |
| Charlson Comorbidity Index | 6 [39] | 5 [27] | 0.001 |
| ICU transfer during admission | 93 (16.4) | 410 (16.7) | 0.842 |
| Myocardial infarction | 83 (14.6) | 256 (10.5) | 0.005 |
| Congestive heart failure | 177 (31.2) | 540 (22.1) | 0.001 |
| Peripheral vascular disease | 76 (13.4) | 214 (8.7) | 0.001 |
| Cardiovascular disease | 69 (12.2) | 224 (9.2) | 0.029 |
| Dementia | 15 (2.6) | 80 (3.3) | 0.445 |
| Chronic obstructive pulmonary disease | 220 (38.8) | 855 (34.9) | 0.083 |
| Connective tissue disease | 45 (7.9) | 118 (4.8) | 0.003 |
| Peptic ulcer disease | 26 (4.6) | 111 (4.5) | 0.958 |
| Cirrhosis | 60 (10.6) | 141 (5.8) | 0.001 |
| Diabetes mellitus without end‐organ complications | 148 (26.1) | 625 (25.5) | 0.779 |
| Diabetes mellitus with end‐organ complications | 92 (16.2) | 197 (8.0) | 0.001 |
| Paralysis | 25 (4.4) | 77 (3.1) | 0.134 |
| Renal failure | 214 (37.7) | 620 (25.3) | 0.001 |
| Underlying malignancy | 85 (15.0) | 314 (12.8) | 0.171 |
| Metastatic cancer | 64 (11.3) | 163 (6.7) | 0.001 |
| Human immunodeficiency virus | 10 (1.8) | 47 (1.9) | 0.806 |
| Minimum hemoglobin, g/dL | 9.1 [7.411.4] | 10.7 [8.712.4] | 0.001 |
| Minimum creatinine, mg/dL | 1.12 [0.792.35] | 1.03 [0.791.63] | 0.006 |
| Length of stay, d | 3.8 [1.97.8] | 3.3 [1.85.9] | 0.001 |
| ED visit in the past year | 1 [03] | 0 [01] | 0.001 |
| Clinical deterioration alert triggered | 269 (47.4) | 872 (35.6%) | 0.001 |
| Insurance | |||
| Private | 111 (19.6) | 528 (21.6) | 0.020 |
| Medicare | 299 (52.7) | 1,217 (49.7) | |
| Medicaid | 129 (22.8) | 499 (20.4) | |
| Patient pay | 28 (4.9) | 204 (8.3) | |
There were 1141 (34.4%) patients that triggered a CDA. Patients triggering a CDA were significantly more likely to have a 30‐day readmission compared to those who did not trigger a CDA (23.6% vs 15.9%; P 0.001). Patients triggering a CDA were also significantly more likely to be readmitted within 60 days (31.7% vs 22.1%; P 0.001) and 90 days (35.8% vs 26.2%; P 0.001) compared to patients who did not trigger a CDA. Multiple logistic regression identified the triggering of a CDA to be independently associated with 30‐day readmission (OR: 1.40; 95% CI: 1.26‐1.55; P = 0.001) (Table 3). Other independent predictors of 30‐day readmission were: an emergency department visit in the previous 6 months, increasing age in 1‐year increments, presence of connective tissue disease, diabetes mellitus with end‐organ complications, chronic renal disease, cirrhosis, and metastatic cancer (Hosmer‐Lemeshow goodness of fit test, 0.363). Figure 1 reveals the ROC curves for the logistic regression model (Table 3) with and without the CDA variable. As the ROC curves document, the 2 models had similar sensitivity for the entire range of specificities. Reflecting this, the area under the ROC curve for the model inclusive of the CDA variable equaled 0.675 (95% CI: 0.649‐0.700), whereas the area under the ROC curve for the model excluding the CDA variable equaled 0.658 (95% CI: 0.632‐0.684).
| Variables | OR | 95% CI | P Value |
|---|---|---|---|
| |||
| Clinical deterioration alert | 1.40 | 1.261.55 | 0.001 |
| Age (1‐point increments) | 1.01 | 1.011.02 | 0.003 |
| Connective tissue disease | 1.63 | 1.341.98 | 0.012 |
| Cirrhosis | 1.25 | 1.171.33 | 0.001 |
| Diabetes mellitus with end‐organ complications | 1.23 | 1.131.33 | 0.010 |
| Chronic renal disease | 1.16 | 1.081.24 | 0.034 |
| Metastatic cancer | 1.12 | 1.081.17 | 0.002 |
| Emergency department visit in previous 6 months | 1.23 | 1.201.26 | 0.001 |
DISCUSSION
We demonstrated that the occurrence of an automated CDA is associated with increased risk for 30‐day hospital readmission. However, the addition of the CDA variable to the other variables identified to be independently associated with 30‐day readmission (Table 3) did not significantly add to the overall predictive accuracy of the derived logistic regression model. Other investigators have previously attempted to develop automated predictors of hospital readmission. Amarasingham et al. developed a real‐time electronic predictive model that identifies hospitalized heart failure patients at high risk for readmission or death from clinical and nonclinical risk factors present on admission.[13] Their electronic model demonstrated good discrimination for 30‐day mortality and readmission and performed as well, or better than, models developed by the Center for Medicaid and Medicare Services and the Acute Decompensated Heart Failure Registry. Similarly, Baillie et al. developed an automated prediction model that was effectively integrated into an existing EMR and identified patients on admission who were at risk for readmission within 30 days of discharge.[14] Our automated CDA differs from these previous risk predictors by surveying patients throughout their hospital stay as opposed to identifying risk for readmission at a single time point.
Several limitations of our study should be recognized. First, this was a noninterventional study aimed at examining the ability of CDAs to predict hospital readmission. Future studies are needed to assess whether the use of enhanced readmission prediction algorithms can be utilized to avert hospital readmissions. Second, the data derive from a single center, and this necessarily limits the generalizability of our findings. As such, our results may not reflect what one might see at other institutions. For example, Barnes‐Jewish Hospital has a regional referral pattern that includes community hospitals, regional long‐term acute care hospitals, nursing homes, and chronic wound, dialysis, and infusion clinics. This may explain, in part, the relatively high rate of hospital readmission observed in our cohort. Third, there is the possibility that CDAs were associated with readmission by chance given the number of potential predictor variables examined. The importance of CDAs as a determinant of rehospitalization requires confirmation in other independent populations. Fourth, it is likely that we did not capture all hospital readmissions, primarily those occurring outside of our hospital system. Therefore, we may have underestimated the actual rates of readmission for this cohort. Finally, we cannot be certain that all important predictors of hospital readmission were captured in this study.
The development of an accurate real‐time early warning system has the potential to identify patients at risk for various adverse outcomes including clinical deterioration, hospital death, and postdischarge readmission. By identifying patients at greatest risk for readmission, valuable healthcare resources can be better targeted to such populations. Our findings suggest that existing readmission predictors may suboptimally risk‐stratify patients, and it may be important to include additional clinical variables if pay for performance and other across‐institution comparisons are to be fair to institutions that care for more seriously ill patients. The variables identified as predictors of 30‐day hospital readmission in our study, with the exception of a CDA, are all readily identifiable clinical characteristics. The modest incremental value of a CDA to these clinical characteristics suggests that they would suffice for the identification of patients at high risk for hospital readmission. This is especially important for safety‐net institutions not routinely employing automated CDAs. These safety‐net hospitals provide a disproportionate level of care for patients who otherwise would have difficulty obtaining inpatient medical care and disproportionately carry the greatest burden of hospital readmissions.[15]
Disclosure
This study was funded in part by the Barnes‐Jewish Hospital Foundation and by grant number UL1 RR024992 from the National Center for Research Resources (NCRR), a component of the National Institutes of Health (NIH), and NIH Roadmap for Medical Research. Its contents are solely the responsibility of the authors and do not necessarily represent the official views of the NCRR or NIH.
- , , . Rapid‐response teams. N Engl J Med. 2011;365:139–146.
- , , , , , . Early prediction of septic shock in hospitalized patients. J Hosp Med. 2010;5:19–25.
- , , , et al. Implementation of a real‐time computerized sepsis alert in nonintensive care unit patients. Crit Care Med. 2011;39:469–473.
- , , , et al. Toward a two‐tier clinical warning system for hospitalized patients. AMIA Annu Symp Proc. 2011;2011:511–519.
- , , , et al. A trial of a real‐time alert for clinical deterioration in patients hospitalized on general medical wards. J Hosp Med. 2013;8:236–242.
- , , , et al. A randomized trial of real‐time automated clinical deterioration alerts sent to a rapid response team. J Hosp Med. 2014;9:424–429.
- , . Revisiting hospital readmissions JAMA. 2013;309:398–400.
- , , , . Adverse outcomes associated with delayed intensive care unit transfers in an integrated healthcare system. J Hosp Med. 2012;7:224–230.
- , , , , . Interventions to reduce 30‐day rehospitalization: a systematic review. Ann Intern Med. 2011; 155:520–528.
- , , , et al. International variation in and factors associated with hospital readmission after myocardial infarction. JAMA. 2012;307:66–74.
- , , , , . Predictors of early readmission among patients 40 to 64 years of age hospitalized for chronic obstructive pulmonary disease. Ann Am Thorac Soc. 2014;11:685–694.
- , , , , , . Assessing illness severity: does clinical judgement work? J Chronic Dis. 1986;39:439–452.
- , , , et al. An automated model to identify heart failure patients at risk for 30‐day readmission or death using electronic medical record data. Med Care. 2010;48:981–988.
- , , , et al. The readmission risk flag: using the electronic health record to automatically identify patients at risk for 30‐day readmission. J Hosp Med. 2013;8:689–695.
- , , . The Medicare hospital readmissions reduction program: time for reform. JAMA. 2015;314:347–348.
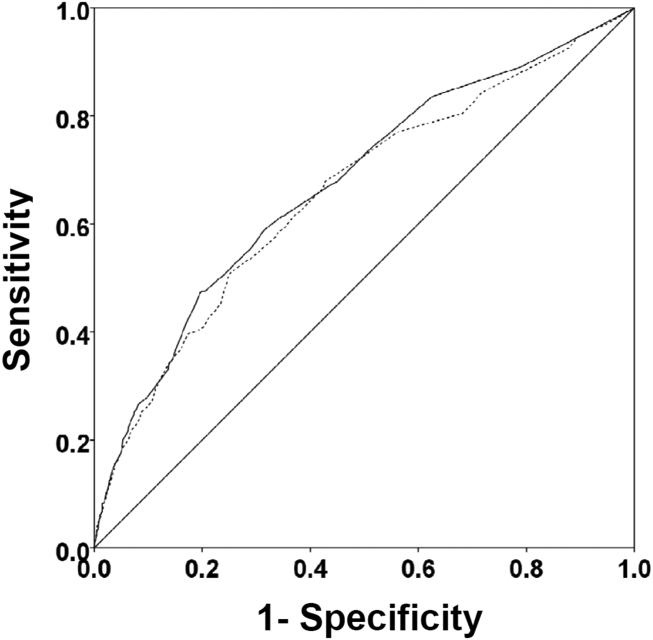
MAGS Prevalence in Older Adults
Geriatric syndromes are common clinical conditions in older adults that do not fall into specific disease categories. Unlike the traditional definition of a syndrome, geriatric syndrome refers to a condition that is mediated by multiple shared underlying risk factors.[1, 2] Conditions commonly referred to as geriatric syndromes include delirium, cognitive impairment, falls, unintentional weight loss, depressive symptoms, and incontinence. Even though many perceive it as medical misnomer,[3] geriatric syndromes have been shown to negatively impact quality of life and activities of daily living in older adults.[2] They are also associated with adverse outcomes such as increased healthcare utilization, functional decline, and mortality, even after adjusting for age and disease severity.[4, 5, 6] Hospitalized older adults, including those discharged to skilled nursing facilities (SNFs)[7, 8] are particularly at high risk for new‐onset or exacerbation of geriatric syndromes and poor outcomes.[7, 9, 10] However, hospital providers seldom assess, manage, or document geriatric syndromes because they are often overshadowed by disease conditions that lead to an acute episode requiring hospitalization (e.g., heart disease).[11]
Pharmacotherapy is the cornerstone of hospital treatment, and it is well‐known that it affects multiple physiologic systems causing side effects apart from the condition they are approved to treat. Given that geriatric syndromes are a result of impairments in multiple organ systems, it is plausible that pharmacotherapy may initiate or worsen these syndromes.[12] Medication‐related problems in older adults are well known. Polypharmacy and adverse drug events (as a result of drug‐drug/disease interactions and changes in pharmacokinetics and pharmacodynamics) are prevalent in multimorbid elderly patients.[13, 14, 15, 16] The prescribing cascade[17] increases the medication burden and may be a contributing factor for geriatric syndromes in hospitalized patients.[18] For instance, laxatives may be prescribed to counteract constipation caused by anticholinergic drugs.
The American Geriatric Society (AGS) Beers list[19, 20] and similar criteria[21] provide excellent resources to identify medications with potentially harmful interactions or adverse effects in older adults. Although these lists include medicines associated with a specific geriatric syndrome, they were not developed to explicitly link medicines across multiple geriatric syndromes, regardless of indication or appropriateness. For example, medications that effect important geriatric syndromes like unintentional weight/appetite loss, depression, and urinary incontinence are not extensively covered. In addition, disease‐appropriate medications (eg, ‐blockers for systolic heart failure), that may be associated with a geriatric syndrome (eg, falls) are not included; however, they may be important to consider for a patient and clinician who are weighing the disease benefits compared to the geriatric syndrome‐related risks. Finally, the AGS 2015 Beers criteria panel mentions the limitation that many medication associations may be excluded because older adults are less represented in clinical trials.[20] Clinicians are currently limited in identifying medications potentially contributing to a broad set of geriatric syndromes in their patients without a specific list of medications associated with geriatric syndromes (MAGS).[20]
In response to this gap, identifying these medications is important and should be a starting point in efforts toward prevention and treatment of geriatric syndromes. The 2 main objectives of this study were to first identify medications that may meaningfully contribute to 6 geriatric syndromes and subsequently describe the frequency of these medications in a population transitioning from acute care to postacute care to highlight the need and potential impact of such a list.
METHODS
This study included 2 phases that aligned with our 2 primary objectives. Phase 1 involved identifying medications associated with 6 geriatric syndromes, and phase 2 included a cross‐sectional analysis of the prevalence of these medications in a sample of patients discharged to SNFs.
Phase 1: Development of the MAGS List
Figure 1 depicts the underlying conceptual model and approach that was used in phase 1. The interaction between the patient factors and medication leads to polypharmacy that contributes to geriatric syndromes and additional adverse outcomes. As a starting point for mitigating geriatric syndromes, we used an iterative analytical process to identify a list of medications associated with the following geriatric syndromes that were documented to be highly prevalent in patients discharged to SNFs: cognitive impairment, delirium, falls, unintentional weight and/or appetite loss, urinary incontinence, and depression.[8] To be inclusive and sensitive, our approach differed from traditional systematic reviews, and in fact was meant to bring together much of the established systematic literature about disparate geriatric syndromes in 1 place, because patients often do not experience a geriatric syndrome in isolation, but rather experience multiple geriatric syndromes.[8] The MAGS list had 3 main inclusion criteria (Figure 1): (1) evidence in the published literature (systematic reviews, cohort studies, randomized clinical trials) that the medication is related to the syndrome, (2) expert panel opinion, and (3) drug databases (Lexicomp Online database[22] and/or US Food and Drug Administration [FDA]approved package inserts).[23] We generated an initial list of medications based on these 3 main criteria to identify medications with significant associations to each geriatric syndrome. The list was further expanded and vetted using an iterative review of each medication list as it related to each geriatric syndrome through a series of group meetings focused around each geriatric syndrome. Following further discussion, we obtained agreement among all team members for medications included in the final list. For each geriatric syndrome, we excluded medications from consideration if they were used to treat the same geriatric syndrome (eg, ‐adrenergic blockers used to treat incontinence in men were listed as associated with incontinence only in women). We classified medications according to the Established Pharmacologic Class available at the FDA website. We also compared our final MAGS list with the 2015 AGS Beer's list[20] by identifying medications that were related to the 6 geriatric syndromes. This included Beers[20]‐cited rationale of anticholinergic, extrapyramidal symptoms, orthostatic hypotension (eg, falls), high‐risk adverse central nervous system effects, sedating, cognitive decline (eg, antipsychotics), delirium, falls, fractures, incontinence, and gastrointestinal (eg, nausea, vomiting). Specifically, we assessed whether the medications were included as inappropriate by the AGS Beers 2015[20] list and also whether they documented the syndrome association for that medication.
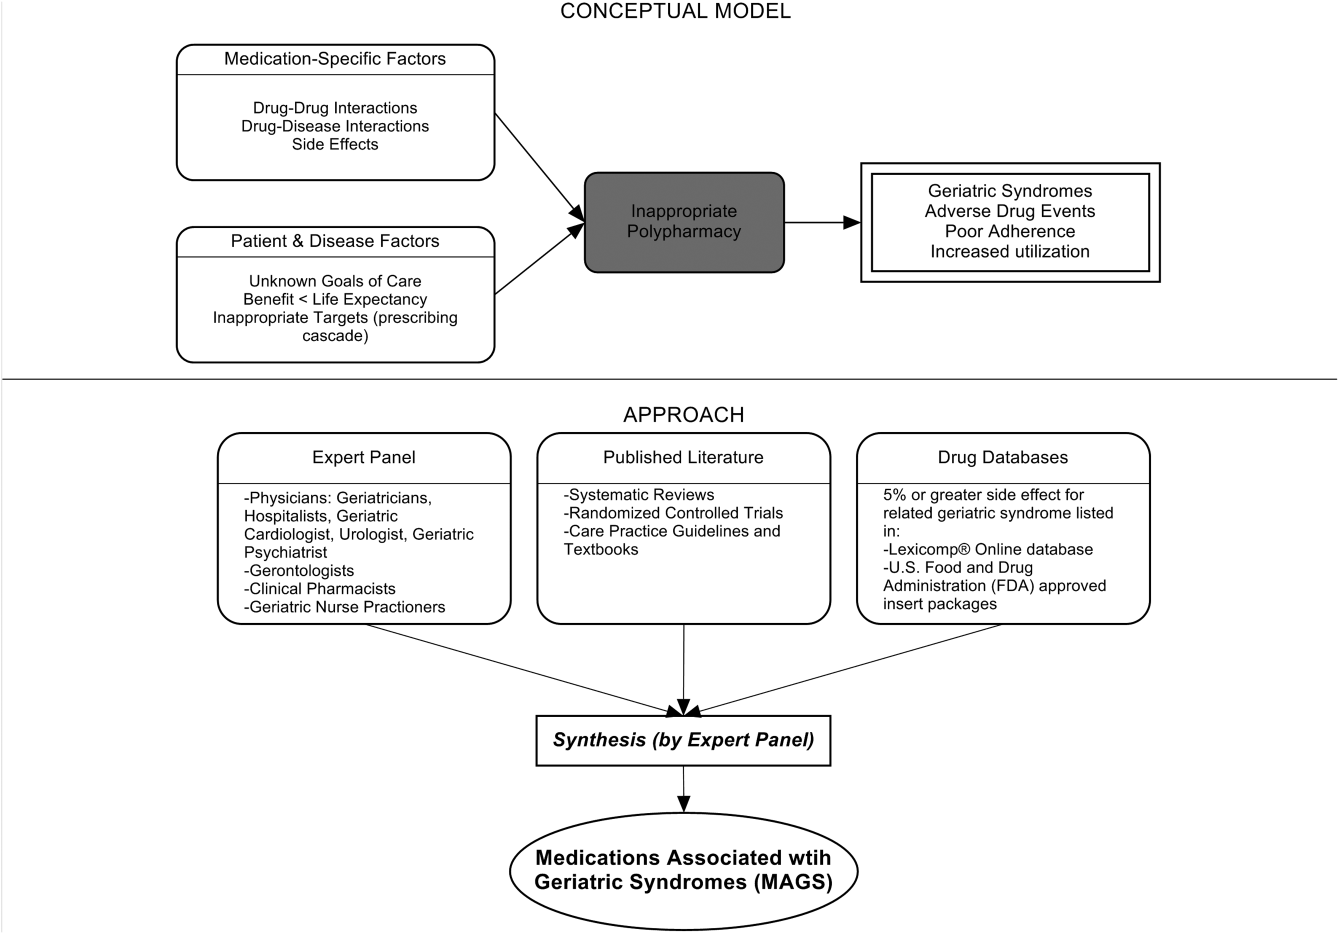
Phase 2: Prevalence of MAGS in Hospitalized Older Adults Discharged to SNFs
Sample
We next applied the MAGS list to a convenience sample of hospitalized patients discharged to SNFs to assess the prevalence of MAGS in this sample, and also to compare with the prevalence of Beers criteria[20] medications. Our sample was selected from data collected as part of a quality‐improvement project to reduce hospital readmissions in patients discharged to SNFs. The larger study enrolled a total 1093 medical and surgical patients who had Medicare insurance eligibility and were discharged from 1 large university hospital to 23 area SNFs from January 17, 2013 through July 31, 2014. The university institutional review board waived the requirement for written consent. For the purpose of this substudy. we selected the first 154 patients with complete chart abstraction (approximately 15% of the total) as a convenience sample.
Data Analysis
We applied descriptive statistics to summarize demographic and clinical characteristics of the convenience sample. To understand potential selection biases that could have resulted by the convenience sampling, we compared participant characteristics of the convenience sample (N = 154) with the characteristics of the remaining participants of the larger study (N = 939) using independent sample t tests and 2 tests for continuous and categorical measures, respectively. We applied the MAGS list and the AGS 2015 Beers criteria[20] for the sample of 154 and identified the medications associated with each of the 6 geriatric syndromes from the discharge medication lists completed by hospital clinical pharmacists. For each patient, we identified both scheduled and PRN (pro re nata, or as needed) medications associated with each geriatric syndrome. Thereafter, we determined whether the discharge list contained at least 1 medication associated with a geriatric syndrome per the MAGS list and the AGS Beers 2015 criteria,[20] and the percentage of overall medications that were part of the MAGS and Beers lists. Data were aggregated using means and standard deviations across syndromes (ie, number of discharge medications per syndrome per patient) along with the percentage of patients with 1 or more medications related to a specific syndrome and the percentage of medications that were MAGS. All analyses were performed using the SPSS statistical package (IBM SPSS Statistics for Windows, version 23.0; IBM, Armonk, NY).
RESULTS
Phase 1: MAGS List
The iterative process applied in this analysis generated a list of 513 medications associated with the 6 geriatric syndromes. The list of medications related to each syndrome and the corresponding rationale and relevant references for their inclusion is presented in the Supporting Information, Appendix 1, in the online version of this article. Table 1 summarizes these medications across 18 major drug categories. Antiepileptics were linked to all 6 geriatric syndromes, whereas antipsychotics, antidepressants, antiparkinsonism, and opioid agonists were associated with 5 syndromes. Ten of the 18 categories were associated with 3 geriatric syndromescognitive impairment, delirium, and falls. Four medication categories were associated with only 1 syndrome. Nonopioid/nonsteroidal anti‐inflammatory and/or analgesics and nonopioid cough suppressant and expectorant medications were associated with falls syndrome only. Hormone replacement medications were associated with depression only, and immunosuppressants were associated with unintentional weight and appetite loss only.
| Major Medication Category | Delirium | Cognitive Impairment | Falls | Unintentional Weight and Appetite Loss | Urinary Incontinence | Depression | Drug Class/Drug Within Each Category |
|---|---|---|---|---|---|---|---|
| |||||||
| Antipsychotics | ✓ | ✓ | ✓ | ✓ | Atypical and typical antipsychotics, buspirone | ||
| Antidepressants | ✓ | ✓ | ✓ | ✓ | ✓ | Tricyclic and tetracyclic antidepressants, serotonin reuptake inhibitors, serotonin and norepinephrine reuptake inhibitor, aminoketone | |
| Antiepileptics | ✓ | ✓ | ✓ | ✓ | ✓ | ✓ | Antiepileptics, mood stabilizers, barbiturates |
| Antiparkinsonism | ✓ | ✓ | ✓ | ✓ | ✓ | Aromatic amino acid decarboxylation inhibitor and catechol‐o‐methyltransferase inhibitor, catecholamine‐depleting sympatholytic, catechol‐o‐methyltransferase inhibitor, dopaminergic agonist, ergot derivative, monoamine oxidase inhibitor, nonergot dopamine agonist, | |
| Benzodiazapines | ✓ | ✓ | ✓ | Benzodiazapines only | |||
| Nonbenzodiazepine hypnotics | ✓ | ✓ | ✓ | Benzodiazepine analogs, nonbenzodiazepine hypnotics, tranquilizers, ‐aminobutyric acid A receptor agonist | |||
| Opioid agonists | ✓ | ✓ | ✓ | ✓ | ✓ | Full or partial opioid agonists, opiates, opioids | |
| Nonopioid/nonsteroidal anti‐inflammatory and/or analgesics | ✓ | Nonopioid analgesics, NSAIDs, COX‐2 selective inhibitor NSAIDs | |||||
| Antihypertensives | ✓ | ✓ | ✓ | Calcium channel blocker, ‐adrenergic blocker, angiotensin‐converting enzyme inhibitor, angiotensin 2 receptor blocker, ‐adrenergic blocker, diuretics (loop, potassium sparing, thiazide), nitrate vasodilators, aldosterone blocker | |||
| Antiarrhythmic | ✓ | ✓ | ✓ | Antiarrhythmics, cardiac glycosides | |||
| Antidiabetics | ✓ | ✓ | Insulin and insulin analogs, sulfonylureas, ‐glucosidase inhibitor, amylin analog, biguanide, glinide, GLP‐1 receptor agonist, glucagon‐like peptide‐1 agonist | ||||
| Anticholinergics and/or antihistaminics | ✓ | ✓ | ✓ | ✓ | Anticholinergics, histamine receptor antagonists, muscarininc antagonists, combined anticholinergics, and histamine receptor antagonists | ||
| Antiemetics | ✓ | ✓ | ✓ | Antiemetics, dopaminergic antagonists, dopamine‐2 receptor antagonist | |||
| Hormone replacement | ✓ | Corticosteroids, progestin, estrogen, estrogen agonist/antagonist, gonadotropin releasing hormone receptor agonist | |||||
| Muscle relaxers | ✓ | ✓ | ✓ | ✓ | Muscle relaxers | ||
| Immunosuppressants | ✓ | Calcineurin inhibitor immunosuppressant, folate analog metabolic inhibitor, purine antimetabolite | |||||
| Nonopioid cough suppressants and expectorants | ✓ | Expectorant, non‐narcotic antitussive, ‐1 agonist, uncompetitive N‐methyl‐D‐aspartate receptor antagonist | |||||
| Antimicrobials | ✓ | ✓ | Macrolide, cephalosporin, penicillin class, rifamycin, non‐nucleoside analog reverse transcriptase inhibitor, influenza A M2 protein inhibitor | ||||
| Others | ✓ | ✓ | ✓ | ✓ | ✓ | ✓ | ‐3‐adrenergic agonist, methylxanthine, cholinesterase inhibitor, interferon and , partial cholinergic nicotinic agonist, tyrosine hydroxylase, retinoid, serotonin‐1b and serotonin‐1d receptor agonist, stimulant laxative, vitamin K antagonist, platelet aggregation inhibitor |
Approximately 58% of the medications overlapped with the AGS 2015 Beer's Criteria[20] irrespective of whether the specific syndrome association was stated in the rationale.[20] Medications that overlapped were mostly in the delirium, cognitive impairment, and falls category with only a few overlaps in depression, unintentional weight loss, and urinary incontinence lists (see Supporting Information, Appendix 1, in the online version of this article).
Phase 2: Prevalence of MAGS
Among 154 participants, the mean age was 76.5 (10.6) years, 64.3% were female, 77.9% were white, and 96.1% non‐Hispanic. The median hospital length of stay was 6 days, with an interquartile range of 5 days. The orthopedic service discharged the highest proportion of patients (24%), followed by the geriatrics and internal medicine services, which each discharged 19.5% of the patients (Table 2). The remaining participants of the larger quality‐improvement project (N = 939) did not significantly differ on these demographic and clinical characteristics except for hospital length of stay, which was shorter in the sample analyzed (see Supporting Information, Appendix 2, in the online version of this article).
| Baseline Characteristics | Mean ( SD) or Percent (n) |
|---|---|
| |
| Age, y | 76.5 ( 10.6) |
| Sex | |
| Female | 64.3% (99) |
| Race | |
| White | 77.9% (126) |
| Black | 16.2% (25) |
| Unknown | 0.6% (1) |
| Declined | 0.6% (1) |
| Missing | 0.6% (1) |
| Ethnicity | |
| Non‐Hispanic | 96.1% (148) |
| Hispanic | 1.3% (2) |
| Unknown | 2.6% (4) |
| Hospital length of stay, d | 7.0 ( 4.2) |
| Hospital length of stay, d, median (IQR) | 6.0 (5.0) |
| No. of hospital discharge medications, count | 14.0 ( 4.7) |
| Discharge service | |
| Orthopedic service | 24.0% (37) |
| Geriatric service | 19.5% (30) |
| Internal medicine | 19.5% (30) |
| Other | 37.0% (57) |
Patients were discharged to SNFs with an average of 14.0 (4.7) medication orders. Overall, 43% (13%) of these discharge medication orders were MAGS. Every patient in the sample was ordered at least 1 medication associated with geriatric syndromes. Multiple MAGS were the norm, with an average of 5.9 (2.2) MAGS per patient. MAGS were also the norm, as 98.1% of the sample had medication orders associated with at least 2 different syndromes.
When the Beer's criteria[20] were applied to the medication orders (instead of the MAGS list), problematic medications appeared less common. Patients had an average of 3.04 (1.7) MAGS that were also listed on the AGS 2015 Beer's list,[20] representing an average of 22.3% of all discharge orders.
Table 3 illustrates the average number of medications per patient associated with each syndrome, and the percentage of patients (number in parentheses) discharged with at least 1 medication associated with each syndrome per the MAGS list and the Beers 2015 criteria.[20] For example, per the MAGS list, the syndrome most frequently associated with medications was falls, with patients discharged on an average of 5.5 (2.2) medications associated with falls, and 100% of the sample had at least 1 discharge medication associated with falls. Alternatively, the syndrome associated with the lowest frequency of medications was unintentional weight loss (with an average of 0.38 medications per patient), although 36% of these patients had more than 1 discharge medication associated with weight loss. As seen in Table 3, the mean and prevalence of 1 or more medications associated with each of the geriatric syndromes as identified by the Beers 2015 criteria[20] was lower than those identified by the MAGS list developed for this study.
| Geriatric Syndromes | Associated Medications per MAGS List | Associated Medications per AGS Beers 2015 Criteria | ||
|---|---|---|---|---|
| Mean SD | Percentage of Patients Receiving 1 Related Medication | Mean SD | Percentage of Patients Receiving 1 Related Medication | |
| ||||
| Cognitive impairment | 1.8 ( 1.2) | 84.4% (130) | 1.6 ( 1.2) | 78.6% (121) |
| Delirium | 1.4 ( 1.1) | 76.0% (117) | 1.3 ( 1.2) | 68.2% (105) |
| Falls | 5.5 ( 2.2) | 100% (154) | 2.6 ( 1.6) | 92.2% (142) |
| Unintentional weight and/or appetite loss | 0.4 ( 0.5) | 36.3% (56) | 0.1 ( 0.3) | 6.5% (10) |
| Urinary incontinence | 1.6 ( 1.0) | 85.7% (132) | 0.1 ( 0.2) | 5.8% (9) |
| Depression | 1.7 ( 1.0) | 90.9% (140) | 0.0 ( 0.0) | 0.0% (0) |
| All syndromes | 5.9 ( 2.2) | 100% (154) | 3.0 ( 1.7) | 95% (149) |
DISCUSSION
An iterative process of evidence review by a multidisciplinary panel resulted in a list of 513 medications associated with 6 common geriatric syndromes. This analysis demonstrated that hospitalized, older patients discharged to SNFs were frequently prescribed MAGS. The rate of prescribing ranged from 100% of patients with a medication associated with falls to 36% for unintentional weight loss. Moreover, an alarming 43% of all medications at hospital discharge were MAGS. For this vulnerable population, the combination of high prevalence of MAGS and high risk of geriatric syndromes emphasize a need to critically review the risks and benefits of MAGS throughout hospitalization and at the time of discharge.
A body of evidence demonstrates that many drugs in a typical older adult regimen have no specific clinical indication, are considered inappropriate, or have uncertain efficacy in the geriatric population.[24, 25, 26] This study builds on the foundational work described in landmark reviews such as the AGS Beers[20] and STOPP/START[21] (Screening Tool of Older Persons' Potentially Inappropriate Prescriptions/Screening Tool to Alert doctors to Right, i.e. appropriate indicated Treatment) criteria. Both of these tools, however, were specifically designed as screening tools to identify medications considered unsafe for older adults under most circumstances and within specific illness states.[19, 20, 21] They are most often utilized when starting a medication to avoid acute adverse events. In contrast, the MAGS list was developed to be inclusive of medications that are often appropriate for many medical diagnoses but may also contribute to underlying geriatric syndromes that are more chronic in nature. In addition, inclusion of such medicines increases the sensitivity of screening for medications that can be targeted through patient‐centered deprescribing efforts when clinically appropriate.
A major strength of this study is that we bring together evidence across a spectrum of geriatric syndromes commonly experienced by hospitalized elders. In addition to evaluating multiple syndromes, we applied multiple modalities; particularly the use of an iterative review process by a multidisciplinary team of experts and using Lexicomp and FDA insert packages for linking medications to specific geriatric conditions. The inclusion criteria were broadened beyond single sources of evidence in an effort to capture a comprehensive list of medications. As a result, the MAGS list can be implemented as a screening tool for deprescribing interventions and assessing medication appropriateness to address individual or clusters of geriatric syndromes within a patient.
In addition to expanding this knowledge base, clinical relevance of the MAGS list is highlighted by its application to a sample of hospitalized older adults discharged to SNFs, a cohort known to experience geriatric syndromes. In fact, 43% of patients' medications at hospital discharge were MAGS. Importantly, due to the cross‐sectional nature of this study, we cannot be certain if the medication caused or potentiated each of the geriatric syndromes. However, hospitals and SNFs are devoting major resources toward reduction of falls, avoidance of urinary catheter use, and reduction of preventable readmissions. These efforts can be complemented by considering the number of medications associated with falls, urinary incontinence, and overall MAGS burden. The striking prevalence of MAGS demonstrates a rigorous need to weigh the risks and benefits of these medications. Above all, the intent of this study is not to propose that any MAGS be reflexively stopped, but rather that the MAGS list should facilitate a holistic approach to care for the complex older adult. For example, standard therapies such as gabapentin may be appropriate for treating neuralgic pain but may also contribute to falls and urinary incontinence. Thus, alternative pain treatments could be selected in place of gabapentin for a 75‐year old patient who is experiencing recurrent falls and increasing incontinence. Therefore, the MAGS list enables a patient‐provider discussion wherein medications' therapeutic benefits can be weighed against risks posed by specific clusters of geriatric syndromes, potential impact on quality of life, and consistency with goals of care.
This study has some limitations. First, although we examined a broad number of geriatric syndromes, several other geriatric syndromes experienced by hospitalized older adults were not addressed including: fecal incontinence, insomnia, and functional impairment. These syndromes were intentionally excluded from the study a priori due to reasons of feasibility and scope. Second, unlike the Beer's 2015 criteria, the MAGS list does not sub‐classify associations of medications with geriatric syndromes for patients with specific diseases (eg, heart failure). In fact, our MAGS list included medications often indicated in treating these diagnoses. A clinician must work with the patient to weigh the disease‐specific benefits of some medications with the potential effect on geriatric syndrome symptoms and outcomes. Third, the instrument has a very high sensitivity, which was intended to generate an inclusive list of medications that enables providers to weigh risks of geriatric syndromes with the intended indication benefit. The objective is not to use this list as a reflexive tool but rather help clinicians identify a starting point to address geriatric syndromes in their patients to make patient‐centered medication decisions. Although the MAGS list is intentionally large (sensitive), the advent of advanced bioinformatics can enable MAGS to be assessed in the future for both clinical and research purposes. Fourth, FDA insert packages and Lexicomp databases report anything experienced by the patient while on the particular medication, but it might not necessarily imply a causative link. The high use of MAGS and the specific geriatric syndrome may coexist due to the high prevalence and interplay of multimorbidity, polypharmacy, and geriatric syndromes in this population. Last, the list was developed by expert panel members predominantly from a single institution, which may introduce bias. Despite these limitations, the prevalence of these medications in a sample of patients transitioning from acute to postacute care highlights the utility of the MAGS list in future clinical research and quality improvement endeavors.
In conclusion, the MAGS list provides a comprehensive and sensitive indicator of medications associated with any of 6 geriatric syndromes regardless of medication indication and appropriateness. The MAGS list provides an overall degree of medication burden with respect to geriatric syndromes and a foundation for future research to assess the relationship between the presence of geriatric syndromes and syndrome‐associated medications. The MAGS list is an important first step in summarizing the data that link medications to geriatric syndromes. Future studies are needed to broaden the analysis of MAGS for other common geriatric syndromes and to identify new and emerging medications not present during the time of this analysis. The MAGS list has the potential to facilitate deprescribing efforts needed to combat the epidemic of overprescribing that may be contributing to the burden of geriatric syndromes among older patients.
Acknowledgements
The authors thank Dr. Linda Beuscher, Dr. Patricia Blair Miller, Dr. Joseph Ouslander, Dr. William Stuart Reynolds, and Dr. Warren Taylor for providing their expertise and participating in the expert panel discussions that facilitated the development of the MAGS list. The authors also recognize the research support provided by Christopher Simon Coelho.
Disclosures: This research was supported by the Department of Health and Human Services, Centers for Medicare & Medicaid Services grant #1C1CMS331006 awarded to Principal Investigator, John F. Schnelle, PhD. Dr. Vasilevskis was supported by the National Institute on Aging of the National Institutes of Health award K23AG040157 and the Geriatric Research, Education and Clinical Center. Dr. Bell was supported by National Institute on Aging‐K award K23AG048347‐01A1. Dr. Mixon is supported by a Veterans Affairs Health Services Research & Development Career Development Award (12‐168). This research was also supported by the National Center for Advancing Translational Sciences Clinical and Translational Science award UL1TR000445. The contents of this publication are solely the responsibility of the authors and do not necessarily represent the official views of the US Department of Health and Human Services or any of its agencies, the National Center for Advancing Translation Science, the National Institutes of Health, or the Department of Veterans Affairs. Each coauthor contributed significantly to the manuscript. Dr. Kripalani has received stock/stock options from Bioscape Digital, LLC. None of the other authors have significant conflicts of interest to report related to this project or the results reported within this article.
- , , , . Geriatric syndromes: clinical, research, and policy implications of a core geriatric concept. J Am Geriatr Soc. 2007;55:780–791.
- , , , . Shared risk factors for falls, incontinence, and functional dependence. Unifying the approach to geriatric syndromes. JAMA. 1995;273:1348–1353.
- , , , . Geriatric syndromes: medical misnomer or progress in geriatrics? Neth J Med. 2003;61:83–87.
- , , , et al. Geriatric conditions in acutely hospitalized older patients: prevalence and one‐year survival and functional decline. PLoS One. 2011;6:e26951.
- , , , , . Geriatric conditions as predictors of increased number of hospital admissions and hospital bed days over one year: findings of a nationwide cohort of older adults from Taiwan. Arch Gerontol Geriatr. 2014;59:169–174.
- , , , , . Geriatric conditions and disability: the Health and Retirement Study. Ann Intern Med. 2007;147:156–164.
- , , , , , . A prospective cohort study of geriatric syndromes among older medical patients admitted to acute care hospitals. J Am Geriatr Soc. 2011;59:2001–2008.
- , , , et al. Geriatric syndromes in hospitalized older adults discharged to skilled nursing facilities. J Am Geriatr Soc. 2016;64(4):715–722.
- , , , et al. Discharge to a skilled nursing facility and subsequent clinical outcomes among older patients hospitalized for heart failure. Circ Heart Fail. 2011;4:293–300.
- . Hazards of hospitalization of the elderly. Ann Intern Med. 1993;118:219–223.
- , , , , . Geriatric syndromes in elderly patients admitted to an inpatient cardiology ward. J Hosp Med. 2007;2:394–400.
- , , , . Effect of hospitalization on inappropriate prescribing in elderly Medicare beneficiaries. J Am Geriatr Soc. 2015;63:699–707.
- , , , et al. Polypharmacy cutoff and outcomes: five or more medicines were used to identify community‐dwelling older men at risk of different adverse outcomes. J Clin Epidemiol. 2012;65:989–995.
- , , , , . Investigating polypharmacy and drug burden index in hospitalised older people. Intern Med J. 2013;43:912–918.
- , . Potentially harmful drug‐drug interactions in the elderly: a review. Am J Geriatr Pharmacother. 2011;9:364–377.
- , , , . Hospital admissions/visits associated with drug‐drug interactions: a systematic review and meta‐analysis. Pharmacoepidemiol Drug Saf. 2014;23:489–497.
- , . Optimising drug treatment for elderly people: the prescribing cascade. BMJ. 1997;315:1096–1099.
- , , , et al. Association between acute geriatric syndromes and medication‐related hospital admissions. Drugs Aging. 2012;29:691–699.
- American Geriatrics Society Beers Criteria Update Expert P. American Geriatrics Society updated Beers Criteria for potentially inappropriate medication use in older adults. J Am Geriatr Soc. 2012;60:616–631.
- By the American Geriatrics Society 2015 Beers Criteria Update Expert Panel. American Geriatrics Society 2015 updated Beers criteria for potentially inappropriate medication use in older adults. J Am Geriatr Soc. 2015;63:2227–2246.
- , . STOPP (Screening Tool of Older Persons' potentially inappropriate Prescriptions): application to acutely ill elderly patients and comparison with Beers' criteria. Age Ageing. 2008;37:673–679.
- , , , et al. Warfarin versus aspirin for stroke prevention in an elderly community population with atrial fibrillation (the Birmingham Atrial Fibrillation Treatment of the Aged Study, BAFTA): a randomised controlled trial. Lancet. 2007;370:493–503.
- U.S. Food and Drug Administration. Drugs. Available at: http://www.fda.gov/Drugs/default.htm. Accessed May 15th, 2015.
- , , , et al. Inappropriate medication use among frail elderly inpatients. Ann Pharmacother. 2004;38:9–14.
- , , , et al. Inappropriate medications in elderly ICU survivors: where to intervene? Arch Intern Med. 2011;171:1032–1034.
- , , , et al. Appropriateness of medication prescribing in ambulatory elderly patients. J Am Geriatr Soc. 1994;42:1241–1247.
Geriatric syndromes are common clinical conditions in older adults that do not fall into specific disease categories. Unlike the traditional definition of a syndrome, geriatric syndrome refers to a condition that is mediated by multiple shared underlying risk factors.[1, 2] Conditions commonly referred to as geriatric syndromes include delirium, cognitive impairment, falls, unintentional weight loss, depressive symptoms, and incontinence. Even though many perceive it as medical misnomer,[3] geriatric syndromes have been shown to negatively impact quality of life and activities of daily living in older adults.[2] They are also associated with adverse outcomes such as increased healthcare utilization, functional decline, and mortality, even after adjusting for age and disease severity.[4, 5, 6] Hospitalized older adults, including those discharged to skilled nursing facilities (SNFs)[7, 8] are particularly at high risk for new‐onset or exacerbation of geriatric syndromes and poor outcomes.[7, 9, 10] However, hospital providers seldom assess, manage, or document geriatric syndromes because they are often overshadowed by disease conditions that lead to an acute episode requiring hospitalization (e.g., heart disease).[11]
Pharmacotherapy is the cornerstone of hospital treatment, and it is well‐known that it affects multiple physiologic systems causing side effects apart from the condition they are approved to treat. Given that geriatric syndromes are a result of impairments in multiple organ systems, it is plausible that pharmacotherapy may initiate or worsen these syndromes.[12] Medication‐related problems in older adults are well known. Polypharmacy and adverse drug events (as a result of drug‐drug/disease interactions and changes in pharmacokinetics and pharmacodynamics) are prevalent in multimorbid elderly patients.[13, 14, 15, 16] The prescribing cascade[17] increases the medication burden and may be a contributing factor for geriatric syndromes in hospitalized patients.[18] For instance, laxatives may be prescribed to counteract constipation caused by anticholinergic drugs.
The American Geriatric Society (AGS) Beers list[19, 20] and similar criteria[21] provide excellent resources to identify medications with potentially harmful interactions or adverse effects in older adults. Although these lists include medicines associated with a specific geriatric syndrome, they were not developed to explicitly link medicines across multiple geriatric syndromes, regardless of indication or appropriateness. For example, medications that effect important geriatric syndromes like unintentional weight/appetite loss, depression, and urinary incontinence are not extensively covered. In addition, disease‐appropriate medications (eg, ‐blockers for systolic heart failure), that may be associated with a geriatric syndrome (eg, falls) are not included; however, they may be important to consider for a patient and clinician who are weighing the disease benefits compared to the geriatric syndrome‐related risks. Finally, the AGS 2015 Beers criteria panel mentions the limitation that many medication associations may be excluded because older adults are less represented in clinical trials.[20] Clinicians are currently limited in identifying medications potentially contributing to a broad set of geriatric syndromes in their patients without a specific list of medications associated with geriatric syndromes (MAGS).[20]
In response to this gap, identifying these medications is important and should be a starting point in efforts toward prevention and treatment of geriatric syndromes. The 2 main objectives of this study were to first identify medications that may meaningfully contribute to 6 geriatric syndromes and subsequently describe the frequency of these medications in a population transitioning from acute care to postacute care to highlight the need and potential impact of such a list.
METHODS
This study included 2 phases that aligned with our 2 primary objectives. Phase 1 involved identifying medications associated with 6 geriatric syndromes, and phase 2 included a cross‐sectional analysis of the prevalence of these medications in a sample of patients discharged to SNFs.
Phase 1: Development of the MAGS List
Figure 1 depicts the underlying conceptual model and approach that was used in phase 1. The interaction between the patient factors and medication leads to polypharmacy that contributes to geriatric syndromes and additional adverse outcomes. As a starting point for mitigating geriatric syndromes, we used an iterative analytical process to identify a list of medications associated with the following geriatric syndromes that were documented to be highly prevalent in patients discharged to SNFs: cognitive impairment, delirium, falls, unintentional weight and/or appetite loss, urinary incontinence, and depression.[8] To be inclusive and sensitive, our approach differed from traditional systematic reviews, and in fact was meant to bring together much of the established systematic literature about disparate geriatric syndromes in 1 place, because patients often do not experience a geriatric syndrome in isolation, but rather experience multiple geriatric syndromes.[8] The MAGS list had 3 main inclusion criteria (Figure 1): (1) evidence in the published literature (systematic reviews, cohort studies, randomized clinical trials) that the medication is related to the syndrome, (2) expert panel opinion, and (3) drug databases (Lexicomp Online database[22] and/or US Food and Drug Administration [FDA]approved package inserts).[23] We generated an initial list of medications based on these 3 main criteria to identify medications with significant associations to each geriatric syndrome. The list was further expanded and vetted using an iterative review of each medication list as it related to each geriatric syndrome through a series of group meetings focused around each geriatric syndrome. Following further discussion, we obtained agreement among all team members for medications included in the final list. For each geriatric syndrome, we excluded medications from consideration if they were used to treat the same geriatric syndrome (eg, ‐adrenergic blockers used to treat incontinence in men were listed as associated with incontinence only in women). We classified medications according to the Established Pharmacologic Class available at the FDA website. We also compared our final MAGS list with the 2015 AGS Beer's list[20] by identifying medications that were related to the 6 geriatric syndromes. This included Beers[20]‐cited rationale of anticholinergic, extrapyramidal symptoms, orthostatic hypotension (eg, falls), high‐risk adverse central nervous system effects, sedating, cognitive decline (eg, antipsychotics), delirium, falls, fractures, incontinence, and gastrointestinal (eg, nausea, vomiting). Specifically, we assessed whether the medications were included as inappropriate by the AGS Beers 2015[20] list and also whether they documented the syndrome association for that medication.
Phase 2: Prevalence of MAGS in Hospitalized Older Adults Discharged to SNFs
Sample
We next applied the MAGS list to a convenience sample of hospitalized patients discharged to SNFs to assess the prevalence of MAGS in this sample, and also to compare with the prevalence of Beers criteria[20] medications. Our sample was selected from data collected as part of a quality‐improvement project to reduce hospital readmissions in patients discharged to SNFs. The larger study enrolled a total 1093 medical and surgical patients who had Medicare insurance eligibility and were discharged from 1 large university hospital to 23 area SNFs from January 17, 2013 through July 31, 2014. The university institutional review board waived the requirement for written consent. For the purpose of this substudy. we selected the first 154 patients with complete chart abstraction (approximately 15% of the total) as a convenience sample.
Data Analysis
We applied descriptive statistics to summarize demographic and clinical characteristics of the convenience sample. To understand potential selection biases that could have resulted by the convenience sampling, we compared participant characteristics of the convenience sample (N = 154) with the characteristics of the remaining participants of the larger study (N = 939) using independent sample t tests and 2 tests for continuous and categorical measures, respectively. We applied the MAGS list and the AGS 2015 Beers criteria[20] for the sample of 154 and identified the medications associated with each of the 6 geriatric syndromes from the discharge medication lists completed by hospital clinical pharmacists. For each patient, we identified both scheduled and PRN (pro re nata, or as needed) medications associated with each geriatric syndrome. Thereafter, we determined whether the discharge list contained at least 1 medication associated with a geriatric syndrome per the MAGS list and the AGS Beers 2015 criteria,[20] and the percentage of overall medications that were part of the MAGS and Beers lists. Data were aggregated using means and standard deviations across syndromes (ie, number of discharge medications per syndrome per patient) along with the percentage of patients with 1 or more medications related to a specific syndrome and the percentage of medications that were MAGS. All analyses were performed using the SPSS statistical package (IBM SPSS Statistics for Windows, version 23.0; IBM, Armonk, NY).
RESULTS
Phase 1: MAGS List
The iterative process applied in this analysis generated a list of 513 medications associated with the 6 geriatric syndromes. The list of medications related to each syndrome and the corresponding rationale and relevant references for their inclusion is presented in the Supporting Information, Appendix 1, in the online version of this article. Table 1 summarizes these medications across 18 major drug categories. Antiepileptics were linked to all 6 geriatric syndromes, whereas antipsychotics, antidepressants, antiparkinsonism, and opioid agonists were associated with 5 syndromes. Ten of the 18 categories were associated with 3 geriatric syndromescognitive impairment, delirium, and falls. Four medication categories were associated with only 1 syndrome. Nonopioid/nonsteroidal anti‐inflammatory and/or analgesics and nonopioid cough suppressant and expectorant medications were associated with falls syndrome only. Hormone replacement medications were associated with depression only, and immunosuppressants were associated with unintentional weight and appetite loss only.
| Major Medication Category | Delirium | Cognitive Impairment | Falls | Unintentional Weight and Appetite Loss | Urinary Incontinence | Depression | Drug Class/Drug Within Each Category |
|---|---|---|---|---|---|---|---|
| |||||||
| Antipsychotics | ✓ | ✓ | ✓ | ✓ | Atypical and typical antipsychotics, buspirone | ||
| Antidepressants | ✓ | ✓ | ✓ | ✓ | ✓ | Tricyclic and tetracyclic antidepressants, serotonin reuptake inhibitors, serotonin and norepinephrine reuptake inhibitor, aminoketone | |
| Antiepileptics | ✓ | ✓ | ✓ | ✓ | ✓ | ✓ | Antiepileptics, mood stabilizers, barbiturates |
| Antiparkinsonism | ✓ | ✓ | ✓ | ✓ | ✓ | Aromatic amino acid decarboxylation inhibitor and catechol‐o‐methyltransferase inhibitor, catecholamine‐depleting sympatholytic, catechol‐o‐methyltransferase inhibitor, dopaminergic agonist, ergot derivative, monoamine oxidase inhibitor, nonergot dopamine agonist, | |
| Benzodiazapines | ✓ | ✓ | ✓ | Benzodiazapines only | |||
| Nonbenzodiazepine hypnotics | ✓ | ✓ | ✓ | Benzodiazepine analogs, nonbenzodiazepine hypnotics, tranquilizers, ‐aminobutyric acid A receptor agonist | |||
| Opioid agonists | ✓ | ✓ | ✓ | ✓ | ✓ | Full or partial opioid agonists, opiates, opioids | |
| Nonopioid/nonsteroidal anti‐inflammatory and/or analgesics | ✓ | Nonopioid analgesics, NSAIDs, COX‐2 selective inhibitor NSAIDs | |||||
| Antihypertensives | ✓ | ✓ | ✓ | Calcium channel blocker, ‐adrenergic blocker, angiotensin‐converting enzyme inhibitor, angiotensin 2 receptor blocker, ‐adrenergic blocker, diuretics (loop, potassium sparing, thiazide), nitrate vasodilators, aldosterone blocker | |||
| Antiarrhythmic | ✓ | ✓ | ✓ | Antiarrhythmics, cardiac glycosides | |||
| Antidiabetics | ✓ | ✓ | Insulin and insulin analogs, sulfonylureas, ‐glucosidase inhibitor, amylin analog, biguanide, glinide, GLP‐1 receptor agonist, glucagon‐like peptide‐1 agonist | ||||
| Anticholinergics and/or antihistaminics | ✓ | ✓ | ✓ | ✓ | Anticholinergics, histamine receptor antagonists, muscarininc antagonists, combined anticholinergics, and histamine receptor antagonists | ||
| Antiemetics | ✓ | ✓ | ✓ | Antiemetics, dopaminergic antagonists, dopamine‐2 receptor antagonist | |||
| Hormone replacement | ✓ | Corticosteroids, progestin, estrogen, estrogen agonist/antagonist, gonadotropin releasing hormone receptor agonist | |||||
| Muscle relaxers | ✓ | ✓ | ✓ | ✓ | Muscle relaxers | ||
| Immunosuppressants | ✓ | Calcineurin inhibitor immunosuppressant, folate analog metabolic inhibitor, purine antimetabolite | |||||
| Nonopioid cough suppressants and expectorants | ✓ | Expectorant, non‐narcotic antitussive, ‐1 agonist, uncompetitive N‐methyl‐D‐aspartate receptor antagonist | |||||
| Antimicrobials | ✓ | ✓ | Macrolide, cephalosporin, penicillin class, rifamycin, non‐nucleoside analog reverse transcriptase inhibitor, influenza A M2 protein inhibitor | ||||
| Others | ✓ | ✓ | ✓ | ✓ | ✓ | ✓ | ‐3‐adrenergic agonist, methylxanthine, cholinesterase inhibitor, interferon and , partial cholinergic nicotinic agonist, tyrosine hydroxylase, retinoid, serotonin‐1b and serotonin‐1d receptor agonist, stimulant laxative, vitamin K antagonist, platelet aggregation inhibitor |
Approximately 58% of the medications overlapped with the AGS 2015 Beer's Criteria[20] irrespective of whether the specific syndrome association was stated in the rationale.[20] Medications that overlapped were mostly in the delirium, cognitive impairment, and falls category with only a few overlaps in depression, unintentional weight loss, and urinary incontinence lists (see Supporting Information, Appendix 1, in the online version of this article).
Phase 2: Prevalence of MAGS
Among 154 participants, the mean age was 76.5 (10.6) years, 64.3% were female, 77.9% were white, and 96.1% non‐Hispanic. The median hospital length of stay was 6 days, with an interquartile range of 5 days. The orthopedic service discharged the highest proportion of patients (24%), followed by the geriatrics and internal medicine services, which each discharged 19.5% of the patients (Table 2). The remaining participants of the larger quality‐improvement project (N = 939) did not significantly differ on these demographic and clinical characteristics except for hospital length of stay, which was shorter in the sample analyzed (see Supporting Information, Appendix 2, in the online version of this article).
| Baseline Characteristics | Mean ( SD) or Percent (n) |
|---|---|
| |
| Age, y | 76.5 ( 10.6) |
| Sex | |
| Female | 64.3% (99) |
| Race | |
| White | 77.9% (126) |
| Black | 16.2% (25) |
| Unknown | 0.6% (1) |
| Declined | 0.6% (1) |
| Missing | 0.6% (1) |
| Ethnicity | |
| Non‐Hispanic | 96.1% (148) |
| Hispanic | 1.3% (2) |
| Unknown | 2.6% (4) |
| Hospital length of stay, d | 7.0 ( 4.2) |
| Hospital length of stay, d, median (IQR) | 6.0 (5.0) |
| No. of hospital discharge medications, count | 14.0 ( 4.7) |
| Discharge service | |
| Orthopedic service | 24.0% (37) |
| Geriatric service | 19.5% (30) |
| Internal medicine | 19.5% (30) |
| Other | 37.0% (57) |
Patients were discharged to SNFs with an average of 14.0 (4.7) medication orders. Overall, 43% (13%) of these discharge medication orders were MAGS. Every patient in the sample was ordered at least 1 medication associated with geriatric syndromes. Multiple MAGS were the norm, with an average of 5.9 (2.2) MAGS per patient. MAGS were also the norm, as 98.1% of the sample had medication orders associated with at least 2 different syndromes.
When the Beer's criteria[20] were applied to the medication orders (instead of the MAGS list), problematic medications appeared less common. Patients had an average of 3.04 (1.7) MAGS that were also listed on the AGS 2015 Beer's list,[20] representing an average of 22.3% of all discharge orders.
Table 3 illustrates the average number of medications per patient associated with each syndrome, and the percentage of patients (number in parentheses) discharged with at least 1 medication associated with each syndrome per the MAGS list and the Beers 2015 criteria.[20] For example, per the MAGS list, the syndrome most frequently associated with medications was falls, with patients discharged on an average of 5.5 (2.2) medications associated with falls, and 100% of the sample had at least 1 discharge medication associated with falls. Alternatively, the syndrome associated with the lowest frequency of medications was unintentional weight loss (with an average of 0.38 medications per patient), although 36% of these patients had more than 1 discharge medication associated with weight loss. As seen in Table 3, the mean and prevalence of 1 or more medications associated with each of the geriatric syndromes as identified by the Beers 2015 criteria[20] was lower than those identified by the MAGS list developed for this study.
| Geriatric Syndromes | Associated Medications per MAGS List | Associated Medications per AGS Beers 2015 Criteria | ||
|---|---|---|---|---|
| Mean SD | Percentage of Patients Receiving 1 Related Medication | Mean SD | Percentage of Patients Receiving 1 Related Medication | |
| ||||
| Cognitive impairment | 1.8 ( 1.2) | 84.4% (130) | 1.6 ( 1.2) | 78.6% (121) |
| Delirium | 1.4 ( 1.1) | 76.0% (117) | 1.3 ( 1.2) | 68.2% (105) |
| Falls | 5.5 ( 2.2) | 100% (154) | 2.6 ( 1.6) | 92.2% (142) |
| Unintentional weight and/or appetite loss | 0.4 ( 0.5) | 36.3% (56) | 0.1 ( 0.3) | 6.5% (10) |
| Urinary incontinence | 1.6 ( 1.0) | 85.7% (132) | 0.1 ( 0.2) | 5.8% (9) |
| Depression | 1.7 ( 1.0) | 90.9% (140) | 0.0 ( 0.0) | 0.0% (0) |
| All syndromes | 5.9 ( 2.2) | 100% (154) | 3.0 ( 1.7) | 95% (149) |
DISCUSSION
An iterative process of evidence review by a multidisciplinary panel resulted in a list of 513 medications associated with 6 common geriatric syndromes. This analysis demonstrated that hospitalized, older patients discharged to SNFs were frequently prescribed MAGS. The rate of prescribing ranged from 100% of patients with a medication associated with falls to 36% for unintentional weight loss. Moreover, an alarming 43% of all medications at hospital discharge were MAGS. For this vulnerable population, the combination of high prevalence of MAGS and high risk of geriatric syndromes emphasize a need to critically review the risks and benefits of MAGS throughout hospitalization and at the time of discharge.
A body of evidence demonstrates that many drugs in a typical older adult regimen have no specific clinical indication, are considered inappropriate, or have uncertain efficacy in the geriatric population.[24, 25, 26] This study builds on the foundational work described in landmark reviews such as the AGS Beers[20] and STOPP/START[21] (Screening Tool of Older Persons' Potentially Inappropriate Prescriptions/Screening Tool to Alert doctors to Right, i.e. appropriate indicated Treatment) criteria. Both of these tools, however, were specifically designed as screening tools to identify medications considered unsafe for older adults under most circumstances and within specific illness states.[19, 20, 21] They are most often utilized when starting a medication to avoid acute adverse events. In contrast, the MAGS list was developed to be inclusive of medications that are often appropriate for many medical diagnoses but may also contribute to underlying geriatric syndromes that are more chronic in nature. In addition, inclusion of such medicines increases the sensitivity of screening for medications that can be targeted through patient‐centered deprescribing efforts when clinically appropriate.
A major strength of this study is that we bring together evidence across a spectrum of geriatric syndromes commonly experienced by hospitalized elders. In addition to evaluating multiple syndromes, we applied multiple modalities; particularly the use of an iterative review process by a multidisciplinary team of experts and using Lexicomp and FDA insert packages for linking medications to specific geriatric conditions. The inclusion criteria were broadened beyond single sources of evidence in an effort to capture a comprehensive list of medications. As a result, the MAGS list can be implemented as a screening tool for deprescribing interventions and assessing medication appropriateness to address individual or clusters of geriatric syndromes within a patient.
In addition to expanding this knowledge base, clinical relevance of the MAGS list is highlighted by its application to a sample of hospitalized older adults discharged to SNFs, a cohort known to experience geriatric syndromes. In fact, 43% of patients' medications at hospital discharge were MAGS. Importantly, due to the cross‐sectional nature of this study, we cannot be certain if the medication caused or potentiated each of the geriatric syndromes. However, hospitals and SNFs are devoting major resources toward reduction of falls, avoidance of urinary catheter use, and reduction of preventable readmissions. These efforts can be complemented by considering the number of medications associated with falls, urinary incontinence, and overall MAGS burden. The striking prevalence of MAGS demonstrates a rigorous need to weigh the risks and benefits of these medications. Above all, the intent of this study is not to propose that any MAGS be reflexively stopped, but rather that the MAGS list should facilitate a holistic approach to care for the complex older adult. For example, standard therapies such as gabapentin may be appropriate for treating neuralgic pain but may also contribute to falls and urinary incontinence. Thus, alternative pain treatments could be selected in place of gabapentin for a 75‐year old patient who is experiencing recurrent falls and increasing incontinence. Therefore, the MAGS list enables a patient‐provider discussion wherein medications' therapeutic benefits can be weighed against risks posed by specific clusters of geriatric syndromes, potential impact on quality of life, and consistency with goals of care.
This study has some limitations. First, although we examined a broad number of geriatric syndromes, several other geriatric syndromes experienced by hospitalized older adults were not addressed including: fecal incontinence, insomnia, and functional impairment. These syndromes were intentionally excluded from the study a priori due to reasons of feasibility and scope. Second, unlike the Beer's 2015 criteria, the MAGS list does not sub‐classify associations of medications with geriatric syndromes for patients with specific diseases (eg, heart failure). In fact, our MAGS list included medications often indicated in treating these diagnoses. A clinician must work with the patient to weigh the disease‐specific benefits of some medications with the potential effect on geriatric syndrome symptoms and outcomes. Third, the instrument has a very high sensitivity, which was intended to generate an inclusive list of medications that enables providers to weigh risks of geriatric syndromes with the intended indication benefit. The objective is not to use this list as a reflexive tool but rather help clinicians identify a starting point to address geriatric syndromes in their patients to make patient‐centered medication decisions. Although the MAGS list is intentionally large (sensitive), the advent of advanced bioinformatics can enable MAGS to be assessed in the future for both clinical and research purposes. Fourth, FDA insert packages and Lexicomp databases report anything experienced by the patient while on the particular medication, but it might not necessarily imply a causative link. The high use of MAGS and the specific geriatric syndrome may coexist due to the high prevalence and interplay of multimorbidity, polypharmacy, and geriatric syndromes in this population. Last, the list was developed by expert panel members predominantly from a single institution, which may introduce bias. Despite these limitations, the prevalence of these medications in a sample of patients transitioning from acute to postacute care highlights the utility of the MAGS list in future clinical research and quality improvement endeavors.
In conclusion, the MAGS list provides a comprehensive and sensitive indicator of medications associated with any of 6 geriatric syndromes regardless of medication indication and appropriateness. The MAGS list provides an overall degree of medication burden with respect to geriatric syndromes and a foundation for future research to assess the relationship between the presence of geriatric syndromes and syndrome‐associated medications. The MAGS list is an important first step in summarizing the data that link medications to geriatric syndromes. Future studies are needed to broaden the analysis of MAGS for other common geriatric syndromes and to identify new and emerging medications not present during the time of this analysis. The MAGS list has the potential to facilitate deprescribing efforts needed to combat the epidemic of overprescribing that may be contributing to the burden of geriatric syndromes among older patients.
Acknowledgements
The authors thank Dr. Linda Beuscher, Dr. Patricia Blair Miller, Dr. Joseph Ouslander, Dr. William Stuart Reynolds, and Dr. Warren Taylor for providing their expertise and participating in the expert panel discussions that facilitated the development of the MAGS list. The authors also recognize the research support provided by Christopher Simon Coelho.
Disclosures: This research was supported by the Department of Health and Human Services, Centers for Medicare & Medicaid Services grant #1C1CMS331006 awarded to Principal Investigator, John F. Schnelle, PhD. Dr. Vasilevskis was supported by the National Institute on Aging of the National Institutes of Health award K23AG040157 and the Geriatric Research, Education and Clinical Center. Dr. Bell was supported by National Institute on Aging‐K award K23AG048347‐01A1. Dr. Mixon is supported by a Veterans Affairs Health Services Research & Development Career Development Award (12‐168). This research was also supported by the National Center for Advancing Translational Sciences Clinical and Translational Science award UL1TR000445. The contents of this publication are solely the responsibility of the authors and do not necessarily represent the official views of the US Department of Health and Human Services or any of its agencies, the National Center for Advancing Translation Science, the National Institutes of Health, or the Department of Veterans Affairs. Each coauthor contributed significantly to the manuscript. Dr. Kripalani has received stock/stock options from Bioscape Digital, LLC. None of the other authors have significant conflicts of interest to report related to this project or the results reported within this article.
- , , , . Geriatric syndromes: clinical, research, and policy implications of a core geriatric concept. J Am Geriatr Soc. 2007;55:780–791.
- , , , . Shared risk factors for falls, incontinence, and functional dependence. Unifying the approach to geriatric syndromes. JAMA. 1995;273:1348–1353.
- , , , . Geriatric syndromes: medical misnomer or progress in geriatrics? Neth J Med. 2003;61:83–87.
- , , , et al. Geriatric conditions in acutely hospitalized older patients: prevalence and one‐year survival and functional decline. PLoS One. 2011;6:e26951.
- , , , , . Geriatric conditions as predictors of increased number of hospital admissions and hospital bed days over one year: findings of a nationwide cohort of older adults from Taiwan. Arch Gerontol Geriatr. 2014;59:169–174.
- , , , , . Geriatric conditions and disability: the Health and Retirement Study. Ann Intern Med. 2007;147:156–164.
- , , , , , . A prospective cohort study of geriatric syndromes among older medical patients admitted to acute care hospitals. J Am Geriatr Soc. 2011;59:2001–2008.
- , , , et al. Geriatric syndromes in hospitalized older adults discharged to skilled nursing facilities. J Am Geriatr Soc. 2016;64(4):715–722.
- , , , et al. Discharge to a skilled nursing facility and subsequent clinical outcomes among older patients hospitalized for heart failure. Circ Heart Fail. 2011;4:293–300.
- . Hazards of hospitalization of the elderly. Ann Intern Med. 1993;118:219–223.
- , , , , . Geriatric syndromes in elderly patients admitted to an inpatient cardiology ward. J Hosp Med. 2007;2:394–400.
- , , , . Effect of hospitalization on inappropriate prescribing in elderly Medicare beneficiaries. J Am Geriatr Soc. 2015;63:699–707.
- , , , et al. Polypharmacy cutoff and outcomes: five or more medicines were used to identify community‐dwelling older men at risk of different adverse outcomes. J Clin Epidemiol. 2012;65:989–995.
- , , , , . Investigating polypharmacy and drug burden index in hospitalised older people. Intern Med J. 2013;43:912–918.
- , . Potentially harmful drug‐drug interactions in the elderly: a review. Am J Geriatr Pharmacother. 2011;9:364–377.
- , , , . Hospital admissions/visits associated with drug‐drug interactions: a systematic review and meta‐analysis. Pharmacoepidemiol Drug Saf. 2014;23:489–497.
- , . Optimising drug treatment for elderly people: the prescribing cascade. BMJ. 1997;315:1096–1099.
- , , , et al. Association between acute geriatric syndromes and medication‐related hospital admissions. Drugs Aging. 2012;29:691–699.
- American Geriatrics Society Beers Criteria Update Expert P. American Geriatrics Society updated Beers Criteria for potentially inappropriate medication use in older adults. J Am Geriatr Soc. 2012;60:616–631.
- By the American Geriatrics Society 2015 Beers Criteria Update Expert Panel. American Geriatrics Society 2015 updated Beers criteria for potentially inappropriate medication use in older adults. J Am Geriatr Soc. 2015;63:2227–2246.
- , . STOPP (Screening Tool of Older Persons' potentially inappropriate Prescriptions): application to acutely ill elderly patients and comparison with Beers' criteria. Age Ageing. 2008;37:673–679.
- , , , et al. Warfarin versus aspirin for stroke prevention in an elderly community population with atrial fibrillation (the Birmingham Atrial Fibrillation Treatment of the Aged Study, BAFTA): a randomised controlled trial. Lancet. 2007;370:493–503.
- U.S. Food and Drug Administration. Drugs. Available at: http://www.fda.gov/Drugs/default.htm. Accessed May 15th, 2015.
- , , , et al. Inappropriate medication use among frail elderly inpatients. Ann Pharmacother. 2004;38:9–14.
- , , , et al. Inappropriate medications in elderly ICU survivors: where to intervene? Arch Intern Med. 2011;171:1032–1034.
- , , , et al. Appropriateness of medication prescribing in ambulatory elderly patients. J Am Geriatr Soc. 1994;42:1241–1247.

FDA is investigating Zecuity sumatriptan patch for reports of serious burns
The Food and Drug Administration is evaluating patient reports of serious burns and potential permanent scarring that have occurred with the use of the Zecuity patch (sumatriptan iontophoretic transdermal system) to relieve migraine headaches.
Since September 2015, a large number of patients using the Zecuity patch have reported that they have experienced burns or scars on the skin where the patch was worn. Severe redness, pain, skin discoloration, blistering, and cracked skin were reported, according to the agency’s June 2 drug safety announcement.
The Zecuity patch contains sumatriptan which is a prescription medicine used to treat acute migraine headaches in adults. It is designed to give a dose of medicine by way of a single-use, battery-powered patch that is wrapped around the upper arm or thigh.
“Health care professionals should advise patients who complain of moderate to severe pain at the application site to remove the Zecuity patch immediately,” the safety report states. “Consider a different formulation of sumatriptan or switch these patients to an alternative migraine medicine.”
It is advised that patients should not bathe, shower, or swim while wearing the patch. Patients and health care professionals should report possible side effects involving the Zecuity patch to the FDA MedWatch program.
Starting with combination diabetes therapy beats initial monotherapy
ORLANDO – Whether to start a patient with newly diagnosed type 2 diabetes mellitus on combination therapy or monotherapy should be based on experimentation and observation rather than expert opinion, according to Dr. Alan Garber, president of the American College of Endocrinology and professor of medicine, biochemistry, and molecular and cellular biology at Baylor College of Medicine in Houston.
Monotherapy for type 2 diabetes with stepwise addition of other antihyperglycemic agents has long been the accepted way to initiate therapy in this population. Beginning in the 1990s, investigators began to compare the efficacy of monotherapy with combination therapy, first with metformin and glyburide alone or together, and then testing metformin in combination with glipizide, rosiglitazone, and sitagliptin, he said.

For metformin and glyburide, each agent alone lowered glycated hemoglobin (HbA1c), compared with placebo, but adding one to the other enhanced lowering. Combining the two drugs had the greatest benefit for higher HbA1c entry levels (e.g., HbA1c strata of 9%-9.9% or 10% or greater vs. less than 8%). At the highest-entry HbA1c levels, half doses of each of metformin and glyburide (250 mg/1.25 mg, respectively) were more efficacious than full doses of each (500 mg/2.5 mg). “This is called drug sparing,” he said.
In a trial of metformin and rosiglitazone, the combination was superior to either alone, producing significantly greater mean reductions in HbA1c and in fasting plasma glucose (FPG) at 32 weeks from their respective baselines, again, with greater reductions for higher-entry HbA1c levels. The combination was also better than either drug alone in the speed of reducing HbA1c or FPG, and in the final attained levels.
The combination of metformin and a sulfonylurea presents a risk of hypoglycemia, but Dr. Garber said the results are “much cleaner” using combinations of metformin with agents such as a thiazolidinedione, a dipeptidyl peptidase-4 inhibitor, or a sodium/glucose cotransporter-2 inhibitor.
Also noteworthy are findings from the EDICT (Efficacy and Durability of Initial Combination Therapy for Type 2 Diabetes) trial using insulin-sensitizing and insulin-secreting agents metformin/pioglitazone/exenatide in combination vs. escalating doses of metformin with sequential addition of a sulfonylurea and glargine insulin to treat patients with newly diagnosed type 2 diabetes. Over 2 years, the subjects receiving combination therapy had lower HbA1c, a mean weight loss, compared with weight gain, in the sequential therapy group, and a 7.5-fold lower rate of hypoglycemia, compared with the sequential treatment group (Diabetes Obes Metab. 2015;17:268-75).
Although the agents used in the two treatment strategies were not strictly equivalent, “it’s clear that testing multiple therapeutic mechanisms tends to produce better outcomes than fewer therapeutic mechanisms,” Dr. Garber said. The conclusions are fairly straightforward. “Look for evidence to support what strategies you want to use for your patients’ care.”
Using the Kaiser Permanente database, investigators found that the mean time of having an HbA1c above 8% was 3 years before a second agent was added, and the mean HbA1c was 9%. Many people have ascribed this sort of delay to a problem with the physician. But Dr. Garber said it is more related to patients, who often resist prescriptions for more drugs. So starting with two drugs may produce better efficacy faster as well as overcome the psychological issues of trying to add another one later (Am J Manag Care. 2003;9:213-7).

Session moderator Dr. Daniel Einhorn, medical director of the Scripps Whittier Diabetes Institute in La Jolla, California, raised the possibility of “subtraction therapy, where you start with three agents no matter what, and then if things go well, you subtract. And so you reverse the situation that Alan discussed.” In the patient’s view, “you have a celebration that night instead of a wake,” he said.
Dr. Garber has received honoraria or consulting fees as a member of the advisory boards of Novo Nordisk, Janssen, and Merck. Dr. Einhorn is on the scientific advisory boards of Eli Lilly, Novo Nordisk, Janssen, Boehringer Ingelheim, Sanofi, and Adocia, is a consultant for Halozyme, Glysens, Freedom-Meditech, and Epitracker, and has research funding from Lilly, Novo, Janssen, AstraZeneca, Mannkind, Freedom-Meditech, Merck, Sanofi, and Boehringer Ingelheim.
ORLANDO – Whether to start a patient with newly diagnosed type 2 diabetes mellitus on combination therapy or monotherapy should be based on experimentation and observation rather than expert opinion, according to Dr. Alan Garber, president of the American College of Endocrinology and professor of medicine, biochemistry, and molecular and cellular biology at Baylor College of Medicine in Houston.
Monotherapy for type 2 diabetes with stepwise addition of other antihyperglycemic agents has long been the accepted way to initiate therapy in this population. Beginning in the 1990s, investigators began to compare the efficacy of monotherapy with combination therapy, first with metformin and glyburide alone or together, and then testing metformin in combination with glipizide, rosiglitazone, and sitagliptin, he said.
For metformin and glyburide, each agent alone lowered glycated hemoglobin (HbA1c), compared with placebo, but adding one to the other enhanced lowering. Combining the two drugs had the greatest benefit for higher HbA1c entry levels (e.g., HbA1c strata of 9%-9.9% or 10% or greater vs. less than 8%). At the highest-entry HbA1c levels, half doses of each of metformin and glyburide (250 mg/1.25 mg, respectively) were more efficacious than full doses of each (500 mg/2.5 mg). “This is called drug sparing,” he said.
In a trial of metformin and rosiglitazone, the combination was superior to either alone, producing significantly greater mean reductions in HbA1c and in fasting plasma glucose (FPG) at 32 weeks from their respective baselines, again, with greater reductions for higher-entry HbA1c levels. The combination was also better than either drug alone in the speed of reducing HbA1c or FPG, and in the final attained levels.
The combination of metformin and a sulfonylurea presents a risk of hypoglycemia, but Dr. Garber said the results are “much cleaner” using combinations of metformin with agents such as a thiazolidinedione, a dipeptidyl peptidase-4 inhibitor, or a sodium/glucose cotransporter-2 inhibitor.
Also noteworthy are findings from the EDICT (Efficacy and Durability of Initial Combination Therapy for Type 2 Diabetes) trial using insulin-sensitizing and insulin-secreting agents metformin/pioglitazone/exenatide in combination vs. escalating doses of metformin with sequential addition of a sulfonylurea and glargine insulin to treat patients with newly diagnosed type 2 diabetes. Over 2 years, the subjects receiving combination therapy had lower HbA1c, a mean weight loss, compared with weight gain, in the sequential therapy group, and a 7.5-fold lower rate of hypoglycemia, compared with the sequential treatment group (Diabetes Obes Metab. 2015;17:268-75).
Although the agents used in the two treatment strategies were not strictly equivalent, “it’s clear that testing multiple therapeutic mechanisms tends to produce better outcomes than fewer therapeutic mechanisms,” Dr. Garber said. The conclusions are fairly straightforward. “Look for evidence to support what strategies you want to use for your patients’ care.”
Using the Kaiser Permanente database, investigators found that the mean time of having an HbA1c above 8% was 3 years before a second agent was added, and the mean HbA1c was 9%. Many people have ascribed this sort of delay to a problem with the physician. But Dr. Garber said it is more related to patients, who often resist prescriptions for more drugs. So starting with two drugs may produce better efficacy faster as well as overcome the psychological issues of trying to add another one later (Am J Manag Care. 2003;9:213-7).
Session moderator Dr. Daniel Einhorn, medical director of the Scripps Whittier Diabetes Institute in La Jolla, California, raised the possibility of “subtraction therapy, where you start with three agents no matter what, and then if things go well, you subtract. And so you reverse the situation that Alan discussed.” In the patient’s view, “you have a celebration that night instead of a wake,” he said.
Dr. Garber has received honoraria or consulting fees as a member of the advisory boards of Novo Nordisk, Janssen, and Merck. Dr. Einhorn is on the scientific advisory boards of Eli Lilly, Novo Nordisk, Janssen, Boehringer Ingelheim, Sanofi, and Adocia, is a consultant for Halozyme, Glysens, Freedom-Meditech, and Epitracker, and has research funding from Lilly, Novo, Janssen, AstraZeneca, Mannkind, Freedom-Meditech, Merck, Sanofi, and Boehringer Ingelheim.
EXPERT ANALYSIS AT AACE 2016

RF ablation successfully treats focal adrenal tumors
ORLANDO – Radiofrequency (RF) ablation is a safe and effective procedure for treating focal adrenal tumors in patients who are poor surgical candidates or who refuse adrenalectomy. With a short treatment time and minimal hospital stay, RF ablation can provide rapid clinical and biochemical improvement.
Dr. Lima Lawrence, an internal medicine resident at the University of Illinois at Chicago/Advocate Christ Medical Center in Oak Lawn, presented a case report and a review of the literature during an oral abstract session at the annual meeting of the American Association of Clinical Endocrinologists. The patient was a 65-year-old woman who presented with weight gain, decreased energy, and muscle weakness. On physical exam, she was hypertensive, anxious, obese, and had prominent supraclavicular fat pads. Salivary cortisol and overnight dexamethasone suppression tests were both elevated, and ACTH levels were depressed, confirming the diagnosis of a cortisol-secreting tumor causing adrenal Cushing’s syndrome. Computed tomography (CT) surveillance showed a progressively enlarging right-sided adrenal mass. A peritoneal biopsy revealed a low-grade serous neoplasm of peritoneal origin.
Her medical history included type 2 diabetes, uncontrolled hypertension, mixed connective tissue disease, depression, and total abdominal hysterectomy with bilateral salpingo-oophorectomy for ovarian cancer.
Dr. Lawrence said the patient had been scheduled for adrenalectomy, but it was not performed because of an intraoperative finding of peritoneal studding from what turned out to be metastatic ovarian cancer. Therefore, she underwent CT-guided RF ablation of the adrenal mass using a 14-gauge probe that heated a 3.5-cm ablation zone to 50-60 C for 8-10 minutes to achieve complete tumor necrosis.
The patient showed dramatic “clinical and biochemical improvement,” Dr. Lawrence said. The patient had no procedural complications and no blood loss and was observed for 23 hours before being discharged to home. A CT scan 8 weeks later showed a slightly decreased mass with marked decreased radiographic attenuation post-contrast from 30.2 Hounsfield Units (HU) preoperatively to 17 HU on follow-up.

Potential adverse outcomes using RF ablation include a risk of pneumothorax, hemothorax, and tumor seeding along the catheter track, but this last possibility can be mitigated by continuing to heat the RF probe as it is withdrawn.
Published evidence supports use of RF ablation. “To date there have been no randomized clinical trials comparing the safety, efficacy, and survival benefits of adrenalectomy vs. radio frequency ablation,” she said. It may not be feasible to do a randomized trial. But a review of the literature generally supports the efficacy of the technique although the publications each involved a small series of patients, Dr. Lawrence said in an interview.
A 2003 series (Cancer. 2003;97:554-60) of 15 primary or metastatic adrenal cell carcinomas that were unresectable or were in patients who were not surgical candidates showed nonenhancement and no growth in 8 (53%) at a mean follow-up of 10.3 months. Eight of the 12 tumors of 5 cm or smaller had complete loss of radiographic enhancement and a decrease in size.
From a retrospective series of 13 patients with functional adrenal neoplasms over 7 years, there was 100% resolution of biochemical abnormalities and clinical symptoms at a mean follow-up of 21.2 months. One small pneumothorax and one limited hemothorax occurred, neither of which required hospital admission. There were two instances of transient, self-remitting hypertension associated with the procedures (Radiology. 2011;258:308-16).
In 2015, one group of investigators followed 11 patients for 12 weeks postprocedure. Eight of nine patients with Conn’s syndrome attained normal serum aldosterone levels. One with a nodule close to the inferior vena cava had incomplete ablation. Two of two Cushing’s patients had normal cortisol levels after the procedure (J Vasc Interv Radiol. 2015;26:1459-64).
A retrospective analysis of 16 adrenal metastases showed that 13 (81%) had no local progression over 14 months after ablation. In two of three functional adrenal neoplasms, clinical and biochemical abnormalities resolved (Eur J Radiol. 2012.81:1717-23).
A retrospective series of 10 adrenal metastases showed that one recurred at 7 months after image-guided thermal ablation, with no recurrence of the rest at 26.6 months. There was no tumor recurrence for any of the cases of metastatic disease localized to the RF ablation site (J Vasc Interv Radiol. 2014;25:593-8).
Results were somewhat less good in a retrospective evaluation of 35 patients with unresectable adrenal masses over 9 years. Although 33 of 35 (94%) lost tumor enhancement after the initial adrenal RF ablation, there was local tumor progression in 8 of 35 (23%) patients at a mean follow-up of 30.1 months (Radiology. 2015;277:584-93).
Finally, Dr. Lawrence discussed a systematic literature review on adrenalectomy vs. stereotactic ablative body radiotherapy (SABR) and percutaneous catheter ablation (PCA) in the treatment of adrenal metastases: 30 papers on adrenalectomy on 818 patients; 9 papers on SABR on 178 patients; and 6 papers on PCA, including RF ablation, on 51 patients. The authors concluded that there was “insufficient evidence to determine the best local treatment modality for isolated or limited adrenal metastases.” Adrenalectomy appeared to be a reasonable treatment for suitable patients. SABR was a valid alternative for nonsurgical candidates, but they did not recommend PCA until more long-term outcomes were available (Cancer Treat Rev. 2014;40:838-46).
Dr. Lawrence concurred, based on her case study and literature review. She said RF ablation “offers patients a minimally invasive option for treating focal adrenal tumors” and is a “safe and effective procedure … in patients who are poor surgical candidates or refuse adrenalectomy.” More long-term follow-up studies are needed before RF ablation could replace adrenalectomy, she noted.
ORLANDO – Radiofrequency (RF) ablation is a safe and effective procedure for treating focal adrenal tumors in patients who are poor surgical candidates or who refuse adrenalectomy. With a short treatment time and minimal hospital stay, RF ablation can provide rapid clinical and biochemical improvement.
Dr. Lima Lawrence, an internal medicine resident at the University of Illinois at Chicago/Advocate Christ Medical Center in Oak Lawn, presented a case report and a review of the literature during an oral abstract session at the annual meeting of the American Association of Clinical Endocrinologists. The patient was a 65-year-old woman who presented with weight gain, decreased energy, and muscle weakness. On physical exam, she was hypertensive, anxious, obese, and had prominent supraclavicular fat pads. Salivary cortisol and overnight dexamethasone suppression tests were both elevated, and ACTH levels were depressed, confirming the diagnosis of a cortisol-secreting tumor causing adrenal Cushing’s syndrome. Computed tomography (CT) surveillance showed a progressively enlarging right-sided adrenal mass. A peritoneal biopsy revealed a low-grade serous neoplasm of peritoneal origin.
Her medical history included type 2 diabetes, uncontrolled hypertension, mixed connective tissue disease, depression, and total abdominal hysterectomy with bilateral salpingo-oophorectomy for ovarian cancer.
Dr. Lawrence said the patient had been scheduled for adrenalectomy, but it was not performed because of an intraoperative finding of peritoneal studding from what turned out to be metastatic ovarian cancer. Therefore, she underwent CT-guided RF ablation of the adrenal mass using a 14-gauge probe that heated a 3.5-cm ablation zone to 50-60 C for 8-10 minutes to achieve complete tumor necrosis.
The patient showed dramatic “clinical and biochemical improvement,” Dr. Lawrence said. The patient had no procedural complications and no blood loss and was observed for 23 hours before being discharged to home. A CT scan 8 weeks later showed a slightly decreased mass with marked decreased radiographic attenuation post-contrast from 30.2 Hounsfield Units (HU) preoperatively to 17 HU on follow-up.
Potential adverse outcomes using RF ablation include a risk of pneumothorax, hemothorax, and tumor seeding along the catheter track, but this last possibility can be mitigated by continuing to heat the RF probe as it is withdrawn.
Published evidence supports use of RF ablation. “To date there have been no randomized clinical trials comparing the safety, efficacy, and survival benefits of adrenalectomy vs. radio frequency ablation,” she said. It may not be feasible to do a randomized trial. But a review of the literature generally supports the efficacy of the technique although the publications each involved a small series of patients, Dr. Lawrence said in an interview.
A 2003 series (Cancer. 2003;97:554-60) of 15 primary or metastatic adrenal cell carcinomas that were unresectable or were in patients who were not surgical candidates showed nonenhancement and no growth in 8 (53%) at a mean follow-up of 10.3 months. Eight of the 12 tumors of 5 cm or smaller had complete loss of radiographic enhancement and a decrease in size.
From a retrospective series of 13 patients with functional adrenal neoplasms over 7 years, there was 100% resolution of biochemical abnormalities and clinical symptoms at a mean follow-up of 21.2 months. One small pneumothorax and one limited hemothorax occurred, neither of which required hospital admission. There were two instances of transient, self-remitting hypertension associated with the procedures (Radiology. 2011;258:308-16).
In 2015, one group of investigators followed 11 patients for 12 weeks postprocedure. Eight of nine patients with Conn’s syndrome attained normal serum aldosterone levels. One with a nodule close to the inferior vena cava had incomplete ablation. Two of two Cushing’s patients had normal cortisol levels after the procedure (J Vasc Interv Radiol. 2015;26:1459-64).
A retrospective analysis of 16 adrenal metastases showed that 13 (81%) had no local progression over 14 months after ablation. In two of three functional adrenal neoplasms, clinical and biochemical abnormalities resolved (Eur J Radiol. 2012.81:1717-23).
A retrospective series of 10 adrenal metastases showed that one recurred at 7 months after image-guided thermal ablation, with no recurrence of the rest at 26.6 months. There was no tumor recurrence for any of the cases of metastatic disease localized to the RF ablation site (J Vasc Interv Radiol. 2014;25:593-8).
Results were somewhat less good in a retrospective evaluation of 35 patients with unresectable adrenal masses over 9 years. Although 33 of 35 (94%) lost tumor enhancement after the initial adrenal RF ablation, there was local tumor progression in 8 of 35 (23%) patients at a mean follow-up of 30.1 months (Radiology. 2015;277:584-93).
Finally, Dr. Lawrence discussed a systematic literature review on adrenalectomy vs. stereotactic ablative body radiotherapy (SABR) and percutaneous catheter ablation (PCA) in the treatment of adrenal metastases: 30 papers on adrenalectomy on 818 patients; 9 papers on SABR on 178 patients; and 6 papers on PCA, including RF ablation, on 51 patients. The authors concluded that there was “insufficient evidence to determine the best local treatment modality for isolated or limited adrenal metastases.” Adrenalectomy appeared to be a reasonable treatment for suitable patients. SABR was a valid alternative for nonsurgical candidates, but they did not recommend PCA until more long-term outcomes were available (Cancer Treat Rev. 2014;40:838-46).
Dr. Lawrence concurred, based on her case study and literature review. She said RF ablation “offers patients a minimally invasive option for treating focal adrenal tumors” and is a “safe and effective procedure … in patients who are poor surgical candidates or refuse adrenalectomy.” More long-term follow-up studies are needed before RF ablation could replace adrenalectomy, she noted.
EXPERT ANALYSIS AT AACE 2016
