User login
Emergency Imaging: Facial Trauma After a Fall
An 89-year-old man presented to the ED with facial trauma due to a mechanical fall after losing his balance on uneven pavement and hitting the right side of his face. Physical examination revealed an ecchymosis inferior to the right eye and tenderness to palpation at the right maxilla and bilateral nasolabial folds. Maxillofacial computed tomography (CT) was ordered for further evaluation; representative images are presented above (Figure 1a and 1b).

What is the diagnosis?
Answer
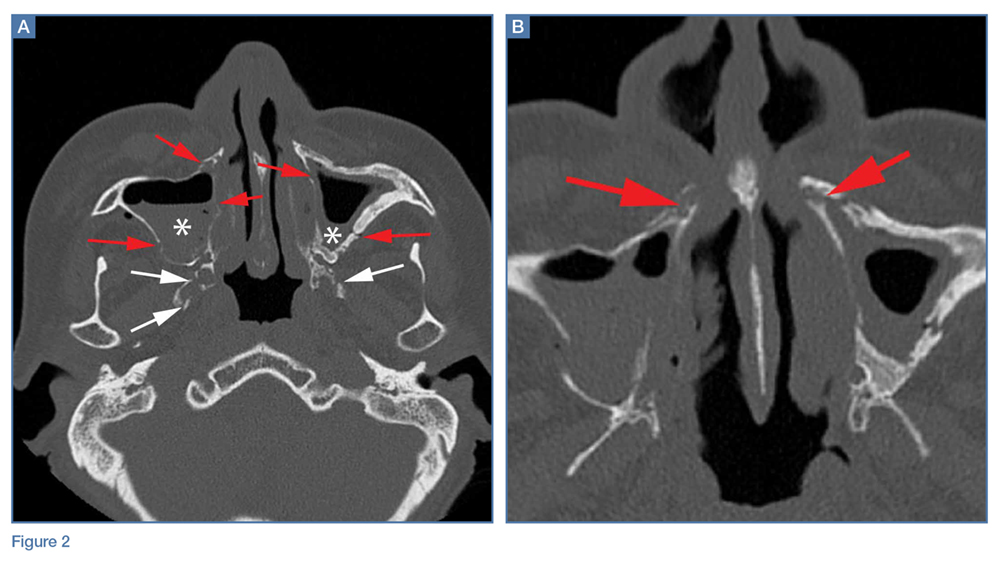
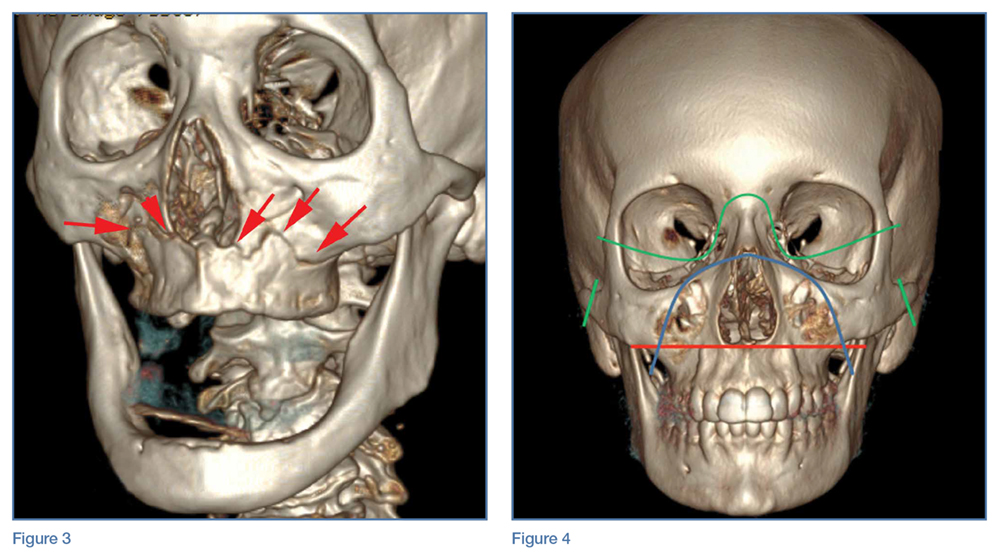
A noncontrast CT of the maxillofacial bones demonstrated acute fractures through the bilateral pterygoid plates (white arrows, Figure 2a). The fractures extended through the medial and lateral walls of the bilateral maxillary sinuses (red arrows, Figure 2a), and propagated to the frontal processes of the maxilla (red arrows, Figure 2b), extending toward the alveolar process, indicating involvement of the anterolateral margin of the nasal fossa. The full extent of the fracture is best seen on a 3D-reconstructed image (red arrows, Figure 3). Additional images (not presented here) confirmed no fracture involvement of the orbital floors, nasal bones, or zygomatic arches. Expected posttraumatic hemorrhage was appreciated within the maxillary sinuses (white asterisks, Figure 2a).
Le Fort Fractures
The findings described above are characteristic of a Le Fort I fracture pattern. Initially described in 1901 by René Le Fort, a French surgeon, the Le Fort classification system details somewhat predictable midface fracture patterns resulting in various degrees of craniofacial disassociation.1 Using weights that were dropped on cadaveric heads, Le Fort discovered that the pterygoid plates must be disrupted in order for the midface facial bones to separate from the skull base. As such, when diagnosing a Le Fort fracture, fracture of the pterygoid plate must be present, regardless of the fracture type (Le Fort I, II, and III).2
Le Fort I Fracture. This fracture pattern (red line, Figure 4) is referred to as a “floating palate” and involves separation of the hard palate from the skull base via fracture extension from the pterygoid plates into the maxillary sinus walls, as demonstrated in this case. The key distinguisher of the Le Fort I pattern is involvement of the anterolateral margin of the nasal fossa.2
Le Fort II Fracture. This fracture pattern (blue line, Figure 4) describes a “floating maxilla” wherein the pterygoid plate fractures are met with a pyramidal-type fracture pattern of the midface. The maxillary teeth form the base of the pyramid, and the fracture extends superiorly through the infraorbital rims bilaterally and toward the nasofrontal suture.2,3 Le Fort II fractures result in the maxilla floating freely from the rest of the midface and skull base.
Le Fort III Fracture. This fracture pattern (green lines, Figure 4) describes a “floating face” with complete craniofacial disjunction resulting from fracture of the pterygoid plates, nasofrontal suture, maxillofrontal suture, orbital wall, and zygomatic arch/zygomaticofrontal suture.2,3
It is important to note that midface trauma represents a complex spectrum of injuries, and Le Fort fractures only account for a small percentage of facial bone fractures that present through Level 1 trauma centers.2 Le Fort fracture patterns can coexist with other fracture patterns and also can be seen in combination with each other. For example, one side of the face may demonstrate a Le Fort II pattern while the other side concurrently demonstrates a Le Fort III pattern. Though not robust enough for complete description of and surgical planning for facial fractures, this classification system is a succinct and well-accepted means of describing major fracture planes.
1. Le Fort R. Etude experimentale sur les fractures de la machoire superieure. Rev Chir. 1901;23:208-227, 360-379, 479-507.
2. Rhea JT, Novelline RA. How to simplify the CT diagnosis of Le Fort fractures. AJR Am J Roentgenol. 2005;184(5):1700-1705.
3. Hopper RA, Salemy S, Sze RW. Diagnosis of midface fractures with CT: what the surgeon needs to know. Radiographics. 2006;26(3):783-793.
An 89-year-old man presented to the ED with facial trauma due to a mechanical fall after losing his balance on uneven pavement and hitting the right side of his face. Physical examination revealed an ecchymosis inferior to the right eye and tenderness to palpation at the right maxilla and bilateral nasolabial folds. Maxillofacial computed tomography (CT) was ordered for further evaluation; representative images are presented above (Figure 1a and 1b).
What is the diagnosis?
Answer
A noncontrast CT of the maxillofacial bones demonstrated acute fractures through the bilateral pterygoid plates (white arrows, Figure 2a). The fractures extended through the medial and lateral walls of the bilateral maxillary sinuses (red arrows, Figure 2a), and propagated to the frontal processes of the maxilla (red arrows, Figure 2b), extending toward the alveolar process, indicating involvement of the anterolateral margin of the nasal fossa. The full extent of the fracture is best seen on a 3D-reconstructed image (red arrows, Figure 3). Additional images (not presented here) confirmed no fracture involvement of the orbital floors, nasal bones, or zygomatic arches. Expected posttraumatic hemorrhage was appreciated within the maxillary sinuses (white asterisks, Figure 2a).
Le Fort Fractures
The findings described above are characteristic of a Le Fort I fracture pattern. Initially described in 1901 by René Le Fort, a French surgeon, the Le Fort classification system details somewhat predictable midface fracture patterns resulting in various degrees of craniofacial disassociation.1 Using weights that were dropped on cadaveric heads, Le Fort discovered that the pterygoid plates must be disrupted in order for the midface facial bones to separate from the skull base. As such, when diagnosing a Le Fort fracture, fracture of the pterygoid plate must be present, regardless of the fracture type (Le Fort I, II, and III).2
Le Fort I Fracture. This fracture pattern (red line, Figure 4) is referred to as a “floating palate” and involves separation of the hard palate from the skull base via fracture extension from the pterygoid plates into the maxillary sinus walls, as demonstrated in this case. The key distinguisher of the Le Fort I pattern is involvement of the anterolateral margin of the nasal fossa.2
Le Fort II Fracture. This fracture pattern (blue line, Figure 4) describes a “floating maxilla” wherein the pterygoid plate fractures are met with a pyramidal-type fracture pattern of the midface. The maxillary teeth form the base of the pyramid, and the fracture extends superiorly through the infraorbital rims bilaterally and toward the nasofrontal suture.2,3 Le Fort II fractures result in the maxilla floating freely from the rest of the midface and skull base.
Le Fort III Fracture. This fracture pattern (green lines, Figure 4) describes a “floating face” with complete craniofacial disjunction resulting from fracture of the pterygoid plates, nasofrontal suture, maxillofrontal suture, orbital wall, and zygomatic arch/zygomaticofrontal suture.2,3
It is important to note that midface trauma represents a complex spectrum of injuries, and Le Fort fractures only account for a small percentage of facial bone fractures that present through Level 1 trauma centers.2 Le Fort fracture patterns can coexist with other fracture patterns and also can be seen in combination with each other. For example, one side of the face may demonstrate a Le Fort II pattern while the other side concurrently demonstrates a Le Fort III pattern. Though not robust enough for complete description of and surgical planning for facial fractures, this classification system is a succinct and well-accepted means of describing major fracture planes.
1. Le Fort R. Etude experimentale sur les fractures de la machoire superieure. Rev Chir. 1901;23:208-227, 360-379, 479-507.
2. Rhea JT, Novelline RA. How to simplify the CT diagnosis of Le Fort fractures. AJR Am J Roentgenol. 2005;184(5):1700-1705.
3. Hopper RA, Salemy S, Sze RW. Diagnosis of midface fractures with CT: what the surgeon needs to know. Radiographics. 2006;26(3):783-793.

First EDition: Retail Clinics and Rate of ED Visits, more
Retail Clinics Have Not Decreased the Rate of Low-Acuity ED Visits
BY JEFF BAUER
The number of retail clinics—those located in pharmacies, supermarkets, and other retail settings—in the United States increased from 130 in 2006 to nearly 1,400 in 2012. However, this proliferation of retail clinics has not lead to a meaningful reduction in low-acuity ED visits, according to a recent observational study published in Annals of Emergency Medicine.1
Using information from the Healthcare Cost and Utilization Project State Emergency Department Databases, which include data on more than 2,000 EDs in 23 states from 2006 through 2013, researchers looked at the association between retail clinic penetration and the rate of treat-and-release ED visits for 11 low-acuity conditions (allergic rhinitis, bronchitis, conjunctivitis, other eye conditions, influenza, otitis externa, otitis media, pharyngitis, upper respiratory infections/sinusitis, urinary tract infections, and viral infections).
Retail clinic penetration was defined as the percentage of an ED’s catchment area (areas that accounted for up to 75% of patients who visited for low-acuity conditions) that overlapped with the 10-minute-drive radius of a retail clinic. The results were calculated as a rate ratio, which reflected the change in the rate of low-acuity ED visits associated with an ED having no retail clinic penetration to having approximately the average penetration rate within 2012. Results were controlled for the number of urgent care centers that were present in each ED catchment area, but only for hospital-associated urgent care centers, as there are no reliable data to identify all urgent care centers.
Retail clinic penetration more than doubled during the study period. Overall, increased retail clinic penetration was not associated with a change in the rate of low-acuity ED visits. Among patients with private insurance, there was a small reduction (0.3% per calendar quarter) in ED visits for low-acuity conditions, but this translated into an estimated 17 fewer ED visits by privately insured patients over 1 year for the average ED, assuming the retail clinic penetration rate increased by 40% in that year.
In an accompanying editorial,2 Jesse M. Pines, MD, suggests that visits to retail clinics may be mostly “new-use” visits, meaning many individuals who would not have otherwise received treatment seek care in a retail clinic because such clinics are available. Dr Pines proposed three reasons retail clinics may create new-use visits: they meet unmet demands for care; motivations for seeking care differ in EDs and retail clinics; and people who are more likely to use EDs for low-acuity conditions do so because they have limited access to other types of care, including retail clinics.
1. Martsolf G, Fingar KR, Coffey R, et al. Association between the opening of retail clinics and low-acuity emergency department visits. Ann Emerg Med. 2016. In press. http://dx.doi.org/10.1016/j.annemergmed.2016.08.462.
2. Pines JM. Why retail clinics do not substitute for emergency department visits and what this means for value-based care. Ann Emerg Med. 2016. In press. http://dx.doi.org/10.1016/j.annemergmed.2016.09.047.
Hypotension During Transport to ED Drives Mortality in Traumatic Brain Injury
MITCHEL L. ZOLER
FRONTLINE MEDICAL NEWS
The severity and duration of hypotension in traumatic brain injury (TBI) patients during emergency medical service (EMS) transport to an ED has a tight and essentially linear relationship to mortality rate during subsequent weeks of recovery, according to an analysis of more than 7,500 brain-injured patients.
For each doubling of the combined severity and duration of hypotension during the prehospital period, when systolic blood pressure (BP) was <90 mm Hg, patient mortality rose by 19%, Daniel W. Spaite, MD, reported at the American Heart Association scientific sessions.
However, the results do not address whether aggressive treatment of hypotension by EMS technicians in a patient with TBI leads to reduced mortality. That question is being assessed as part of the primary endpoint of the Excellence in Prehospital Injury Care-Traumatic Brain Injury (EPIC-TBI) study, which should be completed by the end of 2017, said Dr Spaite, professor of emergency medicine at the University of Arizona in Tucson.Results from prior studies have clearly linked prehospital hypotension with worse survival in TBI patients. Until now, however, there was no appreciation of the fact that not all hypotensive episodes are equal, and that both the severity of hypotension and its duration incrementally contribute to mortality as the “dose” of hypotension a patient experiences increases. In large part, this is because prehospital hypotension has been recorded simply as a dichotomous, yes/no condition.
The innovation introduced by Dr Spaite and his associates in their analysis of the EPIC-TBI data was to drill down into each patient’s hypotensive event, made possible by the 16,711 patients enrolled in EPIC-TBI. Their calculations were limited to patients with EMS records of at least two BP measurements during prehospital transport. These data allowed Spaite et al to utilize both the extent to which systolic BP dropped below 90 mm Hg and the amount of time systolic BP was below this threshold to better define the total hypotension exposure each patient received.
This meant that a patient with a TBI and a systolic BP of 80 mm Hg for 10 minutes had twice the hypotension exposure of both a patient with a systolic BP of 85 mm Hg for 10 minutes and a patient with a systolic BP of 80 mm Hg for 5 minutes.
The analysis by Spaite et al also adjusted the relationship of total hypotensive severity and duration and subsequent mortality based on several baseline demographic and clinical variables, including age, sex, injury severity, trauma type, and head-region severity score. After adjustment, the researchers found a “strikingly linear relationship” between hypotension severity and duration and mortality, Dr Spaite said.
The EPIC-TBI enrolled TBI patients aged 10 years or older during 2007 to 2014 through participation of dozens of EMS providers throughout Arizona. For the current analysis, the researchers identified 7,521 patients from the total group who had at least two BP measurements taken during their prehospital EMS care and also met other inclusion criteria.
The best way to manage hypotension in TBI patients during the prehospital period remains unclear. Simply raising BP via intravenous (IV) fluid infusion may not necessarily help, because it could exacerbate a patient’s bleeding, Dr Spaite noted during an interview.
The primary goal of EPIC-TBI is to assess the implementation of the third edition of the TBI guidelines released in 2007 by the Brain Trauma Foundation. (The fourth edition of these guidelines came out in August 2016.) The new finding by Dr Spaite and his associates will allow the full EPIC-TBI analysis to correlate patient outcomes with the impact that acute, prehospital treatment had on the hypotension severity and duration each patient experienced, he noted.
“What’s remarkable is that the single prehospital parameter of hypotension for just a few minutes during transport can have such a strong impact on survival, given all the other factors that can influence outcomes” in TBI patients once they reach a hospital and during the period they remain hospitalized, Dr Spaite said.
1. Spaite DW. Presentation at: American Heart Association Scientific Sessions 2016. November 12-16, 2016; New Orleans, LA.
Fluid Administration in Sepsis Did Not Increase Need for Dialysis
M. Alexander Otto
FRONTLINE MEDICAL NEWS
Fluid administration of at least 1 L did not increase the incidence of acute respiratory or heart failure in severe sepsis, and actually seemed to decrease the need for dialysis in a review of 164 patients at Scott and White Memorial Hospital in Temple, Texas.
For every 1 mL of fluid administered per kilogram of body weight, the likelihood of dialysis decreased by 8.5% (odds ratio [OR], 0.915; 95% confidence interval [CI], 0.854-0.980; P = .0111), with no increase in heart or respiratory failure on univariate analysis. The 126 patients (77%) who received at least 1 L of fluid had a 68% reduction in the need for dialysis (OR, 0.32; CI, 0.117-0.890; P = .0288).
These findings come from a quality improvement project the hospital launched after researchers there realized that the benchmark Surviving Sepsis Campaign guidelines were not being met. The patients in the study had a systolic BP below 90 mm Hg or lactate level of at least 4 mmol/L. The guidelines would have called for these patients to receive 30 mL/kg of crystalloid fluids within 3 hours of presentation, but only 28 patients (17%) met that mark.
“The No. 1 reason we weren’t meeting benchmarks was fluid administration,” explained lead investigator Aruna Jahoor, MD, a pulmonary critical care and sleep medicine fellow at Texas Tech University Health Sciences Center.
Seventeen percent of patients received ≥30 mL/kg of fluid resuscitation, while 28% received ≥20 mL/kg of IV fluid resuscitation. It turned out that staff in the ED—where most of the patients were treated in the critical first 6 hours—were concerned about fluid overload and putting patients into respiratory, heart, or renal failure, Dr Jahoor said. The team found no difference in mortality rates when patients received 30 mL/kg—just over 2 L in a patient weighing 70 kg—vs 20 mL/kg or 1 L. The patients’ in-hospital mortality rate and 28-day mortality rate were 27% and 32%, respectively.
There also were no increased rates of heart failure, acute respiratory failure, or mechanical ventilation when patients received at least 1 L of fluid. “There were [also] lower rates of dialysis, which indicated that we weren’t overloading patients. Even when we looked at fluid as a continuous variable, we still didn’t see” complications, Dr Jahoor said.
The findings should be reassuring to treating physicians. “When you have pushback against 30-mL/kg administration, you can say ‘well, at least let’s give a liter.’ You don’t have to worry as much about some of the complications you are citing,’ ” she said.
For very obese patients, “it can get a little uncomfortable to be given” enough fluid to meet the 30-mL/kg goal, “but you can give at least a liter” without having to worry too much, she said. The patients in the study were treated from 2010 to 2013; normal saline was the most common resuscitation fluid. The hospital has since added the 30-mL/kg fluid resuscitation to its sepsis admission orders, and compliance has increased significantly.
A multivariate analysis is in the works to control for confounders. “We will probably [still] see you are not having increased rates of congestive heart or respiratory failure, or needing dialysis,” Dr Jahoor said. The protective effect against dialysis might drop out, “but I am hoping it doesn’t,” she said.
1. Jahoor A, Delmas T, Giri B, et al. Fluid resuscitation of at least 1 liter in septic patients decreases the need for renal replacement therapy without increasing the risk of acute congestive heart failure or acute respiratory failure. Chest. 2016;150(4_S):349A. doi:10.1016/j.chest.2016.08.362.
Survey: Antibiotic Shortages Are the New Norm
SHARON WORCESTER
FRONTLINE MEDICAL NEWS
Antibiotic shortages reported by the Emerging Infections Network (EIN) in 2011 persist in 2016, according to a Web-based follow-up survey of infectious disease physicians.
Of 701 network members who responded to the EIN survey in early 2016, 70% reported needing to modify their antimicrobial choice because of a shortage in the past 2 years. They did so by using broader-spectrum agents (75% of respondents), more costly agents (58%), less effective second-line agents (45%), and more toxic agents (37%), Adi Gundlapalli, MD, PhD, reported at an annual scientific meeting on infectious diseases.
In addition, 73% of respondents reported that the shortages affected patient care or outcomes, reported Dr Gundlapalli of the University of Utah, Salt Lake City.
The percentage of respondents reporting adverse patient outcomes related to shortages increased from 2011 to 2016 (51% vs 73%), he noted at the combined annual meetings of the Infectious Diseases Society of America, the Society of Healthcare Epidemiology of America, the HIV Medicine Association, and the Pediatric Infectious Diseases Society.
In the 2016 survey, the top 10 antimicrobials reported as being in short supply over the past 2 years were piperacillin-tazobactam, ampicillin-sulbactam, meropenem, cefotaxime, cefepime, trimethoprim-sulfamethoxazole (TMP-SMX), doxycycline, imipenem, acyclovir, and amikacin. Trimethoprim-sulfamethoxazole and acyclovir were in short supply in 2011 and 2016.
According to respondents, the most common ways they learned about drug shortages were from hospital notification (76%), from a colleague (56%), from a pharmacy that contacted them regarding a prescription for the agent (53%), or from the US Food and Drug Administration (FDA) Web site or another Web site (23%). The most common ways of learning about a shortage changed—from notification after trying to prescribe a drug in 2011, to proactive hospital/system (local) notification in 2016; 71% of respondents said that communications in 2016 were sufficient.
Most respondents (83%) reported that guidelines for dealing with shortages had been developed by an antimicrobial stewardship program (ASP) at their institution.
“This, I think, is one of the highlight results,” said Dr Gundlapalli, who is also a staff physician at the VA Salt Lake City Health System. “In 2011, we had no specific question or comments received about [ASPs], and here in 2016, 83% of respondents’ institutions had developed guidelines related to drug shortages.”
Respondents also had the opportunity to submit free-text responses, and among the themes that emerged was concern regarding toxicity and adverse outcomes associated with increased use of aminoglycosides because of the shortage of piperacillin-tazobactam. Another was the shortage of meropenem, which led one ASP to “institute restrictions on its use, which have continued,” he said.
“Another theme was ‘simpler agents seem more likely to be in shortage,’ ” Dr Gundlapalli said, noting ampicillin-sulbactam in 2016 and penicillin G procaine as examples.
“And then, of course, the other theme across the board...was our new asset,” he said, explaining that some respondents commented on the value of ASP pharmacists and programs to help with drug shortage issues.
The overall theme of this follow-up survey, in the context of prior surveys in 2001 and 2011, is that antibiotic shortages are the “new normal—a way of life,” Dr Gundlapalli said.
“The concerns do persist, and we feel there is further work to be done here,” he said. He specifically noted that there is a need to inform and educate fellows and colleagues in hospitals, increase awareness generally, improve communication strategies, and conduct detailed studies on adverse effects and outcomes.
“And now, since ASPs are very pervasive...maybe it’s time to formalize and delineate the role of ASPs in antimicrobial shortages,” he said.
Donald Graham, MD, one of the study’s coauthors, said he believes the problem is in part the result of economics, and in part because of “the higher standards that the FDA imposes upon these manufacturing concerns.” These drugs often are low-profit items, and it is not always in the financial best interest of a pharmaceutical company to upgrade their facilities.
1. Gundlapalli A. Presentation at: IDWeek 2016. October 26-30, 2016. New Orleans, LA.
Hospitalizations for Opioid Poisoning Tripled in Preschool Children
Richard Franki
FRONTLINE MEDICAL NEWS
From 1997 to 2012, the annual number of hospitalizations for opioid poisoning rose 178% among children aged 1 to 19 years, according to data from 13,052 discharges in the Agency for Healthcare Research and Quality’s Kids’ Inpatient Database.
In 2012, there were 2,918 hospitalizations for opioid poisoning among children aged 1 to 19 years, compared with 1,049 in 1997, reported Julie R. Gaither, PhD, MPH, RN, and her associates at Yale University in New Haven, Connecticut.
The greatest change occurred among the youngest children, as the number of those aged 1 to 4 years rose from 133 in 1997 to 421 in 2012—an increase of 217%. For those aged 15 to 19 years, the annual number of hospitalizations went from 715 to 2,171 (204%) over that time period, which included a slight drop from 2009 to 2012, according to the investigators,
The increase in hospitalizations for prescription opioid poisoning in children aged 10 to 14 years was 58% from 1997 to 2012 (rising from 171 to 272), while estimates for 5- to 9-year-old children did not meet the criteria for statistical reliability and were not included in the analysis, Dr Gaither and her associates said.
1. Gaither JR, Leventhal JM, Ryan SA, Camenga DR. National trends in hospitalizations for opioid poisonings among children and adolescents, 1997 to 2012. JAMA Pediatr. 2016 Oct 31. Epub ahead of print. doi:10.1001/jamapediatrics.2016.2154.
Pelvic Fracture Pattern Predicts the Need for Hemorrhage Control
Doug Brunk
FRONTLINE MEDICAL NEWS
Blunt trauma patients admitted in shock with anterior posterior compression III or vertical shear fracture patterns, or patients with open pelvic fracture are at greatest risk of severe bleeding requiring pelvic hemorrhage-control intervention, results from a multicenter trial demonstrated.
Thirty years ago, researchers defined a classification of pelvic fracture based on a pattern of force applied to the pelvis, Todd W. Costantini, MD, said at the annual meeting of the American Association for the Surgery of Trauma (AAST). They identified three main force patterns: lateral compression, anterior posterior compression, and vertical shear.
“They were able to show that certain pelvic fractures were associated with soft-tissue injury and pelvic hemorrhage,” said Dr Costantini, of the division of trauma, surgical critical care, burns and acute care surgery at the University of California, San Diego. “Since then, several single-center studies have been conducted in an attempt to correlate fracture pattern with the risk of pelvic hemorrhage. A majority of these studies evaluated angiogram [and embolization] as the endpoint for hemorrhage control. Modern trauma care has evolved to include multiple modalities to control hemorrhage, which include pelvic external fixator placement, pelvic angiography and embolization, preperitoneal pelvic packing, and the use of the REBOA [Resuscitative Endovascular Balloon Occlusion of the Aorta] catheter as an adjunct to hemorrhage control.”
In a recently published study, Dr Costantini and his associates found wide variability in the use of pelvic hemorrhage-control methods.1 “While angioembolization alone and external fixator placement alone were the most common methods used, there were various combinations of these methods used at different times by different institutions,” he said.
These results prompted the researchers to prospectively evaluate the correlation between pelvic fracture pattern and modern care of pelvic hemorrhage control at 11 Level 1 trauma centers over a 2-year period.2 Inclusion criteria for the study, which was sponsored by the AAST Multi-institutional Trials Committee, were patients over age 18 years, blunt mechanism of injury, and shock on admission defined as “...systolic blood pressure <90 mm Hg or heart rate >120 beats per minute or base deficit <-5.”1 Exclusion criteria included isolated hip fracture, pregnancy, and lack of pelvic imaging.
The researchers evaluated the pelvic fracture pattern for each patient in the study. “Each pelvic image was evaluated by a trauma surgeon, orthopedic surgeon, or radiologist and classified using the Young-Burgess Classification system,” Dr Costantini said. Next, they used univariate and multivariate logistic regression analyses to examine predictors for hemorrhage control intervention and mortality. The objective was to determine whether pelvic fracture pattern would predict the need for a hemorrhage control intervention.
Of the 46,716 trauma patients admitted over the 2-year period, 1,339 sustained a pelvic fracture. Of these, 178 met criteria for shock. The researchers excluded 15 patients due to lack of pelvic imaging, which left 163 patients in the final analysis. Their mean age was 44 years and 58% were male. On admission, their mean systolic BP was 93 mm Hg, their mean HR was 117 beats/min, and their median Injury Severity Score was 28. The mean hospital length of stay was 12 days and the mortality rate was 30%. The three most common mechanisms of injury were motor vehicle crash (42%), followed by pedestrian vs auto (23%), and falls (18%).
Compared with patients who did not require hemorrhage-control intervention, those who did received more transfusion of packed red blood cells (13 vs 7 units, respectively; P < .01) and fresh frozen plasma (10 U vs 5 U; P = .01). In addition, 67% of patients with open pelvic fracture required a hemorrhage control intervention. The rate of mortality was similar between the patients who required a pelvic hemorrhage control intervention and those who did not (34% vs 28%; P = .47).
The three most common types of pelvic fracture patterns were lateral compression I (36%) and II (23%), followed by vertical shear (13%). Patients with lateral compression I and II fractures were least likely to require hemorrhage-control intervention (22% and 19%, respectively). However, on univariate analysis, patients with anterior posterior compression III fractures and those with vertical shear fractures were more likely to require a pelvic hemorrhage control intervention, compared with those who sustained other types of pelvic fractures (83% and 55%, respectively).
On multivariate analysis, the three main independent predictors of need for a hemorrhagic control intervention were anterior posterior compression III fracture (OR, 109.43; P < .001), open pelvic fracture (OR, 7.36; P = .014), and vertical shear fracture (OR, 6.99; P = .002). Pelvic fracture pattern did not predict mortality on multivariate analysis.
The invited discussant, Joseph M. Galante, MD, trauma medical director for the University of California, Davis Health System, characterized the study as important “because it examines all forms of hemorrhage control, not just arterioembolism in the treatment of pelvic fractures,” he said. “The ability to predict who will need hemorrhage control allows for earlier mobilization to resources, both in the operating room or interventional suite and in the resuscitation bay.”
1. Costantini TW, Coimbra R, Holcomb JB, et al. Current management of hemorrhage from severe pelvic fractures: Results of an American Association for the Surgery of Trauma multi-institutional trial. J Trauma Acute Care Surg. 2016;80(5):717-723; discussion 723-725. doi:10.1097/TA.0000000000001034.2. Costantini TW. Presentation at: 75th Annual Meeting of American Association for the Surgery of Trauma (AAST) and Clinical Congress of Acute Care Surgery. September 14-17, 2016. Waikoloa, Hawaii.

TAVR valve durability supported in large follow-up
WASHINGTON – First-generation, balloon-expandable transcatheter aortic valves had a less than 1% rate of valve failure in planned echocardiography examinations during follow-up that extended as long as 5 years after valve placement in more than 2,400 patients, a demonstration of durability that experts uniformly called “reassuring.”
This finding from patients who underwent transcatheter aortic valve replacement (TAVR) in the first U.S. pivotal trial for these devices, PARTNER 1 parts A and B, and during the subsequent continued-access program at PARTNER 1 study sites, represents the largest and longest systematic ultrasound follow-up of TAVR patients, Pamela S. Douglas, MD, said at the Transcatheter Cardiovascular Therapeutics annual meeting.

This evaluation of 2,404 TAVR patients in the PARTNER 1 trial examined by echocardiography and encompassing 6,493 patient-years of follow-up is the “largest core-lab based study of transcatheter heart valves to date. These data demonstrate excellent durability of transcatheter heart valves, suggesting that the low 5-year survival observed in this cohort is not related to adverse hemodynamics or transcatheter heart valve deterioration,” said Dr. Douglas, professor of medicine at Duke University, Durham, N.C.
Her findings showed that out of the 2,482 patients treated with TAVR (and including those without echo follow-up) either in the trial or during the continued access program and followed for a median of 2.9 years and an average of 2.6 years, 20 patients (0.8%) required a reintervention. Four of these 20 patients (0.2% of the total cohort) showed a “classic pattern” of aortic valve deterioration marked by an increased valve pressure gradient and a reduced valve area, she reported.
“Reintervention was rare, became less frequent over time, and was usually not due to structural deterioration of the transcatheter heart valve,” she said. But Dr. Douglas also cautioned that among the patients who received the first-generation, balloon expandable Sapien valve in this cohort, just 39% survived to 5 years, and a mere 282 patients (11%) actually underwent echocardiographic examination at 5 years.
“This is one of several steps we need to take to figure out the durability of transcatheter valves,” said Jeffrey J. Popma, MD, professor of medicine and an interventional cardiologist at Beth Israel Deaconess Medical Center, Boston. He noted that data are needed from follow-up periods of 8 or 10 years, but these data will not be available until intermediate- or low-risk patients undergo TAVR in controlled circumstances and have long-term follow-up.

“Ten-year follow-up data will essentially be impossible” for the high-risk or inoperable patients treated with TAVR in the PARTNER 1 trial, which focused on the sickest patients with aortic stenosis, said Dr. Popma, lead investigator for several studies of TAVR using self-expanding aortic valves and marketed as CoreValve devices.
“We obviously need to follow patients longer. The 5-year results look terrific, and so very reassuring, but we need to keep an eye on this as we move TAVR into less sick and younger patients,” said Dr. Robert O. Bonow, professor of cardiology at Northwestern University, Chicago. “Durability is the remaining frontier in terms of moving TAVR into younger patients,” Dr. Bonow said at the meeting, which was sponsored by the Cardiovascular Research Foundation.

These data continue to show that “transcatheter valves have looked hemodynamically superior to surgically-placed valves with respect to the VARC (Valve Academic Research Consortium)–2 criteria” for prosthetic valve function, Dr. Popma noted. “I think the benefits of surgical valves have been overstated and the benefits of transcatheter valves understated,” he said.
“Surgical valves have not been held to the same [very demanding] standard as transcatheter valves,” Dr. Douglas agreed.
The data Dr. Douglas reported contrast with longer-term follow-up reported in May 2016 for 378 patients who underwent TAVR at either of two pioneering centers in a retrospective review. Those data suggested a valve degeneration rate of about 50% after 8 years, Danny Dvir, MD, reported at the annual congress of the European Association of Percutaneous Cardiovascular Interventions. Speaking recently in an interview, Dr. Dvir acknowledged some of the challenges in trying to derive valve durability information from a relatively small number of very-high-risk patients who underwent TAVR very early during development of the procedure.
Some TAVR experts have also questioned the criteria that Dr. Dvir used to identify valve structural valve degeneration for this analysis. “The criteria he used were much more stringent that the criteria we have used to assess surgically-placed valves,” said Michael J. Reardon, MD, professor of cardiovascular surgery at Houston Methodist Hospital. “If surgically-placed aortic valves were subjected to the same criteria Dr. Dvir applied then they would perform even worse,” Dr. Reardon said in an interview.
PARTNER 1 was sponsored by Edwards Lifesciences, the company that had marketed the Sapien first-generation, balloon expandable TAVR system. Dr. Douglas has received research support from Edwards. Dr. Bonow had no disclosures. Dr. Popma has been the lead investigator for several studies of a self-expanding TAVR system sponsored by Medtronic, and he has also received research funding from several other companies, has been a consultant to Boston Scientific and Direct Flow, and owns equity in Direct Flow. Dr. Dvir has been a consultant to and received research support from Edwards, Medtronic, and St. Jude. Dr. Reardon has been a consultant to Medtronic.
[email protected]
On Twitter @mitchelzoler
The data reported by Dr. Douglas are very important and very reassuring. It isn’t easy to evaluate long-term results in patients who underwent TAVR in the early days because that population of patients was old and at very high risk. Even when patients had successful procedures their longevity wasn’t long. Only about 10% of the starting population of 2,482 patients in Dr. Douglas’ study actually had echocardiography done after 5 years. To assess durability you need longer-term echo follow-up, but it will be very challenging to have enough patients to have statistical power to do that.
I am not nervous about long-term durability of TAVR in octogenarian patients, the most typical age for TAVR patients today and since we began using it. Durability is more of an issue for patients who are 75 or younger, and we will need data from 7- to 10-year follow-up of younger patients to have a reasonable answer. Younger patients who undergo TAVR may face more of a threat from valve deterioration simply because of their longer life expectancy. In addition, with surgical valves we know that younger age is one of the strongest predictors of valve degeneration.

Danny Dvir, MD , is an interventional cardiologist at the University of Washington in Seattle. He has been a consultant to and received research support from Edwards, Medtronic, and St. Jude. He made these comments in an interview.
The data reported by Dr. Douglas are very important and very reassuring. It isn’t easy to evaluate long-term results in patients who underwent TAVR in the early days because that population of patients was old and at very high risk. Even when patients had successful procedures their longevity wasn’t long. Only about 10% of the starting population of 2,482 patients in Dr. Douglas’ study actually had echocardiography done after 5 years. To assess durability you need longer-term echo follow-up, but it will be very challenging to have enough patients to have statistical power to do that.
I am not nervous about long-term durability of TAVR in octogenarian patients, the most typical age for TAVR patients today and since we began using it. Durability is more of an issue for patients who are 75 or younger, and we will need data from 7- to 10-year follow-up of younger patients to have a reasonable answer. Younger patients who undergo TAVR may face more of a threat from valve deterioration simply because of their longer life expectancy. In addition, with surgical valves we know that younger age is one of the strongest predictors of valve degeneration.
Danny Dvir, MD , is an interventional cardiologist at the University of Washington in Seattle. He has been a consultant to and received research support from Edwards, Medtronic, and St. Jude. He made these comments in an interview.
WASHINGTON – First-generation, balloon-expandable transcatheter aortic valves had a less than 1% rate of valve failure in planned echocardiography examinations during follow-up that extended as long as 5 years after valve placement in more than 2,400 patients, a demonstration of durability that experts uniformly called “reassuring.”
This finding from patients who underwent transcatheter aortic valve replacement (TAVR) in the first U.S. pivotal trial for these devices, PARTNER 1 parts A and B, and during the subsequent continued-access program at PARTNER 1 study sites, represents the largest and longest systematic ultrasound follow-up of TAVR patients, Pamela S. Douglas, MD, said at the Transcatheter Cardiovascular Therapeutics annual meeting.
This evaluation of 2,404 TAVR patients in the PARTNER 1 trial examined by echocardiography and encompassing 6,493 patient-years of follow-up is the “largest core-lab based study of transcatheter heart valves to date. These data demonstrate excellent durability of transcatheter heart valves, suggesting that the low 5-year survival observed in this cohort is not related to adverse hemodynamics or transcatheter heart valve deterioration,” said Dr. Douglas, professor of medicine at Duke University, Durham, N.C.
Her findings showed that out of the 2,482 patients treated with TAVR (and including those without echo follow-up) either in the trial or during the continued access program and followed for a median of 2.9 years and an average of 2.6 years, 20 patients (0.8%) required a reintervention. Four of these 20 patients (0.2% of the total cohort) showed a “classic pattern” of aortic valve deterioration marked by an increased valve pressure gradient and a reduced valve area, she reported.
“Reintervention was rare, became less frequent over time, and was usually not due to structural deterioration of the transcatheter heart valve,” she said. But Dr. Douglas also cautioned that among the patients who received the first-generation, balloon expandable Sapien valve in this cohort, just 39% survived to 5 years, and a mere 282 patients (11%) actually underwent echocardiographic examination at 5 years.
“This is one of several steps we need to take to figure out the durability of transcatheter valves,” said Jeffrey J. Popma, MD, professor of medicine and an interventional cardiologist at Beth Israel Deaconess Medical Center, Boston. He noted that data are needed from follow-up periods of 8 or 10 years, but these data will not be available until intermediate- or low-risk patients undergo TAVR in controlled circumstances and have long-term follow-up.
“Ten-year follow-up data will essentially be impossible” for the high-risk or inoperable patients treated with TAVR in the PARTNER 1 trial, which focused on the sickest patients with aortic stenosis, said Dr. Popma, lead investigator for several studies of TAVR using self-expanding aortic valves and marketed as CoreValve devices.
“We obviously need to follow patients longer. The 5-year results look terrific, and so very reassuring, but we need to keep an eye on this as we move TAVR into less sick and younger patients,” said Dr. Robert O. Bonow, professor of cardiology at Northwestern University, Chicago. “Durability is the remaining frontier in terms of moving TAVR into younger patients,” Dr. Bonow said at the meeting, which was sponsored by the Cardiovascular Research Foundation.
These data continue to show that “transcatheter valves have looked hemodynamically superior to surgically-placed valves with respect to the VARC (Valve Academic Research Consortium)–2 criteria” for prosthetic valve function, Dr. Popma noted. “I think the benefits of surgical valves have been overstated and the benefits of transcatheter valves understated,” he said.
“Surgical valves have not been held to the same [very demanding] standard as transcatheter valves,” Dr. Douglas agreed.
The data Dr. Douglas reported contrast with longer-term follow-up reported in May 2016 for 378 patients who underwent TAVR at either of two pioneering centers in a retrospective review. Those data suggested a valve degeneration rate of about 50% after 8 years, Danny Dvir, MD, reported at the annual congress of the European Association of Percutaneous Cardiovascular Interventions. Speaking recently in an interview, Dr. Dvir acknowledged some of the challenges in trying to derive valve durability information from a relatively small number of very-high-risk patients who underwent TAVR very early during development of the procedure.
Some TAVR experts have also questioned the criteria that Dr. Dvir used to identify valve structural valve degeneration for this analysis. “The criteria he used were much more stringent that the criteria we have used to assess surgically-placed valves,” said Michael J. Reardon, MD, professor of cardiovascular surgery at Houston Methodist Hospital. “If surgically-placed aortic valves were subjected to the same criteria Dr. Dvir applied then they would perform even worse,” Dr. Reardon said in an interview.
PARTNER 1 was sponsored by Edwards Lifesciences, the company that had marketed the Sapien first-generation, balloon expandable TAVR system. Dr. Douglas has received research support from Edwards. Dr. Bonow had no disclosures. Dr. Popma has been the lead investigator for several studies of a self-expanding TAVR system sponsored by Medtronic, and he has also received research funding from several other companies, has been a consultant to Boston Scientific and Direct Flow, and owns equity in Direct Flow. Dr. Dvir has been a consultant to and received research support from Edwards, Medtronic, and St. Jude. Dr. Reardon has been a consultant to Medtronic.
[email protected]
On Twitter @mitchelzoler
AT TCT 2016
Key clinical point:
Major finding: During median follow-up of 2.9 years, 0.2% of patients had valves with classic hemodynamic signs of valve deterioration.
Data source: A total of 2,482 TAVR patients either enrolled in the PARTNER 1 trial or who underwent TAVR during a continued access program.
Disclosures: PARTNER 1 was sponsored by Edwards Lifesciences, the company that had marketed the Sapien first-generation, balloon expandable TAVR system. Dr. Douglas has received research support from Edwards. Dr. Bonow had no disclosures. Dr. Popma has been the lead investigator for several studies of a self-expanding TAVR system sponsored by Medtronic, and he has also received research funding from several other companies, has been a consultant to Boston Scientific and Direct Flow, and owns equity in Direct Flow. Dr. Dvir has been a consultant to and received research support from Edwards, Medtronic, and St. Jude. Dr. Reardon has been a consultant to Medtronic.
Malpractice Counsel: Abdominal pain in an elderly patient
Case
An 89-year-old woman presented to the ED with the chief complaints of abdominal pain and nausea with vomiting. The patient stated that several hours prior, she had ingested an expired beverage, which she related to the sudden onset of her symptoms. The patient denied fever, chills, dysuria, or frequency. Her medical history was significant for chronic atrial fibrillation (AF) and congestive heart failure. The patient’s medications included metoprolol and furosemide; she was not on any anticoagulation medication.
On physical examination, the patient appeared her stated age, and was in moderate distress secondary to the abdominal pain. Vital signs were: temperature, 98.8oF; heart rate, 98 beats/min; respiratory rate, 20 breaths/min; and blood pressure, 116/72 mm Hg. Oxygen saturation was 97% on room air. The head, eyes, ears, nose, and throat examination was unremarkable. On lung examination, breath sounds were equal bilaterally with bibasilar rales. The heart rhythm was irregularly irregular without murmurs, rubs, or gallops. The abdomen was soft to palpitation, but diffusely tender, without rebound, guarding, or mass. Rectal examination revealed normal tone and brown stool, and was trace positive for heme.
The emergency physician (EP) ordered an electrocardiogram (ECG), complete blood count, basic metabolic profile (BMP), urinalysis, and lipase test. The patient was administered intravenous (IV) normal saline at 75 cc/h, and morphine 4 mg and ondansetron 4 mg IV for the abdominal pain, nausea, and vomiting. She required several more doses of morphine due to the severity of the pain. The laboratory results included an elevated white blood count of 18.4 x 10⁹/L with a left shift, but normal hemoglobin and hematocrit values. The ECG demonstrated AF with a controlled ventricular rate; there was no evidence of ischemia or injury. The BMP was remarkable for a slightly depressed potassium level (3.3 mEq/L), a decreased serum bicarbonate of 20 mEq/L, and evidence of renal insufficiency with a blood urea nitrogen of 28 mg/dL and a serum creatinine of 1.6 mg/dL. Given the ongoing severe pain, leukocytosis, metabolic acidosis, and lack of clear etiology, the EP ordered a computed tomography (CT) scan of the abdomen and pelvis; no IV contrast was ordered because of the abnormal renal function studies.
The radiologist interpreted the CT scan as essentially normal. The EP admitted the patient to the on-call hospitalist, who consulted both cardiology and gastroenterology services. During the night, the patient complained of increasing abdominal pain, and her abdomen became distended with peritoneal signs. She was taken emergently to the operating room in the early morning hours. A large segment of gangrenous small intestine was found upon exploration. The surgery was discontinued and comfort care measures were instituted. The patient died the following day.
The patient’s family sued the EP and the hospital for failure to make a timely diagnosis of mesenteric ischemia. They further stated that the EP should have ordered a CT angiogram (CTA) of the abdomen and pelvis. The defense argued that a contrast CT scan was contraindicated because of the patient’s poor renal function. A defense verdict was returned at trial.
Discussion
Elderly patients (defined as older than age 65 years) presenting to the ED with abdominal pain remain a diagnostic challenge for even the most seasoned clinician. While elderly patients with a chief complaint of abdominal pain represent only a small percentage of ED patients, approximately 50% to 66% of these patients will require hospitalization, while one-third will require a surgical intervention.1 The seriousness of this complaint in elderly patients is further emphasized by the fact that older patients with abdominal pain have a 6- to 8-fold increase in mortality compared to younger patients.2,3 This can be partially explained by the simple fact that the life-threatening causes of abdominal pain—abdominal aortic aneurysm, mesenteric ischemia, bowel perforation, volvulus, and acute bowel obstruction—occur more frequently (but not exclusively) in elderly patients. Historical risk factors for life-threatening causes of abdominal pain include: age older than 65 years, immunocompromised state, alcohol abuse, cardiovascular (CV) disease (eg, coronary artery disease, hypertension, AF), major comorbidities (eg, cancer, renal failure), and prior surgery or recent gastrointestinal instrumentation.1
The patient in this case had two risk factors for life-threatening causes of lower abdominal pain—age and AF. These are also two of the major risk factors for mesenteric ischemia, which was her ultimate diagnosis.
Acute mesenteric ischemia refers to the sudden onset of small intestinal hypoperfusion, frequently due to acute occlusion (embolism or thrombosis) of an intestinal artery, most commonly the superior mesenteric artery (SMA).4 The SMA supplies the entire small intestine except for the proximal duodenum. Other causes of acute mesenteric ischemia include venous occlusion (thrombosis) and nonocclusive mesenteric ischemia secondary to vasoconstriction from low-cardiac output or use of vasopressors.4
Thromboembolic occlusion of the SMA is the most common cause of acute mesenteric ischemia, accounting for 67% to 95% of cases.4 In addition to AF, the risk of arterial embolism is increased in patients with valvular disease, infective endocarditis, recent myocardial infarction, aortic atherosclerosis, or aortic aneurysm.4 Risk factors for thrombotic arterial occlusion include peripheral artery disease, advanced age, and low-cardiac output states.5
A frequent presentation of embolic mesenteric arterial ischemia, occurring in approximately one-third of cases, is an elderly patient with AF (or other source of embolism) and onset of severe, sudden abdominal pain out of proportion to physical examination. While nausea and vomiting are also common, bloody bowel movements are less frequent in the early course of the disease process.4 A history of a prior embolic event is present in approximately one-third of such patients.
On physical examination, the abdomen may be normal initially, or demonstrate only mild distention and tenderness without peritoneal signs. However, as the ischemia progresses, the abdomen becomes more distended, bowel sounds become absent, and peritoneal signs (ie, guarding and rebound) become apparent.6
The results of laboratory studies can suggest the diagnosis, but none are confirmatory. Laboratory findings may include a marked leukocytosis with left shift, an elevated hematocrit secondary to hemoconcentration, and metabolic acidosis. A helpful clinical pearl is to consider intestinal ischemia in the differential diagnosis of any patient with acute abdominal pain and metabolic acidosis.6 Serum lactate is frequently elevated (73%-94%) but a very nonspecific marker. Similarly, an arterial blood gas analysis may demonstrate metabolic acidosis. More recently, a normal D-dimer result has been used to help exclude the diagnosis of acute intestinal ischemia, since it is elevated in 96% of patients with the disease.6 Similar to lactate, an abnormal D-dimer result has a poor specificity (40%).6 Early in the disease course, nearly all laboratory studies may be normal.
Depending on the severity of the presentation, imaging can help make the definitive diagnosis. For patients with peritonitis or obvious bowel perforation, IV fluid resuscitation, IV antibiotics, and immediate surgical exploration are indicated. Plain radiographs of the abdomen offer little help, as many of the findings early in the disease course are nonspecific, and radiographs can be normal in 25% of cases.6 Ultrasound can identify arterial stenosis or occlusion of the SMA, but is frequently technically limited by the presence of air-filled loops of distended bowel.6 Magnetic resonance angiography has similar sensitivity and specificity as CTA for mesenteric arterial ischemia, and is actually more sensitive than CTA for mesenteric venous thrombosis; it also can be performed in patients with contrast allergy.6 However, CTA is performed more commonly because of its lower cost, greater speed, and wide availability.6 A CTA of the abdomen and pelvis (without oral contrast) is probably the best study for patients in whom mesenteric ischemia is high on the differential diagnosis.6 For patients with a less clear picture and a broader differential diagnosis, a CT scan of the abdomen/pelvis with both IV and oral contrast is preferred.7 Common findings on CT scan with IV/oral contrast in acute mesenteric ischemia include the following: bowel wall thickening, dilatation, stranding, bowel wall attenuation, abnormal enhancement, and pneumatosis. Unfortunately, many of these findings are nonspecific.7
Once the diagnosis of acute mesenteric ischemia is made, patients should be designated “nothing by mouth” and a nasogastric tube placed to decompress the bowel. These patients will require IV fluid resuscitation with normal saline. The amount and rate will depend on their clinical presentation and underlying CV status. Any electrolyte abnormalities should be corrected and broad spectrum IV antibiotics initiated. Vascular surgery or general surgery services should be consulted to determine the optimal management. Most patients with acute intestinal ischemia due to mesenteric arterial occlusion (or venous occlusive or nonocclusive mesenteric ischemia) will be started on anticoagulation, typically IV heparin, unless contraindications are present.6 Surgical treatment options include arterial embolectomy, arterial bypass, arterial stenting, arterial thrombolysis, or intra-arterial vasodilator infusion.
1. Kendall JL, Moreira ME. Evaluation of the adult with abdominal pain in the emergency department. UpToDate Web site. http://www.uptodate.com/contents/evaluation-of-the-adult-with-abdominal-pain-in-the-emergency-department. Updated September 29, 2016. Accessed November 30, 2016.
2. Lewis LM, Banet GA, Blanda M, Hustey FM, Meldon SW, Gerson LW. Etiology and clinical course of abdominal pain in senior patients: a prospective, multicenter study. J Gerontol A Biol Sci Med Sci. 2005;60(8):1071-1076.
3. Sanson TG, O’Keefe KP. Evaluation of abdominal pain in the elderly. Emerg Med Clin North Am. 1996;14(3):615.
4. Tendler DA, Lamont JT, Pearl G. Acute mesenteric arterial occlusion. UpToDate Web site. http://www.uptodate.com/contents/acute-mesenteric-arterial-occlusion. Updated May 27, 2015. Accessed November 30, 2016.
5. McKinsey JF, Gewertz BL. Acute mesenteric ischemia. Surg Clin North Am. 1997;77(2):307-318.
6. Tendler DA, Lamont JT. Overview of intestinal ischemia in adults. UpToDate Web site. http://www.uptodate.com/contents/overview-of-intestinal-ischemia-in-adults. Updated February 23, 2016. Accessed November 30, 2016.
7. Wiesner W. Khurana B, Ji H, Ros PR. CT of acute bowel ischemia. Radiology. 2003;226(3):635-650.
Case
An 89-year-old woman presented to the ED with the chief complaints of abdominal pain and nausea with vomiting. The patient stated that several hours prior, she had ingested an expired beverage, which she related to the sudden onset of her symptoms. The patient denied fever, chills, dysuria, or frequency. Her medical history was significant for chronic atrial fibrillation (AF) and congestive heart failure. The patient’s medications included metoprolol and furosemide; she was not on any anticoagulation medication.
On physical examination, the patient appeared her stated age, and was in moderate distress secondary to the abdominal pain. Vital signs were: temperature, 98.8oF; heart rate, 98 beats/min; respiratory rate, 20 breaths/min; and blood pressure, 116/72 mm Hg. Oxygen saturation was 97% on room air. The head, eyes, ears, nose, and throat examination was unremarkable. On lung examination, breath sounds were equal bilaterally with bibasilar rales. The heart rhythm was irregularly irregular without murmurs, rubs, or gallops. The abdomen was soft to palpitation, but diffusely tender, without rebound, guarding, or mass. Rectal examination revealed normal tone and brown stool, and was trace positive for heme.
The emergency physician (EP) ordered an electrocardiogram (ECG), complete blood count, basic metabolic profile (BMP), urinalysis, and lipase test. The patient was administered intravenous (IV) normal saline at 75 cc/h, and morphine 4 mg and ondansetron 4 mg IV for the abdominal pain, nausea, and vomiting. She required several more doses of morphine due to the severity of the pain. The laboratory results included an elevated white blood count of 18.4 x 10⁹/L with a left shift, but normal hemoglobin and hematocrit values. The ECG demonstrated AF with a controlled ventricular rate; there was no evidence of ischemia or injury. The BMP was remarkable for a slightly depressed potassium level (3.3 mEq/L), a decreased serum bicarbonate of 20 mEq/L, and evidence of renal insufficiency with a blood urea nitrogen of 28 mg/dL and a serum creatinine of 1.6 mg/dL. Given the ongoing severe pain, leukocytosis, metabolic acidosis, and lack of clear etiology, the EP ordered a computed tomography (CT) scan of the abdomen and pelvis; no IV contrast was ordered because of the abnormal renal function studies.
The radiologist interpreted the CT scan as essentially normal. The EP admitted the patient to the on-call hospitalist, who consulted both cardiology and gastroenterology services. During the night, the patient complained of increasing abdominal pain, and her abdomen became distended with peritoneal signs. She was taken emergently to the operating room in the early morning hours. A large segment of gangrenous small intestine was found upon exploration. The surgery was discontinued and comfort care measures were instituted. The patient died the following day.
The patient’s family sued the EP and the hospital for failure to make a timely diagnosis of mesenteric ischemia. They further stated that the EP should have ordered a CT angiogram (CTA) of the abdomen and pelvis. The defense argued that a contrast CT scan was contraindicated because of the patient’s poor renal function. A defense verdict was returned at trial.
Discussion
Elderly patients (defined as older than age 65 years) presenting to the ED with abdominal pain remain a diagnostic challenge for even the most seasoned clinician. While elderly patients with a chief complaint of abdominal pain represent only a small percentage of ED patients, approximately 50% to 66% of these patients will require hospitalization, while one-third will require a surgical intervention.1 The seriousness of this complaint in elderly patients is further emphasized by the fact that older patients with abdominal pain have a 6- to 8-fold increase in mortality compared to younger patients.2,3 This can be partially explained by the simple fact that the life-threatening causes of abdominal pain—abdominal aortic aneurysm, mesenteric ischemia, bowel perforation, volvulus, and acute bowel obstruction—occur more frequently (but not exclusively) in elderly patients. Historical risk factors for life-threatening causes of abdominal pain include: age older than 65 years, immunocompromised state, alcohol abuse, cardiovascular (CV) disease (eg, coronary artery disease, hypertension, AF), major comorbidities (eg, cancer, renal failure), and prior surgery or recent gastrointestinal instrumentation.1
The patient in this case had two risk factors for life-threatening causes of lower abdominal pain—age and AF. These are also two of the major risk factors for mesenteric ischemia, which was her ultimate diagnosis.
Acute mesenteric ischemia refers to the sudden onset of small intestinal hypoperfusion, frequently due to acute occlusion (embolism or thrombosis) of an intestinal artery, most commonly the superior mesenteric artery (SMA).4 The SMA supplies the entire small intestine except for the proximal duodenum. Other causes of acute mesenteric ischemia include venous occlusion (thrombosis) and nonocclusive mesenteric ischemia secondary to vasoconstriction from low-cardiac output or use of vasopressors.4
Thromboembolic occlusion of the SMA is the most common cause of acute mesenteric ischemia, accounting for 67% to 95% of cases.4 In addition to AF, the risk of arterial embolism is increased in patients with valvular disease, infective endocarditis, recent myocardial infarction, aortic atherosclerosis, or aortic aneurysm.4 Risk factors for thrombotic arterial occlusion include peripheral artery disease, advanced age, and low-cardiac output states.5
A frequent presentation of embolic mesenteric arterial ischemia, occurring in approximately one-third of cases, is an elderly patient with AF (or other source of embolism) and onset of severe, sudden abdominal pain out of proportion to physical examination. While nausea and vomiting are also common, bloody bowel movements are less frequent in the early course of the disease process.4 A history of a prior embolic event is present in approximately one-third of such patients.
On physical examination, the abdomen may be normal initially, or demonstrate only mild distention and tenderness without peritoneal signs. However, as the ischemia progresses, the abdomen becomes more distended, bowel sounds become absent, and peritoneal signs (ie, guarding and rebound) become apparent.6
The results of laboratory studies can suggest the diagnosis, but none are confirmatory. Laboratory findings may include a marked leukocytosis with left shift, an elevated hematocrit secondary to hemoconcentration, and metabolic acidosis. A helpful clinical pearl is to consider intestinal ischemia in the differential diagnosis of any patient with acute abdominal pain and metabolic acidosis.6 Serum lactate is frequently elevated (73%-94%) but a very nonspecific marker. Similarly, an arterial blood gas analysis may demonstrate metabolic acidosis. More recently, a normal D-dimer result has been used to help exclude the diagnosis of acute intestinal ischemia, since it is elevated in 96% of patients with the disease.6 Similar to lactate, an abnormal D-dimer result has a poor specificity (40%).6 Early in the disease course, nearly all laboratory studies may be normal.
Depending on the severity of the presentation, imaging can help make the definitive diagnosis. For patients with peritonitis or obvious bowel perforation, IV fluid resuscitation, IV antibiotics, and immediate surgical exploration are indicated. Plain radiographs of the abdomen offer little help, as many of the findings early in the disease course are nonspecific, and radiographs can be normal in 25% of cases.6 Ultrasound can identify arterial stenosis or occlusion of the SMA, but is frequently technically limited by the presence of air-filled loops of distended bowel.6 Magnetic resonance angiography has similar sensitivity and specificity as CTA for mesenteric arterial ischemia, and is actually more sensitive than CTA for mesenteric venous thrombosis; it also can be performed in patients with contrast allergy.6 However, CTA is performed more commonly because of its lower cost, greater speed, and wide availability.6 A CTA of the abdomen and pelvis (without oral contrast) is probably the best study for patients in whom mesenteric ischemia is high on the differential diagnosis.6 For patients with a less clear picture and a broader differential diagnosis, a CT scan of the abdomen/pelvis with both IV and oral contrast is preferred.7 Common findings on CT scan with IV/oral contrast in acute mesenteric ischemia include the following: bowel wall thickening, dilatation, stranding, bowel wall attenuation, abnormal enhancement, and pneumatosis. Unfortunately, many of these findings are nonspecific.7
Once the diagnosis of acute mesenteric ischemia is made, patients should be designated “nothing by mouth” and a nasogastric tube placed to decompress the bowel. These patients will require IV fluid resuscitation with normal saline. The amount and rate will depend on their clinical presentation and underlying CV status. Any electrolyte abnormalities should be corrected and broad spectrum IV antibiotics initiated. Vascular surgery or general surgery services should be consulted to determine the optimal management. Most patients with acute intestinal ischemia due to mesenteric arterial occlusion (or venous occlusive or nonocclusive mesenteric ischemia) will be started on anticoagulation, typically IV heparin, unless contraindications are present.6 Surgical treatment options include arterial embolectomy, arterial bypass, arterial stenting, arterial thrombolysis, or intra-arterial vasodilator infusion.
1. Kendall JL, Moreira ME. Evaluation of the adult with abdominal pain in the emergency department. UpToDate Web site. http://www.uptodate.com/contents/evaluation-of-the-adult-with-abdominal-pain-in-the-emergency-department. Updated September 29, 2016. Accessed November 30, 2016.
2. Lewis LM, Banet GA, Blanda M, Hustey FM, Meldon SW, Gerson LW. Etiology and clinical course of abdominal pain in senior patients: a prospective, multicenter study. J Gerontol A Biol Sci Med Sci. 2005;60(8):1071-1076.
3. Sanson TG, O’Keefe KP. Evaluation of abdominal pain in the elderly. Emerg Med Clin North Am. 1996;14(3):615.
4. Tendler DA, Lamont JT, Pearl G. Acute mesenteric arterial occlusion. UpToDate Web site. http://www.uptodate.com/contents/acute-mesenteric-arterial-occlusion. Updated May 27, 2015. Accessed November 30, 2016.
5. McKinsey JF, Gewertz BL. Acute mesenteric ischemia. Surg Clin North Am. 1997;77(2):307-318.
6. Tendler DA, Lamont JT. Overview of intestinal ischemia in adults. UpToDate Web site. http://www.uptodate.com/contents/overview-of-intestinal-ischemia-in-adults. Updated February 23, 2016. Accessed November 30, 2016.
7. Wiesner W. Khurana B, Ji H, Ros PR. CT of acute bowel ischemia. Radiology. 2003;226(3):635-650.

A Holiday Visit to the ED (With Apologies to Clement Clarke Moore)
‘Twas the night before New Year, when all through the land
Every ED was busy—Can you give us a hand?
Treating chest pains, and traumas, and hot swollen knees,
While clinics were shuttered, along with UCs.
The handoffs were done with hardly a frown,
In hopes that the volume soon would slow down.
Babies were nestled all snug in a sheet,
Watching sutures applied to their hands and their feet.
And amateur athletes unpadded, uncapped,
Had brains that were rattled after balls had been snapped.
When out on the deck there arose such a clatter
We sprang from the doc box to help with the matter.
To Resusc room 1 we flew in a flash,
Tearing open the curtain before the patient could crash.
The leads on the breast of the now-fallen fellow,
Made lustrous white circles near sclerae bright yellow.
When what to our wondering ears did we hear,
But an overhead page that inspired some fear:
Notifications of a Level 1 trauma,
And several ODs, to add to the drama.
More rapid than eagles the new patients came,
All victims of poisons with rather strange names:
Poinsettia, and holly, and dried mistletoe,
Angel hair, leaded tinsel, polyacrylate snow.
And a man who was tarnished with ashes and soot,
With a cherry red color from his head to his foot.
Smoke inhalation and a toxic epoxide?
Or alcohol, cyanide, carbon monoxide?
But “Holiday Poisonings” on the pages ahead,
Soon reassured us we had nothing to dread…
When patients were discharged to families waiting,
They promised to give us all a good rating.
So to all EMTs, NPs, and PAs,
RNs, and EPs who work holidays,
And to all ED staffs who “fight the good fight,”
Have a Happy New Year, and a nice quiet night!
—Neal Flomenbaum, MD

Holiday Poisonings
The holiday season, a time of warmth, joy, and good cheer, is upon us. Yet with this most wonderful time of the year comes the possibility of poisoning and hazards in the home. As emergency physicians (EPs), we must ask ourselves: Which holiday items are potentially toxic to our patients? How do we evaluate and manage poisonings that result from exposure to these items? In this article, we review several plants and decorations that are unique to the holiday season. We discuss recommendations for evaluation and management of holiday poisonings that will avoid inappropriate work-ups and interventions while increasing recognition of truly dangerous ingestions, thus help keeping the season safe and merry.
Plants
Plant exposures are the fourth most common cause for calls to poison centers.1 In 2012, US Poison Control Centers reported more than 30,000 toxic plant exposures in children younger than age 5 years.2 Not surprisingly, toxic plant ingestions occur most commonly in early childhood. The highest rate of mortality, however, takes place during the teenaged years, when suicide attempts are common.2 The most common plant ingestions reported in the United States include peace lily, holly, philodendron, and poinsettia.3 These and the other frequently ingested potentially poisonous plants produce very little, if any, toxic effects. Approximately 95% of unintentional potentially toxic plant ingestions reported in the United States are managed safely at home.3
Poinsettia
The poinsettia is a large, prominent plant that was introduced to the United States in 1825 by Joel Poinsett, the US ambassador to Mexico. The poinsettia is one of the most commonly researched plants, and studies show the plant is not actually toxic.4,5 The myth of poinsettia toxicity is a widely held, yet false, belief. The legend involves a young child of an army officer stationed in Hawaii in 1919 who reportedly died after eating poinsettia leaves.4 However, the reality is that the poinsettia plant was not actually involved in the child’s death. In fact, the wild plant involved in this case probably had little resemblance to the popular plant cultivated domestically in North America today.6
A majority of poinsettia exposures will be asymptomatic, or involve simple nausea and vomiting. Krenzelok et al5 reviewed 22,793 cases of poinsettia exposures from 1985 to 1992. Almost all of these exposures (98.9%) were accidental poisonings.5 Not surprisingly, 93.3% of poinsettia exposures involved children; most importantly, 96.1% of these patients did not require treatment at a health care facility,and there were no fatalities.5 Another study could not identify an LD50 (lethal dose, 50%—ie, the amount of an ingested substance that kills 50% of the test sample) in rats.4
The majority of patients presenting to the ED with symptoms from poinsettia exposure will have gastrointestinal (GI) upset. Most patients require only symptomatic care. Those who do present to the ED do not require gastric emptying.
Interestingly, there is a crossreactivity of poinsettia sap in latex-allergic vulnerable patients.6 Poinsettia is part of the same plant family as natural rubber latex, and patients can present with symptoms of contact dermatitis, especially if they have a latex allergy.4 Washing the area thoroughly with soap and water and avoiding future contact is all that is required for most patients with contact dermatitis.
Holly
Holly exposure accounted for the third highest rate of genus-specific human plant exposure calls to poison centers in 2010.4 In the United States, there are two common forms of holly: English holly and American holly. The berries of both varieties contain saponin, a toxin that can cause erythrocyte hemolysis and changes in the permeability of small intestinal mucosal cells.4 Most holly berry ingestions cause minor or no symptoms. The prickly leaves of the holly plant are nontoxic but consumption may result in minor injury. When symptoms do occur, they can include nausea, vomiting, abdominal cramping, and possible dermatitis.5 Mydriasis, hyperthermia, and drowsiness are rare but possible symptoms.4

For symptoms to develop, children need to have eaten only five berries, while adults reportedly must consume at least 20 to 30 berries.4 A study by Wax et al7 done at the University of Rochester reviewed 103 cases of toxic berry ingestion in children aged 9 months to 5 years, with children who swallowed six or fewer berries of holly, yew, or nightshade. Investigators compared home observation alone versus ipecac administration with home observation. Every patient treated with ipecac had emesis at home with increased sedation and diarrhea, while there was no emesis in the group with home observation alone.7 These results suggest the symptoms were due to the ipecac rather than plant toxicity.7 Thus, ipecac is not recommended, and patients should be treated symptomatically.
Bittersweet and Jerusalem Cherry
Bittersweet, also known as the woody nightshade, and Jerusalem cherry, or Christmas orange, are the most dangerous of the holiday plants. While there is little evidence to support serious toxicity to adults, ingestion may be dangerous to children. Bittersweet has purple and yellow flowers, spreading petals, and red, ovoid berries.4 Both plants are part of the genus Solanum. In both plants, the immature fruit is more poisonous than ripened fruit due to the glycoalkaloid solanine via hypothetical alteration of mitochondrial potassium and calcium transport.4 Case reports document the rare anticholinergic effects of these plants, likely due to dulcamarine.4

The largest case series included 319 ingestions of bittersweet or Jerusalem cherry.4 Of these, 295 patients were under age 10 years, and only nine experienced solanine-related symptoms; none required hospitalization.4 The symptoms of ingestion were primarily nausea and vomiting and abdominal cramping, possibly due to anticholinergic effects. Symptoms typically occur several hours after ingestion and may last for days.
Historically, induced emesis was recommended for ingestion in children, but this is no longer recommended. Prolonged observation may be necessary for children in the setting of high likelihood of ingestion. Management includes rehydration with intravenous (IV) fluids, antiemetics, and physostigmine if clinically warranted.4
Mistletoe
Mistletoe, a perennial with white or translucent berries, has traditionally been associated with kissing, fertility, and vitality. The American mistletoe is known as Phoradendron serotinum and the European mistletoe as Viscum album. Both the American and European mistletoe contain the toxalbumins phoratoxin and viscotoxin, which are associated with inhibiting cellular synthesis, thereby affecting cells with rapid turnover, including the GI mucosa.4

After several hours, clinical effects are primarily GI upset with potential sloughing of portions of the intestinal tract.4 Bradycardia, delirium, and hepatic, central nervous system, kidney, and adrenal gland toxicities can also occur.8 The American species has a lower toxicity compared to the European species. Cases involving death likely related to P serotinum usually occur due to excessive, concentrated herbal use, such as brewing mistletoe in tea.9 Placing the plant in hot water may result in larger amounts of ingested toxin. The only two reported deaths from ingestion of mistletoe were in patients who consumed brewed teas.4
A case review of 14 patients with American mistletoe leaf or berry ingestions failed to find any toxic symptoms.4 Krenzelok et al10 compiled the largest case review of 1,754 exposures from 1985 to 1992. In this review, patient outcomes were good. There were no fatalities, and 99% of patients experienced no morbidity. Outcomes were not influenced by GI decontamination.10
Another study by Spiller et al11 described 92 American mistletoe exposures involving ingestions of up to 20 berries and five leaves. In cases where five or more berries were consumed, none of the patients had symptoms.11 Three of the 11 patients (27%) who swallowed one to five leaves developed GI upset. One child had a seizure, likely not related to the mistletoe. The study concluded that severe toxic symptoms are uncommon.11
Management in the ED should involve supportive care for dehydration and vomiting, typically IV rehydration with normal saline or Ringer’s lactate and IV antiemetics. According to multiple case reviews, GI decontamination is not believed to alter patient outcome and is not recommended.4 An observation period of 6 hours is reasonable.4,10,11
Christmas Cactus
Christmas cactus is an old-time favorite. It is made of arching, drooping branches and spineless joints. Christmas cactus is essentially nontoxic, and patients and family can be reassured of its safety.
Holiday Decorations
Artificial Snow
Fake snow sprays, powders, and granules are popular decorative additions used in holiday games and celebrations. The “snow” typically consists of a polymer of sodium polyacrylate, both of which can cause injury to the eyes. Repeatedly inhaling the aerosol spray can cause breathing problems, especially in patients who have asthma or other underlying bronchospastic disease.
Devastating outcomes may occur from ocular alkaline injury. When mixed with water, the fake snow absorbs the water and expands as a gel material that may stick to the ocular surface, resulting in a change in pH and osmolarity.12 A case report by Al-Amry and Al-Ghadeer12 recently described a 7-year-old boy with corneal epitheliopathy due to a chemical burn injury following ocular contact with fake snow.The case was later managed with multiple debridements over 3 days, topical antibiotics, and bandage contact lenses. The child had complete resolution at 1 week follow-up.12
Some fake snow-product sprays contain acetone or methylene chloride, which is harmful when inhaled and can cause nausea, lightheadedness, and headache.13 Methylene chloride can be metabolized to carbon monoxide, but the quantity required for such an exposure is unknown and has not been reported in this context. Emergency physicians should consider ordering carboxyhemoglobin levels in symptomatic patients.
Tinsel
Tinsel, which gets its name from the Old French word “estincele,” translated as sparkle, used to be made of actual silver, and was affordable only for wealthy individuals. However, in the early 1900s, manufacturers began to make tinsel from metals such as aluminum and copper. These materials did not tarnish and could be reused annually. However, during World War I, copper became difficult to buy, while aluminum proved to be flammable and dangerous. Thus, manufacturers began to produce tinsel from lead. Tinsel was made with lead until the 1970s, when the US Food and Drug Administration realized the toxic risks of lead exposure, especially in young children. Today, tinsel is made of plastic; though a poor imitation of the previous tinsel, it is relatively harmless.14
Angel Hair
Angel hair is finely spun glass that can be irritating to the skin, eyes, and throat, especially if swallowed.13 The greatest danger is airway obstruction if a patient attempts to eat the angel hair and it becomes lodged in the oropharynx. For contact irritation, thoroughly washing and irrigating affected areas are recommended.
Snow Globes
Snow globes are popular holiday decorations that are available in a range of sizes. While the majority of globes made in the United States are filled with water, those manufactured overseas many contain a small amount of ethylene glycol (EG) (ie, antifreeze) to prevent freezing and breakage during shipping. Fortunately, the amount of EG is not usually sufficient to cause symptoms if ingested. For globes made in the United States, the water can be contaminated with bacteria, and drinking it can cause GI upset. The snow in these globes is typically made of inert material and does not cause toxicity. If a child does exhibit symptoms after ingesting any portion of a snow globe, parents are advised to call their local poison center.
Ethanol
While alcohol is not unique to the holiday season, its availability and use are more pronounced during this time of year, and the incidence of alcohol poisoning increases during the holiday season. Some traditional holiday drinks containing alcohol, such as egg nog, can entice young children. Children may often imitate adults and drink from partially filled leftover glasses.
Therefore, families with young children must ensure that all alcoholic beverages are placed out of children’s reach.
A common presentation of alcohol poisoning is seen in the child who is brought to the ED by parents concerned because their child is acting strangely. On examination, the child may appear dazed and have tachycardia, tachypnea, and hypotension, depending on the amount of alcohol ingested. Hypoglycemia in an alcohol-intoxicated pediatric patient is a concern, but it appears the effects of alcohol on glucose regulation in infants is unpredictable.15
Intravenous access should be obtained in any patient presenting with altered mental status, and rapid blood glucose level determined. Blood samples should be sent to assess ethanol concentration. Other laboratory and imaging studies should be obtained as clinically indicated, including electrolytes, serum osmolality, acetaminophen level, urine drug screen, X-ray, and computed tomography scan of the head. Treatment of respiratory depression, hypoglycemia, hypovolemia, and hypothermia are the key interventions to ensure good outcomes.16 Supportive care is the mainstay of therapy for pediatric patients, who rarely require thiamine supplementation.16 Medical evaluation is recommended for all symptomatic children; hourly observation for 6 hours is recommended for asymptomatic children.17
Alcohol is also associated with cardiac arrhythmias. Alcohol-induced atrial arrhythmias, most commonly atrial fibrillation (AF), are referred to as “holiday heart syndrome.” This should be considered early in the differential diagnosis of new-onset AF in young adults. Consuming massive quantities of alcohol or binge drinking can also result in metabolic and electrolyte alterations. Treatment includes rehydration with IV fluids, electrolyte replacement, and IV diltiazem or cardioversion for AF with rapid ventricular response.18
Conclusion
During the holiday season, it is easy to overlook the fact that some of the most unsuspecting items in the home can pose real hazards (Table). In addition, many holiday plants are used as table decorations, which can confuse small children, who may assume the colorful berries must be edible if they are on the dining room table.

It is vital that patients, parents, and physicians know what to do when someone ingests a potential toxin. Parents often try to induce vomiting, but ipecac and other forms of gastric emptying are no longer recommended.6 Instead, the recommended action is to separate the patient from the plant, remove plant material that may cause a sensitivity reaction, and consult a poison control center, which can save unnecessary interventions—including an ED visit.6
Fortunately, most holiday toxicities are relatively nonthreatening. Holiday-related toxic ingestions primarily occur in children, and most are asymptomatic, innocuous, and treated with symptomatic care as necessary. The most poisonous holiday-related toxins are bittersweet and Jerusalem cherry. Work-ups for holiday-plant ingestions are usually limited to severe gastroenteritis, which may require IV fluids and evaluation of electrolytes.
Holiday decorations, such as artificial snow and angel hair, present hazards that should be treated on a case-by-case basis. Finally, alcohol intoxication should be considered in the differential diagnosis for pediatric patients presenting with altered mental status, or the otherwise healthy binge drinker who presents with palpitations and new-onset AF.
1. Krenzelok EP, Jacobsen TD, Aronis J. Those pesky berries...are they a source of concern? Vet Hum Toxicol. 1998;40(2):101-103.
2. Martínez Monseny A, Martínez Sánchez L, Margarit Soler A, Trenchs Sainz de la Maza V, Luaces Cubells C. [Poisonous plants: An ongoing problem]. An Pediatr (Barc). 2015;82(5):347-353. doi:10.1016/j.anpedi.2014.08.008.
3. Krenzelok EP, Mrvos R. Friends and foes in the plant world: a profile of plant ingestions and fatalities. Clin Toxicol (Phila). 2011;49(3):142-149. doi:10.3109/15563650.2011.568945.
4. Evens ZN, Stellpflug SJ. Holiday plants with toxic misconceptions. West J Emerg Med. 2012;13(6):538-542. doi:10.5811/westjem.2012.8.12572.
5. Krenzelok E, Jacobsen TD, Aronis JM. Poinsettia exposures have good outcomes…just as we thought. Am J Emerg Med. 1996;14(7):671-674. doi:10.1016/S0735-6757(96)90086-90088.
6. Courtemanche J, Peterson, RG. Beware the mistletoe. CMAJ. 2006;175(12):1523-1524. doi:10.1503/cmaj.061432.
7. Wax PM, Cobaugh DJ, Lawrence RA. Should home ipecac-induced emesis be routinely recommended in the management of toxic berry ingestions? Vet Hum Toxicol. 1999;41(6):394-397.
8. Palmer ME, Betz JM. Plants. In: Nelson LS, Lewin NA, Howland MA, Hoffman RS, Goldfrank LR, Flomenbaum NE, eds. Goldfrank’s Toxicologic Emergencies. 9th ed. New York, NY: McGraw Hill; 2011:1537-1560.
9. Bruneton J. Toxic plants dangerous to humans and animals. Paris, France: Lavoisier Publishing; 1999.10. Krenzelok EP, Jacobsen TD, Aronis J. American mistletoe exposures. Am J Emerg Med. 1997;15(5):516-520.
11. Spiller HA, Willias DB, Gorman SE, Sanftleban J. Retrospective study of mistletoe ingestion. J Toxicol Clin Toxicol. 1996;34(4):405-408.
12. Al-Amry MA, Al-Ghadeer HA. Corneal epithliopathy after trauma by fake snow powder in a 7-year-old child. Middle East Afr J Ophthalmol. 2016;23(3):274-276. doi:10.4103/0974-9233.186157.
13. California Poison Control Center. Winter holiday safety & poison prevention tips. http://www.calpoison.org/public/winter-holidays.html. Accessed October 16, 2016.
14. Romm C. Don’t lick the tinsel. The Atlantic. December 21, 2015. http://www.theatlantic.com/health/archive/2015/12/dont-lick-the-tinsel/421506/. Accessed October 16, 2016.
15. Minera G, Robinson E. Accidental acute alcohol intoxication in infants: review and case report. J Emerg Med. 2014;47(5):524-526.
16. Baum CR. Ethanol intoxication in children: clinical features, evaluation, and management. UpToDate. http://www.uptodate.com/contents/ethanol-intoxication-in-children-clinical-features-evaluation-and-management. Accessed October 16, 2016.
17. Vogel C, Caraccio T, Mofenson H, Hart S. Alcohol intoxication in young children. J Toxicol Clin Toxicol. 1995;33(1):25-33.
18. Carey MG, Al-Zaiti SS, Kozik TM, Pelter M. Holiday heart syndrome. Am J Crit Care. 2014;23(2):171-172.
The holiday season, a time of warmth, joy, and good cheer, is upon us. Yet with this most wonderful time of the year comes the possibility of poisoning and hazards in the home. As emergency physicians (EPs), we must ask ourselves: Which holiday items are potentially toxic to our patients? How do we evaluate and manage poisonings that result from exposure to these items? In this article, we review several plants and decorations that are unique to the holiday season. We discuss recommendations for evaluation and management of holiday poisonings that will avoid inappropriate work-ups and interventions while increasing recognition of truly dangerous ingestions, thus help keeping the season safe and merry.
Plants
Plant exposures are the fourth most common cause for calls to poison centers.1 In 2012, US Poison Control Centers reported more than 30,000 toxic plant exposures in children younger than age 5 years.2 Not surprisingly, toxic plant ingestions occur most commonly in early childhood. The highest rate of mortality, however, takes place during the teenaged years, when suicide attempts are common.2 The most common plant ingestions reported in the United States include peace lily, holly, philodendron, and poinsettia.3 These and the other frequently ingested potentially poisonous plants produce very little, if any, toxic effects. Approximately 95% of unintentional potentially toxic plant ingestions reported in the United States are managed safely at home.3
Poinsettia
The poinsettia is a large, prominent plant that was introduced to the United States in 1825 by Joel Poinsett, the US ambassador to Mexico. The poinsettia is one of the most commonly researched plants, and studies show the plant is not actually toxic.4,5 The myth of poinsettia toxicity is a widely held, yet false, belief. The legend involves a young child of an army officer stationed in Hawaii in 1919 who reportedly died after eating poinsettia leaves.4 However, the reality is that the poinsettia plant was not actually involved in the child’s death. In fact, the wild plant involved in this case probably had little resemblance to the popular plant cultivated domestically in North America today.6
A majority of poinsettia exposures will be asymptomatic, or involve simple nausea and vomiting. Krenzelok et al5 reviewed 22,793 cases of poinsettia exposures from 1985 to 1992. Almost all of these exposures (98.9%) were accidental poisonings.5 Not surprisingly, 93.3% of poinsettia exposures involved children; most importantly, 96.1% of these patients did not require treatment at a health care facility,and there were no fatalities.5 Another study could not identify an LD50 (lethal dose, 50%—ie, the amount of an ingested substance that kills 50% of the test sample) in rats.4
The majority of patients presenting to the ED with symptoms from poinsettia exposure will have gastrointestinal (GI) upset. Most patients require only symptomatic care. Those who do present to the ED do not require gastric emptying.
Interestingly, there is a crossreactivity of poinsettia sap in latex-allergic vulnerable patients.6 Poinsettia is part of the same plant family as natural rubber latex, and patients can present with symptoms of contact dermatitis, especially if they have a latex allergy.4 Washing the area thoroughly with soap and water and avoiding future contact is all that is required for most patients with contact dermatitis.
Holly
Holly exposure accounted for the third highest rate of genus-specific human plant exposure calls to poison centers in 2010.4 In the United States, there are two common forms of holly: English holly and American holly. The berries of both varieties contain saponin, a toxin that can cause erythrocyte hemolysis and changes in the permeability of small intestinal mucosal cells.4 Most holly berry ingestions cause minor or no symptoms. The prickly leaves of the holly plant are nontoxic but consumption may result in minor injury. When symptoms do occur, they can include nausea, vomiting, abdominal cramping, and possible dermatitis.5 Mydriasis, hyperthermia, and drowsiness are rare but possible symptoms.4
For symptoms to develop, children need to have eaten only five berries, while adults reportedly must consume at least 20 to 30 berries.4 A study by Wax et al7 done at the University of Rochester reviewed 103 cases of toxic berry ingestion in children aged 9 months to 5 years, with children who swallowed six or fewer berries of holly, yew, or nightshade. Investigators compared home observation alone versus ipecac administration with home observation. Every patient treated with ipecac had emesis at home with increased sedation and diarrhea, while there was no emesis in the group with home observation alone.7 These results suggest the symptoms were due to the ipecac rather than plant toxicity.7 Thus, ipecac is not recommended, and patients should be treated symptomatically.
Bittersweet and Jerusalem Cherry
Bittersweet, also known as the woody nightshade, and Jerusalem cherry, or Christmas orange, are the most dangerous of the holiday plants. While there is little evidence to support serious toxicity to adults, ingestion may be dangerous to children. Bittersweet has purple and yellow flowers, spreading petals, and red, ovoid berries.4 Both plants are part of the genus Solanum. In both plants, the immature fruit is more poisonous than ripened fruit due to the glycoalkaloid solanine via hypothetical alteration of mitochondrial potassium and calcium transport.4 Case reports document the rare anticholinergic effects of these plants, likely due to dulcamarine.4
The largest case series included 319 ingestions of bittersweet or Jerusalem cherry.4 Of these, 295 patients were under age 10 years, and only nine experienced solanine-related symptoms; none required hospitalization.4 The symptoms of ingestion were primarily nausea and vomiting and abdominal cramping, possibly due to anticholinergic effects. Symptoms typically occur several hours after ingestion and may last for days.
Historically, induced emesis was recommended for ingestion in children, but this is no longer recommended. Prolonged observation may be necessary for children in the setting of high likelihood of ingestion. Management includes rehydration with intravenous (IV) fluids, antiemetics, and physostigmine if clinically warranted.4
Mistletoe
Mistletoe, a perennial with white or translucent berries, has traditionally been associated with kissing, fertility, and vitality. The American mistletoe is known as Phoradendron serotinum and the European mistletoe as Viscum album. Both the American and European mistletoe contain the toxalbumins phoratoxin and viscotoxin, which are associated with inhibiting cellular synthesis, thereby affecting cells with rapid turnover, including the GI mucosa.4
After several hours, clinical effects are primarily GI upset with potential sloughing of portions of the intestinal tract.4 Bradycardia, delirium, and hepatic, central nervous system, kidney, and adrenal gland toxicities can also occur.8 The American species has a lower toxicity compared to the European species. Cases involving death likely related to P serotinum usually occur due to excessive, concentrated herbal use, such as brewing mistletoe in tea.9 Placing the plant in hot water may result in larger amounts of ingested toxin. The only two reported deaths from ingestion of mistletoe were in patients who consumed brewed teas.4
A case review of 14 patients with American mistletoe leaf or berry ingestions failed to find any toxic symptoms.4 Krenzelok et al10 compiled the largest case review of 1,754 exposures from 1985 to 1992. In this review, patient outcomes were good. There were no fatalities, and 99% of patients experienced no morbidity. Outcomes were not influenced by GI decontamination.10
Another study by Spiller et al11 described 92 American mistletoe exposures involving ingestions of up to 20 berries and five leaves. In cases where five or more berries were consumed, none of the patients had symptoms.11 Three of the 11 patients (27%) who swallowed one to five leaves developed GI upset. One child had a seizure, likely not related to the mistletoe. The study concluded that severe toxic symptoms are uncommon.11
Management in the ED should involve supportive care for dehydration and vomiting, typically IV rehydration with normal saline or Ringer’s lactate and IV antiemetics. According to multiple case reviews, GI decontamination is not believed to alter patient outcome and is not recommended.4 An observation period of 6 hours is reasonable.4,10,11
Christmas Cactus
Christmas cactus is an old-time favorite. It is made of arching, drooping branches and spineless joints. Christmas cactus is essentially nontoxic, and patients and family can be reassured of its safety.
Holiday Decorations
Artificial Snow
Fake snow sprays, powders, and granules are popular decorative additions used in holiday games and celebrations. The “snow” typically consists of a polymer of sodium polyacrylate, both of which can cause injury to the eyes. Repeatedly inhaling the aerosol spray can cause breathing problems, especially in patients who have asthma or other underlying bronchospastic disease.
Devastating outcomes may occur from ocular alkaline injury. When mixed with water, the fake snow absorbs the water and expands as a gel material that may stick to the ocular surface, resulting in a change in pH and osmolarity.12 A case report by Al-Amry and Al-Ghadeer12 recently described a 7-year-old boy with corneal epitheliopathy due to a chemical burn injury following ocular contact with fake snow.The case was later managed with multiple debridements over 3 days, topical antibiotics, and bandage contact lenses. The child had complete resolution at 1 week follow-up.12
Some fake snow-product sprays contain acetone or methylene chloride, which is harmful when inhaled and can cause nausea, lightheadedness, and headache.13 Methylene chloride can be metabolized to carbon monoxide, but the quantity required for such an exposure is unknown and has not been reported in this context. Emergency physicians should consider ordering carboxyhemoglobin levels in symptomatic patients.
Tinsel
Tinsel, which gets its name from the Old French word “estincele,” translated as sparkle, used to be made of actual silver, and was affordable only for wealthy individuals. However, in the early 1900s, manufacturers began to make tinsel from metals such as aluminum and copper. These materials did not tarnish and could be reused annually. However, during World War I, copper became difficult to buy, while aluminum proved to be flammable and dangerous. Thus, manufacturers began to produce tinsel from lead. Tinsel was made with lead until the 1970s, when the US Food and Drug Administration realized the toxic risks of lead exposure, especially in young children. Today, tinsel is made of plastic; though a poor imitation of the previous tinsel, it is relatively harmless.14
Angel Hair
Angel hair is finely spun glass that can be irritating to the skin, eyes, and throat, especially if swallowed.13 The greatest danger is airway obstruction if a patient attempts to eat the angel hair and it becomes lodged in the oropharynx. For contact irritation, thoroughly washing and irrigating affected areas are recommended.
Snow Globes
Snow globes are popular holiday decorations that are available in a range of sizes. While the majority of globes made in the United States are filled with water, those manufactured overseas many contain a small amount of ethylene glycol (EG) (ie, antifreeze) to prevent freezing and breakage during shipping. Fortunately, the amount of EG is not usually sufficient to cause symptoms if ingested. For globes made in the United States, the water can be contaminated with bacteria, and drinking it can cause GI upset. The snow in these globes is typically made of inert material and does not cause toxicity. If a child does exhibit symptoms after ingesting any portion of a snow globe, parents are advised to call their local poison center.
Ethanol
While alcohol is not unique to the holiday season, its availability and use are more pronounced during this time of year, and the incidence of alcohol poisoning increases during the holiday season. Some traditional holiday drinks containing alcohol, such as egg nog, can entice young children. Children may often imitate adults and drink from partially filled leftover glasses.
Therefore, families with young children must ensure that all alcoholic beverages are placed out of children’s reach.
A common presentation of alcohol poisoning is seen in the child who is brought to the ED by parents concerned because their child is acting strangely. On examination, the child may appear dazed and have tachycardia, tachypnea, and hypotension, depending on the amount of alcohol ingested. Hypoglycemia in an alcohol-intoxicated pediatric patient is a concern, but it appears the effects of alcohol on glucose regulation in infants is unpredictable.15
Intravenous access should be obtained in any patient presenting with altered mental status, and rapid blood glucose level determined. Blood samples should be sent to assess ethanol concentration. Other laboratory and imaging studies should be obtained as clinically indicated, including electrolytes, serum osmolality, acetaminophen level, urine drug screen, X-ray, and computed tomography scan of the head. Treatment of respiratory depression, hypoglycemia, hypovolemia, and hypothermia are the key interventions to ensure good outcomes.16 Supportive care is the mainstay of therapy for pediatric patients, who rarely require thiamine supplementation.16 Medical evaluation is recommended for all symptomatic children; hourly observation for 6 hours is recommended for asymptomatic children.17
Alcohol is also associated with cardiac arrhythmias. Alcohol-induced atrial arrhythmias, most commonly atrial fibrillation (AF), are referred to as “holiday heart syndrome.” This should be considered early in the differential diagnosis of new-onset AF in young adults. Consuming massive quantities of alcohol or binge drinking can also result in metabolic and electrolyte alterations. Treatment includes rehydration with IV fluids, electrolyte replacement, and IV diltiazem or cardioversion for AF with rapid ventricular response.18
Conclusion
During the holiday season, it is easy to overlook the fact that some of the most unsuspecting items in the home can pose real hazards (Table). In addition, many holiday plants are used as table decorations, which can confuse small children, who may assume the colorful berries must be edible if they are on the dining room table.
It is vital that patients, parents, and physicians know what to do when someone ingests a potential toxin. Parents often try to induce vomiting, but ipecac and other forms of gastric emptying are no longer recommended.6 Instead, the recommended action is to separate the patient from the plant, remove plant material that may cause a sensitivity reaction, and consult a poison control center, which can save unnecessary interventions—including an ED visit.6
Fortunately, most holiday toxicities are relatively nonthreatening. Holiday-related toxic ingestions primarily occur in children, and most are asymptomatic, innocuous, and treated with symptomatic care as necessary. The most poisonous holiday-related toxins are bittersweet and Jerusalem cherry. Work-ups for holiday-plant ingestions are usually limited to severe gastroenteritis, which may require IV fluids and evaluation of electrolytes.
Holiday decorations, such as artificial snow and angel hair, present hazards that should be treated on a case-by-case basis. Finally, alcohol intoxication should be considered in the differential diagnosis for pediatric patients presenting with altered mental status, or the otherwise healthy binge drinker who presents with palpitations and new-onset AF.
1. Krenzelok EP, Jacobsen TD, Aronis J. Those pesky berries...are they a source of concern? Vet Hum Toxicol. 1998;40(2):101-103.
2. Martínez Monseny A, Martínez Sánchez L, Margarit Soler A, Trenchs Sainz de la Maza V, Luaces Cubells C. [Poisonous plants: An ongoing problem]. An Pediatr (Barc). 2015;82(5):347-353. doi:10.1016/j.anpedi.2014.08.008.
3. Krenzelok EP, Mrvos R. Friends and foes in the plant world: a profile of plant ingestions and fatalities. Clin Toxicol (Phila). 2011;49(3):142-149. doi:10.3109/15563650.2011.568945.
4. Evens ZN, Stellpflug SJ. Holiday plants with toxic misconceptions. West J Emerg Med. 2012;13(6):538-542. doi:10.5811/westjem.2012.8.12572.
5. Krenzelok E, Jacobsen TD, Aronis JM. Poinsettia exposures have good outcomes…just as we thought. Am J Emerg Med. 1996;14(7):671-674. doi:10.1016/S0735-6757(96)90086-90088.
6. Courtemanche J, Peterson, RG. Beware the mistletoe. CMAJ. 2006;175(12):1523-1524. doi:10.1503/cmaj.061432.
7. Wax PM, Cobaugh DJ, Lawrence RA. Should home ipecac-induced emesis be routinely recommended in the management of toxic berry ingestions? Vet Hum Toxicol. 1999;41(6):394-397.
8. Palmer ME, Betz JM. Plants. In: Nelson LS, Lewin NA, Howland MA, Hoffman RS, Goldfrank LR, Flomenbaum NE, eds. Goldfrank’s Toxicologic Emergencies. 9th ed. New York, NY: McGraw Hill; 2011:1537-1560.
9. Bruneton J. Toxic plants dangerous to humans and animals. Paris, France: Lavoisier Publishing; 1999.10. Krenzelok EP, Jacobsen TD, Aronis J. American mistletoe exposures. Am J Emerg Med. 1997;15(5):516-520.
11. Spiller HA, Willias DB, Gorman SE, Sanftleban J. Retrospective study of mistletoe ingestion. J Toxicol Clin Toxicol. 1996;34(4):405-408.
12. Al-Amry MA, Al-Ghadeer HA. Corneal epithliopathy after trauma by fake snow powder in a 7-year-old child. Middle East Afr J Ophthalmol. 2016;23(3):274-276. doi:10.4103/0974-9233.186157.
13. California Poison Control Center. Winter holiday safety & poison prevention tips. http://www.calpoison.org/public/winter-holidays.html. Accessed October 16, 2016.
14. Romm C. Don’t lick the tinsel. The Atlantic. December 21, 2015. http://www.theatlantic.com/health/archive/2015/12/dont-lick-the-tinsel/421506/. Accessed October 16, 2016.
15. Minera G, Robinson E. Accidental acute alcohol intoxication in infants: review and case report. J Emerg Med. 2014;47(5):524-526.
16. Baum CR. Ethanol intoxication in children: clinical features, evaluation, and management. UpToDate. http://www.uptodate.com/contents/ethanol-intoxication-in-children-clinical-features-evaluation-and-management. Accessed October 16, 2016.
17. Vogel C, Caraccio T, Mofenson H, Hart S. Alcohol intoxication in young children. J Toxicol Clin Toxicol. 1995;33(1):25-33.
18. Carey MG, Al-Zaiti SS, Kozik TM, Pelter M. Holiday heart syndrome. Am J Crit Care. 2014;23(2):171-172.

Too Much of a Good Thing: Weakness, Dysphagia, and Stridor After Botulinum Toxin Injections
Case
A 68-year-old woman presented to the ED 5 days after receiving onabotulinumtoxinA cosmetic injections for wrinkles of the face and neck. She stated that she was unable to raise her head while in a supine position and that her head felt heavy when standing. She also experienced spasms and strain of the posterior cervical neck muscles. In addition, the patient described a constant need to swallow forcefully throughout the day, and felt an intermittent heavy sensation over her larynx that was associated with stridor. She noted these symptoms began 5 days after the onabotulinumtoxinA injections and had peaked 2 days prior to presentation. She also complained of dysphagia without odynophagia, but denied any changes in her voice.
The patient first began onabotulinumtoxinA injections 12 years earlier for aesthetic treatment of glabellar and peri-orbital wrinkles. She initially received the injections at a regular interval of 90 to 100 days. During the course of the first 2 years of treatment, the patient was under the care of a plastic surgeon; thereafter, she sought treatment at a physician-owned medical spa because it offered onabotulinumtoxinA at a lower price. The injections at the medical spa were administered by a physician assistant (PA). The patient stated that although the PA had steadily increased the dose of onabotulinumtoxinA to maintain the desired aesthetic effect, this was the first time she had experienced any side effects from the treatment.
The ED staff contacted the medical spa provider, who reviewed the patient’s medical record over the telephone. The PA stated that he had been the only practitioner at the facility to administer the onabotulinumtoxinA injections to the patient over her past 10 years there as a client. He further informed the emergency physician (EP) that 12 days prior to presentation, he had given the patient a total of 50 IU of onabotulinumtoxinA, in five separate injections, into the mid frontalis muscle; a total of 35 IU, in seven separate injections, into the glabellar region (procerus and corrugator muscles bilaterally); 20 IU into the lateral and inferior-lateral orbicularis oculi bilaterally, in four separate injections per side, (40 IU total); and a total of 100 IU in the anterior platysma, in 20 separate injections, for a total 1-day onabotulinumtoxinA dose of 225 IU.
The PA explained to the EP that he mixed the onabotulinumtoxinA in the patient’s room and had shown her the vials and dilution standard as recommended by the manufacturer because she had been requiring increased dosages and had previously questioned whether the onabotulinumtoxinA was diluted. The PA denied any other patients experiencing similar adverse events as those of the patient’s.
Over the last 10 years, the patient had received onabotulinumtoxinA in the nasolabial folds, upper and lower lip wrinkles, mentalis, depressor angular oris, buccal, nasalis, lateral brow, masseter, and calf muscles. The dosage of onabotulinumtoxinA at this most recent injection cycle was unchanged from her previous visit 3 months prior. According to the PA, the practice did not use abobotulinumtoxinA or incobotulinumtoxinA.
Regarding the patient’s medical history, she had no health issues suggestive of myasthenia gravis, multiple sclerosis, or Guillain-Barré syndrome. Examination of the face revealed decreased muscle excursion of the frontalis muscle from mid-brow to mid-brow, and stair-step wrinkle formation bilaterally. The procerus muscle was very weak, and the corrugator muscles were moderately diminished in strength. The lateral orbicularis oculi were very weak at each canthus. The extra-ocular muscles were intact. She had full mandibular excursion, and powerful movement of the tongue. The oropharynx and floor of the mouth were normal. She was noted to purposefully swallow and extend her neck every 90 to 120 seconds to “clear her throat,” though she did not drool and was able to handle her secretions and swallow fluids without aspiration. Her voice was normal and she was able to recite the letters “KKKKK,” “OOOOO,” and “EEEEE” in rapid fashion without breathiness or stridor. The rest of her facial muscles were normal.
While examining the patient, the EP asked her to refrain from swallowing whenever she extended her neck. Upon complying with this request, her neck extension precipitated swallowing and, by not swallowing, she did not accumulate secretions. Once during the examination, the patient began swallowing and breathing rapidly with stridor. This less than 15-second episode was abated by full-neck extensions, which relieved the patient’s sensation of heaviness over the larynx. Her breathing and voice were normal immediately after this episode.
Examination of the anterior neck revealed four platysmal bands (Figure). One band measured 10 cm in length and extended from the mandible inferiorly; two bands measured 2 cm lateral to the midline bilaterally; and the fourth band extended 4 cm in length from the mandible immediately lateral to the longer platysmal band. The platysma and dermis were flaccid and redundant at rest and with exertion. The sternocleidomastoid muscles were weak with exertion. The larynx moved cephalad with swallowing. The posterior cervical neck and trapezius muscles were of normal tone and strength. No spasms or fasciculations were noted during the examination period.
While supine, the patient strained to lift her head and complained of a suffocating sensation over the larynx. She had no rashes or edema, and the remainder of the physical examination, vital signs, and pulse oximetry were normal. Laboratory evaluation, which included a complete blood count and serum electrolytes, was also normal.
An otolaryngologist consultation for laryngoscopy was obtained. After reviewing the patient’s case, the otolaryngologist concluded that given the patient’s history, intermittent stridor, and an absence of signs or symptoms suggestive of an impending upper airway obstruction (UAO), laryngoscopy was not warranted.
A plastic surgery consultation was then obtained. The patient’s examination was as noted above, and her vital signs and pulse oximetry remained normal throughout her ED stay. Although botulinum and botulinum antibody titers were ordered, the patient refused testing due to cost concerns. She was discharged home by plastic surgery services with a diagnosis of floppy neck and dysphagia secondary to aesthetic botulinum toxin paralysis of the bilateral sternocleidomastoid muscles and platysma. She was given a prescription for metoclopramide hydrochloride to stimulate motility of the upper gastrointestinal tract and to potentially improve swallowing.10
The patient was scheduled for a follow-up evaluation with the plastic surgeon 2 days after discharge. She was instructed to call 911 if she experienced stridor, shortness of breath, drooling, or if any airway issues arose. The patient did not return for her follow-up appointment with the plastic surgeon.
Discussion
Clostridium Botulinum Toxins
Clostridium botulinum is a gram-positive spore-forming anaerobic bacterium that produces extremely potent neuro-exotoxins. C botulinum is found in soil, contaminated foods, and in illicit injectable drugs (eg, heroin). Seven distinct antigenic botulinum toxins (A, B, C1, D, E, F, and G) are produced by several strains of C botulinum. Systemically, each neurotoxin is able to produce severe morbidity and mortality by causing generalized muscle paralysis and death by respiratory failure. The lethal dose of these agents is approximating 10(-9) g/kg body weight. Botulinum toxin type A is the most potent.1,2
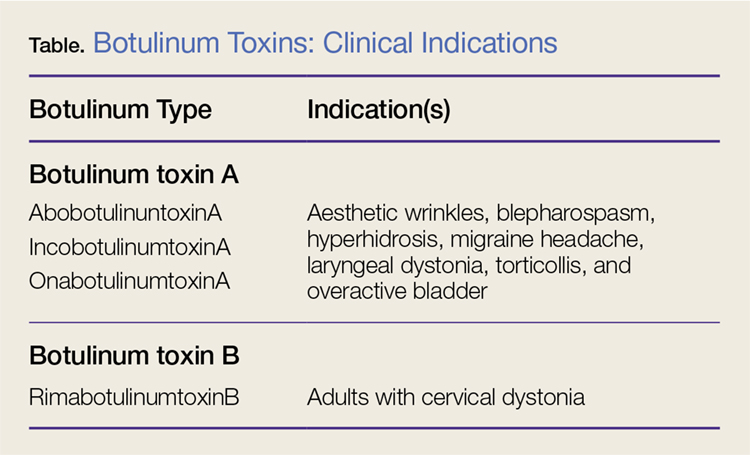
Nonetheless, botulinum toxin has been used clinically since the early 1970s. Currently, there are three FDA-approved botulinum toxin type A agents and one type B formulation (rimabotulinumtoxinB) (Table). Each formulation is unique, proprietary, and differs in molecular weight, toxin-complex size, protein content, and inactive ingredients. The effectiveness and adverse event profile for these four botulinum toxins is individually dependent upon the different dilutions and potency, onset of action, duration of effect, diffusion, and migration potential. Hence, the effective dose of one botulinum toxin does not equate to any other, resulting in a lack of interchangeability between botulinum toxins (eg, 5 IU of incobotulinumtoxinA does not equal 5 IU of onabotulinumtoxinA).
Aesthetic Indications
Historically, the use of botulinum toxin for aesthetic treatment of wrinkles and platysmal bands was first reported by Blitzer3 in 1993.Subsequently, the use of botulinum toxin for the aesthetic treatment of facial wrinkles, hypertrophic platysmal bands and horizontal neck lines gained popularity within the public and medical community.3-5
Anatomically, the platysma is a thin sheet-like muscle that originates in the superior fascia of the pectoralis and deltoid fascia, and extends over the full length of the neck up past the mandible and continuing into the submuscular aponeurotic system. The platysma is innervated by the seventh cranial nerve and functions to pull the jaw downward. The platysma muscle is attached directly to the skin. With normal aging, the anterior neck skin becomes flaccid, the central platysmal bands thicken and contract—forming bands, horizontal wrinkles, and loss of definition of the neck noticed at rest and with contraction of the platysma muscle. These vertical bands are known as platysmal bands. The platysmal bands are benign consequences of aging and as such are targets of correction through surgery or botulinum toxin injection.6,7
Mechanism of Action
Platysmal band and horizontal line injection techniques with botulinum toxin have been reported in the literature with dosages ranging from 15 IU to 200 IU used to block the Soluble N-ethylmaleimide-sensitive factor activating protein receptors. Typical onset of action begins at 3 days, with full paralytic effect at 7 days. Repeat injections every 3 to 4 months are required with prolonged effects seen with each subsequent injection due to chemodenervation-induced muscle atrophy.4,7,8
Adverse Effects
Commercial botulinum toxin type A has been associated with minor and transient side effects. Moderate complications seen in the neck region include transient soft-tissue edema, dermal ecchymoses, intramuscular hematoma, diffuse muscle soreness, neck flexor weakness, and headaches.4,8,9
The use of botulinum toxin for chemodenervation of the platysma can produce significant weakness of other neck muscles, including the sternocleidomastoid, cricothyroid, sternothyroid, and sternohyoid. Floppy neck and dysphagia may be due to diffusion of the toxin into the muscles of deglutition of the larynx; injection directly into the sternocleidomastoid muscle; or a result of the systemic effects of large dosages. Hoarseness, breathiness, and dysphagia may occur 3 to 4 days after injection, especially with doses over 75 IU.10
The recommended concentration of botulinum toxin type A causes a diffusion average of 1 cm in all directions from the injection sites. However, as the dilution increases, so does the zone of diffusion. Typical discharge instructions for platysma treatment include the overuse of the neck muscles for 2 to 4 hours after injection to encourage the botulinum toxin uptake for optimal result. Site manipulation (rubbing or massaging) also increases diffusion. For botulinum toxin type B, the zone of diffusion is greater because its molecular weight is less than the type A toxins, thus making it an undesirable agent for aesthetic facial chemodenervation.4,11
Toxin Resistance
Botulinum toxin resistance is a known complication that occurs normally as a result of the body recognizing the neurotoxin as a foreign substance and producing neutralizing antibodies (NAb). Primary botulinum toxin failure is known in patients who require high doses of the neurotoxin for treatment of neuromuscular disorders.12 Complete secondary therapy failure is known to occur in cosmetic patients after a single dose and those who have been receiving low-dose botulinum toxin regularly. The risk of NAb development increases with long-term treatment and high doses.12-18
Floppy Neck and Dysphagia
As previously noted, floppy neck and dysphagia are adverse clinical findings of botulinum toxin effect on the platysma, sternocleidomastoid, or the paralaryngeal muscles. In this case, the patient was fortunate to have only sustained weakness of the platysma and sternocleidomastoid muscles despite both a large neck and total body dose. Paralaryngeal muscle paralysis is not life-threatening, but the distress may precipitate paradoxical vocal cord motion and stridor.
Stridor
Stridor is typically a symptom of an upper airway obstruction (UAO) process. Typical UAO conditions encountered in the ED are infections (eg, epiglottitis, croup), foreign body, allergy, and laryngeal trauma. The age of the patient, onset of stridor, course of the stridor (ie, intermittent, continuous, worsening), associated symptoms (eg, fever, rash, swelling of oral soft tissues), and bruising must be ascertained.
In differentiating the etiology of stridor, the EP should observe the patient for any associated change in voice, inability to handle secretions, and position of comfort. Patients with stridor require admission and evaluation by an otolaryngologist as expeditiously as possible because impending UAO may quickly progress to complete UAO necessitating emergent intubation.
An atypical presentation of stridor to the ED is sporadic stridor. Sporadic attacks of stridor during activity have been associated with the entity of paradoxical vocal cord motion. Patients usually describe a choking sensation with inability to breathe resulting in an audible inspiratory and/or expiratory sound—ie, stridor. Wheezing may or may not be present. Patients may also describe tightness in the neck and sometimes in the chest. The attacks are usually seconds to minutes in duration. More often, there is a precipitating or an inducing factor such as hyperventilation, cough, panting, phonatory tasks, or the inhalation of irritants or perfume, or an oropharyngeal or laryngeal manipulation prior or postextubation. The feeling of stress alone is commonly reported prior to the attacks. When evaluating patients presenting with floppy neck, dysphagia, and stridor, it is imperative that the clinician conduct a thorough history and physical examination to determine if the symptoms are secondary to a systemic or local effect, and whether the patient will progress to an acute UAO (vocal cord paralysis) necessitating intubation in the ED and subsequent tracheostomy.19,20
Conclusion
The ready availability of botulinum toxins and their low-cost-benefit ratio continue to promote over-utilization for treatment of facial wrinkles, platysmal bands, and horizontal lines; migraine headache; and hyperhidrosis. Complications associated with overuse of botulinum toxins are due to either administration of a large single dose or from regional diffusion. With the increasing number of patients receiving botulinum injections, EPs should be aware of the four available toxin types onset of action, adverse events, and potential life-threatening complications of regional neck injections.
References
1. Huang W, Foster JA, Rogachefsky AS. Pharmacology of botulinum toxin. J Am Acad Dermatol. 2000;43(2 Pt 1):249-259. doi:10.1067/mjd.2000.105567.
2. Lamanna C. The most poisonous poison. Science. 1959;130(3378):763-772.
3. Blitzer A, Brin MF, Keen MS, Aviv JE. Botulinum toxin for the treatment of hyperfunctional lines of the face. Arch Otolaryngol Head Neck Surg. 1993;119(9):1018-1022.
4. Carruthers A, Carruthers J. Clinical indications and injection technique for the cosmetic use of botulinum A exotoxin. Dermatol Surg. 1998;24(11):1189-1194.
5. Carruthers J, Carruthers A. Botox use in the mid and lower face and neck. Semin Cutan Med Surg. 2001;20(2):85-92. doi:10.1053/sder.2001.25139
6. Hoefflin SM. Anatomy of the platysma and lip depressor muscles. A simplified mnemonic approach. Dermatol Surg. 1998;24(11):1225-1231.
7. Brandt FS, Bellman B. Cosmetic use of botulinum A exotoxin for the aging neck. Dermatol Surg. 1998;24(11):1232-1234.
8. Klein AW. Complications and adverse reactions with the use of botulinum toxin. Semin Cutan Med Surg. 2001;20(2):109-120. doi:10.1053/sder.2001.25964.
9. Carruthers A, Kiene K, Carruthers J. Botulinum A exotoxin use in clinical dermatology. J Am Acad Dermatol. 1996;34(5 Pt 1):788-797.
10. Howell K, Selber P, Graham HK, Reddihough D. Botulinum neurotoxin A: an unusual systemic effect. J Paediatr Child Health. 2007:43(6):499-501. doi:10.1111/j.1440-1754.2007.01122.x.
11. Carruthers A, Carruthers J. Toxins 99, new information about the botulinum neurotoxins. Dermatol Surg. 2000;26(3):174-176.
12. Dressler D, Adib Saberi F. New formulation of Botox: complete antibody-induced treatment failure in cervical dystonia. J Neurol Neurosurg Psychiatry. 2007;78(1):108-109. doi:10.1136/jnnp.2006.093419.
13. Borodic G. Immunologic resistance after repeated botulinum toxin type a injections for facial rhytides. Ophthal Plast Reconstr Surg. 2006;22:239-240. doi:10.1097/01.iop.0000217703.80859.a3.
14. Goschel H, Wohlfarth K, Frevert J, Dengler R, Bigalke H. Botulinum A toxin therapy: neutralizing and nonneutralizing antibodies—therapeutic consequences. Exp Neurol. 1997;147(1):96-102. doi:10.1006/exnr.1997.6580.
15. Hatheway CL. Toxigenic clostridia. Clin Microbiol Rev. 1990;3(1):66-98.
16. Smith LA. Development of recombinant vaccines for botulinum neurotoxin. Toxicon. 1998;36(11):1539-1548.
17. Houser MK, Sheean GL, Lees AJ. Further studies using higher doses of botulinum toxin type F for torticollis resistant to botulinum toxin type A. J Neurol Neurosurg Psychiatry. 1998;64(5):577-580.
18. Dressler D, Wohlfahrt K, Meyer-Rogge E, Wiest L, Bigalke H. Antibody-induced failure of botulinum toxin a therapy in cosmetic indications. Dermatol Surg. 2010;36 Suppl 4:2182-2187. doi:10.1111/j.1524-4725.2010.01710.x.
19. Maschka DA, Bauman NM, McCray PB Jr, Hoffman HT, Karnell MP, Smith RJ. A classification scheme for paradoxical vocal cord motion. Laryngoscope. 1997;107(11 Pt 1):1429-1435.
20. Altman KW, Simpson CB, Amin MR, Abaza M, Balkissoon R, Casiano RR. Cough and paradoxical vocal fold motion. Otolaryngol Head Neck Surg. 2002;127(6):501-511. doi:10.1067/mhn.2002.127589.
Case
A 68-year-old woman presented to the ED 5 days after receiving onabotulinumtoxinA cosmetic injections for wrinkles of the face and neck. She stated that she was unable to raise her head while in a supine position and that her head felt heavy when standing. She also experienced spasms and strain of the posterior cervical neck muscles. In addition, the patient described a constant need to swallow forcefully throughout the day, and felt an intermittent heavy sensation over her larynx that was associated with stridor. She noted these symptoms began 5 days after the onabotulinumtoxinA injections and had peaked 2 days prior to presentation. She also complained of dysphagia without odynophagia, but denied any changes in her voice.
The patient first began onabotulinumtoxinA injections 12 years earlier for aesthetic treatment of glabellar and peri-orbital wrinkles. She initially received the injections at a regular interval of 90 to 100 days. During the course of the first 2 years of treatment, the patient was under the care of a plastic surgeon; thereafter, she sought treatment at a physician-owned medical spa because it offered onabotulinumtoxinA at a lower price. The injections at the medical spa were administered by a physician assistant (PA). The patient stated that although the PA had steadily increased the dose of onabotulinumtoxinA to maintain the desired aesthetic effect, this was the first time she had experienced any side effects from the treatment.
The ED staff contacted the medical spa provider, who reviewed the patient’s medical record over the telephone. The PA stated that he had been the only practitioner at the facility to administer the onabotulinumtoxinA injections to the patient over her past 10 years there as a client. He further informed the emergency physician (EP) that 12 days prior to presentation, he had given the patient a total of 50 IU of onabotulinumtoxinA, in five separate injections, into the mid frontalis muscle; a total of 35 IU, in seven separate injections, into the glabellar region (procerus and corrugator muscles bilaterally); 20 IU into the lateral and inferior-lateral orbicularis oculi bilaterally, in four separate injections per side, (40 IU total); and a total of 100 IU in the anterior platysma, in 20 separate injections, for a total 1-day onabotulinumtoxinA dose of 225 IU.
The PA explained to the EP that he mixed the onabotulinumtoxinA in the patient’s room and had shown her the vials and dilution standard as recommended by the manufacturer because she had been requiring increased dosages and had previously questioned whether the onabotulinumtoxinA was diluted. The PA denied any other patients experiencing similar adverse events as those of the patient’s.
Over the last 10 years, the patient had received onabotulinumtoxinA in the nasolabial folds, upper and lower lip wrinkles, mentalis, depressor angular oris, buccal, nasalis, lateral brow, masseter, and calf muscles. The dosage of onabotulinumtoxinA at this most recent injection cycle was unchanged from her previous visit 3 months prior. According to the PA, the practice did not use abobotulinumtoxinA or incobotulinumtoxinA.
Regarding the patient’s medical history, she had no health issues suggestive of myasthenia gravis, multiple sclerosis, or Guillain-Barré syndrome. Examination of the face revealed decreased muscle excursion of the frontalis muscle from mid-brow to mid-brow, and stair-step wrinkle formation bilaterally. The procerus muscle was very weak, and the corrugator muscles were moderately diminished in strength. The lateral orbicularis oculi were very weak at each canthus. The extra-ocular muscles were intact. She had full mandibular excursion, and powerful movement of the tongue. The oropharynx and floor of the mouth were normal. She was noted to purposefully swallow and extend her neck every 90 to 120 seconds to “clear her throat,” though she did not drool and was able to handle her secretions and swallow fluids without aspiration. Her voice was normal and she was able to recite the letters “KKKKK,” “OOOOO,” and “EEEEE” in rapid fashion without breathiness or stridor. The rest of her facial muscles were normal.
While examining the patient, the EP asked her to refrain from swallowing whenever she extended her neck. Upon complying with this request, her neck extension precipitated swallowing and, by not swallowing, she did not accumulate secretions. Once during the examination, the patient began swallowing and breathing rapidly with stridor. This less than 15-second episode was abated by full-neck extensions, which relieved the patient’s sensation of heaviness over the larynx. Her breathing and voice were normal immediately after this episode.
Examination of the anterior neck revealed four platysmal bands (Figure). One band measured 10 cm in length and extended from the mandible inferiorly; two bands measured 2 cm lateral to the midline bilaterally; and the fourth band extended 4 cm in length from the mandible immediately lateral to the longer platysmal band. The platysma and dermis were flaccid and redundant at rest and with exertion. The sternocleidomastoid muscles were weak with exertion. The larynx moved cephalad with swallowing. The posterior cervical neck and trapezius muscles were of normal tone and strength. No spasms or fasciculations were noted during the examination period.
While supine, the patient strained to lift her head and complained of a suffocating sensation over the larynx. She had no rashes or edema, and the remainder of the physical examination, vital signs, and pulse oximetry were normal. Laboratory evaluation, which included a complete blood count and serum electrolytes, was also normal.
An otolaryngologist consultation for laryngoscopy was obtained. After reviewing the patient’s case, the otolaryngologist concluded that given the patient’s history, intermittent stridor, and an absence of signs or symptoms suggestive of an impending upper airway obstruction (UAO), laryngoscopy was not warranted.
A plastic surgery consultation was then obtained. The patient’s examination was as noted above, and her vital signs and pulse oximetry remained normal throughout her ED stay. Although botulinum and botulinum antibody titers were ordered, the patient refused testing due to cost concerns. She was discharged home by plastic surgery services with a diagnosis of floppy neck and dysphagia secondary to aesthetic botulinum toxin paralysis of the bilateral sternocleidomastoid muscles and platysma. She was given a prescription for metoclopramide hydrochloride to stimulate motility of the upper gastrointestinal tract and to potentially improve swallowing.10
The patient was scheduled for a follow-up evaluation with the plastic surgeon 2 days after discharge. She was instructed to call 911 if she experienced stridor, shortness of breath, drooling, or if any airway issues arose. The patient did not return for her follow-up appointment with the plastic surgeon.
Discussion
Clostridium Botulinum Toxins
Clostridium botulinum is a gram-positive spore-forming anaerobic bacterium that produces extremely potent neuro-exotoxins. C botulinum is found in soil, contaminated foods, and in illicit injectable drugs (eg, heroin). Seven distinct antigenic botulinum toxins (A, B, C1, D, E, F, and G) are produced by several strains of C botulinum. Systemically, each neurotoxin is able to produce severe morbidity and mortality by causing generalized muscle paralysis and death by respiratory failure. The lethal dose of these agents is approximating 10(-9) g/kg body weight. Botulinum toxin type A is the most potent.1,2
Nonetheless, botulinum toxin has been used clinically since the early 1970s. Currently, there are three FDA-approved botulinum toxin type A agents and one type B formulation (rimabotulinumtoxinB) (Table). Each formulation is unique, proprietary, and differs in molecular weight, toxin-complex size, protein content, and inactive ingredients. The effectiveness and adverse event profile for these four botulinum toxins is individually dependent upon the different dilutions and potency, onset of action, duration of effect, diffusion, and migration potential. Hence, the effective dose of one botulinum toxin does not equate to any other, resulting in a lack of interchangeability between botulinum toxins (eg, 5 IU of incobotulinumtoxinA does not equal 5 IU of onabotulinumtoxinA).
Aesthetic Indications
Historically, the use of botulinum toxin for aesthetic treatment of wrinkles and platysmal bands was first reported by Blitzer3 in 1993.Subsequently, the use of botulinum toxin for the aesthetic treatment of facial wrinkles, hypertrophic platysmal bands and horizontal neck lines gained popularity within the public and medical community.3-5
Anatomically, the platysma is a thin sheet-like muscle that originates in the superior fascia of the pectoralis and deltoid fascia, and extends over the full length of the neck up past the mandible and continuing into the submuscular aponeurotic system. The platysma is innervated by the seventh cranial nerve and functions to pull the jaw downward. The platysma muscle is attached directly to the skin. With normal aging, the anterior neck skin becomes flaccid, the central platysmal bands thicken and contract—forming bands, horizontal wrinkles, and loss of definition of the neck noticed at rest and with contraction of the platysma muscle. These vertical bands are known as platysmal bands. The platysmal bands are benign consequences of aging and as such are targets of correction through surgery or botulinum toxin injection.6,7
Mechanism of Action
Platysmal band and horizontal line injection techniques with botulinum toxin have been reported in the literature with dosages ranging from 15 IU to 200 IU used to block the Soluble N-ethylmaleimide-sensitive factor activating protein receptors. Typical onset of action begins at 3 days, with full paralytic effect at 7 days. Repeat injections every 3 to 4 months are required with prolonged effects seen with each subsequent injection due to chemodenervation-induced muscle atrophy.4,7,8
Adverse Effects
Commercial botulinum toxin type A has been associated with minor and transient side effects. Moderate complications seen in the neck region include transient soft-tissue edema, dermal ecchymoses, intramuscular hematoma, diffuse muscle soreness, neck flexor weakness, and headaches.4,8,9
The use of botulinum toxin for chemodenervation of the platysma can produce significant weakness of other neck muscles, including the sternocleidomastoid, cricothyroid, sternothyroid, and sternohyoid. Floppy neck and dysphagia may be due to diffusion of the toxin into the muscles of deglutition of the larynx; injection directly into the sternocleidomastoid muscle; or a result of the systemic effects of large dosages. Hoarseness, breathiness, and dysphagia may occur 3 to 4 days after injection, especially with doses over 75 IU.10
The recommended concentration of botulinum toxin type A causes a diffusion average of 1 cm in all directions from the injection sites. However, as the dilution increases, so does the zone of diffusion. Typical discharge instructions for platysma treatment include the overuse of the neck muscles for 2 to 4 hours after injection to encourage the botulinum toxin uptake for optimal result. Site manipulation (rubbing or massaging) also increases diffusion. For botulinum toxin type B, the zone of diffusion is greater because its molecular weight is less than the type A toxins, thus making it an undesirable agent for aesthetic facial chemodenervation.4,11
Toxin Resistance
Botulinum toxin resistance is a known complication that occurs normally as a result of the body recognizing the neurotoxin as a foreign substance and producing neutralizing antibodies (NAb). Primary botulinum toxin failure is known in patients who require high doses of the neurotoxin for treatment of neuromuscular disorders.12 Complete secondary therapy failure is known to occur in cosmetic patients after a single dose and those who have been receiving low-dose botulinum toxin regularly. The risk of NAb development increases with long-term treatment and high doses.12-18
Floppy Neck and Dysphagia
As previously noted, floppy neck and dysphagia are adverse clinical findings of botulinum toxin effect on the platysma, sternocleidomastoid, or the paralaryngeal muscles. In this case, the patient was fortunate to have only sustained weakness of the platysma and sternocleidomastoid muscles despite both a large neck and total body dose. Paralaryngeal muscle paralysis is not life-threatening, but the distress may precipitate paradoxical vocal cord motion and stridor.
Stridor
Stridor is typically a symptom of an upper airway obstruction (UAO) process. Typical UAO conditions encountered in the ED are infections (eg, epiglottitis, croup), foreign body, allergy, and laryngeal trauma. The age of the patient, onset of stridor, course of the stridor (ie, intermittent, continuous, worsening), associated symptoms (eg, fever, rash, swelling of oral soft tissues), and bruising must be ascertained.
In differentiating the etiology of stridor, the EP should observe the patient for any associated change in voice, inability to handle secretions, and position of comfort. Patients with stridor require admission and evaluation by an otolaryngologist as expeditiously as possible because impending UAO may quickly progress to complete UAO necessitating emergent intubation.
An atypical presentation of stridor to the ED is sporadic stridor. Sporadic attacks of stridor during activity have been associated with the entity of paradoxical vocal cord motion. Patients usually describe a choking sensation with inability to breathe resulting in an audible inspiratory and/or expiratory sound—ie, stridor. Wheezing may or may not be present. Patients may also describe tightness in the neck and sometimes in the chest. The attacks are usually seconds to minutes in duration. More often, there is a precipitating or an inducing factor such as hyperventilation, cough, panting, phonatory tasks, or the inhalation of irritants or perfume, or an oropharyngeal or laryngeal manipulation prior or postextubation. The feeling of stress alone is commonly reported prior to the attacks. When evaluating patients presenting with floppy neck, dysphagia, and stridor, it is imperative that the clinician conduct a thorough history and physical examination to determine if the symptoms are secondary to a systemic or local effect, and whether the patient will progress to an acute UAO (vocal cord paralysis) necessitating intubation in the ED and subsequent tracheostomy.19,20
Conclusion
The ready availability of botulinum toxins and their low-cost-benefit ratio continue to promote over-utilization for treatment of facial wrinkles, platysmal bands, and horizontal lines; migraine headache; and hyperhidrosis. Complications associated with overuse of botulinum toxins are due to either administration of a large single dose or from regional diffusion. With the increasing number of patients receiving botulinum injections, EPs should be aware of the four available toxin types onset of action, adverse events, and potential life-threatening complications of regional neck injections.
References
1. Huang W, Foster JA, Rogachefsky AS. Pharmacology of botulinum toxin. J Am Acad Dermatol. 2000;43(2 Pt 1):249-259. doi:10.1067/mjd.2000.105567.
2. Lamanna C. The most poisonous poison. Science. 1959;130(3378):763-772.
3. Blitzer A, Brin MF, Keen MS, Aviv JE. Botulinum toxin for the treatment of hyperfunctional lines of the face. Arch Otolaryngol Head Neck Surg. 1993;119(9):1018-1022.
4. Carruthers A, Carruthers J. Clinical indications and injection technique for the cosmetic use of botulinum A exotoxin. Dermatol Surg. 1998;24(11):1189-1194.
5. Carruthers J, Carruthers A. Botox use in the mid and lower face and neck. Semin Cutan Med Surg. 2001;20(2):85-92. doi:10.1053/sder.2001.25139
6. Hoefflin SM. Anatomy of the platysma and lip depressor muscles. A simplified mnemonic approach. Dermatol Surg. 1998;24(11):1225-1231.
7. Brandt FS, Bellman B. Cosmetic use of botulinum A exotoxin for the aging neck. Dermatol Surg. 1998;24(11):1232-1234.
8. Klein AW. Complications and adverse reactions with the use of botulinum toxin. Semin Cutan Med Surg. 2001;20(2):109-120. doi:10.1053/sder.2001.25964.
9. Carruthers A, Kiene K, Carruthers J. Botulinum A exotoxin use in clinical dermatology. J Am Acad Dermatol. 1996;34(5 Pt 1):788-797.
10. Howell K, Selber P, Graham HK, Reddihough D. Botulinum neurotoxin A: an unusual systemic effect. J Paediatr Child Health. 2007:43(6):499-501. doi:10.1111/j.1440-1754.2007.01122.x.
11. Carruthers A, Carruthers J. Toxins 99, new information about the botulinum neurotoxins. Dermatol Surg. 2000;26(3):174-176.
12. Dressler D, Adib Saberi F. New formulation of Botox: complete antibody-induced treatment failure in cervical dystonia. J Neurol Neurosurg Psychiatry. 2007;78(1):108-109. doi:10.1136/jnnp.2006.093419.
13. Borodic G. Immunologic resistance after repeated botulinum toxin type a injections for facial rhytides. Ophthal Plast Reconstr Surg. 2006;22:239-240. doi:10.1097/01.iop.0000217703.80859.a3.
14. Goschel H, Wohlfarth K, Frevert J, Dengler R, Bigalke H. Botulinum A toxin therapy: neutralizing and nonneutralizing antibodies—therapeutic consequences. Exp Neurol. 1997;147(1):96-102. doi:10.1006/exnr.1997.6580.
15. Hatheway CL. Toxigenic clostridia. Clin Microbiol Rev. 1990;3(1):66-98.
16. Smith LA. Development of recombinant vaccines for botulinum neurotoxin. Toxicon. 1998;36(11):1539-1548.
17. Houser MK, Sheean GL, Lees AJ. Further studies using higher doses of botulinum toxin type F for torticollis resistant to botulinum toxin type A. J Neurol Neurosurg Psychiatry. 1998;64(5):577-580.
18. Dressler D, Wohlfahrt K, Meyer-Rogge E, Wiest L, Bigalke H. Antibody-induced failure of botulinum toxin a therapy in cosmetic indications. Dermatol Surg. 2010;36 Suppl 4:2182-2187. doi:10.1111/j.1524-4725.2010.01710.x.
19. Maschka DA, Bauman NM, McCray PB Jr, Hoffman HT, Karnell MP, Smith RJ. A classification scheme for paradoxical vocal cord motion. Laryngoscope. 1997;107(11 Pt 1):1429-1435.
20. Altman KW, Simpson CB, Amin MR, Abaza M, Balkissoon R, Casiano RR. Cough and paradoxical vocal fold motion. Otolaryngol Head Neck Surg. 2002;127(6):501-511. doi:10.1067/mhn.2002.127589.

Dung Lung: Reactive Airway Disease Syndrome From Yak-Dung Biomass Fuel Smoke
Case
A 30-year-old man without prior respiratory illness presented with coughing, wheezing, dyspnea on exertion, and decreased exercise tolerance after a 7-hour overnight exposure to yak-dung smoke. This episode took place at 4,240 m elevation in Pheriche village, along the Everest Base Camp trekking route within the Khumbu region of the Nepali Himalayas. Prior to going to bed that evening, the group of five cohabitants had a difficult time igniting the potbelly heating stove filled with yak-dung biomass fuel in the common room. Each time they tried to light it, the fire would smolder and go out within a few minutes, despite the group’s attempts at adjusting the flue and air intake. Eventually, they abandoned further attempts and retired to bed at approximately 9:30
The differential diagnosis included altitude illness, airway mucociliary dysfunction (commonly known as Khumbu cough),1 carbon monoxide (CO) poisoning, acute inhalation injury (AII) resulting in reactive airway disease syndrome (RADS), and high-altitude pulmonary edema (HAPE). Although the group hiked to Kongma La Pass (elevation, 5,545 m), and slept at 5,200 m (960 m higher than their starting point), the patient had not exhibited any symptoms of altitude illness (eg, headache, dizziness, fatigue, sleep disturbances, anorexia, nausea). Auscultation of the patient by the two physicians who accompanied him on the hike noted mild expiratory wheezing without rales or rhonchi, making HAPE unlikely in the differential diagnosis.
Although it is likely the patient had significant CO exposure, he did not display profound symptoms of CO toxicity (eg, light-headedness, headache, vertigo, nausea, or confusion). It is unclear whether the symptoms of decreased exercise tolerance and fatigue were due to CO poisoning as no co-oximeter was available to assess the patient’s CO levels.2,3 Upon return from the trip, pulse oximetry showed the patient to have an oxygen (O2) saturation of 89% on room air, which was within appropriate range for their altitude.
One of the physicians offered the patient an albuterol metered-dose inhaler, which provided profound and immediate relief of his coughing and wheezing. The patient continued to use the albuterol inhaler every 2 to 4 hours over the next 2 days. The dyspnea on exertion and decreased exercise tolerance improved after 24 hours of treatment; the rest of his respiratory symptoms resolved after approximately 5 days at the starting elevation, and he returned to his usual baseline state of health. No follow-up chest X-rays were obtained, and the patient has had no subsequent recurrence of these symptoms despite return to higher altitude in the subsequent year.
Discussion
Nearly one-third to one-half of the world’s population relies on biomass fuels for domestic heating or cooking, with developing countries accounting for 99% of its use.4 These fuels consist of dried dung cakes or patties, agricultural products, coal, and firewood. In the Khumbu region of Nepal above timberline, yak-dung patties are used exclusively for heating and frequently for cooking. Most guesthouses in this region have potbelly-style stoves in the common dining areas, which are fueled by yak dung and ventilated with a chimney.
Pulmonary Pathophysiology of Inhaled Irritants
Biomass fuels are responsible for numerous air pollutants due to incomplete combustion. These fuels suspend particulate matter, CO, nitrogen dioxide, polycyclic aromatic hydrocarbons, and volatile organic compounds, including acetone, methyl ethyl ketone, benzene, formaldehyde, and toluene.5 Compared to other biomass fuel sources, dung-cake combustion results in higher emissions of relatively very small particulate matter with peak concentrations ranging from 0.23 to 0.3 μm in size, which penetrate and affect the distal airway. 6 Their combustion also releases volatile organic compounds and CO.7,8 Aside from indoor air pollution, yak-dung combustion in the Nepali Himalayan valley contributes significantly to the ambient airborne concentrations of lead, copper, aluminum, magnesium, and elemental and organic carbon.9
Emergency physicians (EPs) are often the first-line treating physician for patients exposed not only to biomass fuels, but also home, forest, or occupational fires resulting in smoke inhalation or AII.10 These terms refer to the wide number of substances that may be present in the smoke and collectively affect the patient. Inhaled substances classified as irritants, such as smoke and particulate matter, can harm the epithelium of the respiratory tract, with highly water-soluble or larger particles (>10 μm) mostly affecting the upper airways. These irritants cause symptoms of progressive coughing, and wheezing; or stridor resulting in tracheitis, bronchitis, bronchiolitis, alveolitis, pulmonary edema, and/or airway obstruction. Smaller particles (<2.5 μm) can penetrate further into the lung and affect the distal airway to a greater degree. These particles are able to infiltrate the terminal bronchioles and alveoli, leading to localized inflammatory reaction and bronchospasm.11Smoke may also contain chemical asphyxiants such as CO or hydrogen cyanide, which can be absorbed, leading to systemic toxicity and interfering with O2 delivery or utilization. Importantly, high concentrations of any gas can act as an asphyxiant due to displacement of O2.12 Thermal injuries are also possible from fire and smoke exposure, typically affecting the upper airways. Steam inhalation can even cause irritation and burns below the vocal cords.13
Reactive Airway Disease Syndrome
Reactive airway disease syndrome is a constellation of symptoms presenting similar to asthma with persistent airway reactivity after an AII, and is the most common sequelae of exposure to biomass fuel combustion. This syndrome is not specifically caused by one type of particulate, irritant, or chemical component of the smoke.
Symptoms
Symptoms such as cough, dyspnea, and wheezing may begin minutes after exposure, and can persist for years due to bronchial hyperresponsiveness.14 These chronic symptoms of RADS have been well highlighted by New York Fire Department rescue workers from the World Trade Center collapse, of whom 16% continued to show symptoms of RADS 1 year later.15
Treatment
Bronchodilator therapy is the mainstay of treatment for RADS. Patients who have RADS often respond well to treatment, and show improvement in symptoms and spirometry testing.
Sequelae Associated With Biomass Fuel Exposure
A cross-sectional study showed significant reductions (P < .001) in all pulmonary function testing parameters for cow-dung fuel users compared to those who use modern energy sources: forced expiratory volume in the first second (FEV1), forced vital capacity (FVC), FEV1/FVC ratio, and mid-flow rate between the first 25% and 75% of forced expiratory flow. Linear regression showed a 12.4% reduction in FVC of cow-dung users, and 36% (compared to 20% in modern energy-source users) were noted to have pulmonary infections.16
Due to these emissions, biomass fuel exposure causes high levels of morbidity and mortality in developing countries, with nearly 2 million attributable deaths annually.1 Chronic exposure to biomass fuel emissions can lead to increased risk of diseases, including respiratory problems (eg, pneumonia, tuberculosis and chronic obstructive pulmonary disease, lung cancer, asthma), low birthweight, cataracts, and cardiovascular events.2,17 Women are at higher risk compared to other family members, as they typically spend approximately 3 to 4 hours longer daily in tents,5 and perform the majoring of the cooking duties. For pregnant women, the developing fetus may also be exposed, which can lead to increased rates of fetal demise.18
Conclusion
Our report represents the first reported case of “dung lung” or RADS from yak-dung biomass fuel combustion exposure. In the medical literature, there has been one previous case report of dung lung by Osbern and Crapo19 in 1981 in which the authors described three patients who died from aspiration of liquid manure in a storage facility.Our case highlights the prevalence of biomass fuel combustion in the third world, the dangerous air pollutants from their emissions, and the morbidity associated with improper ventilation of biomass fuel combustion.
1. Rodway GW, Windsor JS. Airway mucociliary function at high altitude. Wilderness Environ Med. 2006;17(4):271-275.
2. Leigh-Smith S. Carbon monoxide poisoning in tents—a review. Wilderness Environ Med. 2004;15(3):157-163.
3. Lipman GL. Carbon monoxide toxicity at high altitude [Commentary]. Wilderness Environ Med. 2006;17(2):144-145.
4. Prasad R, Singh A, Garg R, Giridhar GB. Biomass fuel exposure and respiratory diseases in India. Biosci Trends. 2012;6(5):219-228.
5. Kim KH, Jahan SA, Kabir E. A review of diseases associated with household air pollution due to the use of biomass fuels. J Hazard Mater. 2011;192(2):425-431.
6. Park D, Barabad ML, Lee G, et al. Emission characteristics of particulate matter and volatile organic compounds in cow dung combustion. Environ Sci Technol. 2013;47(22):12952-12957.
7. Venkataraman C, Rao GU. Emission factors of carbon monoxide and size-resolved aerosols from biofuel combustion. Environ Sci Technol. 2001;35(10):2100-2107.
8. Chen PF, Li CL, Kang SC, et al. [Indoor air pollution in the Nam Co and Ando Regions in the Tibetan Plateau]. [Article in Chinese]. Huan Jing Ke Xue. 2011;32(5):1231-1236.
9. avidson CI, Grimm TC, Nasta MA. Airborne lead and other elements derived from local fires in the himalayas. Science. 1981;214(4527):1344-1366.
10. Gorguner M, Akgun M. Acute inhalation injury. Eurasian J Med. 2010;42(1):28-35.
11. Ainslie G. Inhalational injuries produced by smoke and nitrogen dioxide. Respir Med. 1993;87(3):169-174.
12. Glazer CS. Acute inhalational injury. In: Hanley ME, Welsh CH, eds. Current Diagnosis & Treatment in Pulmonary Medicine. International Ed. New York, NY: McGraw Hill; 2003:354-360.
13. Gu TL, Liou SH, Hsu CH, Hsu JC, Wu TN. Acute health hazards of firefighters after fighting a department store fire. Indust Health. 1996;34(1):13-23.
14. Alberts WM, do Picco GA. Reactive airways dysfunction syndrome. Chest. 1996;109(6):1618-1626.
15. Banauch GI, Dhala A, Alleyne D, et al. Bronchial hyperreactivity and other inhalation lung injuries in rescue/recovery workers after the World Trade Center collapse. Crit Care Med. 2005;33(1 Suppl):S102-S106.
16. Sümer H, Turaçlar UT, Onarlioğlu T, Ozdemir L, Zwahlen M. The association of biomass fuel combustion on pulmonary function tests in the adult population of Mid-Anatolia. Soz Praventivmed. 2004;49(4):247-253.
17. Cesaroni G, Forastiere F, Stafoggia M, et al. Long term exposure to ambient air pollution and incidence of acute coronary events: prospective cohort study and meta-analysis in 11 European cohorts from the ESCAPE Project. BMJ. 2014;348:f7412.
18. de Koning HW, Smith KR, Last JM. Biomass fuel combustion and health. Bull World Health Organ. 1985;63(1):11-26.
19. Osbern LN, Crapo RO. Dung lung: a report of toxic exposure to liquid manure. Ann Intern Med. 1981;95(3):312-314.
Case
A 30-year-old man without prior respiratory illness presented with coughing, wheezing, dyspnea on exertion, and decreased exercise tolerance after a 7-hour overnight exposure to yak-dung smoke. This episode took place at 4,240 m elevation in Pheriche village, along the Everest Base Camp trekking route within the Khumbu region of the Nepali Himalayas. Prior to going to bed that evening, the group of five cohabitants had a difficult time igniting the potbelly heating stove filled with yak-dung biomass fuel in the common room. Each time they tried to light it, the fire would smolder and go out within a few minutes, despite the group’s attempts at adjusting the flue and air intake. Eventually, they abandoned further attempts and retired to bed at approximately 9:30
The differential diagnosis included altitude illness, airway mucociliary dysfunction (commonly known as Khumbu cough),1 carbon monoxide (CO) poisoning, acute inhalation injury (AII) resulting in reactive airway disease syndrome (RADS), and high-altitude pulmonary edema (HAPE). Although the group hiked to Kongma La Pass (elevation, 5,545 m), and slept at 5,200 m (960 m higher than their starting point), the patient had not exhibited any symptoms of altitude illness (eg, headache, dizziness, fatigue, sleep disturbances, anorexia, nausea). Auscultation of the patient by the two physicians who accompanied him on the hike noted mild expiratory wheezing without rales or rhonchi, making HAPE unlikely in the differential diagnosis.
Although it is likely the patient had significant CO exposure, he did not display profound symptoms of CO toxicity (eg, light-headedness, headache, vertigo, nausea, or confusion). It is unclear whether the symptoms of decreased exercise tolerance and fatigue were due to CO poisoning as no co-oximeter was available to assess the patient’s CO levels.2,3 Upon return from the trip, pulse oximetry showed the patient to have an oxygen (O2) saturation of 89% on room air, which was within appropriate range for their altitude.
One of the physicians offered the patient an albuterol metered-dose inhaler, which provided profound and immediate relief of his coughing and wheezing. The patient continued to use the albuterol inhaler every 2 to 4 hours over the next 2 days. The dyspnea on exertion and decreased exercise tolerance improved after 24 hours of treatment; the rest of his respiratory symptoms resolved after approximately 5 days at the starting elevation, and he returned to his usual baseline state of health. No follow-up chest X-rays were obtained, and the patient has had no subsequent recurrence of these symptoms despite return to higher altitude in the subsequent year.
Discussion
Nearly one-third to one-half of the world’s population relies on biomass fuels for domestic heating or cooking, with developing countries accounting for 99% of its use.4 These fuels consist of dried dung cakes or patties, agricultural products, coal, and firewood. In the Khumbu region of Nepal above timberline, yak-dung patties are used exclusively for heating and frequently for cooking. Most guesthouses in this region have potbelly-style stoves in the common dining areas, which are fueled by yak dung and ventilated with a chimney.
Pulmonary Pathophysiology of Inhaled Irritants
Biomass fuels are responsible for numerous air pollutants due to incomplete combustion. These fuels suspend particulate matter, CO, nitrogen dioxide, polycyclic aromatic hydrocarbons, and volatile organic compounds, including acetone, methyl ethyl ketone, benzene, formaldehyde, and toluene.5 Compared to other biomass fuel sources, dung-cake combustion results in higher emissions of relatively very small particulate matter with peak concentrations ranging from 0.23 to 0.3 μm in size, which penetrate and affect the distal airway. 6 Their combustion also releases volatile organic compounds and CO.7,8 Aside from indoor air pollution, yak-dung combustion in the Nepali Himalayan valley contributes significantly to the ambient airborne concentrations of lead, copper, aluminum, magnesium, and elemental and organic carbon.9
Emergency physicians (EPs) are often the first-line treating physician for patients exposed not only to biomass fuels, but also home, forest, or occupational fires resulting in smoke inhalation or AII.10 These terms refer to the wide number of substances that may be present in the smoke and collectively affect the patient. Inhaled substances classified as irritants, such as smoke and particulate matter, can harm the epithelium of the respiratory tract, with highly water-soluble or larger particles (>10 μm) mostly affecting the upper airways. These irritants cause symptoms of progressive coughing, and wheezing; or stridor resulting in tracheitis, bronchitis, bronchiolitis, alveolitis, pulmonary edema, and/or airway obstruction. Smaller particles (<2.5 μm) can penetrate further into the lung and affect the distal airway to a greater degree. These particles are able to infiltrate the terminal bronchioles and alveoli, leading to localized inflammatory reaction and bronchospasm.11Smoke may also contain chemical asphyxiants such as CO or hydrogen cyanide, which can be absorbed, leading to systemic toxicity and interfering with O2 delivery or utilization. Importantly, high concentrations of any gas can act as an asphyxiant due to displacement of O2.12 Thermal injuries are also possible from fire and smoke exposure, typically affecting the upper airways. Steam inhalation can even cause irritation and burns below the vocal cords.13
Reactive Airway Disease Syndrome
Reactive airway disease syndrome is a constellation of symptoms presenting similar to asthma with persistent airway reactivity after an AII, and is the most common sequelae of exposure to biomass fuel combustion. This syndrome is not specifically caused by one type of particulate, irritant, or chemical component of the smoke.
Symptoms
Symptoms such as cough, dyspnea, and wheezing may begin minutes after exposure, and can persist for years due to bronchial hyperresponsiveness.14 These chronic symptoms of RADS have been well highlighted by New York Fire Department rescue workers from the World Trade Center collapse, of whom 16% continued to show symptoms of RADS 1 year later.15
Treatment
Bronchodilator therapy is the mainstay of treatment for RADS. Patients who have RADS often respond well to treatment, and show improvement in symptoms and spirometry testing.
Sequelae Associated With Biomass Fuel Exposure
A cross-sectional study showed significant reductions (P < .001) in all pulmonary function testing parameters for cow-dung fuel users compared to those who use modern energy sources: forced expiratory volume in the first second (FEV1), forced vital capacity (FVC), FEV1/FVC ratio, and mid-flow rate between the first 25% and 75% of forced expiratory flow. Linear regression showed a 12.4% reduction in FVC of cow-dung users, and 36% (compared to 20% in modern energy-source users) were noted to have pulmonary infections.16
Due to these emissions, biomass fuel exposure causes high levels of morbidity and mortality in developing countries, with nearly 2 million attributable deaths annually.1 Chronic exposure to biomass fuel emissions can lead to increased risk of diseases, including respiratory problems (eg, pneumonia, tuberculosis and chronic obstructive pulmonary disease, lung cancer, asthma), low birthweight, cataracts, and cardiovascular events.2,17 Women are at higher risk compared to other family members, as they typically spend approximately 3 to 4 hours longer daily in tents,5 and perform the majoring of the cooking duties. For pregnant women, the developing fetus may also be exposed, which can lead to increased rates of fetal demise.18
Conclusion
Our report represents the first reported case of “dung lung” or RADS from yak-dung biomass fuel combustion exposure. In the medical literature, there has been one previous case report of dung lung by Osbern and Crapo19 in 1981 in which the authors described three patients who died from aspiration of liquid manure in a storage facility.Our case highlights the prevalence of biomass fuel combustion in the third world, the dangerous air pollutants from their emissions, and the morbidity associated with improper ventilation of biomass fuel combustion.
1. Rodway GW, Windsor JS. Airway mucociliary function at high altitude. Wilderness Environ Med. 2006;17(4):271-275.
2. Leigh-Smith S. Carbon monoxide poisoning in tents—a review. Wilderness Environ Med. 2004;15(3):157-163.
3. Lipman GL. Carbon monoxide toxicity at high altitude [Commentary]. Wilderness Environ Med. 2006;17(2):144-145.
4. Prasad R, Singh A, Garg R, Giridhar GB. Biomass fuel exposure and respiratory diseases in India. Biosci Trends. 2012;6(5):219-228.
5. Kim KH, Jahan SA, Kabir E. A review of diseases associated with household air pollution due to the use of biomass fuels. J Hazard Mater. 2011;192(2):425-431.
6. Park D, Barabad ML, Lee G, et al. Emission characteristics of particulate matter and volatile organic compounds in cow dung combustion. Environ Sci Technol. 2013;47(22):12952-12957.
7. Venkataraman C, Rao GU. Emission factors of carbon monoxide and size-resolved aerosols from biofuel combustion. Environ Sci Technol. 2001;35(10):2100-2107.
8. Chen PF, Li CL, Kang SC, et al. [Indoor air pollution in the Nam Co and Ando Regions in the Tibetan Plateau]. [Article in Chinese]. Huan Jing Ke Xue. 2011;32(5):1231-1236.
9. avidson CI, Grimm TC, Nasta MA. Airborne lead and other elements derived from local fires in the himalayas. Science. 1981;214(4527):1344-1366.
10. Gorguner M, Akgun M. Acute inhalation injury. Eurasian J Med. 2010;42(1):28-35.
11. Ainslie G. Inhalational injuries produced by smoke and nitrogen dioxide. Respir Med. 1993;87(3):169-174.
12. Glazer CS. Acute inhalational injury. In: Hanley ME, Welsh CH, eds. Current Diagnosis & Treatment in Pulmonary Medicine. International Ed. New York, NY: McGraw Hill; 2003:354-360.
13. Gu TL, Liou SH, Hsu CH, Hsu JC, Wu TN. Acute health hazards of firefighters after fighting a department store fire. Indust Health. 1996;34(1):13-23.
14. Alberts WM, do Picco GA. Reactive airways dysfunction syndrome. Chest. 1996;109(6):1618-1626.
15. Banauch GI, Dhala A, Alleyne D, et al. Bronchial hyperreactivity and other inhalation lung injuries in rescue/recovery workers after the World Trade Center collapse. Crit Care Med. 2005;33(1 Suppl):S102-S106.
16. Sümer H, Turaçlar UT, Onarlioğlu T, Ozdemir L, Zwahlen M. The association of biomass fuel combustion on pulmonary function tests in the adult population of Mid-Anatolia. Soz Praventivmed. 2004;49(4):247-253.
17. Cesaroni G, Forastiere F, Stafoggia M, et al. Long term exposure to ambient air pollution and incidence of acute coronary events: prospective cohort study and meta-analysis in 11 European cohorts from the ESCAPE Project. BMJ. 2014;348:f7412.
18. de Koning HW, Smith KR, Last JM. Biomass fuel combustion and health. Bull World Health Organ. 1985;63(1):11-26.
19. Osbern LN, Crapo RO. Dung lung: a report of toxic exposure to liquid manure. Ann Intern Med. 1981;95(3):312-314.

Parents look online for atopic dermatitis advice
Many caregivers of children with atopic dermatitis do not receive clear instructions on how to properly use topical corticosteroids and seek advice on online forums, according to Emma Teasdale, PhD, and her associates.
The investigators analyzed 27 forum discussions involving 95 participants from 2003 to 2015 and found that parents expressed a range of beliefs regarding the use of topical corticosteroids. Some parents expressed positive views, but many were cautious and perceived topical corticosteroids as unnatural or too strong. Notably, parents said they believed that topical corticosteroids thinned or weakened the skin.
Parents also expressed uncertainty over how to use topical corticosteroids. Common questions involved duration of use, where and when to apply, and confusion over the strength of different preparations. Parents also noted that they received conflicting physician instructions regarding duration, dosage, tapering, and safety.
“Given the prevalence of concerns about potential adverse effects of topical-corticosteroids, it would seem prudent to signpost parents/carers towards convenient, consistent, evidence-based information to ensure that the potential negative impacts of seeking (unsubstantiated) medical advice online are minimized. In the absence of such information they are likely to turn to online discussion forums as their sole resource where, although much useful support and advice can be found, some is of questionable validity,” the investigators concluded.
Find the full study in the British Journal of Dermatology (doi: 10.1111/bjd.15130).
FROM THE BRITISH JOURNAL OF DERMATOLOGY
Restrict gluten if necessary, but confirm condition first
SAN FRANCISCO – Elimination diet crazes have been around for centuries, and one of today’s biggest targets is gluten, contributing to an industry of gluten-free products with revenue in the billions of dollars.
But does taking gluten off your child’s plate actually improve their health? It will if they have a condition in which gluten actually causes symptoms, explained Michelle M. Pietzak, MD, a pediatrician at the University of Southern California, Los Angeles.
Gluten is a mixture of proteins found in wheat, rye, barley, oats, corn, and rice that gives food its elasticity and helps dough rise. Only the gluten in wheat, rye, and barley causes gluten-related symptoms, but it is found in a variety of derivative products, such as spelt, kamut, triticale, couscous, bulgar, faro, matzo flour, and other grains as well. Oats are also considered cross-contaminated with gluten because they are milled with wheat, and other foods containing gluten may be difficult to identify due to food labeling and preparation practices in the United States.
For those with celiac disease, wheat allergy, irritable bowel syndrome (IBS), or nonceliac gluten sensitivity or intolerance, a gluten-free diet can reduce or eliminate the symptoms causing problems. For others, however, the symptoms likely come from somewhere besides gluten or may be a nocebo effect, where a patient who expects negative symptoms becomes more likely to have them.
Lactose intolerance is one example that can cause symptoms similar to those that respond to restricting gluten. Another is sensitivity to fructans, a wheat carbohydrate and one of the fermentable oligo-di-monosaccharides and polyols (FODMAPs) that can improve IBS when restricted. Imbalance in a person’s gut bacteria, called dysbiosis, also may cause similar symptoms and results from excess yeast, parasites, or an overgrowth of bad bacteria in the absence of beneficial ones.
Understanding celiac disease
This immune-mediated disease causes primarily gastrointestinal symptoms when someone ingests proteins called prolamines, which those with celiac disease are genetically predisposed to have difficulty digesting. Common symptoms include diarrhea, nausea, vomiting, abdominal pain, constipation, appetite changes, and, in unusual cases, excess fat in the feces (steatorrhea).
But celiac disease also may contribute to a short stature, osteoporosis, dermatitis herpetiformis, delayed onset of puberty, infertility, anemia (from iron and/or folic acid deficits), epilepsy, and behavioral changes. Although those with celiac disease are at a higher risk for arthritis, osteoporosis, osteopenia, osteomalacia, and rickets, a gluten-free diet can improve children’s low bone mineral density.
Screening for celiac disease includes testing for antigliadin (AGA) IgG and IgA, antiendomysial IgA, anti-tissue transglutaminase (tTG) IgA, total serum IgA, and genetic testing related to HLA-DQ2 and HLA-DQ8 genes.
Wheat allergy
A wheat allergy, among the eight most common food allergies, involves an IgE-mediated reaction to water- and salt-insoluble gliadins, especially omega-5 gliadin, which can cause anaphylaxis in a wheat-allergic person who exercises after ingesting wheat. Symptoms of wheat allergy include hives; swelling, itching or irritation of the mouth, throat, eyes, and nose; difficulty breathing; and cramps, nausea, vomiting, and diarrhea. Wheat allergy most commonly occurs in infants or toddlers, and typically co-occurs with other food allergies, but children usually outgrow the allergy by ages 3-5 years.
Nonceliac gluten sensitivity or intolerance
Physicians only should consider gluten insensitivity or intolerance after ruling out celiac disease and wheat allergy. Less understood and more controversial, gluten sensitivity or intolerance may be an immune-mediated condition – or instead an intestinal malfunction. Some patients may simply have an intolerance to high fiber foods in general. Patients with this sensitivity or intolerance will have a normal intestinal biopsy, but AGA IgG and/or IgA testing and genetic HLA-DQ2 testing may be positive. The clinical diagnosis is ultimately one of exclusion determined when a gluten-free diet alleviates symptoms.
Although gas, diarrhea, weight loss, and abdominal pain are the most common symptoms, other transient symptoms may include dyspepsia, nausea, vomiting, bloating, constipation, intestinal rumbling, joint or bone pain, muscle cramps or pain, fatigue, numbness, cramps, headaches, rashes, tongue inflammation, anemia, leg numbness, osteoporosis, or unexplained anemia.
Another potential effect of gluten sensitivity is dermatitis herpetiformis, a skin inflammation involving blisters, hives, or other types of erythematous or urticarial papules, usually symmetrically distributed, with severe itching. Although 90% of individuals with dermatitis herpetiformis lack any gastrointestinal symptoms, about 75% have villous atrophy, Dr. Pietzak said.
Even less understood are neurologic symptoms of gluten sensitivity and their potential mechanisms. Reported neurologic findings of gluten sensitivity include ataxia, peripheral neuropathy, depression, schizophrenia, epilepsy, and intracranial calcifications.
Irritable bowel syndrome
The similarity of symptoms between IBS and celiac disease has meant many with celiac disease were misdiagnosed with IBS, particularly women, Dr. Pietzak said. To confuse matters more, restricting gluten has shown improvement in IBS symptoms for some patients: in one study, 60% of those with diarrhea returned to having normal stools after 6 months of a gluten-free diet. Again, AGA IgG and tTG IgG testing was more likely to be positive among these patients. IBS and celiac disease can co-occur in patients, but it’s necessary to rule out celiac disease before diagnosing a patient with IBS.
Importance of differential diagnosis
It’s important to know the difference between celiac disease and other conditions because patients may face different risks even if their treatment is similar. Those with celiac disease, for example, have a greater risk of nutritional deficiencies leading to conditions such as iron-deficiency anemia and osteoporosis, and are more likely to develop gastrointestinal cancers or other autoimmune conditions, such as thyroid disease, type 1 diabetes, joint diseases, and liver diseases.
Those with food allergies and intolerances do not share those increased risks, and their symptoms resolve without long-term organ damage when they remove the gluten or wheat from their diet. Further, only those with celiac disease must restrict all foods with gluten. Those with a wheat allergy may be able to eat rye, barley, and oats, for example, and restricting gluten may improve IBS symptoms for only a subset of patients.
Dr. Pietzak has consulted for Nestle Nutrition and is on the speaker’s bureau for Prometheus Labs, a lab which does business in testing for celiac disease.
EXPERT ANALYSIS FROM AAP 16