User login
Is Sitagliptin Plus Glargine Noninferior to Basal–Bolus Insulin for Inpatient Management of Type 2 Diabetes?
Study Overview
Objective. To compare the safety and efficacy of basal–bolus insulin therapy with sitagliptin plus insulin glargine in type 2 diabetes patients admitted to general medicine and surgical wards.
Design. Multicenter, prospective, open-label, noninferiority randomized clinical trial.
Setting and participants. Type 2 diabetes patients aged 18 to 80 years admitted to the general medicine and surgery services at one of 5 academic-based US hospitals were recruited. Eligible participants presented with a random blood glucose concentration between 140 and 400 mg/dL and were treated at home with diet, oral agents, or oral agents plus insulin at a maximum daily dose of 0.6 units/kg. Among those excluded were patients recently treated with a dipeptidyl peptidase-4 (DPP-4) inhibitor or glucagon-like peptide-1 (GLP-1) agonist, patients with clinically relevant hepatic disease, patients who were not eating for more than 48 hours, and those with an estimated glomerular filtration rate (eGFR) < 30 mL/min.
Intervention. Participants were randomly assigned to receive basal–bolus insulin therapy (BBI) with glargine once daily plus rapid-acting insulin before meals or sitagliptin plus glargine (SPG) once daily. Those in the SPG group received sitagliptin 100 mg/day if their eGFR was > 50 mL/min and sitagliptin 50 mg/day if their eGFR was 30 to 50 mL/min. If the eGFR fell below 30 mL/min during the hospitalization, sitagliptin was reduced to 25 mg/day. Glargine doses for those in the SPG group were started at 0.2 units/kg if randomization blood glucose was 140–200 mg/dL and 0.25 units/kg if randomization glucose was 201–400 mg/dL. Patients aged 70 or older or with an eGFR < 50 mL/min started with a daily glargine dose of 0.15 units/kg. For the BBI group, a total daily insulin dose of 0.4 units/kg was initiated for those with blood glucose levels between 140 and 200 mg/dL, and 0.5 units/kg for those with randomization glucose between 201 and 400 mg/dL. Half of this daily dose was given as glargine and the other half was distributed evenly across 3 pre-meal doses. Both the BBI and SPG groups received pre-meal and bedtime correction doses of rapid-acting insulin for glucose levels above 140 mg/dL. Blood glucose concentrations were measured fasting, before meals, and at bedtime or every 6 hours for patients who were not eating. Target fasting and pre-meal blood glucose levels were 100 to 140 mg/dL. Investigators and participants were not blinded to group assignment and glucose control was managed by the primary medical or surgical team.
Main outcomes measure. The primary outcome for this trial was noninferiority for differences between the SPG and BBI groups in glycemic control. Secondary endpoints included differences in the number of hypoglycemic and hyperglycemic events, the number of blood glucose values between 70 and 140 mg/dL and between 70 and 180 mg/dL, and the number of treatment failures (defined as 2 consecutive blood glucose values > 240 mg/dL or mean daily glucose > 240 mg/dL), length of hospital stay, total daily dose of insulin, number of insulin injections per day, transfer to the intensive care unit, and hospital complications and mortality.
Main results. A total of 138 patients in the SPG group and 139 patients in the BBI group completed the study and were included in this analysis. Of these 277 patients, 84% were admitted to a medicine ward and 16% were admitted to a surgical ward. The average age of participants was approximately 57 years, the average BMI was approximately 35 kg/m2, and the average duration of diabetes was approximately 10 years. These baseline characteristics as well as ethnic origin, sex, and baseline A1c (approximately 40% of patients in both groups had a baseline A1c between 7% and 9%) did not differ between groups. Prior to admission, approximately 40% of patients in both groups were managed with oral drugs alone, approximately 25% were managed with insulin alone, and about 22% were managed with insulin and oral therapy.
With respect to the primary outcome, both groups had similar mean daily blood glucose concentrations (171 mg/dL in SPG and 169 mg/dL in BBI) throughout the hospitalization, meeting the noninferiority threshold for glycemic control between groups. As for secondary outcomes, the mean proportion of blood glucose readings between 70 and 140 mg/dL, 70 and 180 mg/dL, and 100 and 140 mg/dL did not differ between groups. Pre-meal and bedtime blood glucose concentrations were also similar in both groups. There was a significant difference between groups in average daily insulin dose (24 units in SPG versus 34 units in BBI), total units of insulin per kg per day (0.2 units/kg in SPG versus 0.3 units/kg in BBI), and number of insulin injections per day (2.2 in SPG versus 2.9 in BBI). There was no difference in the number of hypoglycemic or hyperglycemic events, length of hospital stay (approximately 4 days in both groups), and rates of complications (including acute respiratory failure, acute kidney injury, and myocardial infarction) between groups.
Conclusion. Inpatient treatment with sitagliptin plus glargine was noninferior to basal–bolus insulin therapy in measurements of glycemic control.
Commentary
Approximately 25% to 30% of adult patients admitted to general medical and surgical wards and critical care units have type 2 diabetes [1]. Maintaining adequate blood sugar control is important, as both hyperglycemia and hypoglycemia have been associated with adverse outcomes. Although group consensus statements differ slightly with respect to recommended target glucose levels, generally the recommended range in a noncritical inpatient setting is 140 to 180 mg/dL [2,3]. Establishing and maintaining these levels can often be very challenging. Barriers to achieving adequate glucose control in the inpatient setting include changes in a patients’ nutrition status, renal function, pain level, the use of glucocorticoids, and the development of infections. In addition, a significant gap in knowledge can exist from provider to provider in terms of how to appropriately initiate and titrate insulin regimens. To circumvent this, many hospitals have created built-in order sets and protocols in the electronic medical record for basal–bolus correction insulin regimens. While these protocols may have improved many parameters of inpatient diabetes management at several institutions, improper initiation and execution of these protocols still occur. Also, at times the priorities of the medical team can shift so that titration of the insulin regimen may not occur frequently enough. Overall, simplification of inpatient glucose management would certainly be a welcomed change.
Unfortunately, there is a dearth of studies that investigate the role of oral therapy in the inpatient setting. In general, oral medications are discontinued upon admission and insulin is the recommended standard of care. In this study, Pasquel and colleagues investigated the use of the DPP-4 inhibitor sitagliptin in the inpatient setting. Unlike some of the other classes of oral agents used in the outpatient setting, DPP-4 inhibitors are generally well tolerated. A major advantage of DPP-4 inhibitors is that, with dose titration, they can also be used in mild to moderate renal failure. However, because DPP-4 inhibitors work in the prandial setting, they are not effective in the NPO patient. In this study, both the SPG group and BBI group had similar average daily blood glucose levels after the first day of therapy and throughout the hospitalization (171 mg/dL in SPG versus 169 mg/dL in BBI). Since the key finding here was noninferiority for blood sugar control between the treatments, the major differences between SPG and BBI therapy should be highlighted.
One benefit of SPG versus BBI therapy is that replacement of bolus insulin injections with a once-daily pill reduces the need for frequent bolus insulin dose titration. Nonetheless, renal function should be monitored frequently, as sitagliptin dose adjustments may be required, and the importance of bedside glucose checks should not be diminished, as some patients may not maintain adequate control on this regimen and will need to betransitioned to BBI therapy. Both treatment groups received correctional insulin doses in the prandial setting if their pre-meal glucose levels met a specific threshold. Overall, the SPG group required significantly fewer total insulin injections per day (2.2 injections in SPG versus 2.9 injections in BBI, P < 0.001). Though this difference is rather small, the need to administer fewer insulin injections would certainly be beneficial to nursing staff, who often care for several type 2 diabetes patients at once. It would have been interesting to know how many patients in each group were free of any correctional insulin doses or how many were adequately controlled with just 1 prandial injection per day. Although it cannot be concluded from this study, it could be expected that the reduced need for bolus insulin dose titration and fewer total insulin injections associated with oral therapy would result in less insulin dosing error and perhaps greater patient satisfaction.
It is important to keep in mind that initiating a DPP-4 inhibitor with basal insulin may not be an appropriate option for all admitted type 2 diabetes patients. It can be a beneficial alternative to insulin for the select group of patients included in this study: those treated at home with diet alone, oral therapy alone, or oral therapy plus insulin.
While the potential for implementation of SPG therapy in an inpatient setting does exist, there are some limitations to this study that make further investigation necessary. Though the patent on Januvia (sitagliptin’s trade name) expires in 2017, sitagliptin is currently a very expensive drug. Therefore, a cost-benefit analysis of SPG therapy versus insulin therapy alone should be undertaken. Also, this was an unblinded study, which may have resulted in more attentive, prioritized blood sugar management than what would typically occur in an inpatient setting. Also, the providers’ level of expertise on insulin management in this study may not be generalized to all inpatient medical and surgical providers. Despite these limitations, this study may have a profound impact on inpatient diabetes management, since a less labor-intensive alternative to basal–bolus insulin therapy may present a more attractive option for many inpatient providers.
Applications for Clinical Practice
This study could pave the way for a practice-changing method of inpatient glucose management for a select group of patients who do not have severely uncontrolled type 2 diabetes. One should keep in mind that cost could be a barrier to implementation of sitagliptin in hospitals, and that while the bolus dose of insulin can be replaced with sitagliptin, patients may still need correctional doses of insulin to maintain target ranges. Also, a daily assess-ment of glucose control is still necessary in order to determine if a change in management is needed. Therefore, the sitagliptin plus glargine option should not be viewed as a “shortcut” therapy, but rather as a potentially less labor-intensive option that may increase the ability to prioritize blood sugar management in the inpatient setting.
— Lisa Parikh, MD, Yale School of Medicine,
New Haven, CT
1. Draznin B, Gilden J, Golden SH, Inzucchi SE. Pathways to quality inpatient management of hyperglycemia and diabetes: a call to action. Diabetes Care 2013;36:1807–14.
2. American Diabetes Association Standards of Medical Care in Diabetes 2017. Diabetes Care 2017;40(supplement 1).
3. Umpierrez GE, Hellman R, Korytkowski MT. Management of hyperglycemia in hospitalized patients in non-critical care setting: an Endocrine Society clinical practice guideline. J Clin Endocrinol Metab 2012;97:16–38.
Study Overview
Objective. To compare the safety and efficacy of basal–bolus insulin therapy with sitagliptin plus insulin glargine in type 2 diabetes patients admitted to general medicine and surgical wards.
Design. Multicenter, prospective, open-label, noninferiority randomized clinical trial.
Setting and participants. Type 2 diabetes patients aged 18 to 80 years admitted to the general medicine and surgery services at one of 5 academic-based US hospitals were recruited. Eligible participants presented with a random blood glucose concentration between 140 and 400 mg/dL and were treated at home with diet, oral agents, or oral agents plus insulin at a maximum daily dose of 0.6 units/kg. Among those excluded were patients recently treated with a dipeptidyl peptidase-4 (DPP-4) inhibitor or glucagon-like peptide-1 (GLP-1) agonist, patients with clinically relevant hepatic disease, patients who were not eating for more than 48 hours, and those with an estimated glomerular filtration rate (eGFR) < 30 mL/min.
Intervention. Participants were randomly assigned to receive basal–bolus insulin therapy (BBI) with glargine once daily plus rapid-acting insulin before meals or sitagliptin plus glargine (SPG) once daily. Those in the SPG group received sitagliptin 100 mg/day if their eGFR was > 50 mL/min and sitagliptin 50 mg/day if their eGFR was 30 to 50 mL/min. If the eGFR fell below 30 mL/min during the hospitalization, sitagliptin was reduced to 25 mg/day. Glargine doses for those in the SPG group were started at 0.2 units/kg if randomization blood glucose was 140–200 mg/dL and 0.25 units/kg if randomization glucose was 201–400 mg/dL. Patients aged 70 or older or with an eGFR < 50 mL/min started with a daily glargine dose of 0.15 units/kg. For the BBI group, a total daily insulin dose of 0.4 units/kg was initiated for those with blood glucose levels between 140 and 200 mg/dL, and 0.5 units/kg for those with randomization glucose between 201 and 400 mg/dL. Half of this daily dose was given as glargine and the other half was distributed evenly across 3 pre-meal doses. Both the BBI and SPG groups received pre-meal and bedtime correction doses of rapid-acting insulin for glucose levels above 140 mg/dL. Blood glucose concentrations were measured fasting, before meals, and at bedtime or every 6 hours for patients who were not eating. Target fasting and pre-meal blood glucose levels were 100 to 140 mg/dL. Investigators and participants were not blinded to group assignment and glucose control was managed by the primary medical or surgical team.
Main outcomes measure. The primary outcome for this trial was noninferiority for differences between the SPG and BBI groups in glycemic control. Secondary endpoints included differences in the number of hypoglycemic and hyperglycemic events, the number of blood glucose values between 70 and 140 mg/dL and between 70 and 180 mg/dL, and the number of treatment failures (defined as 2 consecutive blood glucose values > 240 mg/dL or mean daily glucose > 240 mg/dL), length of hospital stay, total daily dose of insulin, number of insulin injections per day, transfer to the intensive care unit, and hospital complications and mortality.
Main results. A total of 138 patients in the SPG group and 139 patients in the BBI group completed the study and were included in this analysis. Of these 277 patients, 84% were admitted to a medicine ward and 16% were admitted to a surgical ward. The average age of participants was approximately 57 years, the average BMI was approximately 35 kg/m2, and the average duration of diabetes was approximately 10 years. These baseline characteristics as well as ethnic origin, sex, and baseline A1c (approximately 40% of patients in both groups had a baseline A1c between 7% and 9%) did not differ between groups. Prior to admission, approximately 40% of patients in both groups were managed with oral drugs alone, approximately 25% were managed with insulin alone, and about 22% were managed with insulin and oral therapy.
With respect to the primary outcome, both groups had similar mean daily blood glucose concentrations (171 mg/dL in SPG and 169 mg/dL in BBI) throughout the hospitalization, meeting the noninferiority threshold for glycemic control between groups. As for secondary outcomes, the mean proportion of blood glucose readings between 70 and 140 mg/dL, 70 and 180 mg/dL, and 100 and 140 mg/dL did not differ between groups. Pre-meal and bedtime blood glucose concentrations were also similar in both groups. There was a significant difference between groups in average daily insulin dose (24 units in SPG versus 34 units in BBI), total units of insulin per kg per day (0.2 units/kg in SPG versus 0.3 units/kg in BBI), and number of insulin injections per day (2.2 in SPG versus 2.9 in BBI). There was no difference in the number of hypoglycemic or hyperglycemic events, length of hospital stay (approximately 4 days in both groups), and rates of complications (including acute respiratory failure, acute kidney injury, and myocardial infarction) between groups.
Conclusion. Inpatient treatment with sitagliptin plus glargine was noninferior to basal–bolus insulin therapy in measurements of glycemic control.
Commentary
Approximately 25% to 30% of adult patients admitted to general medical and surgical wards and critical care units have type 2 diabetes [1]. Maintaining adequate blood sugar control is important, as both hyperglycemia and hypoglycemia have been associated with adverse outcomes. Although group consensus statements differ slightly with respect to recommended target glucose levels, generally the recommended range in a noncritical inpatient setting is 140 to 180 mg/dL [2,3]. Establishing and maintaining these levels can often be very challenging. Barriers to achieving adequate glucose control in the inpatient setting include changes in a patients’ nutrition status, renal function, pain level, the use of glucocorticoids, and the development of infections. In addition, a significant gap in knowledge can exist from provider to provider in terms of how to appropriately initiate and titrate insulin regimens. To circumvent this, many hospitals have created built-in order sets and protocols in the electronic medical record for basal–bolus correction insulin regimens. While these protocols may have improved many parameters of inpatient diabetes management at several institutions, improper initiation and execution of these protocols still occur. Also, at times the priorities of the medical team can shift so that titration of the insulin regimen may not occur frequently enough. Overall, simplification of inpatient glucose management would certainly be a welcomed change.
Unfortunately, there is a dearth of studies that investigate the role of oral therapy in the inpatient setting. In general, oral medications are discontinued upon admission and insulin is the recommended standard of care. In this study, Pasquel and colleagues investigated the use of the DPP-4 inhibitor sitagliptin in the inpatient setting. Unlike some of the other classes of oral agents used in the outpatient setting, DPP-4 inhibitors are generally well tolerated. A major advantage of DPP-4 inhibitors is that, with dose titration, they can also be used in mild to moderate renal failure. However, because DPP-4 inhibitors work in the prandial setting, they are not effective in the NPO patient. In this study, both the SPG group and BBI group had similar average daily blood glucose levels after the first day of therapy and throughout the hospitalization (171 mg/dL in SPG versus 169 mg/dL in BBI). Since the key finding here was noninferiority for blood sugar control between the treatments, the major differences between SPG and BBI therapy should be highlighted.
One benefit of SPG versus BBI therapy is that replacement of bolus insulin injections with a once-daily pill reduces the need for frequent bolus insulin dose titration. Nonetheless, renal function should be monitored frequently, as sitagliptin dose adjustments may be required, and the importance of bedside glucose checks should not be diminished, as some patients may not maintain adequate control on this regimen and will need to betransitioned to BBI therapy. Both treatment groups received correctional insulin doses in the prandial setting if their pre-meal glucose levels met a specific threshold. Overall, the SPG group required significantly fewer total insulin injections per day (2.2 injections in SPG versus 2.9 injections in BBI, P < 0.001). Though this difference is rather small, the need to administer fewer insulin injections would certainly be beneficial to nursing staff, who often care for several type 2 diabetes patients at once. It would have been interesting to know how many patients in each group were free of any correctional insulin doses or how many were adequately controlled with just 1 prandial injection per day. Although it cannot be concluded from this study, it could be expected that the reduced need for bolus insulin dose titration and fewer total insulin injections associated with oral therapy would result in less insulin dosing error and perhaps greater patient satisfaction.
It is important to keep in mind that initiating a DPP-4 inhibitor with basal insulin may not be an appropriate option for all admitted type 2 diabetes patients. It can be a beneficial alternative to insulin for the select group of patients included in this study: those treated at home with diet alone, oral therapy alone, or oral therapy plus insulin.
While the potential for implementation of SPG therapy in an inpatient setting does exist, there are some limitations to this study that make further investigation necessary. Though the patent on Januvia (sitagliptin’s trade name) expires in 2017, sitagliptin is currently a very expensive drug. Therefore, a cost-benefit analysis of SPG therapy versus insulin therapy alone should be undertaken. Also, this was an unblinded study, which may have resulted in more attentive, prioritized blood sugar management than what would typically occur in an inpatient setting. Also, the providers’ level of expertise on insulin management in this study may not be generalized to all inpatient medical and surgical providers. Despite these limitations, this study may have a profound impact on inpatient diabetes management, since a less labor-intensive alternative to basal–bolus insulin therapy may present a more attractive option for many inpatient providers.
Applications for Clinical Practice
This study could pave the way for a practice-changing method of inpatient glucose management for a select group of patients who do not have severely uncontrolled type 2 diabetes. One should keep in mind that cost could be a barrier to implementation of sitagliptin in hospitals, and that while the bolus dose of insulin can be replaced with sitagliptin, patients may still need correctional doses of insulin to maintain target ranges. Also, a daily assess-ment of glucose control is still necessary in order to determine if a change in management is needed. Therefore, the sitagliptin plus glargine option should not be viewed as a “shortcut” therapy, but rather as a potentially less labor-intensive option that may increase the ability to prioritize blood sugar management in the inpatient setting.
— Lisa Parikh, MD, Yale School of Medicine,
New Haven, CT
1. Draznin B, Gilden J, Golden SH, Inzucchi SE. Pathways to quality inpatient management of hyperglycemia and diabetes: a call to action. Diabetes Care 2013;36:1807–14.
2. American Diabetes Association Standards of Medical Care in Diabetes 2017. Diabetes Care 2017;40(supplement 1).
3. Umpierrez GE, Hellman R, Korytkowski MT. Management of hyperglycemia in hospitalized patients in non-critical care setting: an Endocrine Society clinical practice guideline. J Clin Endocrinol Metab 2012;97:16–38.
Editorial Note
With great pleasure we announce a collaboration between Cutis® and the Skin of Color Society (SOCS) to increase the knowledge available to dermatologists to help improve delivery of care to this underserved population.
Established in 2004 by Susan C. Taylor, MD (who also serves on the Cutis Editorial Board), SOCS (http://www.skinofcolorsociety.org) promotes, supports, and stimulates the development of information related to all aspects of skin of color within the specialty of dermatology, making this information readily available to the general population.
“Although a relatively new organization, SOCS has been essential in supporting and encouraging research and scholarly activity to increase our understanding of the ethnic differences that occur in problems related to hair, skin, and nails of the growing population of darker-skinned individuals in our country,” said Vincent A. DeLeo, MD, Editor-in-Chief of Cutis and a founding member of SOCS. “In addition, SOCS has been essential in mentoring young students and increasing minority participation in dermatology, and Cutis will strive to assist in those endeavors.”
The society also seeks to increase the body of dermatologic literature related to skin of color. To achieve this goal, SOCS will be collaborating with the editors of Cutis to publish quarterly Skin of Color columns to educate dermatologists and residents on basic science and clinical, surgical, and cosmetic research relevant to this patient population.
“SOCS is very excited to collaborate with Cutis in our mutual academic pursuits,” said Seemal R. Desai, MD, current secretary/treasurer of SOCS and president-elect. “It is vitally important to the mission of SOCS that dermatologists and patients be educated with the most up-to-date objective data, studies, and information that is available to most effectively help those suffering from skin disease in the skin of color population.”
Look for Skin of Color columns in upcoming issues of Cutis.
Which Cognitive Domains Predict Progression From MCI to Dementia in Parkinson’s Disease?
MIAMI—Among patients with Parkinson’s disease–associated mild cognitive impairment (MCI), Montreal Cognitive Assessment (MoCA) subscores in visuospatial function, attention, language, and orientation are the most useful in predicting conversion to dementia, according to research presented at the First Pan American Parkinson’s Disease and Movement Disorders Congress.
Melissa Mackenzie, of the Division of Neurology at the University of British Columbia in Vancouver, and colleagues conducted a study to evaluate which subscores on the cognitive assessment predict conversion to dementia in patients with Parkinson’s disease–associated MCI.
The investigators searched the Pacific Parkinson’s Research Centre Database to identify patients with a diagnosis of idiopathic Parkinson’s disease who completed an itemized MoCA in the MCI range (ie, they had a corrected total score between 21 and 27) and who completed at least one other MoCA at least one year later. Patients taking potentially cognitive enhancing medications were excluded.
The researchers included in their study 529 assessments from 164 patients. They separated patients into three groups based on their last MoCA score—those who developed dementia (33 patients), those who returned to normal cognition (48 patients), and those who maintained MoCA scores in the MCI range (83 patients).
In a model that predicted future MoCA score categories with 78% accuracy, the most important subscores were visuospatial, attention, language, and orientation, “but, interestingly, not delayed recall,” Dr. Mackenzie and colleagues said.
“A prevailing theory of cognitive decline in Parkinson’s disease postulates that visuospatial ‘posterior-cortical’ impairments are due to Lewy body deposition, whereas frontal executive dysfunction reflects ‘on–off’ state,” the researchers said. “Interestingly, language scores and memory function in delayed recall were the items that improved the most” in patients who converted from MCI to normal cognition.
“Whether the best approach to assess risk of conversion to dementia is to focus exclusively on these MoCA sections, or alternatively, employing multiple tests that target these cognitive domains remains to be seen,” the researchers concluded.
Patients with Parkinson’s disease–associated MCI at any time “should likely be followed more closely for cognitive decline, as they seem to be at increased risk for developing dementia, even if there is interval maintenance of MCI or return to normal cognition.”
—Jake Remaly
Suggested Reading
Pedersen KF, Larsen JP, Tysnes OB, Alves G. Natural course of mild cognitive impairment in Parkinson disease: A 5-year population-based study. Neurology. 2017;88(8):767-774.
Sublingual Apomorphine Film May Induce On State in Patients With Parkinson’s Disease
MIAMI—Among patients with Parkinson’s disease with well-defined morning off episodes, 83% achieved an on-medication state within 45 minutes of treatment with sublingual apomorphine film, according to research presented at the First Pan American Parkinson’s Disease and Movement Disorders Congress. Investigators presented preliminary results from an open-label dose titration phase of a phase III trial.
The sublingual apomorphine film, known as APL-130277, is being developed by Marlborough, Massachusetts-based Sunovion Pharmaceuticals. Apomorphine injected subcutaneously is approved for the acute, intermittent treatment of off episodes, but it is not widely used, possibly because of its parenteral administration, researchers have said. The dissolvable film consists of an apomorphine drug layer and a second layer that is designed to neutralize acid generation and enhance drug permeability. The film appeared to be effective in a phase II open-label study.

Daily Off Episodes
Participants were older than 18, had idiopathic Parkinson’s disease, and had a modified Hoehn and Yahr stage between 1 and 3 on medication. Participants were responsive to levodopa and had more than two hours of off time per day. Patients were receiving stable doses of levodopa–carbidopa.
Investigators excluded patients with psychosis, dementia, or impulse control disorders; mouth cankers or sores; or prior treatment of Parkinson’s disease with a neurosurgical procedure, continuous subcutaneous apomorphine infusion, or levodopa–carbidopa enteral suspension. They also excluded patients who received subcutaneous apomorphine within seven days before screening or were taking 5-HT3 antagonists, dopamine antagonists (other than quetiapine or clozapine), or dopamine-depleting agents.
Three days prior to the dose titration phase, patients initiated treatment with trimethobenzamide or domperidone, which may reduce nausea and vomiting that can occur during the initiation of apomorphine therapy. Patients arrived at a clinic in an off state, having not taken their regular morning levodopa dose or other adjunctive medication later than midnight, and received 10 mg of APL-130277. Investigators assessed patients using the Unified Parkinson’s Disease Rating Scale Part III prior to dosing and 15, 30, 45, 60, and 90 minutes after dosing. Patients who responded with a fully on response (ie, patients and investigators agreed that medication was benefiting mobility, stiffness, and slowness such that patients had adequate motor function to perform their normal daily activities) were considered to have completed the dose titration phase and could proceed to randomization for the maintenance treatment phase. Patients who responded to a dose could try the next highest dose at a subsequent titration visit to assess the potential for an improved response at the higher dose. Doses increased by 5 mg increments up to 35 mg.
Of 76 patients who entered the dose titration phase, 63 (83%) turned fully on with treatment. Among patients who turned fully on, 24 (38%) did so within 15 minutes, and 49 (78%) did so within 30 minutes. The median dose turning patients to fully on was 20 mg. Patients who turned fully on assessed time to onset as between five and 12 minutes.
Safety Data
In a presentation of preliminary safety data from the dose titration phase, Stuart Isaacson, MD, Director of the Parkinson’s Disease and Movement Disorders Center of Boca Raton in Florida, and colleagues reported that five of the 76 patients who entered the dose titration phase discontinued the trial due to adverse events—two due to nausea, one due to somnolence, one due to headache, and one due to presyncope. Another two patients withdrew consent, and nine patients who did not turn on at the 35 mg dose were discontinued from the trial. Other reported adverse events included dizziness, yawning, vomiting, and symptomatic hypotension. Most adverse events were considered mild. “In this preliminary analysis, APL-130277 was well tolerated in patients in the dose titration phase,” Dr. Isaacson and colleagues concluded.
—Jake Remaly
Suggested Reading
Hauser RA, Olanow CW, Dzyngel B, et al. Sublingual apomorphine (APL-130277) for the acute conversion of OFF to ON in Parkinson's disease. Mov Disord. 2016;31(9):1366-1372.
MIAMI—Among patients with Parkinson’s disease with well-defined morning off episodes, 83% achieved an on-medication state within 45 minutes of treatment with sublingual apomorphine film, according to research presented at the First Pan American Parkinson’s Disease and Movement Disorders Congress. Investigators presented preliminary results from an open-label dose titration phase of a phase III trial.
The sublingual apomorphine film, known as APL-130277, is being developed by Marlborough, Massachusetts-based Sunovion Pharmaceuticals. Apomorphine injected subcutaneously is approved for the acute, intermittent treatment of off episodes, but it is not widely used, possibly because of its parenteral administration, researchers have said. The dissolvable film consists of an apomorphine drug layer and a second layer that is designed to neutralize acid generation and enhance drug permeability. The film appeared to be effective in a phase II open-label study.
Daily Off Episodes
Participants were older than 18, had idiopathic Parkinson’s disease, and had a modified Hoehn and Yahr stage between 1 and 3 on medication. Participants were responsive to levodopa and had more than two hours of off time per day. Patients were receiving stable doses of levodopa–carbidopa.
Investigators excluded patients with psychosis, dementia, or impulse control disorders; mouth cankers or sores; or prior treatment of Parkinson’s disease with a neurosurgical procedure, continuous subcutaneous apomorphine infusion, or levodopa–carbidopa enteral suspension. They also excluded patients who received subcutaneous apomorphine within seven days before screening or were taking 5-HT3 antagonists, dopamine antagonists (other than quetiapine or clozapine), or dopamine-depleting agents.
Three days prior to the dose titration phase, patients initiated treatment with trimethobenzamide or domperidone, which may reduce nausea and vomiting that can occur during the initiation of apomorphine therapy. Patients arrived at a clinic in an off state, having not taken their regular morning levodopa dose or other adjunctive medication later than midnight, and received 10 mg of APL-130277. Investigators assessed patients using the Unified Parkinson’s Disease Rating Scale Part III prior to dosing and 15, 30, 45, 60, and 90 minutes after dosing. Patients who responded with a fully on response (ie, patients and investigators agreed that medication was benefiting mobility, stiffness, and slowness such that patients had adequate motor function to perform their normal daily activities) were considered to have completed the dose titration phase and could proceed to randomization for the maintenance treatment phase. Patients who responded to a dose could try the next highest dose at a subsequent titration visit to assess the potential for an improved response at the higher dose. Doses increased by 5 mg increments up to 35 mg.
Of 76 patients who entered the dose titration phase, 63 (83%) turned fully on with treatment. Among patients who turned fully on, 24 (38%) did so within 15 minutes, and 49 (78%) did so within 30 minutes. The median dose turning patients to fully on was 20 mg. Patients who turned fully on assessed time to onset as between five and 12 minutes.
Safety Data
In a presentation of preliminary safety data from the dose titration phase, Stuart Isaacson, MD, Director of the Parkinson’s Disease and Movement Disorders Center of Boca Raton in Florida, and colleagues reported that five of the 76 patients who entered the dose titration phase discontinued the trial due to adverse events—two due to nausea, one due to somnolence, one due to headache, and one due to presyncope. Another two patients withdrew consent, and nine patients who did not turn on at the 35 mg dose were discontinued from the trial. Other reported adverse events included dizziness, yawning, vomiting, and symptomatic hypotension. Most adverse events were considered mild. “In this preliminary analysis, APL-130277 was well tolerated in patients in the dose titration phase,” Dr. Isaacson and colleagues concluded.
—Jake Remaly
Suggested Reading
Hauser RA, Olanow CW, Dzyngel B, et al. Sublingual apomorphine (APL-130277) for the acute conversion of OFF to ON in Parkinson's disease. Mov Disord. 2016;31(9):1366-1372.

Oral Contraceptives for Acne Treatment: US Dermatologists’ Knowledge, Comfort, and Prescribing Practices
The incidence of acne in adult females is rising,1 and treatment with combined oral contraceptive pills (OCPs) is becoming an increasingly important therapy for women with acne. Prior reports have indicated that OCPs were as effective as systemic antibiotics in reducing inflammatory, noninflammatory, and total facial acne lesions after 6 months of treatment.2,3 The acne management guidelines of the American Academy of Dermatology confer OCPs a grade A recommendation based on consistent and good-quality patient-oriented evidence.4
The US Food and Drug Administration (FDA) has approved 3 OCPs for the treatment of acne in adult women: norgestimate–ethinyl estradiol in 1997, norethindrone acetate–ethinyl estradiol in 2001, and drospirenone–ethinyl estradiol in 2007.5 However, the use of these OCPs is poorly understood by many dermatologists. One study showed that dermatologists prescribed OCPs in only 2% of visits with female patients aged 12 to 55 years who presented for acne treatment, which is less often than obstetrician/gynecologists (36%) and internists (11%),6 perhaps due to perceived risks or unfamiliarity with OCP formulations and guidelines among dermatologists.7 Adverse effects of OCPs include venous thromboembolism (VTE), myocardial infarction, and hypertension,8 but they generally are well tolerated.9
Even less is known about dermatologists’ use of drospirenone-containing OCPs (DCOCPs), which contain the only FDA-approved progestin that blocks androgen receptors. In prior studies, treatment with DCOCPs was associated with greater reductions in total lesion count and investigator-graded acne severity compared to early-generation OCPs.10,11 However, DCOCPs have been associated with a greater risk for VTE (4.0–6.3 times higher than OCP nonuse; 1.0–3.3 times higher than levonorgestrel-containing OCPs),12 which may explain the decline in DCOCP prescriptions among gynecologists in Germany from 23.8% of OCP prescriptions in 2007 to 11.4% in 2011.13
In this study, we surveyed US dermatologists about their knowledge, comfort, and prescribing practices pertaining to the use of OCPs. We compare OCP-prescribing to nonprescribing dermatologists, and those frequently prescribing DCOCPs to those who infrequently prescribe DCOCPs.
Methods
Survey Design
We performed a cross-sectional survey study using convenience sampling. The instrument was designed based on primary literature on OCPs in acne treatment and questionnaires assessing the use of OCPs in other specialties. Topics included prescribing practices, contraindications for OCPs defined by the Centers for Disease Control and Prevention (CDC),14 VTE risk, patient selection for hormonal acne therapy, comfort with prescribing OCP therapy, and participant demographics.
Skip logic was employed (ie, subsequent questions depended on prior answers). A pilot study surveyed 9 board-certified dermatologists at our home institution (Weill Cornell Medical College, New York, New York).
Data Collection
Eligible participants were board-certified US dermatologists. Data were collected and managed using an electronic data capture tool through the Weill Cornell Medical College Clinical & Translational Science Center. Surveys were distributed electronically to dermatologic society members, university alumni networks, investigators’ professional contacts, and dermatologists whose contact information was purchased from an email marketing company. Chain-referral sampling (ie, participants’ recruitment among their colleagues) was used. Surveys were distributed at a regional dermatology meeting. Responses were collected from November 2014 to April 2015. This study was approved by the institutional review board.
Statistical Analysis
For the descriptive data, all responses including pilot study participants were analyzed regardless of survey completion and were summarized using frequency counts and percentages (N=130).
For the analysis of OCP prescription predictors, the sample included all respondents answering the demographic questions and indicating if they prescribe OCPs (N=116). One respondent was excluded for answering other for current practice setting. Demographic predictors of OCP prescription were physician characteristics, geographic region, practice location population density, practice attributes, time spent on medical versus pediatric dermatology, number of weekly acne patients, and percentage of total patients who are female. Medical school graduation year was a categorical variable and was categorized as prior to 1997 (when norgestimate–ethinyl estradiol was FDA approved for acne5) versus 1997 or later. Respondents’ practice states were analyzed according to US regions—Northeast, Midwest, South, West/Pacific—and population density (persons per square mile) using US Census Bureau data.15,16
Univariate logistic regressions modeling OCP prescribing probability were performed for each demographic variable; a multivariable logistic model was constructed including all variables significant at α=.20 from univariate modeling.
To compare frequent prescribers versus infrequent prescribers of DCOCPs, we included all respondents answering whether they frequently prescribe DCOCPs and whether they believed the risk for VTE associated with DCOCPs differed from other OCPs (n=68). A univariate logistic regression was performed to model the probability of responding “Yes, they pose a greater risk” versus any of the other 3 responses by whether or not the respondent frequently prescribed DCOCPs for acne, and an unadjusted odds ratio was obtained. All P values were 2-tailed with statistical significance evaluated at α=.05. Ninety-five percent confidence intervals were calculated to assess precision of obtained estimates. Analyses were performed using SAS software version 9.4.
Results
Demographics
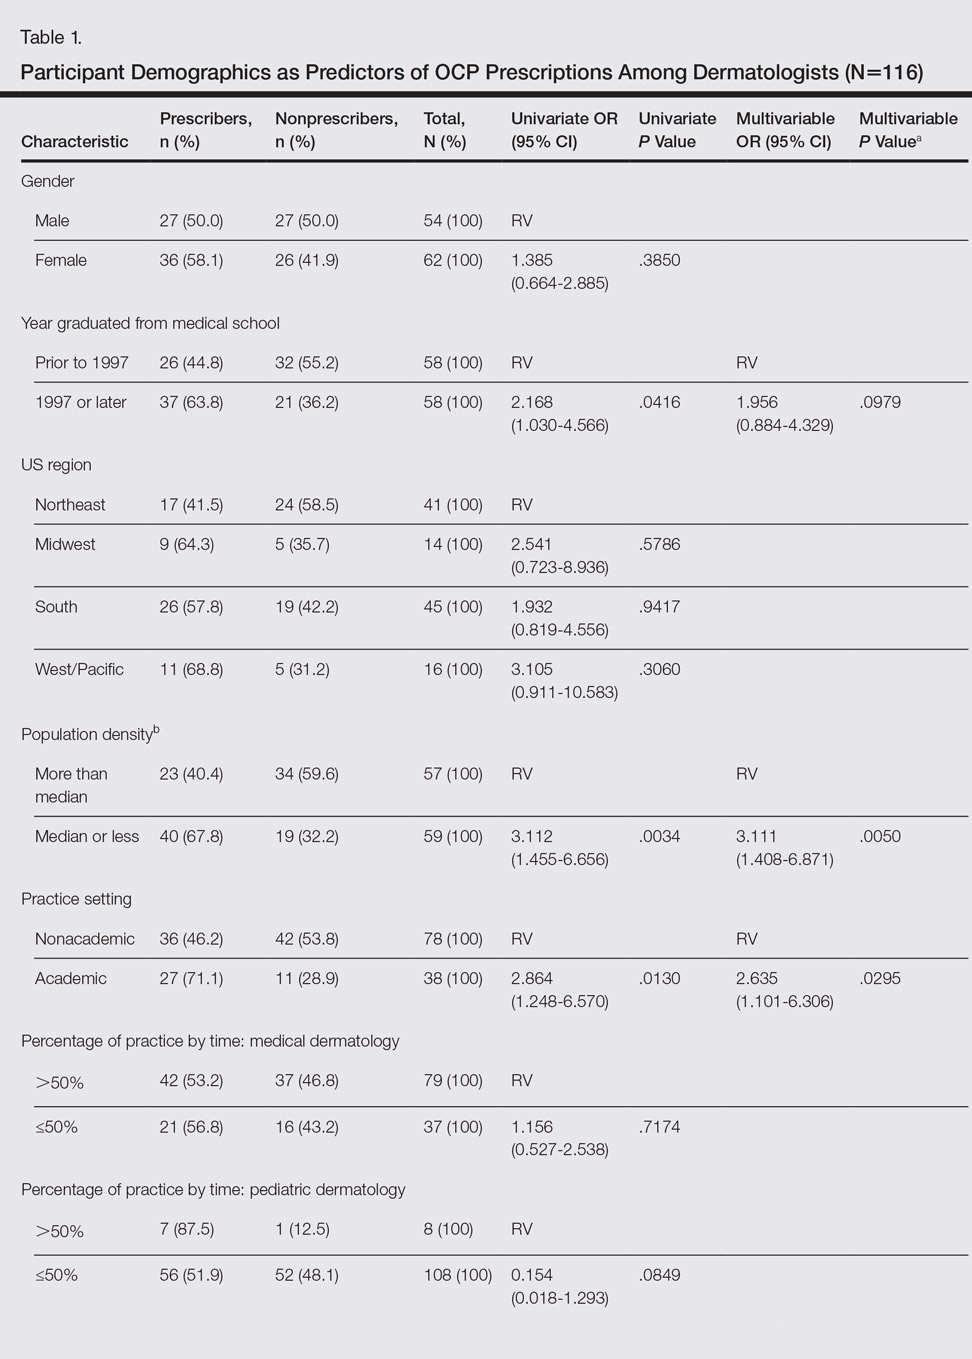
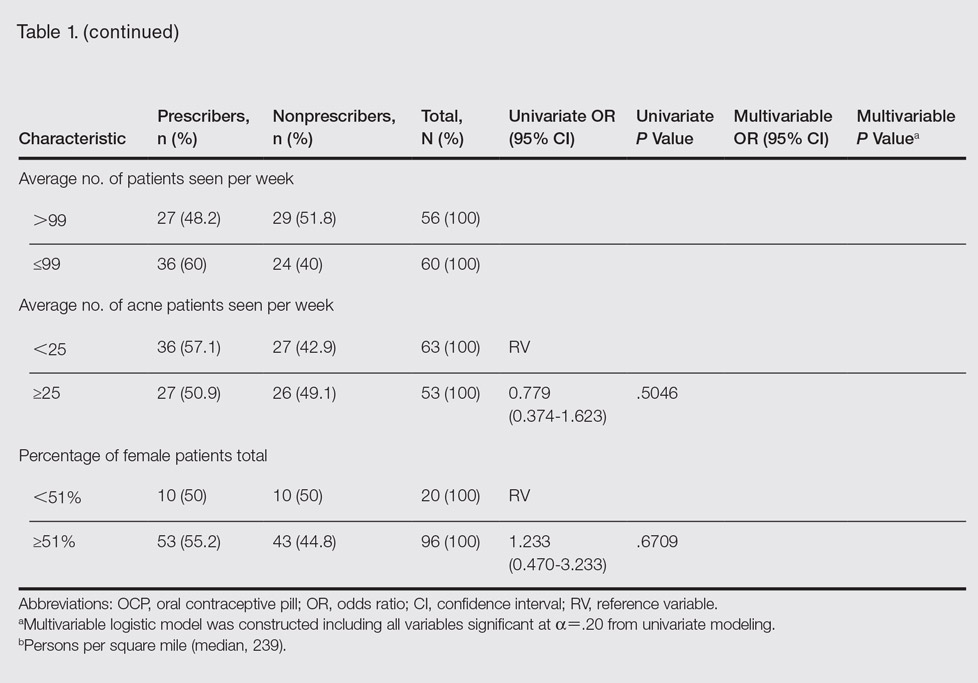
Participant demographics as predictors of OCP prescription practices are described in Table 1.
Knowledge
Oral contraceptive pills were endorsed as effective in the treatment of acne in women by 95.4% (124/130) of respondents. Among prescribers of OCPs for acne, 94.2% (65/69) believed OCPs were associated with an increased risk for VTE, no respondents thought OCPs were associated with a decreased VTE risk, 2.9% (2/69) believed OCPs did not affect VTE risk, and 2.9% (2/69) were unsure.
Among prescribers of OCPs for acne, 46.4% (32/69) believed DCOCPs posed a greater VTE risk than other OCPs. Odds of this response did not differ with frequent DCOCP prescribers versus infrequent prescribers (odds ratio, 0.731 [95% confidence interval, 0.272-1.964]; P=.5342). Participant responses on VTE risk and DCOCPs are provided in Table 2.

Dermatologists prescribing OCPs for acne endorsed greater likelihood of doing so in cases of cyclical flares with menstrual cycle (94.2% [65/69]), acne unresponsive to conventional therapy (87.0% [60/69]), acne on the lower half of the face (78.3% [54/69]), diagnosis of polycystic ovary syndrome (PCOS)(76.8% [53/69]), clinical suspicion of PCOS (71.0% [49/69]), concomitant hirsutism (71.0% [49/69]), late- or adult-onset acne (66.7% [46/69]), laboratory evidence of hyperandrogenism (60.9% [42/69]), and concomitant androgenetic alopecia (49.3% [34/69]).
Among dermatologists who prescribed OCPs for acne, CDC-defined absolute contraindications identified correctly were blood pressure of 160/100 mm Hg (59.4% [41/69]) and history of migraine with focal neurologic symptoms (49.3% [34/69]). The CDC-defined relative contraindications identified correctly were history of deep vein thrombosis or pulmonary embolism (1.4% [1/69]), breast cancer history with 5 years of no disease (15.9% [11/69]), hyperlipidemia (42.0% [29/69]), and 36 years or older smoking fewer than 15 cigarettes per day (21.7% [15/69]).
Comfort
Dermatologist self-reported comfort levels in prescribing OCPs for acne are shown in Table 3.

Prescribing Practices
Among all respondents, acne medications prescribed often included oral antibiotics (76.9% [100/130]), isotretinoin (41.5% [54/130]), and spironolactone (40.8% [53/130]).
Overall, 55.4% (72/130) of respondents prescribed OCPs for the following uses: acne (95.8% [69/72]), concomitant treatment with teratogenic medication (48.6% [35/72]), PCOS (34.7% [25/72]), hirsutism (26.4% [19/72]), androgenetic alopecia (19.4% [14/72]), SAHA (seborrhea, acne, hirsutism, alopecia) syndrome (12.5% [9/72]), and HAIR-AN (hyperandrogenism, insulin resistance, acanthosis nigricans) syndrome (11.1% [8/72]). For teratogenic medications, dermatologists prescribing OCPs did so with isotretinoin (77.8% [56/72]), spironolactone (73.6% [53/72]), tetracycline antibiotics (37.5% [27/72]), and other (34.7% [25/72]).
Of dermatologists prescribing OCPs for acne, frequency included often (19% [13/69]), sometimes (45% [31/69]), and rarely (36% [25/69]). The most frequently prescribed OCPs included Ortho Tri-Cyclen (Janssen Pharmaceuticals, Inc)(80% [55/69]), Yaz (Bayer)(64% [44/69]), and Estrostep (Warner Chilcott)(19% [13/69]). Fill-in responses included Desogen (Merck & Co, Inc)(3/69 [4%]), Alesse (Wyeth Pharmaceuticals, Inc)(3/69 [4%]), Lutera (Watson Pharma, Inc)(1/69 [1%]), Loestrin (Warner Chilcott)(1/69 [1%]), and Yasmin (Bayer)(1/69 [1%]).
In univariate regressions, graduation from medical school in 1997 or later (P=.0416), academic practice setting (P=.0130), and low-density practice setting (P=.0034) were significant predictors of prescribing OCPs. In multivariable regression, only academic practice setting (P=.0295) and low-density practice setting (P=.0050) remained significant predictors. Demographic predictors are summarized in Table 1.
Comment
Our results suggest that most dermatologists (95.4%) believe OCPs effectively treat acne; however, only 54% of respondents reported prescribing them. Academic dermatologists were more likely to prescribe OCPs than nonacademic dermatologists, possibly indicating that academic dermatologists are more familiar with the literature on the efficacy and use of OCPs. Nearly half of respondents seeing 25 or more acne patients weekly did not prescribe OCPs, suggesting a notable practice gap. Dermatologists in less dense US regions were more likely to prescribe OCPs, perhaps because dermatologists may be more likely to prescribe OCPs than refer patients in health care access–limited areas, just as primary care providers treat a broader range of conditions in low-density rural areas than urban ones.17 Exploring all dermatologists’ referral patterns for OCPs is warranted.
A strong knowledge area revealed from this study was hormonal treatment of acne in women, a vital area because appropriate patient selection is key to treatment success.8 Weaker knowledge areas included OCP contraindications and differences in VTE risk between formulations containing drospirenone and those not containing drospirenone. Only half the sample identified CDC-defined absolute contraindications, suggesting an education target for dermatologists to ensure patient safety. In contrast, respondents were conservative about relative contraindications, with most identifying deep vein thrombosis or pulmonary embolism, remote breast cancer history, and light smoking at 36 years or older as absolute contraindications. These results could reflect weighing the risk of relative contraindications against the benefit in acne, resulting in appropriately more conservative management than overall guidelines suggest. If so, it may suggest that dermatologists are adapting overall guidelines appropriately for use of OCPs in skin conditions.
Nearly all respondents knew that OCPs are associated with an increased risk for VTE. Approximately half understood that DCOCPs are associated with a greater VTE risk than other OCPs, with no difference between frequent and infrequent prescribers. Comparing these results to the findings on OCP prescribing overall, some dermatologists’ risk-benefit calculation for VTE differs from other specialties because DCOCPs have superior efficacy in acne, whereas DCOCPs have similar contraceptive efficacy to other OCPs.18 The fact that more dermatologists believed VTE to be an absolute contraindication than hypertension suggests dermatologists have a heightened awareness of VTE risk but prescribe DCOCPs for acne despite it.
Most OCP prescribers felt very comfortable selecting good candidates for OCPs (55.5%) and counseling on treatment initiation (45.8%) and side effects (48.6%). Only 22.2%, by contrast, were very comfortable managing side effects. This finding likely reflects the notion that VTEs are not most appropriately managed by a dermatologist. Exploring if a greater comfort level in managing side effects would make dermatologists more likely to prescribe OCPs is worthwhile. Additionally, exploring why many dermatologists do not prescribe OCPs despite believing they are effective for acne is warranted.
Study limitations included the use of convenience sampling. Additionally, our study did not investigate dermatologists’ reasons for not prescribing OCPs.
Conclusion
This study demonstrates that dermatologists believe OCPs effectively treat acne in women and that most dermatologists prescribing OCPs do so for acne treatment. Academic practice setting was associated with higher odds of prescribing OCPs than a nonacademic setting, but the number of weekly acne patients did not impact the likelihood of prescribing OCPs, which suggests a treatment gap warranting education efforts for dermatologists in nonacademic settings seeing many acne patients. Our study also suggests that awareness of the increased risk for VTE associated with DCOCPs is not associated with lower likelihood of prescribing DCOCPs, suggesting dermatologists may find greater treatment efficacy to be worth the higher risk.
Acknowledgments
We are grateful to the Department of Dermatology at the Weill Cornell College of Medicine (New York, New York) for providing funding to complete this study. We also acknowledge Paul Christos, DrPH, MS (New York, New York), and Xuming Sun, MS (New York, New York), for their assistance with the survey design. We also are indebted to numerous dermatologic professional societies for allowing the survey to be distributed to their membership.
- Kim GK, Michaels BB. Post-adolescent acne in women: more common and more clinical considerations. J Drugs Dermatol. 2012;11:708-713.
- Arowojolu AO, Gallo MF, Lopez LM, et al. Combined oral contraceptive pills for treatment of acne. Cochrane Database Syst Rev. July 11, 2012:CD004425.
- Koo EB, Petersen TD, Kimball AB. Meta-analysis comparing efficacy of antibiotics versus oral contraceptives in acne vulgaris. J Am Acad Dermatol. 2014;71:450-459.
- Strauss JS, Krowchuk DP, Leyden JJ, et al; American Academy of Dermatology/American Academy of Dermatology Association. Guidelines of care for acne vulgaris management. J Am Acad Dermatol. 2007;56:651-663.
- Harper JC. Should dermatologists prescribe hormonal contraceptives for acne? Dermatol Ther. 2009;22:452-457.
- Landis ET, Levender MM, Davis SA, et al. Isotretinoin and oral contraceptive use in female acne patients varies by physician specialty: analysis of data from the National Ambulatory Medical Care Survey. J Dermatol Treat. 2012;23:272-277.
- Lam C, Zaenglein AL. Contraceptive use in acne. Clin Dermatol. 2014;32:502-515.
- Katsambas AD, Dessinioti C. Hormonal therapy for acne: why not as first line therapy? facts and controversies. Clin Dermatol. 2010;28:17-23.
- Dragoman MV. The combined oral contraceptive pill—recent developments, risks and benefits. Best Pract Res Clin Obstet Gynaecol. 2014;28:825-834.
- Thorneycroft IH, Gollnick H, Schellschmidt I. Superiority of a combined contraceptive containing drospirenone to a triphasic preparation containing norgestimate in acne treatment. Cutis. 2004;74:123-130.
- Mansour D, Verhoeven C, Sommer W, et al. Efficacy and tolerability of a monophasic combined oral contraceptive containing nomegestrol acetate and 17β-oestradiol in a 24/4 regimen, in comparison to an oral contraceptive containing ethinylestradiol and drospirenone in a 21/7 regimen. Eur J Contracept Reproduct Health Care. 2011;16:430-443.
- Wu CQ, Grandi SM, Filion KB, et al. Drospirenone-containing oral contraceptive pills and the risk of venous and arterial thrombosis: a systematic review. BJOG. 2013;120:801-810.
- Ziller M, Rashed AN, Ziller V, et al. The prescribing of contraceptives for adolescents in German gynecologic practices in 2007 and 2011: a retrospective database analysis. J Pediatr Adolesc Gynecol. 2013;26:261-264.
- Centers for Disease Control and Prevention. US medical eligibility criteria for contraceptive use, 2010. MMWR Recomm Rep. 2010;59(RR-4):1-86.
- United States Census Bureau. Census Regions and Divisions of the United States. New York, NY: United States Department of Commerce; 2010.
- Resident Population Data—Population Density, 1910 to 2010. U.S. Census Bureau; 2012. http ://www.census.gov/2010census/data/apportionment-dens-text.php. Accessed January 9, 2017.
- Reschovsky A, Zahner SJ. Forecasting the revenues of local public health departments in the shadows of the “Great Recession.” J Public Health Manag Pract. 2016;22:120-128.
- Klipping C, Duijkers I, Fortier MP, et al. Contraceptive efficacy and tolerability of ethinylestradiol 20 μg/drospirenone 3 mg in a flexible extended regimen: an open-label, multicentre, randomised, controlled study. J Fam Plann Reprod Health Care. 2012;38:73-83.
The incidence of acne in adult females is rising,1 and treatment with combined oral contraceptive pills (OCPs) is becoming an increasingly important therapy for women with acne. Prior reports have indicated that OCPs were as effective as systemic antibiotics in reducing inflammatory, noninflammatory, and total facial acne lesions after 6 months of treatment.2,3 The acne management guidelines of the American Academy of Dermatology confer OCPs a grade A recommendation based on consistent and good-quality patient-oriented evidence.4
The US Food and Drug Administration (FDA) has approved 3 OCPs for the treatment of acne in adult women: norgestimate–ethinyl estradiol in 1997, norethindrone acetate–ethinyl estradiol in 2001, and drospirenone–ethinyl estradiol in 2007.5 However, the use of these OCPs is poorly understood by many dermatologists. One study showed that dermatologists prescribed OCPs in only 2% of visits with female patients aged 12 to 55 years who presented for acne treatment, which is less often than obstetrician/gynecologists (36%) and internists (11%),6 perhaps due to perceived risks or unfamiliarity with OCP formulations and guidelines among dermatologists.7 Adverse effects of OCPs include venous thromboembolism (VTE), myocardial infarction, and hypertension,8 but they generally are well tolerated.9
Even less is known about dermatologists’ use of drospirenone-containing OCPs (DCOCPs), which contain the only FDA-approved progestin that blocks androgen receptors. In prior studies, treatment with DCOCPs was associated with greater reductions in total lesion count and investigator-graded acne severity compared to early-generation OCPs.10,11 However, DCOCPs have been associated with a greater risk for VTE (4.0–6.3 times higher than OCP nonuse; 1.0–3.3 times higher than levonorgestrel-containing OCPs),12 which may explain the decline in DCOCP prescriptions among gynecologists in Germany from 23.8% of OCP prescriptions in 2007 to 11.4% in 2011.13
In this study, we surveyed US dermatologists about their knowledge, comfort, and prescribing practices pertaining to the use of OCPs. We compare OCP-prescribing to nonprescribing dermatologists, and those frequently prescribing DCOCPs to those who infrequently prescribe DCOCPs.
Methods
Survey Design
We performed a cross-sectional survey study using convenience sampling. The instrument was designed based on primary literature on OCPs in acne treatment and questionnaires assessing the use of OCPs in other specialties. Topics included prescribing practices, contraindications for OCPs defined by the Centers for Disease Control and Prevention (CDC),14 VTE risk, patient selection for hormonal acne therapy, comfort with prescribing OCP therapy, and participant demographics.
Skip logic was employed (ie, subsequent questions depended on prior answers). A pilot study surveyed 9 board-certified dermatologists at our home institution (Weill Cornell Medical College, New York, New York).
Data Collection
Eligible participants were board-certified US dermatologists. Data were collected and managed using an electronic data capture tool through the Weill Cornell Medical College Clinical & Translational Science Center. Surveys were distributed electronically to dermatologic society members, university alumni networks, investigators’ professional contacts, and dermatologists whose contact information was purchased from an email marketing company. Chain-referral sampling (ie, participants’ recruitment among their colleagues) was used. Surveys were distributed at a regional dermatology meeting. Responses were collected from November 2014 to April 2015. This study was approved by the institutional review board.
Statistical Analysis
For the descriptive data, all responses including pilot study participants were analyzed regardless of survey completion and were summarized using frequency counts and percentages (N=130).
For the analysis of OCP prescription predictors, the sample included all respondents answering the demographic questions and indicating if they prescribe OCPs (N=116). One respondent was excluded for answering other for current practice setting. Demographic predictors of OCP prescription were physician characteristics, geographic region, practice location population density, practice attributes, time spent on medical versus pediatric dermatology, number of weekly acne patients, and percentage of total patients who are female. Medical school graduation year was a categorical variable and was categorized as prior to 1997 (when norgestimate–ethinyl estradiol was FDA approved for acne5) versus 1997 or later. Respondents’ practice states were analyzed according to US regions—Northeast, Midwest, South, West/Pacific—and population density (persons per square mile) using US Census Bureau data.15,16
Univariate logistic regressions modeling OCP prescribing probability were performed for each demographic variable; a multivariable logistic model was constructed including all variables significant at α=.20 from univariate modeling.
To compare frequent prescribers versus infrequent prescribers of DCOCPs, we included all respondents answering whether they frequently prescribe DCOCPs and whether they believed the risk for VTE associated with DCOCPs differed from other OCPs (n=68). A univariate logistic regression was performed to model the probability of responding “Yes, they pose a greater risk” versus any of the other 3 responses by whether or not the respondent frequently prescribed DCOCPs for acne, and an unadjusted odds ratio was obtained. All P values were 2-tailed with statistical significance evaluated at α=.05. Ninety-five percent confidence intervals were calculated to assess precision of obtained estimates. Analyses were performed using SAS software version 9.4.
Results
Demographics
Participant demographics as predictors of OCP prescription practices are described in Table 1.
Knowledge
Oral contraceptive pills were endorsed as effective in the treatment of acne in women by 95.4% (124/130) of respondents. Among prescribers of OCPs for acne, 94.2% (65/69) believed OCPs were associated with an increased risk for VTE, no respondents thought OCPs were associated with a decreased VTE risk, 2.9% (2/69) believed OCPs did not affect VTE risk, and 2.9% (2/69) were unsure.
Among prescribers of OCPs for acne, 46.4% (32/69) believed DCOCPs posed a greater VTE risk than other OCPs. Odds of this response did not differ with frequent DCOCP prescribers versus infrequent prescribers (odds ratio, 0.731 [95% confidence interval, 0.272-1.964]; P=.5342). Participant responses on VTE risk and DCOCPs are provided in Table 2.
Dermatologists prescribing OCPs for acne endorsed greater likelihood of doing so in cases of cyclical flares with menstrual cycle (94.2% [65/69]), acne unresponsive to conventional therapy (87.0% [60/69]), acne on the lower half of the face (78.3% [54/69]), diagnosis of polycystic ovary syndrome (PCOS)(76.8% [53/69]), clinical suspicion of PCOS (71.0% [49/69]), concomitant hirsutism (71.0% [49/69]), late- or adult-onset acne (66.7% [46/69]), laboratory evidence of hyperandrogenism (60.9% [42/69]), and concomitant androgenetic alopecia (49.3% [34/69]).
Among dermatologists who prescribed OCPs for acne, CDC-defined absolute contraindications identified correctly were blood pressure of 160/100 mm Hg (59.4% [41/69]) and history of migraine with focal neurologic symptoms (49.3% [34/69]). The CDC-defined relative contraindications identified correctly were history of deep vein thrombosis or pulmonary embolism (1.4% [1/69]), breast cancer history with 5 years of no disease (15.9% [11/69]), hyperlipidemia (42.0% [29/69]), and 36 years or older smoking fewer than 15 cigarettes per day (21.7% [15/69]).
Comfort
Dermatologist self-reported comfort levels in prescribing OCPs for acne are shown in Table 3.
Prescribing Practices
Among all respondents, acne medications prescribed often included oral antibiotics (76.9% [100/130]), isotretinoin (41.5% [54/130]), and spironolactone (40.8% [53/130]).
Overall, 55.4% (72/130) of respondents prescribed OCPs for the following uses: acne (95.8% [69/72]), concomitant treatment with teratogenic medication (48.6% [35/72]), PCOS (34.7% [25/72]), hirsutism (26.4% [19/72]), androgenetic alopecia (19.4% [14/72]), SAHA (seborrhea, acne, hirsutism, alopecia) syndrome (12.5% [9/72]), and HAIR-AN (hyperandrogenism, insulin resistance, acanthosis nigricans) syndrome (11.1% [8/72]). For teratogenic medications, dermatologists prescribing OCPs did so with isotretinoin (77.8% [56/72]), spironolactone (73.6% [53/72]), tetracycline antibiotics (37.5% [27/72]), and other (34.7% [25/72]).
Of dermatologists prescribing OCPs for acne, frequency included often (19% [13/69]), sometimes (45% [31/69]), and rarely (36% [25/69]). The most frequently prescribed OCPs included Ortho Tri-Cyclen (Janssen Pharmaceuticals, Inc)(80% [55/69]), Yaz (Bayer)(64% [44/69]), and Estrostep (Warner Chilcott)(19% [13/69]). Fill-in responses included Desogen (Merck & Co, Inc)(3/69 [4%]), Alesse (Wyeth Pharmaceuticals, Inc)(3/69 [4%]), Lutera (Watson Pharma, Inc)(1/69 [1%]), Loestrin (Warner Chilcott)(1/69 [1%]), and Yasmin (Bayer)(1/69 [1%]).
In univariate regressions, graduation from medical school in 1997 or later (P=.0416), academic practice setting (P=.0130), and low-density practice setting (P=.0034) were significant predictors of prescribing OCPs. In multivariable regression, only academic practice setting (P=.0295) and low-density practice setting (P=.0050) remained significant predictors. Demographic predictors are summarized in Table 1.
Comment
Our results suggest that most dermatologists (95.4%) believe OCPs effectively treat acne; however, only 54% of respondents reported prescribing them. Academic dermatologists were more likely to prescribe OCPs than nonacademic dermatologists, possibly indicating that academic dermatologists are more familiar with the literature on the efficacy and use of OCPs. Nearly half of respondents seeing 25 or more acne patients weekly did not prescribe OCPs, suggesting a notable practice gap. Dermatologists in less dense US regions were more likely to prescribe OCPs, perhaps because dermatologists may be more likely to prescribe OCPs than refer patients in health care access–limited areas, just as primary care providers treat a broader range of conditions in low-density rural areas than urban ones.17 Exploring all dermatologists’ referral patterns for OCPs is warranted.
A strong knowledge area revealed from this study was hormonal treatment of acne in women, a vital area because appropriate patient selection is key to treatment success.8 Weaker knowledge areas included OCP contraindications and differences in VTE risk between formulations containing drospirenone and those not containing drospirenone. Only half the sample identified CDC-defined absolute contraindications, suggesting an education target for dermatologists to ensure patient safety. In contrast, respondents were conservative about relative contraindications, with most identifying deep vein thrombosis or pulmonary embolism, remote breast cancer history, and light smoking at 36 years or older as absolute contraindications. These results could reflect weighing the risk of relative contraindications against the benefit in acne, resulting in appropriately more conservative management than overall guidelines suggest. If so, it may suggest that dermatologists are adapting overall guidelines appropriately for use of OCPs in skin conditions.
Nearly all respondents knew that OCPs are associated with an increased risk for VTE. Approximately half understood that DCOCPs are associated with a greater VTE risk than other OCPs, with no difference between frequent and infrequent prescribers. Comparing these results to the findings on OCP prescribing overall, some dermatologists’ risk-benefit calculation for VTE differs from other specialties because DCOCPs have superior efficacy in acne, whereas DCOCPs have similar contraceptive efficacy to other OCPs.18 The fact that more dermatologists believed VTE to be an absolute contraindication than hypertension suggests dermatologists have a heightened awareness of VTE risk but prescribe DCOCPs for acne despite it.
Most OCP prescribers felt very comfortable selecting good candidates for OCPs (55.5%) and counseling on treatment initiation (45.8%) and side effects (48.6%). Only 22.2%, by contrast, were very comfortable managing side effects. This finding likely reflects the notion that VTEs are not most appropriately managed by a dermatologist. Exploring if a greater comfort level in managing side effects would make dermatologists more likely to prescribe OCPs is worthwhile. Additionally, exploring why many dermatologists do not prescribe OCPs despite believing they are effective for acne is warranted.
Study limitations included the use of convenience sampling. Additionally, our study did not investigate dermatologists’ reasons for not prescribing OCPs.
Conclusion
This study demonstrates that dermatologists believe OCPs effectively treat acne in women and that most dermatologists prescribing OCPs do so for acne treatment. Academic practice setting was associated with higher odds of prescribing OCPs than a nonacademic setting, but the number of weekly acne patients did not impact the likelihood of prescribing OCPs, which suggests a treatment gap warranting education efforts for dermatologists in nonacademic settings seeing many acne patients. Our study also suggests that awareness of the increased risk for VTE associated with DCOCPs is not associated with lower likelihood of prescribing DCOCPs, suggesting dermatologists may find greater treatment efficacy to be worth the higher risk.
Acknowledgments
We are grateful to the Department of Dermatology at the Weill Cornell College of Medicine (New York, New York) for providing funding to complete this study. We also acknowledge Paul Christos, DrPH, MS (New York, New York), and Xuming Sun, MS (New York, New York), for their assistance with the survey design. We also are indebted to numerous dermatologic professional societies for allowing the survey to be distributed to their membership.
- Kim GK, Michaels BB. Post-adolescent acne in women: more common and more clinical considerations. J Drugs Dermatol. 2012;11:708-713.
- Arowojolu AO, Gallo MF, Lopez LM, et al. Combined oral contraceptive pills for treatment of acne. Cochrane Database Syst Rev. July 11, 2012:CD004425.
- Koo EB, Petersen TD, Kimball AB. Meta-analysis comparing efficacy of antibiotics versus oral contraceptives in acne vulgaris. J Am Acad Dermatol. 2014;71:450-459.
- Strauss JS, Krowchuk DP, Leyden JJ, et al; American Academy of Dermatology/American Academy of Dermatology Association. Guidelines of care for acne vulgaris management. J Am Acad Dermatol. 2007;56:651-663.
- Harper JC. Should dermatologists prescribe hormonal contraceptives for acne? Dermatol Ther. 2009;22:452-457.
- Landis ET, Levender MM, Davis SA, et al. Isotretinoin and oral contraceptive use in female acne patients varies by physician specialty: analysis of data from the National Ambulatory Medical Care Survey. J Dermatol Treat. 2012;23:272-277.
- Lam C, Zaenglein AL. Contraceptive use in acne. Clin Dermatol. 2014;32:502-515.
- Katsambas AD, Dessinioti C. Hormonal therapy for acne: why not as first line therapy? facts and controversies. Clin Dermatol. 2010;28:17-23.
- Dragoman MV. The combined oral contraceptive pill—recent developments, risks and benefits. Best Pract Res Clin Obstet Gynaecol. 2014;28:825-834.
- Thorneycroft IH, Gollnick H, Schellschmidt I. Superiority of a combined contraceptive containing drospirenone to a triphasic preparation containing norgestimate in acne treatment. Cutis. 2004;74:123-130.
- Mansour D, Verhoeven C, Sommer W, et al. Efficacy and tolerability of a monophasic combined oral contraceptive containing nomegestrol acetate and 17β-oestradiol in a 24/4 regimen, in comparison to an oral contraceptive containing ethinylestradiol and drospirenone in a 21/7 regimen. Eur J Contracept Reproduct Health Care. 2011;16:430-443.
- Wu CQ, Grandi SM, Filion KB, et al. Drospirenone-containing oral contraceptive pills and the risk of venous and arterial thrombosis: a systematic review. BJOG. 2013;120:801-810.
- Ziller M, Rashed AN, Ziller V, et al. The prescribing of contraceptives for adolescents in German gynecologic practices in 2007 and 2011: a retrospective database analysis. J Pediatr Adolesc Gynecol. 2013;26:261-264.
- Centers for Disease Control and Prevention. US medical eligibility criteria for contraceptive use, 2010. MMWR Recomm Rep. 2010;59(RR-4):1-86.
- United States Census Bureau. Census Regions and Divisions of the United States. New York, NY: United States Department of Commerce; 2010.
- Resident Population Data—Population Density, 1910 to 2010. U.S. Census Bureau; 2012. http ://www.census.gov/2010census/data/apportionment-dens-text.php. Accessed January 9, 2017.
- Reschovsky A, Zahner SJ. Forecasting the revenues of local public health departments in the shadows of the “Great Recession.” J Public Health Manag Pract. 2016;22:120-128.
- Klipping C, Duijkers I, Fortier MP, et al. Contraceptive efficacy and tolerability of ethinylestradiol 20 μg/drospirenone 3 mg in a flexible extended regimen: an open-label, multicentre, randomised, controlled study. J Fam Plann Reprod Health Care. 2012;38:73-83.
Practice Points
- In prior reports, oral contraceptive pills (OCPs) were found to be as effective as systemic antibiotics in reducing acne lesion counts at 6 months of treatment.
- Most dermatologists have prescribed OCPs and most believed they were an effective treatment for acne in women.

Misdiagnosed Crusted Scabies in an AIDS Patient Leads to Hyperinfestation
Case Report
A recently incarcerated 34-year-old man with an 11-year history of multidrug-resistant human immunodeficiency virus/AIDS (CD4 count, 121 cells/mm3; viral load, 49,625 particles/mm3 one week prior to presentation) was admitted to the hospital for an intensely pruritic, hyperkeratotic, scaly rash involving the entire body. The rash first appeared on the feet approximately 1 year prior to admission. At that time the patient was given oral fluconazole and a steroid cream with near resolution of the rash. He was then transferred multiple times to different units with subsequent discontinuation of the medications. The rash flared and progressed to involve the knees. He was restarted on the fluconazole and steroid cream and placed in isolation by medical personnel at the prison 6 months prior to presentation. The rash continued to spread, and he was given a working diagnosis of plaque-type psoriasis by several providers after several months of nonresponse to treatment. Additional attempts at treatment at outside facilities included oral fluconazole, trimethoprim-sulfamethoxazole, and other antibiotics. He was referred to dermatology at our institution but missed the appointment and was admitted to the hospital before the appointment could be rescheduled.
On admission to the hospital, he denied similar lesions in close contacts. On review of systems he had subjective fevers and chills, decreased appetite, nausea without vomiting, dysphagia to solids, epigastric pain, and 70-lb weight loss over the last 6 months. Facial involvement of the rash impaired the ability to open the mouth, speak, and eat. He had no known drug allergies. His only medications at the time of admission were nortriptyline, trimethoprim-sulfamethoxazole, and oral combination elvitegravir-cobicistat-emtricitabine-tenofovir for hu-man immunodeficiency virus treatment.
On physical examination he was cachectic, shivering, and foul smelling. He was afebrile, slightly tachycardic (112 beats per minute), and hypertensive (144/83 mm Hg) with a respiratory rate of 18 breaths per minute. His height was 1.83 m (6 ft) and weight was 48.5 kg (107 lb) with a body mass index of 14.5. Extensive erythematous, hyperkeratotic, crusted, and fissured plaques covered the entire body including the face, hands, and feet. The tongue was covered with bilateral white-colored plaques, and he had patches of alopecia, excoriations, and scales on the scalp. The elbows were fixed in a flexed position and he had decreased range of motion in the wrists and fingers due to the severe hyperkeratosis (Figure 1A). Hyperkeratosis also was prominent on the knees and feet with associated burrows (Figure 2A). He had foot drop on the left.
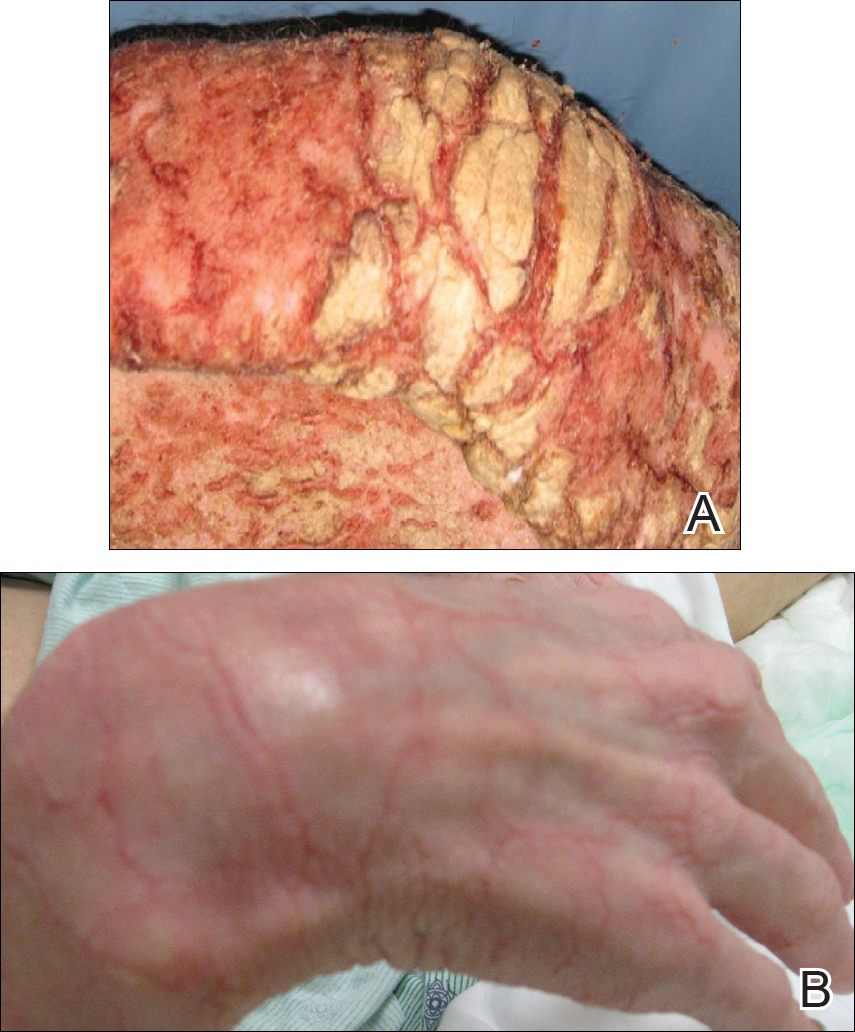
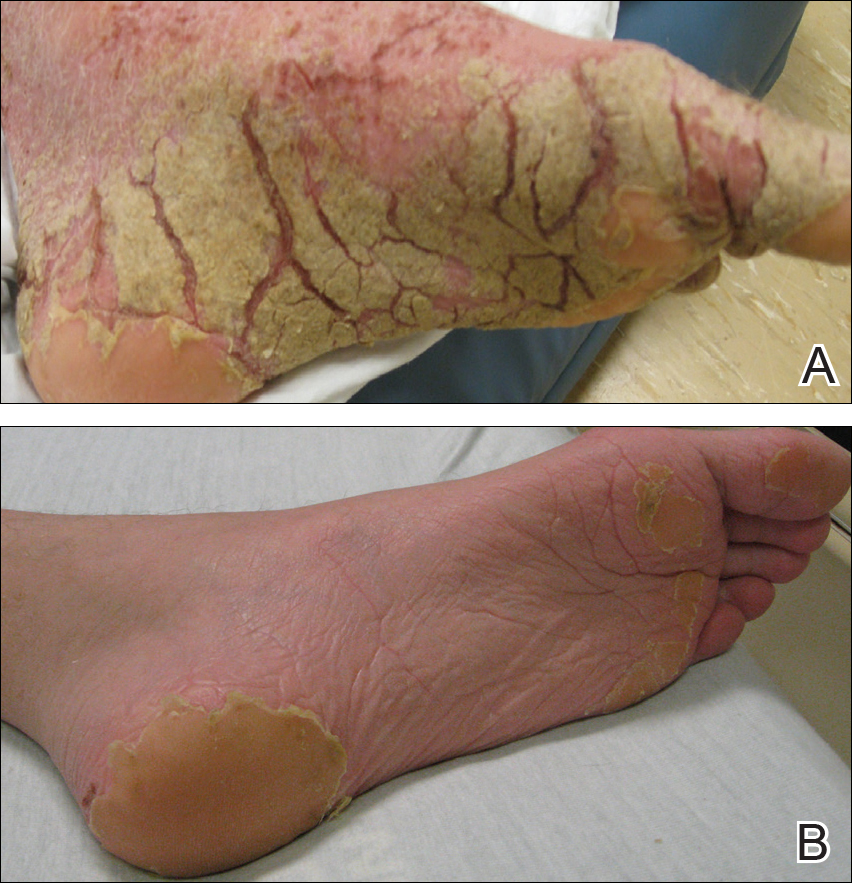
The differential diagnosis included a drug eruption; fungal or parasite infestation, such as crusted scabies; psoriasis; or cutaneous lymphoma. Laboratory studies were difficult to obtain, as there were limited areas suitable for vascular access. Blood work showed leukocytosis (18.9×10⁹ cells/L [reference range, 4.8–10.8×10⁹ cells/L) with 13.3% eosinophils (reference range, 1%–6%). This eosinophilia narrowed the likely diagnoses to a drug eruption or parasite infection.
The dermatology service was consulted. A mineral oil preparation was performed and showed numerous mites and feces consistent with a diagnosis of crusted scabies (Figure 3). The patient was started on a regimen of permethrin cream 5% applied to the entire body, except the face, which was left on overnight and washed off. This regimen was repeated daily for 1 week, then twice weekly until the rash resolved after a total of 3 weeks. Due to the severity of his condition, immunocompromised status, and concern for superinfection, oral ivermectin 200 μg/kg once daily was added on days 1, 2, 8, 9, 15, 22, and 29.1

Our patient’s hospital course was further complicated by symptomatic hypoglycemia, altered mental status, and superimposed methicillin-resistant Staphylococcus aureus bacteremia, as well as Pseudomonas aeruginosa bacteremia, pneumonia, and coffee ground emesis. He was transferred to the intensive care unit but fortunately did not require intubation. His overall condition, mental status, and rash gradually improved. Three weeks after admission he only had a few residual lesions on the feet with clearing elsewhere (Figures 1B and 2B). He was discharged with a skin moisturizer and was referred for physical and occupational therapy. On follow-up clinic visits at 3 and 6 months, he had recovered well with general improvement in his condition.
Comment
Classic (noncrusted) scabies is common worldwide, with an estimated 300 million cases per year. It is caused by the mite Sarcoptes scabiei var hominis, and transmission occurs by direct skin-to-skin contact or less commonly by fomites (eg, linens, bedsheets) and therefore is common in overcrowded environments.2 Crusted scabies is a severe, highly contagious form of the disease in which the host’s immune system is overwhelmed and unable to defend against mites on the skin, resulting in hyperinfestation of the host. The mites use secretions to dissolve the epidermis and burrow through the skin, leaving feces in their tracks.3 Interestingly, the native aboriginal populations of Australia have a high incidence of crusted scabies even though they show no signs of immunosuppression. The reason remains unclear but may be due to a skewed T-cell response.4 Various mechanisms have been described for the symptoms of scabies, and it is believed that there is a hypersensitivity reaction to the mites and the feces. Increased IL-17 production by skin T cells may be responsible.5
Clinical Features
Crusted scabies is characterized by severe hyperkeratosis and plaques with desquamation and erythroderma that is worse in the acral regions and large joints, such as the elbows and the knees, as seen in our patient. Because of the deep burrows, patients are predisposed to secondary superinfections by bacteria. In our case, the patient had methicillin-resistant S aureus bacteremia, which persisted for some time despite treatment with intravenous antibiotics.
Diagnosis
Because scabies can imitate different conditions, it can be difficult to diagnose. Misdiagnosis of psoriasis in our patient led to ineffective treatment and subsequent worsening of his condition. Burrows are pathognomonic for scabies, though in severe cases, the burrows may be concealed by extreme hyperkeratosis. Diagnosis is confirmed by mineral oil preparation from the plaques showing numerous scabies mites and feces.
Treatment
It is important to control the spread of scabies, as it is highly contagious, and if the living environment is not properly cleaned, the patient can be reinfected. All clothing, bedsheets, and linens in the household must be washed in hot water and dried in a hot dryer, and nonwashable items should be placed in a closed plastic bag for 72 hours. All contacts also should be treated with 1 application of permethrin cream to the entire body including the head and neck, left on overnight, and washed off with warm water.1 The washing also helps remove some of the skin crusts. Patients should be educated that pruritus and burning may initially worsen with permethrin treatment due to the body’s reaction to the parasite.1,2 In addition, keratolytic agents such as topical urea or salicylic acid can be used as an adjuvant therapy to improve the efficacy of permethrin.
Permethrin is effective against both mites and eggs and works by inhibiting sodium channels, resulting in nerve signal conduction block and subsequent paralysis. Ivermectin is thought to act on glutamate-gated chloride channels, which are present in invertebrates but absent in vertebrates, causing hyperpolarization and paralysis of the adult mite.1,6
Conclusion
Crusted scabies is a highly contagious and intensely pruritic condition. Scabies can mimic other conditions, such as psoriasis or severe dermatitis, so it is important to keep this diagnosis in mind, especially in immunocompromised patients or populations in overcrowded areas (eg, those who are incarcerated or in nursing homes). Treatment consists of isolating the patient, starting topical permethrin and oral ivermectin (in severe cases), washing all linens, and prophylactically treating contacts. A delay in diagnosis can lead to severe debilitating disease, as seen in the extreme case of our patient. However, our patient made a full recovery with appropriate treatment and care.
- Currie BJ, McCarthy JS. Permethrin and ivermectin for scabies. N Engl J Med. 2010;362:717-725.
- World Health Organization. Water-related diseases: scabies. http://www.who.int/water_sanitation_health/diseases-risks/diseases/scabies/en/. Accessed February 23, 2017.
- Chosidow O. Scabies and pediculosis. Lancet. 2000;355:819-826.
- Roberts LJ, Huffam SE, Walton SF, et al. Crusted scabies: clinical and immunological findings in seventy-eight patients and a review of the literature. J Infect. 2005;50:375-381.
- Liu X, Walton SF, Murray HC, et al. Crusted scabies is associated with increased IL-17 secretion by skin T cells. Parasite Immunol. 2014;36:594-604.
- Geary TG. Ivermectin 20 years on: maturation of a wonder drug [published online August 26, 2005]. Trends Parasitol. 2005;21:530-532.
Case Report
A recently incarcerated 34-year-old man with an 11-year history of multidrug-resistant human immunodeficiency virus/AIDS (CD4 count, 121 cells/mm3; viral load, 49,625 particles/mm3 one week prior to presentation) was admitted to the hospital for an intensely pruritic, hyperkeratotic, scaly rash involving the entire body. The rash first appeared on the feet approximately 1 year prior to admission. At that time the patient was given oral fluconazole and a steroid cream with near resolution of the rash. He was then transferred multiple times to different units with subsequent discontinuation of the medications. The rash flared and progressed to involve the knees. He was restarted on the fluconazole and steroid cream and placed in isolation by medical personnel at the prison 6 months prior to presentation. The rash continued to spread, and he was given a working diagnosis of plaque-type psoriasis by several providers after several months of nonresponse to treatment. Additional attempts at treatment at outside facilities included oral fluconazole, trimethoprim-sulfamethoxazole, and other antibiotics. He was referred to dermatology at our institution but missed the appointment and was admitted to the hospital before the appointment could be rescheduled.
On admission to the hospital, he denied similar lesions in close contacts. On review of systems he had subjective fevers and chills, decreased appetite, nausea without vomiting, dysphagia to solids, epigastric pain, and 70-lb weight loss over the last 6 months. Facial involvement of the rash impaired the ability to open the mouth, speak, and eat. He had no known drug allergies. His only medications at the time of admission were nortriptyline, trimethoprim-sulfamethoxazole, and oral combination elvitegravir-cobicistat-emtricitabine-tenofovir for hu-man immunodeficiency virus treatment.
On physical examination he was cachectic, shivering, and foul smelling. He was afebrile, slightly tachycardic (112 beats per minute), and hypertensive (144/83 mm Hg) with a respiratory rate of 18 breaths per minute. His height was 1.83 m (6 ft) and weight was 48.5 kg (107 lb) with a body mass index of 14.5. Extensive erythematous, hyperkeratotic, crusted, and fissured plaques covered the entire body including the face, hands, and feet. The tongue was covered with bilateral white-colored plaques, and he had patches of alopecia, excoriations, and scales on the scalp. The elbows were fixed in a flexed position and he had decreased range of motion in the wrists and fingers due to the severe hyperkeratosis (Figure 1A). Hyperkeratosis also was prominent on the knees and feet with associated burrows (Figure 2A). He had foot drop on the left.
The differential diagnosis included a drug eruption; fungal or parasite infestation, such as crusted scabies; psoriasis; or cutaneous lymphoma. Laboratory studies were difficult to obtain, as there were limited areas suitable for vascular access. Blood work showed leukocytosis (18.9×10⁹ cells/L [reference range, 4.8–10.8×10⁹ cells/L) with 13.3% eosinophils (reference range, 1%–6%). This eosinophilia narrowed the likely diagnoses to a drug eruption or parasite infection.
The dermatology service was consulted. A mineral oil preparation was performed and showed numerous mites and feces consistent with a diagnosis of crusted scabies (Figure 3). The patient was started on a regimen of permethrin cream 5% applied to the entire body, except the face, which was left on overnight and washed off. This regimen was repeated daily for 1 week, then twice weekly until the rash resolved after a total of 3 weeks. Due to the severity of his condition, immunocompromised status, and concern for superinfection, oral ivermectin 200 μg/kg once daily was added on days 1, 2, 8, 9, 15, 22, and 29.1
Our patient’s hospital course was further complicated by symptomatic hypoglycemia, altered mental status, and superimposed methicillin-resistant Staphylococcus aureus bacteremia, as well as Pseudomonas aeruginosa bacteremia, pneumonia, and coffee ground emesis. He was transferred to the intensive care unit but fortunately did not require intubation. His overall condition, mental status, and rash gradually improved. Three weeks after admission he only had a few residual lesions on the feet with clearing elsewhere (Figures 1B and 2B). He was discharged with a skin moisturizer and was referred for physical and occupational therapy. On follow-up clinic visits at 3 and 6 months, he had recovered well with general improvement in his condition.
Comment
Classic (noncrusted) scabies is common worldwide, with an estimated 300 million cases per year. It is caused by the mite Sarcoptes scabiei var hominis, and transmission occurs by direct skin-to-skin contact or less commonly by fomites (eg, linens, bedsheets) and therefore is common in overcrowded environments.2 Crusted scabies is a severe, highly contagious form of the disease in which the host’s immune system is overwhelmed and unable to defend against mites on the skin, resulting in hyperinfestation of the host. The mites use secretions to dissolve the epidermis and burrow through the skin, leaving feces in their tracks.3 Interestingly, the native aboriginal populations of Australia have a high incidence of crusted scabies even though they show no signs of immunosuppression. The reason remains unclear but may be due to a skewed T-cell response.4 Various mechanisms have been described for the symptoms of scabies, and it is believed that there is a hypersensitivity reaction to the mites and the feces. Increased IL-17 production by skin T cells may be responsible.5
Clinical Features
Crusted scabies is characterized by severe hyperkeratosis and plaques with desquamation and erythroderma that is worse in the acral regions and large joints, such as the elbows and the knees, as seen in our patient. Because of the deep burrows, patients are predisposed to secondary superinfections by bacteria. In our case, the patient had methicillin-resistant S aureus bacteremia, which persisted for some time despite treatment with intravenous antibiotics.
Diagnosis
Because scabies can imitate different conditions, it can be difficult to diagnose. Misdiagnosis of psoriasis in our patient led to ineffective treatment and subsequent worsening of his condition. Burrows are pathognomonic for scabies, though in severe cases, the burrows may be concealed by extreme hyperkeratosis. Diagnosis is confirmed by mineral oil preparation from the plaques showing numerous scabies mites and feces.
Treatment
It is important to control the spread of scabies, as it is highly contagious, and if the living environment is not properly cleaned, the patient can be reinfected. All clothing, bedsheets, and linens in the household must be washed in hot water and dried in a hot dryer, and nonwashable items should be placed in a closed plastic bag for 72 hours. All contacts also should be treated with 1 application of permethrin cream to the entire body including the head and neck, left on overnight, and washed off with warm water.1 The washing also helps remove some of the skin crusts. Patients should be educated that pruritus and burning may initially worsen with permethrin treatment due to the body’s reaction to the parasite.1,2 In addition, keratolytic agents such as topical urea or salicylic acid can be used as an adjuvant therapy to improve the efficacy of permethrin.
Permethrin is effective against both mites and eggs and works by inhibiting sodium channels, resulting in nerve signal conduction block and subsequent paralysis. Ivermectin is thought to act on glutamate-gated chloride channels, which are present in invertebrates but absent in vertebrates, causing hyperpolarization and paralysis of the adult mite.1,6
Conclusion
Crusted scabies is a highly contagious and intensely pruritic condition. Scabies can mimic other conditions, such as psoriasis or severe dermatitis, so it is important to keep this diagnosis in mind, especially in immunocompromised patients or populations in overcrowded areas (eg, those who are incarcerated or in nursing homes). Treatment consists of isolating the patient, starting topical permethrin and oral ivermectin (in severe cases), washing all linens, and prophylactically treating contacts. A delay in diagnosis can lead to severe debilitating disease, as seen in the extreme case of our patient. However, our patient made a full recovery with appropriate treatment and care.
- Currie BJ, McCarthy JS. Permethrin and ivermectin for scabies. N Engl J Med. 2010;362:717-725.
- World Health Organization. Water-related diseases: scabies. http://www.who.int/water_sanitation_health/diseases-risks/diseases/scabies/en/. Accessed February 23, 2017.
- Chosidow O. Scabies and pediculosis. Lancet. 2000;355:819-826.
- Roberts LJ, Huffam SE, Walton SF, et al. Crusted scabies: clinical and immunological findings in seventy-eight patients and a review of the literature. J Infect. 2005;50:375-381.
- Liu X, Walton SF, Murray HC, et al. Crusted scabies is associated with increased IL-17 secretion by skin T cells. Parasite Immunol. 2014;36:594-604.
- Geary TG. Ivermectin 20 years on: maturation of a wonder drug [published online August 26, 2005]. Trends Parasitol. 2005;21:530-532.
Practice Points
- Keep scabies in mind, especially in immunocompromised patients or populations in overcrowded areas.
- Treatment consists of isolating the patient, starting topical permethrin and oral ivermectin (in severe cases), washing all linens, and prophylactically treating contacts.
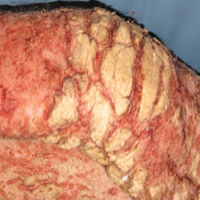
Hidradenitis Suppurativa Scoring Systems: Can We Choose Just One?
Interest in hidradenitis suppurativa (HS) has exploded in the last few years. A PubMed search of articles indexed for MEDLINE using the MeSH term hidradenitis suppurativa yielded more than 900 articles on HS since 1947, with a sharp increase in publications over the last few years and 119 articles published in 2015 alone. In addition to publications, we recently saw adalimumab become the first and only US Food and Drug Administration–approved treatment of moderate to severe HS.
With new treatment options and enthusiasm for HS, further attention needs to be paid to the scoring systems or outcome measures that clinicians use to grade HS severity and disease. Utilization of validated outcome measures allows for comparability between treatment effects, which is essential for clinical trials, meta-analyses, and monitoring of treatment response in daily clinical practice. Designing a scoring scale for any dermatologic disease is challenging; however, as we move forward with value-based reimbursement models, we likely will encounter quality reporting guidelines that mandate providers demonstrate the positive impact of treatment. Thus, scoring systems for HS, particularly ones that accurately assess this impact of treatment, are essential. For psoriasis, the physician global assessment (PGA) and psoriasis area and severity index are standard outcome measures of disease severity in clinical trials. The PGA also can be used in a clinical setting to longitudinally track patient treatment outcomes.1 Both the psoriasis area and severity index and PGA were cited as acceptable scoring tools for Medicare’s Physician Quality Reporting System quality metrics reporting (Measure #410: Psoriasis: Clinical Response to Oral Systemic or Biologic Medications). Unfortunately, no such outcome measures consensus currently exists for scoring systems in HS.
Many scoring systems have been proposed for HS. The most well known is the Hurley staging system. Developed in 1989 for surgical approaches, it is a straightforward tool to categorize disease severity but does not emphasize the inflammatory component of HS. Recently, a refined Hurley stage classification system was proposed. This 3-step algorithm expanded the Hurley stage classification to incorporate disease extensiveness, degree of inflammation, and presence of sinus tracts.2 The modified Sartorius score (also known as the modified HS score) is a more detailed scoring system for assessing disease activity that requires measurements and precise counting of lesions.3 The HS-PGA is an ordinal scale specific to HS that categorizes patients into clear, minimal, mild, moderate, severe, or very severe disease, and it was used successfully in a phase 2 interventional clinical trial.4 The HS clinical response (HiSCR) score is an HS-specific, binary scoring system for patients with 3 or more abscesses or inflammatory nodules. It was engineered using raw data and outcomes from a large clinical trial, and subsequently was employed as the primary end point in 2 randomized controlled trials.5,6 It is the only HS scoring system to undergo an extensive validation process of both physician- and patient-reported measures for assessment of therapeutic response in controlling the inflammatory manifestations of HS.
Designing a scoring system for clinical trials can be complicated. Sample sizes are dependent on the delta, or change, in efficacy or variation in response, and the design of the score will affect how easy it is to detect a statistically meaningful difference. These choices are a critical part of the design of small studies, particularly if obtaining enough statistical power can be challenging. Additionally, it is easier to detect change in more homogenous populations where we expect a more consistent response. Hidradenitis suppurativa is not a particularly homogenous disease, which furthers the risk of designing a trial that cannot detect important differences. The PGA often is required by the US Food and Drug Administration and has the major advantage that it is easy to understand, but the categories can sometimes be too broad to detect change easily, and more granular data can provide the basis for more in-depth analyses. An ideal outcome measure is a simplified scoring system that assesses disease severity and responsiveness to treatment while accurately serving as a surrogate for patient-reported outcomes, such as the dermatology life quality index, visual analog scale for HS skin pain, the work productivity and activity impairment questionnaire (specific health problem), or the patient global assessment. Validation processes for outcome measures, such as the one that HiSCR underwent, are essential to ensure that the proposed scoring system has clinical meaningfulness to both the physician and patient.
A 2016 Cochrane review of interventions for HS included 12 randomized controlled trials that employed a total of 30 different outcome measures instruments. Because use of multiple scoring systems makes it difficult to compare analyses of treatment, the authors concluded that there was a need for improved validation of HS outcome measures for future clinical trials.7 Schmitt et al8 recognized that atopic dermatitis also was in a similar predicament; they noted that more than 20 outcome measures were employed to assess disease severity in clinical trials. The authors called this situation “a significant threat to evidence-based health care” and outlined the Harmonizing Outcome Measures for Eczema (HOME) research initiative’s methodology for creation of core outcome sets for any dermatologic disease. Their consensus process involved first identifying what to measure, termed outcome domains, followed by developing how to measure these domains through outcome measures instruments, which would be assessed for validity, reliability, sensitivity to change, and feasibility.8
Using the framework set forth by the HOME initiative and data from the 2016 Cochrane review,7 a recent review of all outcome measures instruments currently employed in HS found that 90% (27/30) were not validated.9 Even those that were validated still could not be fully recommended by the authors. The authors identified 10 potential outcome domains for measurement, including quality of life, pain, lesion count, PGA, patient global self-assessment, recurrence rate, overall satisfaction with treatment, impairment of function, cosmesis, and duration of recovery. They recommended a further consensus process to better define these outcomes.9
Measuring all of these variables seems daunting, but as the speed of HS research rapidly progresses, we would greatly benefit from employing a standard validated scoring system that captures both disease severity and activity. Several groups are working to improve our current tools, but we will need to move quickly to a common approach so we can better compare treatment effects and build an evidence base for treatment decisions. For now, the HiSCR is the most validated clinical trials instrument, but it may not be ideal for the clinical setting. In our practice, we grade all patients each visit with Hurley staging, the validated HS-PGA scoring system to track improvement in inflammatory lesions, and a 10-point pain scale to monitor disease activity and severity. We have found these tools to be quick and effective for measuring treatment response and would recommend employment of these scoring systems as a standard measure in clinical practice until further consensus is reached.
- Pascoe VL, Enamandram M, Corey KC, et al. Using the Physician Global Assessment in a clinical setting to measure and track patient outcomes. JAMA Dermatol. 2015;151:375-381.
- Horváth B, Janse IC, Blok JL, et al. Hurley staging refined: a proposal by the Dutch Hidradenitis Suppurativa Expert Group [published online August 18, 2016]. Acta Derm Venereol. doi:10.2340/00015555-2513.
- Revuz J. Modifications to the Sartorius score and instructions for evaluating the severity of suppurative hidradenitis [in French]. Ann Dermatol Venereol. 2007;134:173-174.
- Kimball AB, Kerdel F, Adams D, et al. Adalimumab for the treatment of moderate to severe hidradenitis suppurativa: a parallel randomized trial. Ann Intern Med. 2012;157:846-855.
- Tzanetakou V, Kanni T, Giatrakou S, et al. Safety and efficacy of anakinra in severe hidradenitis suppurativa: a randomized clinical trial. JAMA Dermatol. 2016;152:52-59.
- Kimball AB, Sobell JM, Zouboulis CC, et al. HiSCR (hidradenitis suppurativa clinical response): a novel clinical endpoint to evaluate therapeutic outcomes in patients with hidradenitis suppurativa from the placebo-controlled portion of a phase 2 adalimumab study [published online July 22, 2015]. J Eur Acad Dermatol Venereol. 2016;30:989-994.
- Ingram JR, Woo PN, Chua SL, et al. Interventions for hidradenitis suppurativa: a Cochrane systematic review incorporating GRADE assessment of evidence quality [published online March 30, 2016]. Br J Dermatol. 2016;174:970-978.
- Schmitt J, Apfelbacher C, Spuls PI, et al. The Harmonizing Outcome Measures for Eczema (HOME) roadmap: a methodological framework to develop core sets of outcome measurements in dermatology [published online September 4, 2014]. J Invest Dermatol. 2015;135:24-30.
- Ingram JR, Hadjieconomou S, Piguet V. Development of core outcome sets in hidradenitis suppurativa: systematic review of outcome measure instruments to inform the process [published online May 2, 2016]. Br J Dermatol. 2016;175:263-272.
Interest in hidradenitis suppurativa (HS) has exploded in the last few years. A PubMed search of articles indexed for MEDLINE using the MeSH term hidradenitis suppurativa yielded more than 900 articles on HS since 1947, with a sharp increase in publications over the last few years and 119 articles published in 2015 alone. In addition to publications, we recently saw adalimumab become the first and only US Food and Drug Administration–approved treatment of moderate to severe HS.
With new treatment options and enthusiasm for HS, further attention needs to be paid to the scoring systems or outcome measures that clinicians use to grade HS severity and disease. Utilization of validated outcome measures allows for comparability between treatment effects, which is essential for clinical trials, meta-analyses, and monitoring of treatment response in daily clinical practice. Designing a scoring scale for any dermatologic disease is challenging; however, as we move forward with value-based reimbursement models, we likely will encounter quality reporting guidelines that mandate providers demonstrate the positive impact of treatment. Thus, scoring systems for HS, particularly ones that accurately assess this impact of treatment, are essential. For psoriasis, the physician global assessment (PGA) and psoriasis area and severity index are standard outcome measures of disease severity in clinical trials. The PGA also can be used in a clinical setting to longitudinally track patient treatment outcomes.1 Both the psoriasis area and severity index and PGA were cited as acceptable scoring tools for Medicare’s Physician Quality Reporting System quality metrics reporting (Measure #410: Psoriasis: Clinical Response to Oral Systemic or Biologic Medications). Unfortunately, no such outcome measures consensus currently exists for scoring systems in HS.
Many scoring systems have been proposed for HS. The most well known is the Hurley staging system. Developed in 1989 for surgical approaches, it is a straightforward tool to categorize disease severity but does not emphasize the inflammatory component of HS. Recently, a refined Hurley stage classification system was proposed. This 3-step algorithm expanded the Hurley stage classification to incorporate disease extensiveness, degree of inflammation, and presence of sinus tracts.2 The modified Sartorius score (also known as the modified HS score) is a more detailed scoring system for assessing disease activity that requires measurements and precise counting of lesions.3 The HS-PGA is an ordinal scale specific to HS that categorizes patients into clear, minimal, mild, moderate, severe, or very severe disease, and it was used successfully in a phase 2 interventional clinical trial.4 The HS clinical response (HiSCR) score is an HS-specific, binary scoring system for patients with 3 or more abscesses or inflammatory nodules. It was engineered using raw data and outcomes from a large clinical trial, and subsequently was employed as the primary end point in 2 randomized controlled trials.5,6 It is the only HS scoring system to undergo an extensive validation process of both physician- and patient-reported measures for assessment of therapeutic response in controlling the inflammatory manifestations of HS.
Designing a scoring system for clinical trials can be complicated. Sample sizes are dependent on the delta, or change, in efficacy or variation in response, and the design of the score will affect how easy it is to detect a statistically meaningful difference. These choices are a critical part of the design of small studies, particularly if obtaining enough statistical power can be challenging. Additionally, it is easier to detect change in more homogenous populations where we expect a more consistent response. Hidradenitis suppurativa is not a particularly homogenous disease, which furthers the risk of designing a trial that cannot detect important differences. The PGA often is required by the US Food and Drug Administration and has the major advantage that it is easy to understand, but the categories can sometimes be too broad to detect change easily, and more granular data can provide the basis for more in-depth analyses. An ideal outcome measure is a simplified scoring system that assesses disease severity and responsiveness to treatment while accurately serving as a surrogate for patient-reported outcomes, such as the dermatology life quality index, visual analog scale for HS skin pain, the work productivity and activity impairment questionnaire (specific health problem), or the patient global assessment. Validation processes for outcome measures, such as the one that HiSCR underwent, are essential to ensure that the proposed scoring system has clinical meaningfulness to both the physician and patient.
A 2016 Cochrane review of interventions for HS included 12 randomized controlled trials that employed a total of 30 different outcome measures instruments. Because use of multiple scoring systems makes it difficult to compare analyses of treatment, the authors concluded that there was a need for improved validation of HS outcome measures for future clinical trials.7 Schmitt et al8 recognized that atopic dermatitis also was in a similar predicament; they noted that more than 20 outcome measures were employed to assess disease severity in clinical trials. The authors called this situation “a significant threat to evidence-based health care” and outlined the Harmonizing Outcome Measures for Eczema (HOME) research initiative’s methodology for creation of core outcome sets for any dermatologic disease. Their consensus process involved first identifying what to measure, termed outcome domains, followed by developing how to measure these domains through outcome measures instruments, which would be assessed for validity, reliability, sensitivity to change, and feasibility.8
Using the framework set forth by the HOME initiative and data from the 2016 Cochrane review,7 a recent review of all outcome measures instruments currently employed in HS found that 90% (27/30) were not validated.9 Even those that were validated still could not be fully recommended by the authors. The authors identified 10 potential outcome domains for measurement, including quality of life, pain, lesion count, PGA, patient global self-assessment, recurrence rate, overall satisfaction with treatment, impairment of function, cosmesis, and duration of recovery. They recommended a further consensus process to better define these outcomes.9
Measuring all of these variables seems daunting, but as the speed of HS research rapidly progresses, we would greatly benefit from employing a standard validated scoring system that captures both disease severity and activity. Several groups are working to improve our current tools, but we will need to move quickly to a common approach so we can better compare treatment effects and build an evidence base for treatment decisions. For now, the HiSCR is the most validated clinical trials instrument, but it may not be ideal for the clinical setting. In our practice, we grade all patients each visit with Hurley staging, the validated HS-PGA scoring system to track improvement in inflammatory lesions, and a 10-point pain scale to monitor disease activity and severity. We have found these tools to be quick and effective for measuring treatment response and would recommend employment of these scoring systems as a standard measure in clinical practice until further consensus is reached.
- Pascoe VL, Enamandram M, Corey KC, et al. Using the Physician Global Assessment in a clinical setting to measure and track patient outcomes. JAMA Dermatol. 2015;151:375-381.
- Horváth B, Janse IC, Blok JL, et al. Hurley staging refined: a proposal by the Dutch Hidradenitis Suppurativa Expert Group [published online August 18, 2016]. Acta Derm Venereol. doi:10.2340/00015555-2513.
- Revuz J. Modifications to the Sartorius score and instructions for evaluating the severity of suppurative hidradenitis [in French]. Ann Dermatol Venereol. 2007;134:173-174.
- Kimball AB, Kerdel F, Adams D, et al. Adalimumab for the treatment of moderate to severe hidradenitis suppurativa: a parallel randomized trial. Ann Intern Med. 2012;157:846-855.
- Tzanetakou V, Kanni T, Giatrakou S, et al. Safety and efficacy of anakinra in severe hidradenitis suppurativa: a randomized clinical trial. JAMA Dermatol. 2016;152:52-59.
- Kimball AB, Sobell JM, Zouboulis CC, et al. HiSCR (hidradenitis suppurativa clinical response): a novel clinical endpoint to evaluate therapeutic outcomes in patients with hidradenitis suppurativa from the placebo-controlled portion of a phase 2 adalimumab study [published online July 22, 2015]. J Eur Acad Dermatol Venereol. 2016;30:989-994.
- Ingram JR, Woo PN, Chua SL, et al. Interventions for hidradenitis suppurativa: a Cochrane systematic review incorporating GRADE assessment of evidence quality [published online March 30, 2016]. Br J Dermatol. 2016;174:970-978.
- Schmitt J, Apfelbacher C, Spuls PI, et al. The Harmonizing Outcome Measures for Eczema (HOME) roadmap: a methodological framework to develop core sets of outcome measurements in dermatology [published online September 4, 2014]. J Invest Dermatol. 2015;135:24-30.
- Ingram JR, Hadjieconomou S, Piguet V. Development of core outcome sets in hidradenitis suppurativa: systematic review of outcome measure instruments to inform the process [published online May 2, 2016]. Br J Dermatol. 2016;175:263-272.
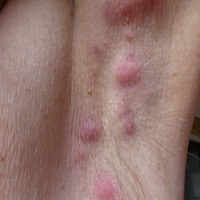
Imatinib Mesylate–Induced Lichenoid Drug Eruption
Imatinib mesylate is a tyrosine kinase inhibitor initially approved by the US Food and Drug Administration in 2001 for chronic myeloid leukemia (CML). The indications for imatinib have expanded since its initial approval. It is increasingly important that dermatologists recognize adverse cutaneous manifestations associated with imatinib and are aware of their management and outcomes to avoid unnecessarily discontinuing a potentially lifesaving medication.
Adverse cutaneous manifestations in response to imatinib are not infrequent, accounting for 7% to 21% of all side effects.1 The most frequent cutaneous manifestations of imatinib are dry skin, alopecia, facial edema, and photosensitivity rash, respectively.1 Other less common manifestations include exfoliative dermatitis, nail disorders, psoriasis, folliculitis, hypotrichosis, urticaria, petechiae, Stevens-Johnson syndrome, erythema multiforme, Sweet syndrome, and leukocytoclastic vasculitis.
We report a case of imatinib-induced lichenoid drug eruption (LDE), a rare cutaneous side effect of imatinib use, along with a review of the literature.
Case Report
An 86-year-old man with a history of gastrointestinal stromal tumors (GISTs) and myelodysplastic syndrome presented with diffuse hyperpigmented skin lesions on the trunk, arms, legs, and lower lip of 2 weeks’ duration. He had been taking imatinib 400 mg once daily for 5 months for GIST. Although the oncologist stopped the medication 2 weeks prior, the lesions were persistent and gradually expanded to involve the trunk, arms, legs, and lower lip. He denied any pain or pruritus. Physical examination revealed multiple ill-defined, brown to violaceous, slightly scaly macules and patches on the trunk (Figures 1A and 1B), arms, and legs (Figure 1C), as well as violaceous to erythematous patches on the mucosal aspect of the lower lip (Figure 2). Two 4-mm punch biopsies were performed from the chest and back, which revealed an atrophic epidermis, lichenoid infiltration, and multiple melanophages in the upper dermis consistent with LDE (Figure 3). Direct immunofluorescence was negative. Therefore, based on the clinicopathologic correlation, the diagnosis of imatinib-induced LDE was made. He was treated with clobetasol ointment twice daily for 3 weeks with some improvement. His GIST was stable on follow-up computed tomography 3 months after presentation, and imatinib was resumed 1 month later with continued rash that was stable with topical corticosteroid treatment.
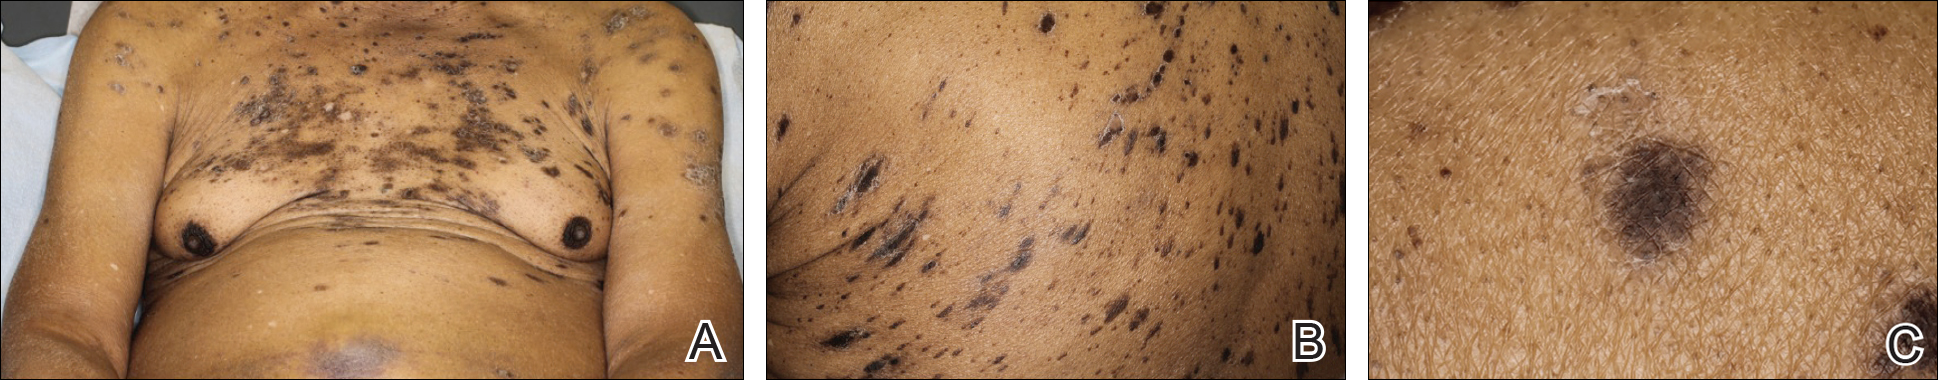
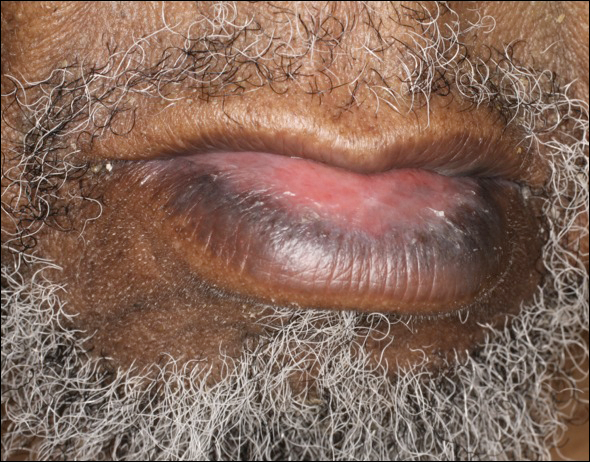
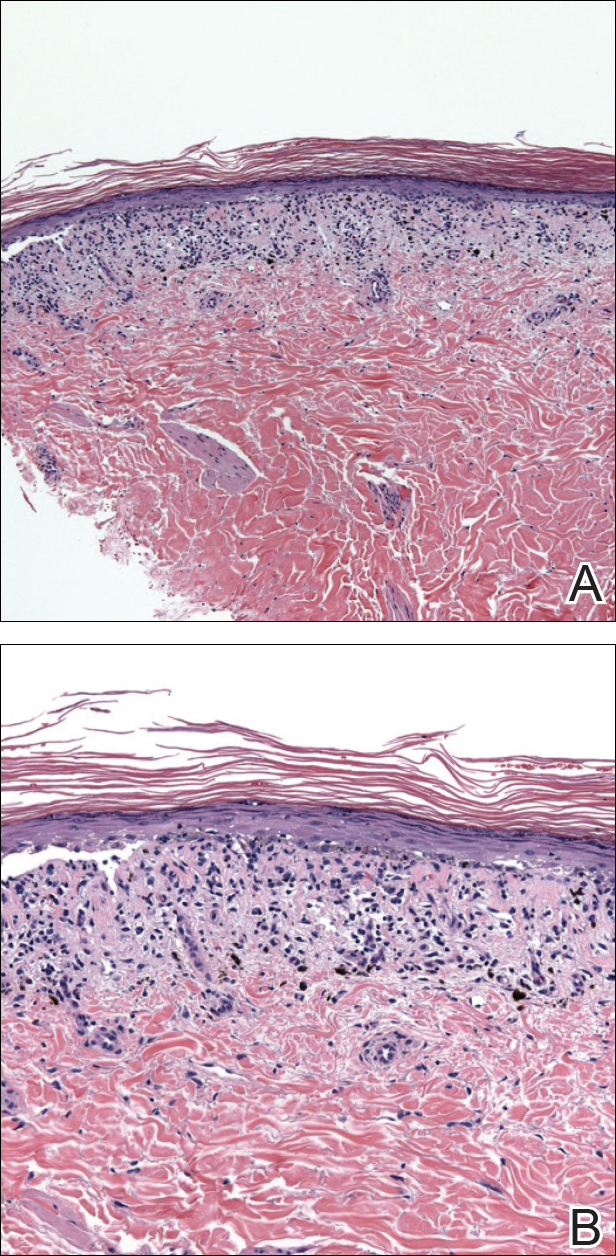
Comment
In addition to CML, imatinib has been approved for acute lymphoblastic leukemia, myelodysplastic syndromes, aggressive systemic mastocytosis, hypereosinophilic syndrome, chronic eosinophilic leukemia, dermatofibrosarcoma protuberans, and GIST. Moreover, off-label use of imatinib for various other tyrosine kinase–positive cancers and rheumatologic conditions have been documented.2,3 With the expanding use of imatinib, there will be more occasions for dermatologists to encounter cutaneous manifestations associated with its use.
According to a PubMed search of articles indexed for MEDLINE using the terms imatinib mesylate lichenoid drug, there have been few case reports of LDE associated with imatinib in the literature (eTable).4-24 Compared to classic LDE, imatinib-induced LDE has a few characteristic findings. Classic LDE frequently spares the oral mucosa and genitalia, but imatinib-induced LDE with manifestations on the oral mucosa and genitalia as well as cutaneous eruptions have been reported.4-9 In fact, the first known case of imatinib-induced LDE was an oral eruption in a patient with CML.4 In patients with oral involvement, lesions have been described as lacy reticular macules and violaceous papules, erosions, and ulcers.4,5,12 Interestingly, of those cases manifesting as concomitant oral and cutaneous LDE, the oral eruptions recurred more frequently, with 3 of 12 patients having recurrence of oral lesions after the cutaneous manifestations resolved.8,16 Genital manifestations of imatinib-induced LDE were much less common.9,11
To date, subsequent reports of imatinib-induced LDE have documented skin manifestations consistent with classic LDE occurring in a diffuse, bilateral, photodistributed pattern.10,15,16 One case presented with diffuse hyperpigmentation associated with LDE in a Japanese patient.20 The authors suggested this finding may be more prominent in patients with skin of color,20 which is consistent with the current case. Nail findings such as subungual hyperkeratosis and longitudinal ridging also have been reported.9,11
The latency period between initiation of imat-inib and onset of LDE generally ranges from 1 to 12 months, with onset most commonly occurring between 2 to 5 months or with dosage increase (eTable). Imatinib-induced LDE primarily has been documented with a 400-mg dose, with 1 case of a 600-mg dose and 1 case of an 800-mg dose, which suggests dose dependency. Furthermore, reports exist of several patients responding well to dose reduction with subsequent recurrence on dose reescalation.13,15
Historically, LDE resolves with discontinuation of the drug after a few weeks to months. When discontinuation of imatinib is unfavorable or patients report symptoms including severe pruritus or pain, treatment should be considered. Topical or oral corticosteroids can be used to treat imatinib-induced LDE, similar to lichen planus. When oral corticosteroids are contraindicated (eg, due to poor patient tolerance), oral acitretin at 25 to 35 mg once daily for 6 to 12 weeks has been reported as an alternative treatment.25
In the majority of cases of imatinib-induced LDE, it was undesirable to stop imatinib (eTable). Notably, in half the reported cases, imatinib was able to be continued and patients were treated symptomatically with either oral and/or topical steroids and/or acitretin with complete remission or tolerable recurrences. Dalmau et al9 reported 3 patients who responded poorly to topical and oral steroids and were subsequently treated with acitretin 25 mg once daily; 2 of 3 patients responded favorably to treatment and imatinib was able to be continued. In the current case imatinib initially helped, but because his rash was relatively asymptomatic, imatinib was restarted with control of rash with topical steroids. He developed some pancytopenia, which required intermittent stoppage of the imatinib.
Conclusion
We present a case of imatinib-induced cutaneous and oral LDE in a patient with GIST. Topical corticosteroids, oral acitretin, and oral steroids all may be reasonable treatment options if discontinuing imatinib is not possible in a symptomatic patient. If these therapies fail and the eruption is extensive or intolerable, dosage adjustment is another option to consider before discontinuation of imatinib.
- Scheinfeld N. Imatinib mesylate and dermatology part 2: a review of the cutaneous side effects of imatinib mesylate. J Drugs Dermatol. 2006;5:228-231.
- Kim H, Kim NH, Kang HJ, et al. Successful long-term use of imatinib mesylate in pediatric patients with sclerodermatous chronic GVHD. Pediatr Transplant. 2012;16:910-912.
- Prey S, Ezzedine K, Doussau A, et al. Imatinib mesylate in scleroderma-associated diffuse skin fibrosis: a phase II multicentre randomized double-blinded controlled trial. Br J Dermatol. 2012;167:1138-1144.
- Lim DS, Muir J. Oral lichenoid reaction to imatinib (STI 571, gleevec). Dermatology. 2002;205:169-171.
- Ena P, Chiarolini F, Siddi GM, et al. Oral lichenoid eruption secondary to imatinib (glivec). J Dermatolog Treat. 2004;15:253-255.
- Roux C, Boisseau-Garsaud AM, Saint-Cyr I, et al. Lichenoid cutaneous reaction to imatinib. Ann Dermatol Venereol. 2004;131:571-573.
- Prabhash K, Doval DC. Lichenoid eruption due to imat-inib. Indian J Dermatol Venereol Leprol. 2005;71:287-288.
- Pascual JC, Matarredona J, Miralles J, et al. Oral and cutaneous lichenoid reaction secondary to imatinib: report of two cases. Int J Dermatol. 2006;45:1471-1473.
- Dalmau J, Peramiquel L, Puig L, et al. Imatinib-associated lichenoid eruption: acitretin treatment allows maintained antineoplastic effect. Br J Dermatol. 2006;154:1213-1216.
- Chan CY, Browning J, Smith-Zagone MJ, et al. Cutaneous lichenoid dermatitis associated with imatinib mesylate. Dermatol Online J. 2007;13:29.
- Wahiduzzaman M, Pubalan M. Oral and cutaneous lichenoid reaction with nail changes secondary to imatinib: report of a case and literature review. Dermatol Online J. 2008;14:14.
- Basso FG, Boer CC, Correa ME, et al. Skin and oral lesions associated to imatinib mesylate therapy. Support Care Cancer. 2009;17:465-468.
- Kawakami T, Kawanabe T, Soma Y. Cutaneous lichenoid eruption caused by imatinib mesylate in a Japanese patient with chronic myeloid leukaemia. Acta Derm Venereol. 2009;89:325-326.
- Sendagorta E, Herranz P, Feito M, et al. Lichenoid drug eruption related to imatinib: report of a new case and review of the literature. Clin Exp Dermatol. 2009;34:E315-E316.
- Kuraishi N, Nagai Y, Hasegawa M, et al. Lichenoid drug eruption with palmoplantar hyperkeratosis due to imatinib mesylate: a case report and a review of the literature. Acta Derm Venereol. 2010;90:73-76.
- Brazzelli V, Muzio F, Manna G, et al. Photo-induced dermatitis and oral lichenoid reaction in a chronic myeloid leukemia patient treated with imatinib mesylate. Photodermatol Photoimmunol Photomed. 2012;28:2-5.
- Ghosh SK. Generalized lichenoid drug eruption associated with imatinib mesylate therapy. Indian J Dermatol. 2013;58:388-392.
- Lee J, Chung J, Jung M, et al. Lichenoid drug eruption after low-dose imatinib mesylate therapy. Ann Dermatol. 2013;25:500-502.
- Machaczka M, Gossart M. Multiple skin lesions caused by imatinib mesylate treatment of chronic myeloid leukemia. Pol Arch Med Wewn. 2013;123:251-252.
- Kagimoto Y, Mizuashi M, Kikuchi K, et al. Lichenoid drug eruption with hyperpigmentation caused by imatinib mesylate [published online June 20, 2013]. Int J Dermatol. 2014;53:E161-E162.
- Arshdeep, De D, Malhotra P, et al. Imatinib mesylate-induced severe lichenoid rash. Indian J Dermatol Venereol Leprol. 2014;80:93-95.
- Lau YM, Lam YK, Leung KH, et al. Trachyonychia in a patient with chronic myeloid leukaemia after imatinib mesylate. Hong Kong Med J. 2014;20:464.e2.
- Bhatia A, Kanish B, Chaudhary P. Lichenoid drug eruption due to imatinib mesylate. Int J Appl Basic Med Res. 2015;5:68-69.
- Luo JR, Xiang XJ, Xiong JP. Lichenoid drug eruption caused by imatinib mesylate in a Chinese patient with gastrointestinal stromal tumor. Int J Clin Pharmacol Ther. 2016;54:719-722.
- Laurberg G, Geiger JM, Hjorth N, et al. Treatment of lichen planus with acitretin. a double-blind, placebo-controlled study in 65 patients. J Am Acad Dermatol. 1991;24:434-437.
Imatinib mesylate is a tyrosine kinase inhibitor initially approved by the US Food and Drug Administration in 2001 for chronic myeloid leukemia (CML). The indications for imatinib have expanded since its initial approval. It is increasingly important that dermatologists recognize adverse cutaneous manifestations associated with imatinib and are aware of their management and outcomes to avoid unnecessarily discontinuing a potentially lifesaving medication.
Adverse cutaneous manifestations in response to imatinib are not infrequent, accounting for 7% to 21% of all side effects.1 The most frequent cutaneous manifestations of imatinib are dry skin, alopecia, facial edema, and photosensitivity rash, respectively.1 Other less common manifestations include exfoliative dermatitis, nail disorders, psoriasis, folliculitis, hypotrichosis, urticaria, petechiae, Stevens-Johnson syndrome, erythema multiforme, Sweet syndrome, and leukocytoclastic vasculitis.
We report a case of imatinib-induced lichenoid drug eruption (LDE), a rare cutaneous side effect of imatinib use, along with a review of the literature.
Case Report
An 86-year-old man with a history of gastrointestinal stromal tumors (GISTs) and myelodysplastic syndrome presented with diffuse hyperpigmented skin lesions on the trunk, arms, legs, and lower lip of 2 weeks’ duration. He had been taking imatinib 400 mg once daily for 5 months for GIST. Although the oncologist stopped the medication 2 weeks prior, the lesions were persistent and gradually expanded to involve the trunk, arms, legs, and lower lip. He denied any pain or pruritus. Physical examination revealed multiple ill-defined, brown to violaceous, slightly scaly macules and patches on the trunk (Figures 1A and 1B), arms, and legs (Figure 1C), as well as violaceous to erythematous patches on the mucosal aspect of the lower lip (Figure 2). Two 4-mm punch biopsies were performed from the chest and back, which revealed an atrophic epidermis, lichenoid infiltration, and multiple melanophages in the upper dermis consistent with LDE (Figure 3). Direct immunofluorescence was negative. Therefore, based on the clinicopathologic correlation, the diagnosis of imatinib-induced LDE was made. He was treated with clobetasol ointment twice daily for 3 weeks with some improvement. His GIST was stable on follow-up computed tomography 3 months after presentation, and imatinib was resumed 1 month later with continued rash that was stable with topical corticosteroid treatment.
Comment
In addition to CML, imatinib has been approved for acute lymphoblastic leukemia, myelodysplastic syndromes, aggressive systemic mastocytosis, hypereosinophilic syndrome, chronic eosinophilic leukemia, dermatofibrosarcoma protuberans, and GIST. Moreover, off-label use of imatinib for various other tyrosine kinase–positive cancers and rheumatologic conditions have been documented.2,3 With the expanding use of imatinib, there will be more occasions for dermatologists to encounter cutaneous manifestations associated with its use.
According to a PubMed search of articles indexed for MEDLINE using the terms imatinib mesylate lichenoid drug, there have been few case reports of LDE associated with imatinib in the literature (eTable).4-24 Compared to classic LDE, imatinib-induced LDE has a few characteristic findings. Classic LDE frequently spares the oral mucosa and genitalia, but imatinib-induced LDE with manifestations on the oral mucosa and genitalia as well as cutaneous eruptions have been reported.4-9 In fact, the first known case of imatinib-induced LDE was an oral eruption in a patient with CML.4 In patients with oral involvement, lesions have been described as lacy reticular macules and violaceous papules, erosions, and ulcers.4,5,12 Interestingly, of those cases manifesting as concomitant oral and cutaneous LDE, the oral eruptions recurred more frequently, with 3 of 12 patients having recurrence of oral lesions after the cutaneous manifestations resolved.8,16 Genital manifestations of imatinib-induced LDE were much less common.9,11
To date, subsequent reports of imatinib-induced LDE have documented skin manifestations consistent with classic LDE occurring in a diffuse, bilateral, photodistributed pattern.10,15,16 One case presented with diffuse hyperpigmentation associated with LDE in a Japanese patient.20 The authors suggested this finding may be more prominent in patients with skin of color,20 which is consistent with the current case. Nail findings such as subungual hyperkeratosis and longitudinal ridging also have been reported.9,11
The latency period between initiation of imat-inib and onset of LDE generally ranges from 1 to 12 months, with onset most commonly occurring between 2 to 5 months or with dosage increase (eTable). Imatinib-induced LDE primarily has been documented with a 400-mg dose, with 1 case of a 600-mg dose and 1 case of an 800-mg dose, which suggests dose dependency. Furthermore, reports exist of several patients responding well to dose reduction with subsequent recurrence on dose reescalation.13,15
Historically, LDE resolves with discontinuation of the drug after a few weeks to months. When discontinuation of imatinib is unfavorable or patients report symptoms including severe pruritus or pain, treatment should be considered. Topical or oral corticosteroids can be used to treat imatinib-induced LDE, similar to lichen planus. When oral corticosteroids are contraindicated (eg, due to poor patient tolerance), oral acitretin at 25 to 35 mg once daily for 6 to 12 weeks has been reported as an alternative treatment.25
In the majority of cases of imatinib-induced LDE, it was undesirable to stop imatinib (eTable). Notably, in half the reported cases, imatinib was able to be continued and patients were treated symptomatically with either oral and/or topical steroids and/or acitretin with complete remission or tolerable recurrences. Dalmau et al9 reported 3 patients who responded poorly to topical and oral steroids and were subsequently treated with acitretin 25 mg once daily; 2 of 3 patients responded favorably to treatment and imatinib was able to be continued. In the current case imatinib initially helped, but because his rash was relatively asymptomatic, imatinib was restarted with control of rash with topical steroids. He developed some pancytopenia, which required intermittent stoppage of the imatinib.
Conclusion
We present a case of imatinib-induced cutaneous and oral LDE in a patient with GIST. Topical corticosteroids, oral acitretin, and oral steroids all may be reasonable treatment options if discontinuing imatinib is not possible in a symptomatic patient. If these therapies fail and the eruption is extensive or intolerable, dosage adjustment is another option to consider before discontinuation of imatinib.
- Scheinfeld N. Imatinib mesylate and dermatology part 2: a review of the cutaneous side effects of imatinib mesylate. J Drugs Dermatol. 2006;5:228-231.
- Kim H, Kim NH, Kang HJ, et al. Successful long-term use of imatinib mesylate in pediatric patients with sclerodermatous chronic GVHD. Pediatr Transplant. 2012;16:910-912.
- Prey S, Ezzedine K, Doussau A, et al. Imatinib mesylate in scleroderma-associated diffuse skin fibrosis: a phase II multicentre randomized double-blinded controlled trial. Br J Dermatol. 2012;167:1138-1144.
- Lim DS, Muir J. Oral lichenoid reaction to imatinib (STI 571, gleevec). Dermatology. 2002;205:169-171.
- Ena P, Chiarolini F, Siddi GM, et al. Oral lichenoid eruption secondary to imatinib (glivec). J Dermatolog Treat. 2004;15:253-255.
- Roux C, Boisseau-Garsaud AM, Saint-Cyr I, et al. Lichenoid cutaneous reaction to imatinib. Ann Dermatol Venereol. 2004;131:571-573.
- Prabhash K, Doval DC. Lichenoid eruption due to imat-inib. Indian J Dermatol Venereol Leprol. 2005;71:287-288.
- Pascual JC, Matarredona J, Miralles J, et al. Oral and cutaneous lichenoid reaction secondary to imatinib: report of two cases. Int J Dermatol. 2006;45:1471-1473.
- Dalmau J, Peramiquel L, Puig L, et al. Imatinib-associated lichenoid eruption: acitretin treatment allows maintained antineoplastic effect. Br J Dermatol. 2006;154:1213-1216.
- Chan CY, Browning J, Smith-Zagone MJ, et al. Cutaneous lichenoid dermatitis associated with imatinib mesylate. Dermatol Online J. 2007;13:29.
- Wahiduzzaman M, Pubalan M. Oral and cutaneous lichenoid reaction with nail changes secondary to imatinib: report of a case and literature review. Dermatol Online J. 2008;14:14.
- Basso FG, Boer CC, Correa ME, et al. Skin and oral lesions associated to imatinib mesylate therapy. Support Care Cancer. 2009;17:465-468.
- Kawakami T, Kawanabe T, Soma Y. Cutaneous lichenoid eruption caused by imatinib mesylate in a Japanese patient with chronic myeloid leukaemia. Acta Derm Venereol. 2009;89:325-326.
- Sendagorta E, Herranz P, Feito M, et al. Lichenoid drug eruption related to imatinib: report of a new case and review of the literature. Clin Exp Dermatol. 2009;34:E315-E316.
- Kuraishi N, Nagai Y, Hasegawa M, et al. Lichenoid drug eruption with palmoplantar hyperkeratosis due to imatinib mesylate: a case report and a review of the literature. Acta Derm Venereol. 2010;90:73-76.
- Brazzelli V, Muzio F, Manna G, et al. Photo-induced dermatitis and oral lichenoid reaction in a chronic myeloid leukemia patient treated with imatinib mesylate. Photodermatol Photoimmunol Photomed. 2012;28:2-5.
- Ghosh SK. Generalized lichenoid drug eruption associated with imatinib mesylate therapy. Indian J Dermatol. 2013;58:388-392.
- Lee J, Chung J, Jung M, et al. Lichenoid drug eruption after low-dose imatinib mesylate therapy. Ann Dermatol. 2013;25:500-502.
- Machaczka M, Gossart M. Multiple skin lesions caused by imatinib mesylate treatment of chronic myeloid leukemia. Pol Arch Med Wewn. 2013;123:251-252.
- Kagimoto Y, Mizuashi M, Kikuchi K, et al. Lichenoid drug eruption with hyperpigmentation caused by imatinib mesylate [published online June 20, 2013]. Int J Dermatol. 2014;53:E161-E162.
- Arshdeep, De D, Malhotra P, et al. Imatinib mesylate-induced severe lichenoid rash. Indian J Dermatol Venereol Leprol. 2014;80:93-95.
- Lau YM, Lam YK, Leung KH, et al. Trachyonychia in a patient with chronic myeloid leukaemia after imatinib mesylate. Hong Kong Med J. 2014;20:464.e2.
- Bhatia A, Kanish B, Chaudhary P. Lichenoid drug eruption due to imatinib mesylate. Int J Appl Basic Med Res. 2015;5:68-69.
- Luo JR, Xiang XJ, Xiong JP. Lichenoid drug eruption caused by imatinib mesylate in a Chinese patient with gastrointestinal stromal tumor. Int J Clin Pharmacol Ther. 2016;54:719-722.
- Laurberg G, Geiger JM, Hjorth N, et al. Treatment of lichen planus with acitretin. a double-blind, placebo-controlled study in 65 patients. J Am Acad Dermatol. 1991;24:434-437.
Practice Points
- Imatinib mesylate can cause cutaneous adverse reactions including dry skin, alopecia, facial edema, photosensitivity rash, and lichenoid drug eruption (LDE).
- Topical corticosteroids, oral acitretin, and oral steroids may be reasonable treatment options for imatinib-induced LDE if discontinuing imatinib is not possible in a symptomatic patient.
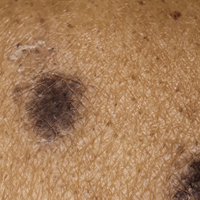
Medication Adherence and Operating Room Efficiency for a Surgical Subspecialty
Inefficiencies in the operating room (OR) can occur before, during, and between cases and lead to multiple problems, including delays in the delivery of patient care. They also have a negative financial impact for the institution and cause frustration for surgeons, anesthesiologists, and other OR staff. Ultimately, delays lead to dissatisfaction among patients and health care providers. Operating room efficiency increasingly is becoming a marker of the quality of surgical care.
The Institute of Medicine (IOM) identified timeliness and efficiency as 2 of 6 areas for improvement for U.S. hospitals.1 Organizations such as the Centers for Medicare and Medicaid Services, Agency for Healthcare Research and Quality, IOM, Institute for Healthcare Improvement, The Joint Commission, Leapfrog Group, and National Quality Forum are beginning to monitor patient care workflow in order to improve quality while reducing costs.2
About 187 million Americans take at least 1 prescription drug.3 An estimated 20% to 50% of patients do not take their medications as prescribed and are said to be nonadherent with therapy.4,5 Nonadherence to medication also has been shown to result in increased health risks and costs of up to $290 billion.6 Patients who receive pharmacist services achieve better clinical outcomes for chronic diseases than national standards.7
Among patients with a chronic disease, poor adherence tends to result in poor outcomes and increased medical costs. Yet these are the patients who face the most risks in surgery and require the most preoperative care. Several studies have evaluated the frequency of medication nonadherence prior to surgery and its effect on surgery cancellations. These studies have examined a variety of factors related to patient preoperative education, medications, food intake, bowel prep, etc.
In a VA Puget Sound Health Care System study, 23% of patients undergoing ambulatory surgery were nonadherent to preoperative medication instructions.8 Studies have found that up to 7% of cancellations were impacted by medication nonadherence and preoperative education.9-13 Furthermore, studies using large-scale databases have found medically treatable conditions as a significant source of surgical delay.14 Had these conditions been treated a priori, delay in surgery would not have occurred. Unfortunately, it is not clear whether the delays were the result of missed preoperative checks or medication nonadherence.
Ensuring patient safety, including reducing medical errors and adverse events (AEs), is imperative in the surgical workflow. In 1999, the IOM estimated that medical error was a leading cause of death in the U.S. and resulted in up to 100,000 deaths annually.15
In a retrospective study of 15,000 cases, Gawande and colleagues found that 66% of all AEs were surgical and 54% of these were preventable.16 In addition to improving reporting systems, creating a culture of safety with all members of the health care team and building a partnership with patients during preoperative visits can ensure increased adherence and reduced medication AEs. In a neurosurgical cohort of patients, Bernstein and colleagues found that 85% of patients were subjected to at least 1 error; 10% of the errors were major, and 65% were deemed preventable.17
The purpose of this study is to evaluate whether redundancy built into the patient care protocols prior to surgery helps catch errors as demonstrated in time-out analyses.18 Decreasing these errors would lead to fewer surgical cancellations and medical workup delays. The authors hypothesize that a structured preoperative pharmacologic workup would result in decreased preoperative delay in the surgical workflow.
Methods
The study protocol was reviewed and determined to be a quality improvement/quality assurance initiative, which exempted it from institutional review board or other oversight committee review, at the Minneapolis VA Health Care System. The VA OR Efficiency Task Force identified medication adherence as a possible source of delay. A study therefore was undertaken to determine the adherence rate and how it impacted operative delays. Data were extracted from this study to test the stated hypothesis and compare with historic data.
Fifty consecutive patients undergoing neurosurgical procedures from May 2010 through July 2010 were retrospectively reviewed and evaluated. All patients had a preoperative consultation with a pharmacist and the neurosurgery coordinator who reviewed all medications with the patient and gave specific instructions on which medications should be continued or discontinued prior to the surgery date. This information was documented on the OR Medication Compliance Worksheet and included in the patient’s preoperative chart by the neurosurgery coordinator. On the day of surgery, all active medications on this chart were reviewed with the patient by the anesthesiologist and documented on the OR Medication Compliance Worksheet. The worksheet was then sent to the neurosurgery coordinator for secondary review and analysis.
To evaluate delays, the authors reviewed the patient anesthesiology records. Delays were defined as either cancellations of the case due to medication nonadherence, which would make it unsafe to proceed with surgery, or minor delays due to medication nonadherence, which required further preoperative assessment and workup before proceeding with surgery. Cancelled cases were defined as cases on the final copy of the published OR schedule that did not occur.
Medication Adherence Program
In order to ensure medication adherence prior to surgery there were 5 points of contact with a patient from the time the patient was scheduled for surgery and the date of the surgery (Figure 1):
- The coordinator reviewed medications with patient at time of scheduling
- A letter was sent with specific instructions about medications
- Preoperative medicine clearance
- Preoperative neurosurgery appointment
- Call from pharmacist 1 week before surgery
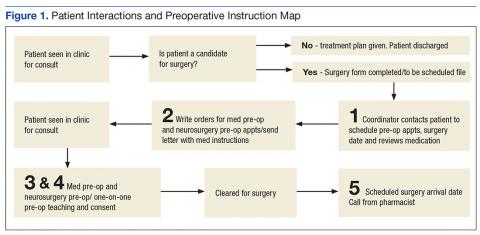
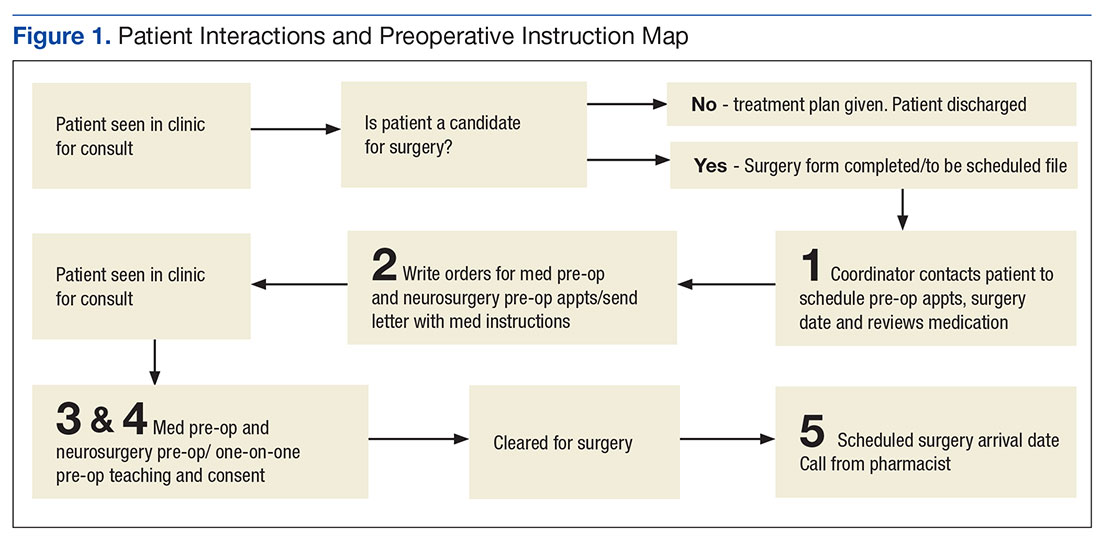
Results
The authors reviewed 10 months of the neurosurgical service prior to initiation of the protocol. Of 317 analyzed cases, 30 were delayed/cancelled. Among these, 5 cases with the possibility of a 6th were cancelled due to medication issues. Following the initialization of the study, 50 patients underwent preoperative counseling with the pharmacist and the neurosurgery coordinator and had an OR Medication Compliance Worksheet created.
Review of the OR Medication Compliance Worksheet demonstrated that 2 patients were nonadherent with their medications. 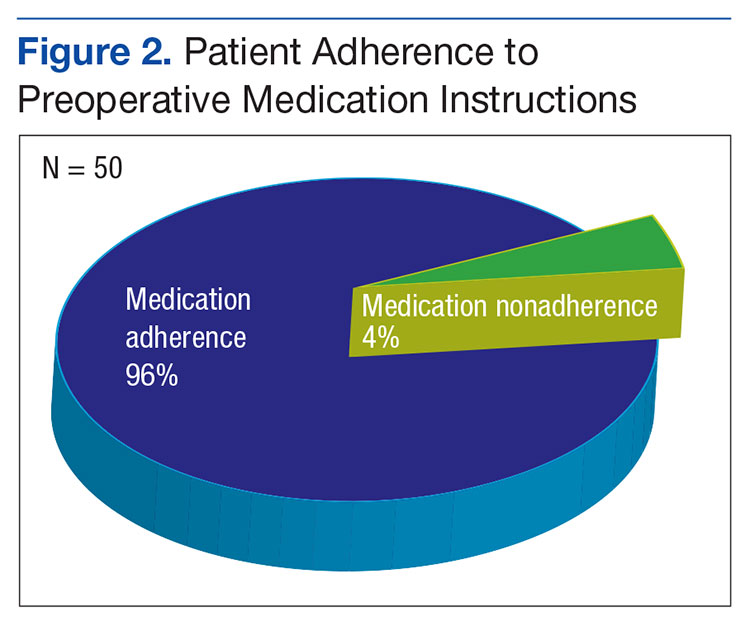
Discussion
The OR is one of the most expensive areas in an acute care hospital.2 Cancellations or delays can have significant negative financial implications (about $1,500 per hour of lost revenue).19 In order to improve OR efficiency and reduce preoperative delays, the causes of preoperative delays must be determined.
Some delays and cancellations result from either preoperative or perioperative issues. Prolonged wait time and postponement may cause preoperative delays. Perioperative delays include delays in getting into the OR once the patient has arrived in the hospital as well as delays during the operation. These delays can be due to both human error and system deficiencies.20
One Toronto, Canada study looked at the different etiologies for delays in cranial and spinal procedures and found that equipment failure followed by physical transit into the OR were the top reasons for delays.21 These researchers also found that first cases each day sometimes had a higher incidence of delays than did subsequent cases because several ORs prepare to start simultaneously, which causes an increased demand on hospital support services (eg, registration desk, imaging department, nurses in the patient holding area, or transportation). The number of these support staff remains constant throughout the day, whereas the first-case patients all arrive at about the same time, causing a bottleneck in the early morning. The authors looked at 1 facet of the delay problem as an ongoing analysis for hospital efficiency improvement.
With the implementation of a simple 5-step process, medication adherence was > 90% and the impact of nonadherence on surgical procedure delays was eliminated during the trial period. In this sample, nonadherence did not impact surgery, which resulted in fewer delays and cancellations. The process emphasized repetition and communication, involving 5 reminders between the date of OR scheduling and the date of the actual surgery. The authors found that in this quality improvement study, redundancy in the workflow actually improved the efficiency of the patient’s hospital course.
Within the OR, there are many perspectives to consider for improving OR efficiency. For instance, Archer and colleagues present several distinct perspectives: that of the health care institution, the individual practitioner, the patient, and evidenced-based medicine.2 According to Strum and colleagues, OR inefficiency is the sum of under- and overutilized time and efficiency is highest when OR inefficiency is minimized.22 An OR is considered underutilized when it is staffed at regular wages but not used for surgery, setup, or cleanup. An OR is considered overutilized when the OR staff receives overtime wages, multiplied by the relative cost of overtime compared with straight time. Delayed or cancelled surgeries can result in idle operating room staff, while repeat or correlative studies (ie, electrocardiogram, drug levels) may overutilize support services.
Limitations
This study has obvious limitations due to its small scale. Because the protocol implementation resulted in few delays, a very large cohort would have been necessary to attain statistical power.
Conclusion
By improving OR efficiency and reducing preoperative delays, surgical capacity can be increased.
In this study, the authors demonstrate that with little addition of cost, medication nonadherence can be reduced or eliminated as an issue for surgical delays. With the implementation of the 5-step reminder process as well as the addition of a pharmacist consultation/visit, medication adherence was > 90% among preoperative patients in this small study. With the number of patients with complex medication regimens, increasing medication adherence in the preoperative period is not only important in reducing operative delays, but also an opportunity to ensure the patient is safe and optimally treated. ˜
1. Institute of Medicine (US) Committee on Quality of Health Care in America. Crossing the Quality Chasm: A New Health System for the 21st Century. Washing ton, DC: National Academy Press; 2001. https://www.nap.edu/catalog/10027/crossing-the-quality -chasm-a-new-health-system-for-the.
2. Archer T, Macario A. The drive for operating room efficiency will increase quality of patient care. Curr Opin Anaesthesiol. 2006;19(2):171-176.
3. Lundy J; Kaiser Family Foundation. Prescription drug trends. https://kaiserfamilyfoundation.files .wordpress.com/2013/01/3057-08.pdf. Published May 2010. Accessed January 26, 2017.
4. Osterberg L, Blaschke T. Adherence to medication. N Engl J Med. 2005;353(5):487-497.
5. DiMatteo MR. Variations in patients’ adherence to medical recommendations: a quantitative review of 50 years of research. Med Care. 2004;42(3):200-209.
6. National Priorities Partnership, NEHI. Improving patient medication adherence: a $100+ billion opportunity. http://adhereforhealth.org/wp-content/uploads/pdf/ImprovingPatientMedicationAdherence-NPP_Patient_Medication_Adherence_NQF.pdf. Published April 2011. Accessed January 26, 2017.
7. Kripalani S, Yao X, Haynes RB. Interventions to enhance medication adherence in chronic medical conditions: a systematic review. Arch Intern Med. 2007;167(6):540-550.
8. Chew JD, Bradley KA, Flum DR, Cornia PB, Koepsell TD. The impact of low health literacy on surgical practice. Am J Surg. 2004;188(3):250-253.
9. van Klei WA, Moons KG, Rutten CL, et al. The effect of outpatient preoperative evaluation of hospital inpatients on cancellation of surgery and length of hospital stay. Anesth Analg. 2002;94(3):644-649.
10. Sanjay P, Dodds A, Miller E, Arumugam PJ, Woodward A. Cancelled elective operations: an observational study from a district general hospital. J Health Organ Manag. 2007;21(1):54-58.
11. Schofield WN, Rubin GL, Piza M, et al. Cancellation of operations on the day of intended surgery at a major Australian referral hospital. Med J Aust. 2005;182(12):612-615.
12. Zafar A, Mufti TS, Griffin S, Ahmed S, Ansari JA. Cancelled elective general surgical operations in Ayub Teaching Hospital. J Ayub Med Coll Abbottabad. 2007;19(3):64-66.
13. Knox M, Myers E, Hurley M. The impact of pre-operative assessment clinics on elective surgical case cancellations. Surgeon. 2009;7(2):76-78.
14. Phruetthiphat OA, Gao Y, Anthony CA, Pugely AJ, Warth LC, Callaghan JJ. Incidence of and preoperative risk factors for surgical delay in primary total hip arthroplasty: analysis from the American College of Surgeons National Surgical Quality Improvement Program. J Arthroplasty. 2016;31(11): 2432-2436.
15. Kohn LT, Corrigan JM, Donaldson MD, eds; Institute of Medicine; Committee on Quality of Health Care in America. To Err Is Human: Building a Safer Health System. Washington, DC: National Academies; 2000. https://www.nap.edu/catalog/9728/to-err-is-human-building-a-safer-health-system.
16. Gawande AA, Thomas EJ, Zinner MJ, Brennan TA. The incidence and nature of surgical adverse events in Colorado and Utah in 1992. Surgery. 1999;126(1):66-75.
17. Bernstein M, Massicotte E, Etchells E. Error in neurosurgery: a prospective pilot study. Can J Neurol Sci. 2001;28(suppl 2):S60.
18. Altpeter T, Luckhardt K, Lewis JN, Harken AH, Polk HC Jr. Expanded surgical time out: a key to real-time data collection and quality improvement. J Am Coll Surg. 2007;204(4):527-532.
19. Dexter F, Marcon E, Epstein RH, Ledolter J. Validation of statistical methods to compare cancellation rates on the day of surgery. Anesth Analg. 2005;101(2):465-473.
20. Etchells E, O’Neill C, Bernstein M. Patient safety in surgery: error detection and prevention. World J Surg. 2003;27(8):936-941.
21. Wong J, Khu KJ, Kaderali Z, Bernstein M. Delays in the operating room: signs of an imperfect system. Can J Surg. 2010;53(3):189-195.
22. Strum DP, Vargas LG, May JH. Surgical subspecialty block utilization and capacity planning: a minimal cost analysis model. Anesthesiology. 1999;90(4):1176-1185.
Inefficiencies in the operating room (OR) can occur before, during, and between cases and lead to multiple problems, including delays in the delivery of patient care. They also have a negative financial impact for the institution and cause frustration for surgeons, anesthesiologists, and other OR staff. Ultimately, delays lead to dissatisfaction among patients and health care providers. Operating room efficiency increasingly is becoming a marker of the quality of surgical care.
The Institute of Medicine (IOM) identified timeliness and efficiency as 2 of 6 areas for improvement for U.S. hospitals.1 Organizations such as the Centers for Medicare and Medicaid Services, Agency for Healthcare Research and Quality, IOM, Institute for Healthcare Improvement, The Joint Commission, Leapfrog Group, and National Quality Forum are beginning to monitor patient care workflow in order to improve quality while reducing costs.2
About 187 million Americans take at least 1 prescription drug.3 An estimated 20% to 50% of patients do not take their medications as prescribed and are said to be nonadherent with therapy.4,5 Nonadherence to medication also has been shown to result in increased health risks and costs of up to $290 billion.6 Patients who receive pharmacist services achieve better clinical outcomes for chronic diseases than national standards.7
Among patients with a chronic disease, poor adherence tends to result in poor outcomes and increased medical costs. Yet these are the patients who face the most risks in surgery and require the most preoperative care. Several studies have evaluated the frequency of medication nonadherence prior to surgery and its effect on surgery cancellations. These studies have examined a variety of factors related to patient preoperative education, medications, food intake, bowel prep, etc.
In a VA Puget Sound Health Care System study, 23% of patients undergoing ambulatory surgery were nonadherent to preoperative medication instructions.8 Studies have found that up to 7% of cancellations were impacted by medication nonadherence and preoperative education.9-13 Furthermore, studies using large-scale databases have found medically treatable conditions as a significant source of surgical delay.14 Had these conditions been treated a priori, delay in surgery would not have occurred. Unfortunately, it is not clear whether the delays were the result of missed preoperative checks or medication nonadherence.
Ensuring patient safety, including reducing medical errors and adverse events (AEs), is imperative in the surgical workflow. In 1999, the IOM estimated that medical error was a leading cause of death in the U.S. and resulted in up to 100,000 deaths annually.15
In a retrospective study of 15,000 cases, Gawande and colleagues found that 66% of all AEs were surgical and 54% of these were preventable.16 In addition to improving reporting systems, creating a culture of safety with all members of the health care team and building a partnership with patients during preoperative visits can ensure increased adherence and reduced medication AEs. In a neurosurgical cohort of patients, Bernstein and colleagues found that 85% of patients were subjected to at least 1 error; 10% of the errors were major, and 65% were deemed preventable.17
The purpose of this study is to evaluate whether redundancy built into the patient care protocols prior to surgery helps catch errors as demonstrated in time-out analyses.18 Decreasing these errors would lead to fewer surgical cancellations and medical workup delays. The authors hypothesize that a structured preoperative pharmacologic workup would result in decreased preoperative delay in the surgical workflow.
Methods
The study protocol was reviewed and determined to be a quality improvement/quality assurance initiative, which exempted it from institutional review board or other oversight committee review, at the Minneapolis VA Health Care System. The VA OR Efficiency Task Force identified medication adherence as a possible source of delay. A study therefore was undertaken to determine the adherence rate and how it impacted operative delays. Data were extracted from this study to test the stated hypothesis and compare with historic data.
Fifty consecutive patients undergoing neurosurgical procedures from May 2010 through July 2010 were retrospectively reviewed and evaluated. All patients had a preoperative consultation with a pharmacist and the neurosurgery coordinator who reviewed all medications with the patient and gave specific instructions on which medications should be continued or discontinued prior to the surgery date. This information was documented on the OR Medication Compliance Worksheet and included in the patient’s preoperative chart by the neurosurgery coordinator. On the day of surgery, all active medications on this chart were reviewed with the patient by the anesthesiologist and documented on the OR Medication Compliance Worksheet. The worksheet was then sent to the neurosurgery coordinator for secondary review and analysis.
To evaluate delays, the authors reviewed the patient anesthesiology records. Delays were defined as either cancellations of the case due to medication nonadherence, which would make it unsafe to proceed with surgery, or minor delays due to medication nonadherence, which required further preoperative assessment and workup before proceeding with surgery. Cancelled cases were defined as cases on the final copy of the published OR schedule that did not occur.
Medication Adherence Program
In order to ensure medication adherence prior to surgery there were 5 points of contact with a patient from the time the patient was scheduled for surgery and the date of the surgery (Figure 1):
- The coordinator reviewed medications with patient at time of scheduling
- A letter was sent with specific instructions about medications
- Preoperative medicine clearance
- Preoperative neurosurgery appointment
- Call from pharmacist 1 week before surgery
Results
The authors reviewed 10 months of the neurosurgical service prior to initiation of the protocol. Of 317 analyzed cases, 30 were delayed/cancelled. Among these, 5 cases with the possibility of a 6th were cancelled due to medication issues. Following the initialization of the study, 50 patients underwent preoperative counseling with the pharmacist and the neurosurgery coordinator and had an OR Medication Compliance Worksheet created.
Review of the OR Medication Compliance Worksheet demonstrated that 2 patients were nonadherent with their medications.
Discussion
The OR is one of the most expensive areas in an acute care hospital.2 Cancellations or delays can have significant negative financial implications (about $1,500 per hour of lost revenue).19 In order to improve OR efficiency and reduce preoperative delays, the causes of preoperative delays must be determined.
Some delays and cancellations result from either preoperative or perioperative issues. Prolonged wait time and postponement may cause preoperative delays. Perioperative delays include delays in getting into the OR once the patient has arrived in the hospital as well as delays during the operation. These delays can be due to both human error and system deficiencies.20
One Toronto, Canada study looked at the different etiologies for delays in cranial and spinal procedures and found that equipment failure followed by physical transit into the OR were the top reasons for delays.21 These researchers also found that first cases each day sometimes had a higher incidence of delays than did subsequent cases because several ORs prepare to start simultaneously, which causes an increased demand on hospital support services (eg, registration desk, imaging department, nurses in the patient holding area, or transportation). The number of these support staff remains constant throughout the day, whereas the first-case patients all arrive at about the same time, causing a bottleneck in the early morning. The authors looked at 1 facet of the delay problem as an ongoing analysis for hospital efficiency improvement.
With the implementation of a simple 5-step process, medication adherence was > 90% and the impact of nonadherence on surgical procedure delays was eliminated during the trial period. In this sample, nonadherence did not impact surgery, which resulted in fewer delays and cancellations. The process emphasized repetition and communication, involving 5 reminders between the date of OR scheduling and the date of the actual surgery. The authors found that in this quality improvement study, redundancy in the workflow actually improved the efficiency of the patient’s hospital course.
Within the OR, there are many perspectives to consider for improving OR efficiency. For instance, Archer and colleagues present several distinct perspectives: that of the health care institution, the individual practitioner, the patient, and evidenced-based medicine.2 According to Strum and colleagues, OR inefficiency is the sum of under- and overutilized time and efficiency is highest when OR inefficiency is minimized.22 An OR is considered underutilized when it is staffed at regular wages but not used for surgery, setup, or cleanup. An OR is considered overutilized when the OR staff receives overtime wages, multiplied by the relative cost of overtime compared with straight time. Delayed or cancelled surgeries can result in idle operating room staff, while repeat or correlative studies (ie, electrocardiogram, drug levels) may overutilize support services.
Limitations
This study has obvious limitations due to its small scale. Because the protocol implementation resulted in few delays, a very large cohort would have been necessary to attain statistical power.
Conclusion
By improving OR efficiency and reducing preoperative delays, surgical capacity can be increased.
In this study, the authors demonstrate that with little addition of cost, medication nonadherence can be reduced or eliminated as an issue for surgical delays. With the implementation of the 5-step reminder process as well as the addition of a pharmacist consultation/visit, medication adherence was > 90% among preoperative patients in this small study. With the number of patients with complex medication regimens, increasing medication adherence in the preoperative period is not only important in reducing operative delays, but also an opportunity to ensure the patient is safe and optimally treated. ˜
1. Institute of Medicine (US) Committee on Quality of Health Care in America. Crossing the Quality Chasm: A New Health System for the 21st Century. Washing ton, DC: National Academy Press; 2001. https://www.nap.edu/catalog/10027/crossing-the-quality -chasm-a-new-health-system-for-the.
2. Archer T, Macario A. The drive for operating room efficiency will increase quality of patient care. Curr Opin Anaesthesiol. 2006;19(2):171-176.
3. Lundy J; Kaiser Family Foundation. Prescription drug trends. https://kaiserfamilyfoundation.files .wordpress.com/2013/01/3057-08.pdf. Published May 2010. Accessed January 26, 2017.
4. Osterberg L, Blaschke T. Adherence to medication. N Engl J Med. 2005;353(5):487-497.
5. DiMatteo MR. Variations in patients’ adherence to medical recommendations: a quantitative review of 50 years of research. Med Care. 2004;42(3):200-209.
6. National Priorities Partnership, NEHI. Improving patient medication adherence: a $100+ billion opportunity. http://adhereforhealth.org/wp-content/uploads/pdf/ImprovingPatientMedicationAdherence-NPP_Patient_Medication_Adherence_NQF.pdf. Published April 2011. Accessed January 26, 2017.
7. Kripalani S, Yao X, Haynes RB. Interventions to enhance medication adherence in chronic medical conditions: a systematic review. Arch Intern Med. 2007;167(6):540-550.
8. Chew JD, Bradley KA, Flum DR, Cornia PB, Koepsell TD. The impact of low health literacy on surgical practice. Am J Surg. 2004;188(3):250-253.
9. van Klei WA, Moons KG, Rutten CL, et al. The effect of outpatient preoperative evaluation of hospital inpatients on cancellation of surgery and length of hospital stay. Anesth Analg. 2002;94(3):644-649.
10. Sanjay P, Dodds A, Miller E, Arumugam PJ, Woodward A. Cancelled elective operations: an observational study from a district general hospital. J Health Organ Manag. 2007;21(1):54-58.
11. Schofield WN, Rubin GL, Piza M, et al. Cancellation of operations on the day of intended surgery at a major Australian referral hospital. Med J Aust. 2005;182(12):612-615.
12. Zafar A, Mufti TS, Griffin S, Ahmed S, Ansari JA. Cancelled elective general surgical operations in Ayub Teaching Hospital. J Ayub Med Coll Abbottabad. 2007;19(3):64-66.
13. Knox M, Myers E, Hurley M. The impact of pre-operative assessment clinics on elective surgical case cancellations. Surgeon. 2009;7(2):76-78.
14. Phruetthiphat OA, Gao Y, Anthony CA, Pugely AJ, Warth LC, Callaghan JJ. Incidence of and preoperative risk factors for surgical delay in primary total hip arthroplasty: analysis from the American College of Surgeons National Surgical Quality Improvement Program. J Arthroplasty. 2016;31(11): 2432-2436.
15. Kohn LT, Corrigan JM, Donaldson MD, eds; Institute of Medicine; Committee on Quality of Health Care in America. To Err Is Human: Building a Safer Health System. Washington, DC: National Academies; 2000. https://www.nap.edu/catalog/9728/to-err-is-human-building-a-safer-health-system.
16. Gawande AA, Thomas EJ, Zinner MJ, Brennan TA. The incidence and nature of surgical adverse events in Colorado and Utah in 1992. Surgery. 1999;126(1):66-75.
17. Bernstein M, Massicotte E, Etchells E. Error in neurosurgery: a prospective pilot study. Can J Neurol Sci. 2001;28(suppl 2):S60.
18. Altpeter T, Luckhardt K, Lewis JN, Harken AH, Polk HC Jr. Expanded surgical time out: a key to real-time data collection and quality improvement. J Am Coll Surg. 2007;204(4):527-532.
19. Dexter F, Marcon E, Epstein RH, Ledolter J. Validation of statistical methods to compare cancellation rates on the day of surgery. Anesth Analg. 2005;101(2):465-473.
20. Etchells E, O’Neill C, Bernstein M. Patient safety in surgery: error detection and prevention. World J Surg. 2003;27(8):936-941.
21. Wong J, Khu KJ, Kaderali Z, Bernstein M. Delays in the operating room: signs of an imperfect system. Can J Surg. 2010;53(3):189-195.
22. Strum DP, Vargas LG, May JH. Surgical subspecialty block utilization and capacity planning: a minimal cost analysis model. Anesthesiology. 1999;90(4):1176-1185.
Combo prevents GVHD, prolongs survival in monkeys

ORLANDO, FL—A 2-drug combination is “an exceptional candidate for clinical translation” as prophylaxis for graft-vs-host disease (GVHD), according to a presenter at the 2017 BMT Tandem Meetings.
The combination consists of sirolimus and KY1005, a monoclonal antibody that binds to OX40L and stops it from activating OX40, a protein that induces prolonged responses in T cells.
Experiments in rhesus macaques showed that KY1005 alone can have a modest effect on GVHD, but the combination of KY1005 and sirolimus can provide long-term, GVHD-free survival.
Victor Tkachev, PhD, of Seattle Children’s Research Institute in Washington, presented these results as one of the “Best Abstracts” at the recent BMT Tandem Meetings (abstract 3). This research was supported by Kymab, the company developing KY1005.
Dr Tkachev and his colleagues tested KY1005 alone and in combination with sirolimus in a previously described model of GVHD. In this model, rhesus macaques that do not receive prophylaxis develop severe GVHD after haploidentical hematopoietic stem cell transplant (HSCT).
For the current study, the animals received no prophylaxis, KY1005 alone, sirolimus alone, or KY1005 plus sirolimus.
When compared to no prophylaxis, KY1005 delayed the progression of acute GVHD and significantly prolonged the survival of HSCT recipients. However, all KY1005-treated animals eventually developed lethal GVHD.
Dr Tkachev noted that KY1005 provided partial control of T-cell activation, decreasing CD4 T-cell proliferation but having no significant effect on CD8 T-cell expansion.
As with KY1005 alone, sirolimus alone delayed GVHD progression and prolonged survival when compared to no GVHD prophylaxis.
However, all animals treated with sirolimus monotherapy eventually developed GVHD and died, and sirolimus alone wasn’t able to control T-cell proliferation.
On the other hand, the combination of KY1005 and sirolimus provided long-term, GVHD-free survival. All of the animals that received this combination survived, without developing GVHD, through day 100 after HSCT.
Dr Tkachev noted that, when given together, KY1005 and sirolimus synergistically controlled both CD4 and CD8 T-cell proliferation. However, this effect did not result in a lack of engraftment. In fact, animals that received the combination “displayed robust hematopoietic reconstitution” and maintained a high number of donor T cells.
Further investigation revealed that combination treatment with KY1005 and sirolimus preserves the reconstitution of regulatory T cells after HSCT and prevents both Th1- and Th17-driven alloimmunity.
Dr Tkachev and his colleagues also found that KY1005 plus sirolimus demonstrates an “unprecedented capacity” to protect against acute GVHD. Results with this combination were superior to those observed with tacrolimus and methotrexate in combination as well as abatacept and sirolimus in combination.
“Taken together, these data suggest that combined prophylaxis with KY1005 plus sirolimus represents an exceptional candidate for clinical translation,” Dr Tkachev concluded.
Kymab has said it will begin testing KY1005 in clinical trials this year. ![]()