User login
Conflicts and the ethical practice of surgery
Once a month in my department, we focus on a case with challenging ethical considerations for part of the discussion at the M & M conference.
Earlier this week, my colleagues and I heard about an unfortunate 87-year-old man, who had been living independently when he developed a partial bowel obstruction. His wife had died over 10 years earlier and, although he lived alone, he had two sons and a daughter who lived close to him and regularly looked in on him and helped him to keep up his small home.
The ethical challenge presented at M & M was the difficulty of determining what was the “best” treatment for this patient and how that decision was reached. The surgical team explained to the patient and his family that there were two broad possibilities for his treatment: definitive resection of the primary tumor or palliative options. In order for him to have a colon resection, the cardiologists felt that he would need coronary artery bypass grafting before surgery. To pursue this course of treatment, they wanted him to have a diverting colostomy before the heart surgery. Then, after a period of recovery from the heart surgery, he could have a colon resection with takedown of the colostomy.
Alternatively, the palliative option of a colonic stent followed by external beam radiation to the lesion was offered. The surgical team tried to present the options in an evenhanded manner so as not to paint either option as being significantly worse. However, even with a definitive resection, the surgeons did not believe that they could cure the patient and they explained this to him and his family.
The patient seemed to have the capacity to make the choice and, although he had originally wanted “everything” done, when he was transferred to our hospital and when presented with these choices, he stated that the palliative option seemed better for him. He told the surgical team that he did not want to have heart surgery, and he did not want to risk dying with a colostomy.
At the end of the family meeting, the surgical team felt that the patient had made a reasonable decision, and they were comfortable with his choice. However, the following day, the patient’s daughter called demanding another meeting with the surgical team. She had been at the family meeting the prior day and stated that, in her opinion, the surgical team had “pushed” the patient to accept the palliative option and that she was not certain that he really had the capacity to make decisions for himself.
During the subsequent meeting with the family, the daughter was the primary spokesperson, but the two sons also seemed in agreement with her assessment that the patient lacked capacity. She stated that the patient was transferred to our medical center in order to allow him to get the treatments that he needed, and now, in her opinion, the surgical team was not pursuing the “best” treatment. She was upset and repeatedly expressed this sentiment.
The surgery team was understandably concerned with this turn of events. They had undertaken their evaluation with constant reassessment of the likely impact of the treatment options on the patient’s quality of life. They had tried to explain the options fully to the patient and involved his family in the discussion. In short, the surgical team had done their best to pursue high-quality ethical care by utilizing shared decision making. Despite spending significant time with the patient and his family, there was now conflict. The patient wanted to pursue a course of treatment that the surgical team felt was appropriate, but the family disagreed and wanted to make the decisions for the patient and pursue a more aggressive approach.
For many physicians, especially the residents who were actively involved in caring for this patient, this outcome – namely, significant conflict with the family and the family feeling that the patient should not be allowed to make his own decisions – seemed to be exactly what the careful attention to the ethical dimension of surgical practice tries to avoid.
Even though most of us try to avoid conflicts with patients and their families, optimal ethical practice does not always result in a consensus of opinions and that lack of conflict. As physicians, we can try to follow all of the ethical guidelines of extensive communication and shared decision making, yet we may still wind up with unhappy patients and families.
The goal of ethical practice should not be to avoid conflicts, but, rather, to treat patients in the manner that helps them to achieve what they value most.
In this present case, what could the surgical team do moving forward? Sometimes conflicts can be solved with additional information. A psychiatry consultation might be helpful to gain an opinion on whether the patient has the capacity to make decisions. Additionally, an ethics consultation might be valuable to gain an outside view to help the family understand the potential merits of a palliative approach. Although this case raises ethical concerns for the surgical team, the conflicts that resulted ought not be seen as a failure of the discussions surrounding the patient’s goals for his treatment.
Most of us prefer to avoid conflicts with patients and their families, but our ultimate goal in the ethical practice of surgery cannot be consensus. Rather, it should be to do the best we can to provide care that helps the patient achieve his or her goals. Unfortunately, we may do everything possible to provide high quality ethical care to patients and conflict still result. However, we cannot use resulting conflict as a reason to avoid the many discussions needed to communicate the options accurately to our patients and their families.
Dr. Angelos is the Linda Kohler Anderson Professor of Surgery and Surgical Ethics, chief of endocrine surgery, and associate director of the MacLean Center for Clinical Medical Ethics at the University of Chicago.
Doing a lot with little – health care in Cuba
Although Cuba lies less than 100 miles from the United States, we Americans tend to know far less about the island nation than about almost any other country in our hemisphere. Only since 2014 has the United States begun to allow its citizens to travel directly to Cuba and has opened official diplomatic relations, although direct trade still remains blocked.
Cuba’s health care system has been touted as providing universal access to primary care services, whose goals are promoting health and preventing disease as well as providing free medical education to a veritable army of health care workers. Less well known are the quality and standards of their surgical services.
Although the Cuban government is a centralized, one-party state that follows the Marxist-Leninist ideology, every individual with whom we met answered our many questions with apparent candor. Perhaps our easy rapport was based to some degree on our common profession and our shared commitment to patient care. Although they were clearly proud of the quality of their free education and medical care, they were also quick to admit the shortcomings in their system: widespread poverty, shortages of food and advanced pharmaceuticals, and old medical facilities. We were not restricted in any way from moving around Havana or speaking with anyone, although our free time was admittedly limited because our busy schedule was crammed with at least two visits per day with the groups listed above.
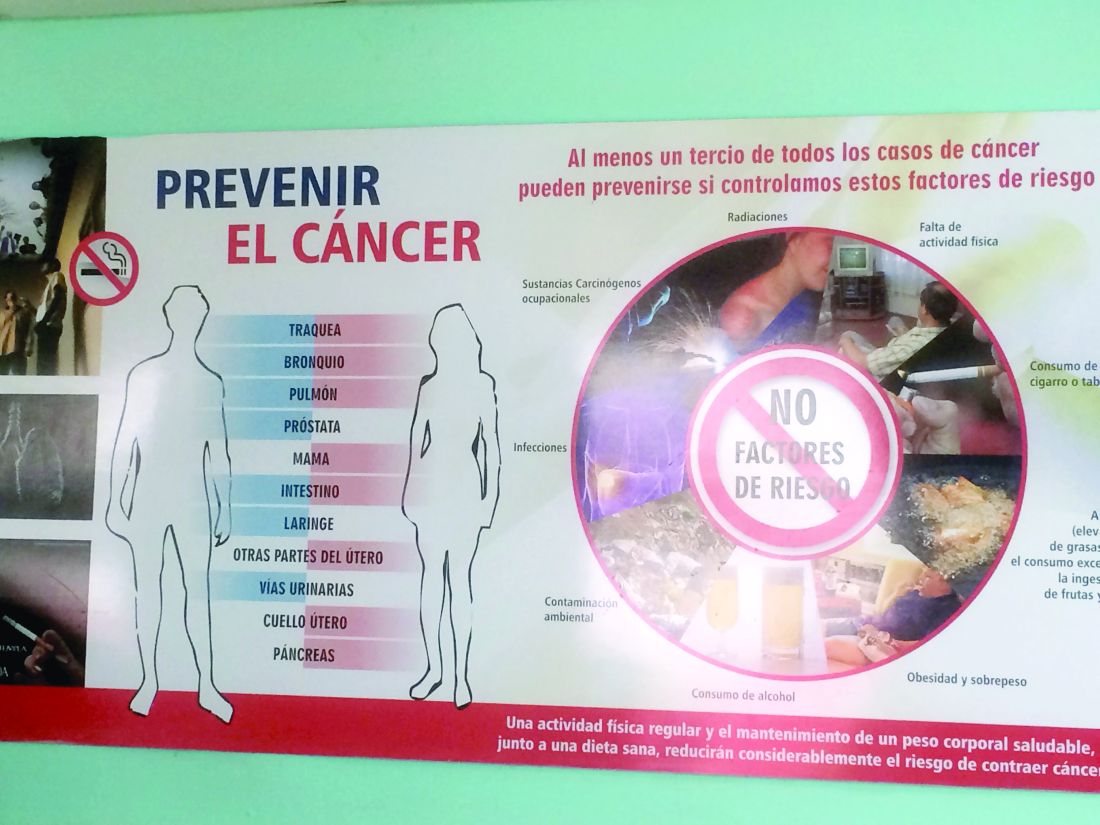
We were interested in looking at how primary care was delivered in Cuba. We met with a primary care doctor in her office, which was situated on the ground floor of the apartment complex in which she and her patients lived. We also visited a polyclinic, two blocks from the primary care doctor’s office that serves as the next step up the chain and is the site where medical and surgical specialists come to consult with patients from 40-60 primary care practices clustered around the polyclinic. The walls of the polyclinic have posters that educate the patients about the importance of handwashing and prevention of hypertension and cancer. The polyclinic also has an epidemiologist who monitors such basic preventive services as immunizations and prenatal care, both of which achieve nearly 100% compliance in a society in which acceptance of these services is not optional. Pap smears are performed in the primary care clinics, as is comprehensive medical care.
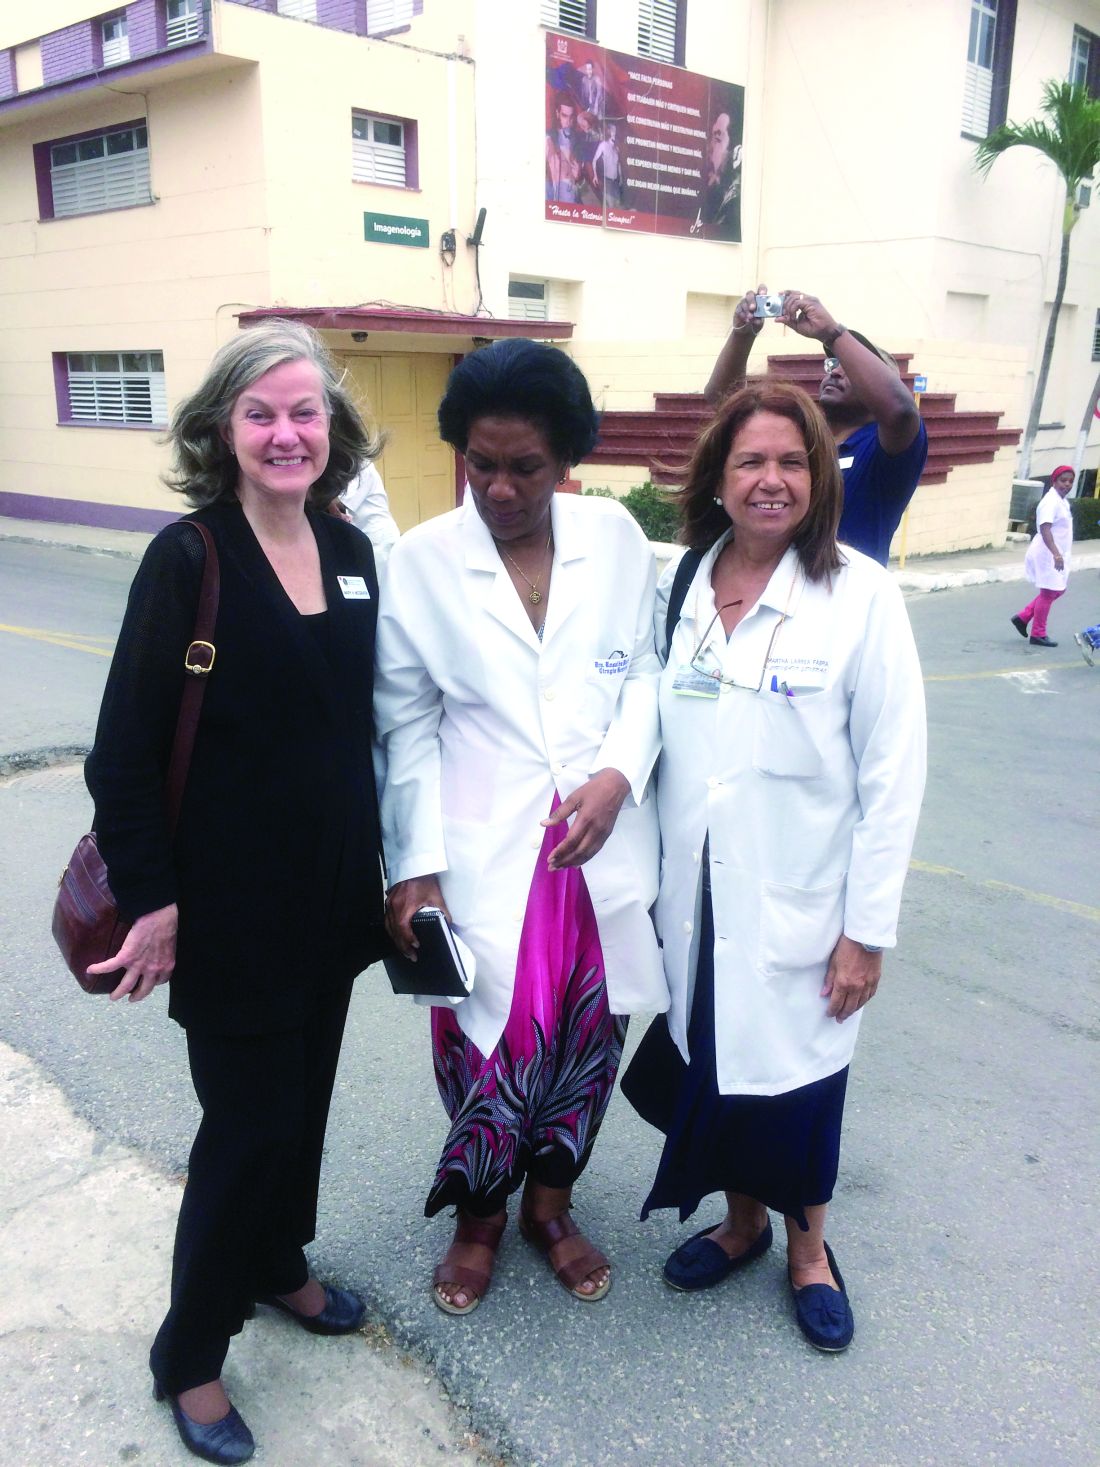
As interesting and impressive as we found the primary care clinics, it was the visits with the surgeons in their hospitals that intrigued us the most. The surgeons we met were modest and collegial, yet proud of what they had accomplished under challenging resource constraints. The hospitals that we visited were reminiscent of the city and county hospitals in the United States in which many of us on the trip had trained in the 1970s: older facilities that were clean and serviceable, but with older, basic equipment. Nevertheless, C. Julian F. Ruiz Torres, MD, has developed minimally invasive surgery in a hospital dedicated to such technological advances. Although he is 72 years old, he still works tirelessly to obtain the resources to build a state-of-the-art surgical simulation center, now under construction. Basic minimally invasive surgical procedures are available in most hospitals, although advanced procedures are restricted to centers such as Dr. Ruiz Torres’ facility, Centro Nacional De Cirugia De Minimo Acceso, of which he is justifiably proud.
In the short time that we were in Cuba, we obviously could observe only a fraction of their entire system. We were unable to determine how representative the health care workers we met were; those we did meet, however, were committed, hard working, and idealistic. Their rewards are clearly not financial, as they are equally (and poorly) paid, earning the same $70/month, no matter what their “rank” in the system.
Whatever the political realities of life in Cuba may be outside of the medical setting, we connected with our fellow physicians and bonded over our shared passion for patient care. This trip was about meeting them and gaining some understanding of their professional challenges and their efforts to work with what they have. Their system has evolved in the unique cultural, political, and economic circumstances of Cuba, and so of course, such a system could never work here. And yet, it was refreshing and inspiring to see medical professionals dedicated to the ideals of our profession – serving the people by delivering the best care they could for all of their patients. My hat is off to them for accomplishing so much despite their limited resources.
Dr. Deveney is professor of surgery and vice chair of education in the department of surgery, Oregon Health & Science University, Portland. She is the coeditor of ACS Surgery News.
Although Cuba lies less than 100 miles from the United States, we Americans tend to know far less about the island nation than about almost any other country in our hemisphere. Only since 2014 has the United States begun to allow its citizens to travel directly to Cuba and has opened official diplomatic relations, although direct trade still remains blocked.
Cuba’s health care system has been touted as providing universal access to primary care services, whose goals are promoting health and preventing disease as well as providing free medical education to a veritable army of health care workers. Less well known are the quality and standards of their surgical services.
Although the Cuban government is a centralized, one-party state that follows the Marxist-Leninist ideology, every individual with whom we met answered our many questions with apparent candor. Perhaps our easy rapport was based to some degree on our common profession and our shared commitment to patient care. Although they were clearly proud of the quality of their free education and medical care, they were also quick to admit the shortcomings in their system: widespread poverty, shortages of food and advanced pharmaceuticals, and old medical facilities. We were not restricted in any way from moving around Havana or speaking with anyone, although our free time was admittedly limited because our busy schedule was crammed with at least two visits per day with the groups listed above.
We were interested in looking at how primary care was delivered in Cuba. We met with a primary care doctor in her office, which was situated on the ground floor of the apartment complex in which she and her patients lived. We also visited a polyclinic, two blocks from the primary care doctor’s office that serves as the next step up the chain and is the site where medical and surgical specialists come to consult with patients from 40-60 primary care practices clustered around the polyclinic. The walls of the polyclinic have posters that educate the patients about the importance of handwashing and prevention of hypertension and cancer. The polyclinic also has an epidemiologist who monitors such basic preventive services as immunizations and prenatal care, both of which achieve nearly 100% compliance in a society in which acceptance of these services is not optional. Pap smears are performed in the primary care clinics, as is comprehensive medical care.
As interesting and impressive as we found the primary care clinics, it was the visits with the surgeons in their hospitals that intrigued us the most. The surgeons we met were modest and collegial, yet proud of what they had accomplished under challenging resource constraints. The hospitals that we visited were reminiscent of the city and county hospitals in the United States in which many of us on the trip had trained in the 1970s: older facilities that were clean and serviceable, but with older, basic equipment. Nevertheless, C. Julian F. Ruiz Torres, MD, has developed minimally invasive surgery in a hospital dedicated to such technological advances. Although he is 72 years old, he still works tirelessly to obtain the resources to build a state-of-the-art surgical simulation center, now under construction. Basic minimally invasive surgical procedures are available in most hospitals, although advanced procedures are restricted to centers such as Dr. Ruiz Torres’ facility, Centro Nacional De Cirugia De Minimo Acceso, of which he is justifiably proud.
In the short time that we were in Cuba, we obviously could observe only a fraction of their entire system. We were unable to determine how representative the health care workers we met were; those we did meet, however, were committed, hard working, and idealistic. Their rewards are clearly not financial, as they are equally (and poorly) paid, earning the same $70/month, no matter what their “rank” in the system.
Whatever the political realities of life in Cuba may be outside of the medical setting, we connected with our fellow physicians and bonded over our shared passion for patient care. This trip was about meeting them and gaining some understanding of their professional challenges and their efforts to work with what they have. Their system has evolved in the unique cultural, political, and economic circumstances of Cuba, and so of course, such a system could never work here. And yet, it was refreshing and inspiring to see medical professionals dedicated to the ideals of our profession – serving the people by delivering the best care they could for all of their patients. My hat is off to them for accomplishing so much despite their limited resources.
Dr. Deveney is professor of surgery and vice chair of education in the department of surgery, Oregon Health & Science University, Portland. She is the coeditor of ACS Surgery News.
From the Washington Office: Reporting global codes data in 2017
On July 1, 2017, the Centers for Medicare and Medicaid Services (CMS) will begin requiring practitioners in nine states who are part of groups of 10 or more to report data on the services that they provide for select 10- and 90-day global surgical codes. The data collected will be used to improve the accuracy of global codes starting in 2019.
Which states are impacted by the requirement to report global codes data?
What data must be reported?
Health care practitioners who meet claims-based data collection requirements will be required to report American Medical Association Current Procedure Terminology (CPT)* code 99024, Postoperative follow-up visit, normally included in the surgical package, to indicate that an evaluation and management service was performed during a postoperative period for a reason(s) related to the original procedure, for every postoperative visit they provide within the global period of a select list of 10- or 90-day global codes. CMS selected 293 services, which are provided to Medicare patients by more than 100 practitioners per year and are either furnished more than 10,000 times or have allowed charges of more than $10 million annually. The agency estimates that these 293 codes describe approximately 87 percent of all furnished 10- and 90-day global services, and approximately 77 percent of all Medicare expenditures for 10- and 90-day global services under the physician fee schedule.
Is claims-based data reporting mandatory? Is there a penalty for failure to report?
Reporting is mandatory. CMS’ goal is to gather data on postoperative visits as part of its effort to improve the accuracy of global code values starting in 2019. CMS has the authority to implement a 5 percent withhold in payment for global services for health care professionals who fail to report but has not implemented the withhold at this time. Although there is no penalty or withhold of payment for failure to report, ACS urges all surgeons required to report data to comply. Failure to report will result in incomplete data and should data analysis of both inpatient and outpatient postsurgical visits not reflect existing global code definitions, new assumptions may be created to redefine postoperative care.
Why is CMS requiring the reporting of global codes data?
For several years, CMS has communicated its concerns about the accuracy of the values assigned to 10- and 90-day global codes. In 2014, CMS proposed to transition all 10- and 90-day global codes to 0-day, with the requirement that postoperative visits would be reported separately. The ACS argued against this transition because it would have resulted in a reduction in surgeons’ reimbursement for 10- and 90-day global services.
Dr. Bailey is a pediatric surgeon, and Medical Director, Advocacy, for the Division of Advocacy and Health Policy in the ACS offices in Washington, DC.
ACS Board of Regents approves new Foundation officers teaser
The American College of Surgeons (ACS) Board of Regents approved new officers of the ACS Foundation Board of Directors at the Regents’ February meeting in Chicago, IL. The new officers, who began their two-year terms in February, are Chair Mary H. McGrath, MD, MPH, FACS, professor of surgery, University of California, San Francisco (UCSF); Vice-Chair Charles E. Lucas, MD, FACS, professor of surgery, Wayne State University, Detroit, MI; and Secretary Ruth L. Bush, MD, JD, MPH, FACS, deputy director, the Center for Innovations in Quality, Effectiveness and Safety, a partnership between the Baylor College of Medicine and the Michael E. DeBakey Veterans Affairs (VA) Medical Center, Houston, TX.
Mary H. McGrath, MD, MPH, FACS
Dr. McGrath is a graduate of St. Louis University School of Medicine, MO, and completed her general surgery residency at the University of Colorado Medical Center, Denver. She then trained in plastic surgery at Yale University School of Medicine, New Haven, CT, and has made outstanding clinical and academic contributions to the field of plastic surgery, especially in the areas of breast and hand surgery, wound healing, introduction of new technology, and workforce issues.
Dr. McGrath’s career as an academic surgeon started at Yale in 1978 with a position as assistant professor of surgery in the school of medicine’s division of plastic and reconstructive surgery. In 1980, she attained the position of assistant professor of surgery, division of plastic and reconstructive surgery, Columbia University College of Physicians and Surgeons, New York, NY. In 1984, she moved to the George Washington University Medical Center, Washington, DC, where she began as chief, division of plastic and reconstructive surgery, and director, residency training program, ultimately ascending to professor of surgery. She has held her present position at UCSF since 2003. She has served in many national positions in plastic surgery and is the present president of the American Association of Plastic Surgeons.
A Fellow of the College since 1983, Dr. McGrath has provided exceptional service to the ACS and has served for 25 years in leadership roles, including First Vice-President (2007–2008); Vice-Chair, Board of Regents (2005–2006); member, Executive Committee, Board of Regents (2002–2006); Regent (1997– 2006); and Chair, Committee on Ethics (2003–2006). She served on the Board of Governors (B/G) Executive Committee and as a Governor-at-Large representing the District of Columbia.
In 2009, the ACS appointed her to serve on the Board of Commissioners of The Joint Commission. She is currently serving her third term in this capacity.
For this remarkable record of service, Dr. McGrath received the College’s highest honor, the Distinguished Service Award, in 2011. She received the ACS Foundation’s Distinguished Philanthropist Award in 2016 for her generous contributions to the College and service to the larger philanthropic community.
Charles E. Lucas, MD, FACS
A native of Detroit, Dr. Lucas has dedicated his surgical career to his hometown. He earned his undergraduate degree from the University of Detroit and his doctor of medicine degree from Wayne State University (WSU). After completing his residency at WSU, he accepted a position on the WSU surgical faculty, specializing in trauma and surgical critical care.
Dr. Lucas conducted his clinical and academic activities at Detroit General Hospital until its closure in 1980. He then moved to the Detroit Medical Center (DMC), practicing at the new Detroit Receiving Hospital (DRH), the Harper University Hospital (HUH), the Hutzel Hospital, and the Karmanos Cancer Hospital. A renowned trauma surgeon, Dr. Lucas was instrumental in securing DRH as the first ACS-verified Level I trauma center in the U.S. He has trained hundreds of medical students and residents, and his research efforts have resulted in the publication of more than 400 peer-reviewed articles, books, and book chapters.
An ACS Fellow since 1970, Dr. Lucas has served in several ACS volunteer roles for more than 35 years, including member, B/G (1984–1990, 1998–2004); President, ACS Michigan Chapter, (1981–1983); and member, Committee on Trauma (1993–2003). He has also been active in a number of surgical organizations, including the American Association for the Surgery of Trauma, American Surgical Association, Central Surgical Association, Midwest Surgical Association, Society of University Surgeons, and Western Surgical Association.
Ruth L. Bush, MD, JD, MPH, FACS
Dr. Bush received her doctor of medicine degree from the University of North Carolina School of Medicine, Chapel Hill, in 1992. She completed her general surgery residency at the University of California, Davis, Medical Center, where she also spent two additional years as a vascular research fellow. She then finished her vascular surgery fellowship at Emory University Hospital, Atlanta, GA. Serving in several academic positions over her career, Dr. Bush was most recently vice-dean and professor of surgery at Texas A&M College of Medicine, Bryan, TX.
Dr. Bush has received several research support funding awards to conduct studies on vascular disease and improved treatment and has published broadly on an array of topics. In addition to service on the ACS Foundation Board, Dr. Bush has been a member of the ACS B/G (2007–2010). She is active in several surgical associations including American Venous Forum, Association of Women Surgeons, and the Society for Vascular Surgery. She has been honored with a number of awards, including Distinguished Fellow (2007) and Presidential Citation (2014), Society of Vascular Surgery; Distinguished Fellow (2015), American Venous Forum; and Outstanding Faculty Teaching Awards, Texas A&M College of Medicine in 2014 and 2015. She continues to practice vascular surgery at the Michael E. DeBakey VA Medical Center.
For more information on the ACS Foundation, contact Shane Hollett, ACS Foundation Executive Director, at 312-202-5506 or [email protected], and visit facs.org/acsfoundation.
Ms. Klein is Director, Donor Relations and Communications, ACS Foundation, Chicago, IL.
CQGS releases preliminary standards for quality surgical care of older adults
The Coalition for Quality in Geriatric Surgery (CQGS), a multidisciplinary coalition representing the ACS and 58 other stakeholder organizations, has released the first comprehensive set of hospital-level surgical care standards for older adults.
The Coalition for Quality in Geriatric Surgery (CQGS), a multidisciplinary coalition representing the American College of Surgeons (ACS) and 58 other stakeholder organizations, has released the first comprehensive set of hospital-level surgical care standards for older adults. The standards have been published on the Annals of Surgery website ahead of print publication in a report titled “Hospital Standards to Promote Optimal Surgical Care of the Older Adult.” (See the article at bit.ly/2p1TmNC.)
These preliminary standards reflect the shift toward interdisciplinary care of surgical patients, while taking into account the unique physiologic changes related to aging and chronic diseases that can leave older patients at risk for postoperative complications. The standards build upon existing quality indicators, National Quality Forum-endorsed quality measures, and previous work by the ACS, American Geriatrics Society, and John A. Hartford Foundation, which have previously collaborated to develop and release two sets of perioperative guidelines. Standards, however, differ from guidelines, as Julia Berian, MD, lead author and ACS Clinical Scholar, notes. “Standards, as they exist in ACS Quality Programs, are more than recommendations—they are elevated to the level of care practices that are expected to be completed,” Dr. Berian said.
The standards are divided into four categories—continuum of care, clinical care, program management, and patient outcomes and follow-up. CQGS stakeholders rated 308 proposed standards of care for whether they are validated means of improving quality of geriatric surgery and can feasibly be implemented. The reviewers rated 306 of the standards as valid and 304 as feasible.
The preliminary standards are undergoing a two-phase pilot process. The alpha phase, which involved engaging 15 end-user hospitals to gain their insight on the possibility of implementing these standards, is nearing completion. The beta phase, which involves actual implementation of the standards in six hospitals, will occur later this year.
Read the full ACS press release at facs.org/media/press-releases/2017/olderadults040617.
Consider applying for two ACS scholarships
The American College of Surgeons (ACS) International Relations Committee has announced the availability of the following scholarships for 2018.
Community Surgeon Travel Awards
The International Relations Committee of the ACS has announced the availability of Community Surgeon Travel Awards. This new program provides a stipend of $4,000 to enable international surgeons ages 30–50 in regional or community hospitals/clinics or financially challenged surgical departments to attend the ACS Clinical Congress 2018.
The complete requirements and the online application form are posted on the College website at facs.org/member-services/scholarships/international/communitytravel. Applications and all related documents are due July 3. For more information, contact [email protected].
International Guest Scholarships
The International Relations Committee of the ACS has announced the availability of International Guest Scholarships for 2018 to young surgeons from countries other than the U.S. or Canada. The scholarships, in the amount of $10,000 each, provide the scholars with an opportunity to visit clinical, teaching, and research activities in the U.S. or Canada, and to attend and participate fully in the educational opportunities and activities of the ACS Clinical Congress.
The complete requirements and the link to the direct online application form appear online on the College’s website at facs.org/member-services/scholarships/international/igs. Applications and all related documents are due July 3. For more information, contact [email protected].
Apply by July 10 for ACS Residents Leading Quality Course
Surgical residents and fellows should plan to attend the American College of Surgeons (ACS) Residents Leading Quality course, a two-day program in quality improvement (QI). The course will take place 12:00 noon–5:00 pm, July 20, and 8:00 am–12:00 noon, July 21, immediately preceding the official start of the inaugural ACS Quality and Safety Conference 2017 in New York, NY.
Course participants will be introduced to the basics of QI, including the identification of a problem, data review, QI models and techniques, and patient and provider engagement strategies. National experts will discuss overcoming barriers and provide advice on careers in QI. The course will use practical case-based scenarios for initiating QI in a surgical practice or hospital.
The course information will prepare participants to return to their institutions ready to engage in quality and safety practices, share ideas with faculty and co-trainees, and disseminate new tools and strategies in compliance with modern recommendations from the Accreditation Council for Graduate Medical Education, the Residency Review Committee, and the American Board of Surgery.
Seating is limited. To be considered for enrollment, e-mail course staff at [email protected] by July 10 with your full name, credentials, institution, and surgical specialty. Describe in 75 words or less any relevant QI experience or aspirations. The course fee is $175 for Resident Members and $250 for non-member residents. (Apply to become a Resident Member of the College at facs.org/member-services/join/resident).
Attendees will be expected to review pre-course materials, and attendee feedback will be used for subsequent course development. A certificate of attendance will be issued upon completion of the program.
Expanded policy restricts health aid to countries that promote abortion
The U.S. State Department is moving forward with an expanded policy that restricts recipients of U.S. global health assistance from performing or promoting abortions.
In January, President Trump reinstated the “Mexico City Policy,” a policy that requires foreign nongovernmental organizations (NGOs) to certify they will not perform or actively promote abortion as a method of family planning using funds from any source as a condition for receiving U.S. global family planning assistance. The policy has been revoked and reinstated by presidential administrations along party lines for the last 32 years. However, President Trump’s order expands the definition of “global health assistance” to include funding for international health programs, such as HIV/AIDS, maternal and child health, malaria, global health security, family planning, and reproductive health care.

“All foreign NGOs will have the opportunity to receive global health assistance awards if they indicate their agreement to abide by the terms of Protecting Life in Global Health Assistance by accepting the provisions in their award,” the department stated. “Given the expansive nature of the new policy, the department will undertake a thorough and comprehensive review of the effectiveness and impact of the policy’s application over the next 6 months, which could include identifying implementation issues, and any other new information affecting implementation going forward.”
Nancy Northup, president and CEO for the Center for Reproductive Rights, called President Trump’s expansion of the “global gag rule” a major assault on those who serve the world’s poorest and most vulnerable women. “This policy does not protect life,” Ms. Northup said in a statement. “It jeopardizes the lives of countless women by withholding critical information and access to the full range of reproductive health care.”
But Rep. Chris Smith (R-N.J.), a supporter of the expanded policy, said it ensures that U.S. taxpayers will no longer subsidize foreign nongovernmental organizations that perform or promote abortion on demand. “This humane policy seeks to respect and protect the precious lives of unborn girls and boys from the violence of abortion,” Rep. Smith said in a statement. “The new policy doesn’t cut global health assistance by so much as a penny.”
[email protected]
On Twitter @legal_med
The U.S. State Department is moving forward with an expanded policy that restricts recipients of U.S. global health assistance from performing or promoting abortions.
In January, President Trump reinstated the “Mexico City Policy,” a policy that requires foreign nongovernmental organizations (NGOs) to certify they will not perform or actively promote abortion as a method of family planning using funds from any source as a condition for receiving U.S. global family planning assistance. The policy has been revoked and reinstated by presidential administrations along party lines for the last 32 years. However, President Trump’s order expands the definition of “global health assistance” to include funding for international health programs, such as HIV/AIDS, maternal and child health, malaria, global health security, family planning, and reproductive health care.
“All foreign NGOs will have the opportunity to receive global health assistance awards if they indicate their agreement to abide by the terms of Protecting Life in Global Health Assistance by accepting the provisions in their award,” the department stated. “Given the expansive nature of the new policy, the department will undertake a thorough and comprehensive review of the effectiveness and impact of the policy’s application over the next 6 months, which could include identifying implementation issues, and any other new information affecting implementation going forward.”
Nancy Northup, president and CEO for the Center for Reproductive Rights, called President Trump’s expansion of the “global gag rule” a major assault on those who serve the world’s poorest and most vulnerable women. “This policy does not protect life,” Ms. Northup said in a statement. “It jeopardizes the lives of countless women by withholding critical information and access to the full range of reproductive health care.”
But Rep. Chris Smith (R-N.J.), a supporter of the expanded policy, said it ensures that U.S. taxpayers will no longer subsidize foreign nongovernmental organizations that perform or promote abortion on demand. “This humane policy seeks to respect and protect the precious lives of unborn girls and boys from the violence of abortion,” Rep. Smith said in a statement. “The new policy doesn’t cut global health assistance by so much as a penny.”
[email protected]
On Twitter @legal_med
Combo antifungal/corticosteroid creams contraindicated in children
Don’t use combination antifungal/corticosteroid medications in children or for treating diaper dermatitis, warned Chikoti M. Wheat, MD, of Johns Hopkins University, Baltimore, and her associates.
Lotrisone is a combination product with a high-potency topical corticosteroid, betamethasone dipropionate 0.05% cream, and a topical antifungal agent, clotrimazole 1% cream. The Food and Drug Administration does not recommend it for the population and indication mentioned above, yet it is often used so off-label, Dr. Wheat and her associates said. Mycolog-II, a combination antifungal/corticosteroid with nystatin, an antiyeast agent, and triamcinolone, a medium-potency topical steroid, was taken off the market in 2015, but patients may still have some that they are inclined to use (J Pediatr. 2017. doi: 0.1016/j.jpeds.2017.03.031).
In a study of 9,797 patients aged 0-14 years who were prescribed either Lotrisone or Mycolog-II creams from 2007 to 2014, pediatricians were most likely to prescribe the combination creams (mean, 810 patients), followed by family physicians (mean, 309 patients), and dermatologists (mean, 49 patients). No pediatric dermatologists prescribed either cream.
Why are these combination creams being used?
Sometimes a fungal infection induces an inflammatory dermatitis. In these cases the use of both an antifungal and a corticosteroid with careful monitoring can benefit the patient, the researchers said. “Research, however, has shown that when combination antifungal/corticosteroid agents are used for fungal infections, they not only result in high rates of recurrence of fungal infections but also have greater side effect profiles.”
Also, in 1984, Lotrisone was approved by the FDA for treating tinea corporis, tinea pedis, and tinea cruris in patients older than 12 years. However, lack of efficacy and severe adverse effects including hypothalamic-pituitary-adrenal axis suppression, Cushing syndrome, hyperglycemia, hirsutism, delayed growth, and skin atrophy led the FDA to recommend that Lotrisone not be prescribed for patients younger than 17 years and not be prescribed to treat diaper dermatitis.
So what should you do?
Dr. Wheat and her associates recommend a single-agent topical antifungal to treat superficial fungal infection. If there is intense itching due to infection-induced dermatitis, add a low- or medium-potency topical corticosteroid for just 7-10 days.
For diaper dermatitis with a confirmed secondary fungal infection, they recommend a topical antifungal agent in combination with a barrier cream. “If intense inflammatory changes are present, a low- to medium-potency topical corticosteroid can be used up to twice daily and tapered over 1-2 weeks with careful monitoring,” they said.
Dr. Wheat and her associates declared they had no conflicts of interest.
[email protected]
FROM THE JOURNAL OF PEDIATRICS
Key clinical point:
Major finding: Pediatricians were most likely to prescribe the combination creams (mean, 810 patients), followed by family physicians (mean, 309 patients), dermatologists (mean, 49 patients), and pediatric dermatologists (none).
Data source: A study of 9,797 patients aged 0-14 years who were prescribed either Lotrisone or Mycolog-II creams from 2007 to 2014.
Disclosures: Dr. Wheat and her associates declared they had no conflicts of interest.
Intraoperative radiation looks good for DCIS
LAS VEGAS – Intraoperative radiation therapy (IORT) is effective in patients with ductal carcinoma in situ (DCIS), and bilateral digital mammography and breast MRI effectively predicted which patients would be most suited for the procedure, according to a nonrandomized study.
The TARGIT-A trial showed that IORT was noninferior to external beam radiation therapy in women with early-stage breast cancer (Lancet. 2014 Feb 15;383:603-13), but the technique hasn’t been tested in DCIS patients.
The researchers conducted a prospective, nonrandomized study of DCIS in women who underwent core biopsy between February 2012 and July 2016 at Virginia Mason Medical Center. Those who elected breast conserving therapy were assessed for IORT using bilateral digital mammography and contrast enhanced MRI.
For criteria, the researchers selected patients over age 44 years with unifocal DCIS and a lesion size of up to 3.0 cm. Physicians recommended additional therapy when the pathology report revealed DCIS larger than 3 cm and/or margins of up to 2 mm.
Of the 57 patients initially enrolled, 7 were found to have invasive disease and were excluded. Another eight patients were excluded because of margins, tumor size, or multifocal disease, and were recommended for additional treatment.
The remaining 42 patients with DCIS were treated with IORT. At a mean follow-up time of 32 months, the researchers observed no local recurrences, and no Radiation Therapy Oncology Group grade 3 or 4 complications were reported.
Hyperpigmentation occurred more often in the IORT group, at 40% (17 of 42 patients), than in the additional treatment group, at 13% (1 of 8), a nonsignificant difference. The hyperpigmentation tended to be minimal and focused on the surgical scar. There were no differences between the groups with respect to superficial wound separation, infection, seroma, fat necrosis, transient radiation dermatitis, or rib fracture.
“Our conclusions are that are selection criteria with mammography and MRI are effective in identifying patients who are appropriate for IORT, and importantly, at 32 months follow-up, no patients had recurrences, so we’re not negatively impacting oncological outcome,” said Dr. Carlson.
The fact that eight patients were recommended for additional treatment based on margins, a disease span greater than 3 cm, or multifocal disease “is actually quite heartening because it implies that the mammogram and the MRI are quite effective at identifying patients that met our criteria,” said Dr. Carlson.
The study is small and had no control group, but Dr. Carlson is confident of the results. “We didn’t do a randomized trial because we believed strongly that IORT will be effective in these patients with good cosmesis. When you compare it to local recurrence rates in the TARGIT-A trial, we’re still doing quite well, so to some extent that can be used as a baseline benchmark,” she said.
AT ASBS 2017
Key clinical point: Intraoperative radiation appears safe and effective, and is more convenient than postoperative radiation.
Major finding: There were no ductal carcinoma in situ recurrences at a median 32 months’ follow-up.
Data source: Uncontrolled, prospective study of 42 patients.
Disclosures: The study was funded by the National Institutes of Health. Dr. Carlson reported having no financial disclosures.