User login
Readability of Orthopedic Trauma Patient Education Materials on the Internet
Take-Home Points
- The Flesch-Kincaid Readability Scale is a useful tool in evaluating the readability of PEMs.
- Only 1 article analyzed in our study was below a sixth-grade readability level.
- Coauthorship of PEMs with other subspecialty groups had no effect on readability.
- Poor health literacy has been associated with poor health outcomes.
- Efforts must be undertaken to make PEMs more readable across medical subspecialties.
Patients increasingly turn to the Internet to self-educate about orthopedic conditions.1,2 Accordingly, the Internet has become a valuable tool in maintaining effective physician-patient communication.3-5 Given the Internet’s importance as a medium for conveying patient information, it is important that orthopedic patient education materials (PEMs) on the Internet provide high-quality information that is easily read by the target patient population. Unfortunately, studies have found that many of the Internet’s orthopedic PEMs have been neither of high quality6-8 nor presented such that they are easy for patients to read and comprehend.1,9-12
Readability, which is the reading comprehension level (school grade level) a person must have to understand written materials, is determined by systematic formulae12; readability levels correlate with the ability to comprehend written information.2 Studies have consistently found that orthopedic PEMs are written at readability levels too high for the average patient to understand.1,9,13 The readability of PEMs in orthopedics as a whole9 and within the orthopedic subspecialties of arthroplasty,1 foot and ankle surgery,2 sports medicine,12 and spine surgery13 has been evaluated, but so far there has been no evaluation of PEMs in orthopedic trauma (OT).
We conducted a study to assess the readability of OT-PEMs available online from the American Academy of Orthopaedic Surgeons (AAOS) in conjunction with the Orthopaedic Trauma Association (OTA) and other orthopedic subspecialty societies. We hypothesized the readability levels of these OT-PEMs would be above the level (sixth to eighth grade) recommended by several healthcare organizations, including the Centers for Disease Control and Prevention.9,11,14 We also assessed the effect that orthopedic subspecialty coauthorship has on PEM readability.
Methods
In July 2014, we searched the AAOS online patient education library (Broken Bones & Injuries section, http://orthoinfo.aaos.org/menus/injury.cfm) and the AAOS OrthoPortal website (Trauma section, http://pubsearch.aaos.org/search?q=trauma&client=OrthoInfo&site=PATIENT&output=xml_no_dtd&proxystylesheet=OrthoInfo&filter=0) for all relevant OT-PEMs. Although OTA does not publish its own PEMs on its website, it coauthored several of the articles in the AAOS patient education library. Other subspecialty organizations, including the American Orthopaedic Society for Sports Medicine (AOSSM), the American Society for Surgery of the Hand (ASSH), the Pediatric Orthopaedic Society of North America (POSNA), the American Shoulder and Elbow Surgeons (ASES), the American Association of Hip and Knee Surgeons (AAHKS), and the American Orthopaedic Foot and Ankle Society (AOFAS), coauthored several of these online OT-PEMs as well.
Using the technique described by Badarudeen and Sabharwal,10 we saved all articles to be included in the study as separate Microsoft Word 2011 files. We saved them in plain-text format to remove any HTML tags and any other hidden formatting that might affect readability results. Then we edited them to remove elements that might affect readability result accuracy—deleted article topic–unrelated information (eg, copyright notice, disclaimers, author information) and all numerals, decimal points, bullets, abbreviations, paragraph breaks, colons, semicolons, and dashes.10Mr. Mohan used the Flesch-Kincaid (FK) Readability Scale to calculate grade level for each article. Microsoft Word 2011 was used as described in other investigations of orthopedic PEM readability2,10,12,13: Its readability function is enabled by going to the Tools tab and then to the Spelling & Grammar tool, where the “Show readability statistics” option is selected.10 Readability scores are calculated with the Spelling & Grammar tool; the readability score is displayed after completion of the spelling-and-grammar check. The formula used to calculate FK grade level is15: (0.39 × average number of words per sentence) + (11.8 × average number of syllables per word) – 15.59.
Statistical Analysis
Descriptive statistics, including means and 95% confidence intervals (CIs), were calculated for the FK grade levels. Student t tests were used to compare average FK grade levels of articles written exclusively by AAOS with those of articles coauthored by AAOS and other orthopedic subspecialty societies. A 2-sample unequal-variance t test was used, and significance was set at P < .05. Total number of articles written at or below the sixth- and eighth-grade levels, the reading levels recommended for PEMs, were tabulated.1,9-12 Intraobserver and interobserver reliabilities were calculated with intraclass correlation coefficients (ICCs): Mr. Mohan, who calculated the FK scores earlier, now 1 week later calculated the readability levels of 15 randomly selected articles10,11; in addition, Mr. Mohan and Dr. Yi independently calculated the readability levels of 30 randomly selected articles.10,11 The same method described earlier—edit plain-text files, then use Microsoft Word to obtain FK scores—was again used. ICCs of 0 to 0.24 correspond to poor correlation; 0.25 to 0.49, low correlation; 0.5 to 0.69, fair correlation; 0.7 to 0.89, good correlation; and 0.9 to 1.0, excellent correlation.10,11 All statistical analyses were performed with Microsoft Excel 2011 and VassarStats (http://vassarstats.net/tu.html).
Results
Of the 115 AAOS website articles included in the study and reviewed, 18 were coauthored by OTA, 10 by AOSSM, 14 by POSNA, 2 by ASSH, 2 by ASES, 1 by AAHKS, 3 by AOFAS, 1 by AOSSM and ASES, and 1 by AOFAS and AOSSM.
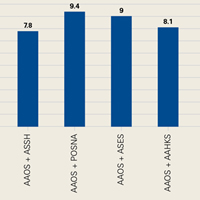
Mean FK grade level was 9.1 (range, 6.2-12; 95% CI, 8.9-9.3) for all articles reviewed and 9.1 (range, 6.2-12; 95% CI, 8.8-9.4) for articles exclusively written by AAOS. For coauthored articles, mean FK grade level was 9.3 (range, 7.6-11.3; 95% CI, 8.8-9.8) for AAOS-OTA; 8.9 (range, 7.4-10.4; 95% CI, 8.4-9.6) for AAOS-AOSSM; 9.4 (range, 7-11.8; 95% CI, 8.9-10.1) for AAOS-POSNA; 7.8 (range, 7.8-9.1; 95% CI, 7.2-9.8) for AAOS-ASSH; 9 (range, 8.2-9.6; 95% CI, 7.6-10.2) for AAOS-ASES; 9 (range, 7.9-9; 95% CI, 7.9-9.3) for AAOS-AOFAS; 8.1 for the 1 AAOS-AAHKS article; 8.5 for the 1 AAOS-AOSSM-ASES article; and 8 for the 1 AAOS-AOFAS-AOSSM article (Figure). 
For FK readability calculations, interobserver reliability (ICC, 0.9982) and intraobserver reliability (ICC, 1) were both excellent.
Discussion
Although increasing numbers of patients are using information from the Internet to inform their healthcare decisions,12 studies have shown that online PEMs are written at a readability level above that of the average patient.1,9,13 In the present study, we also found that OT-PEMs from AAOS are written at a level considerably higher than the recommended sixth-grade reading level,16 potentially impairing patient comprehension and leading to poorer health outcomes.17
The pervasiveness of too-high PEM readability levels has been found across orthopedic subspecialties.2,9,12,13 Following this trend, the OT articles we reviewed had a ninth-grade reading level on average, and only 1 of 115 articles was below the recommended sixth-grade level.10 The issue of too-high PEM readability levels is thus a problem both in OT and in orthopedics in general. Accordingly, efforts to address this problem are warranted, especially as orthopedic PEM readability has not substantially improved over the past several years.18In this study, we also tried to identify any readability differences between articles coauthored by orthopedic societies and articles that were not coauthored by orthopedic societies. We hypothesized that multidisciplinary authorship could improve PEM readability; for example, orthopedic societies could collaborate with other medical specialties (eg, family medicine) that have produced appropriately readable PEMs. One study found that the majority of PEMs from the American Academy of Family Physicians (AAFP) were written below the sixth-grade reading level because of strict organizational regulation of the production of such materials.19 By noting and adopting successful PEM development methods used by groups such as AAFP,19,20 we might be able to improve OT-PEM readability. However, this was not the case in our study, though our observations may have been limited by the small sample of reviewable articles.
One factor contributing to the poor readability of orthopedic PEMs is that orthopedics terminology is complex and includes words that are often difficult to translate into simpler terms without losing their meaning.10 When PEMs are written at a level that is too complex, patients cannot fully comprehend them, which may lead to poor health literacy. This problem may be even more harmful when considering the poor literacy levels of patients at baseline. Kadakia and colleagues16 found that OT patients had poor health literacy; for example, fewer than half knew which bone they fractured. As health literacy is associated with poorer health outcomes and reduced use of healthcare services,21 optimizing patients’ health literacy is of crucial importance to both their education and their outcomes.
Our study should be viewed in light of some important limitations. As OTA does not publish its own PEMs, we assessed only OT-related articles that were available on the AAOS website and were exclusively written by AAOS, or coauthored by AAOS and by OTA and/or another orthopedic subspecialty organization. As these articles represent only a subset of the full spectrum of OT-PEMs available on the Internet, our results may not be generalizable to the entire scope of such materials. However, as AAOS and OTA represent the most authoritative OT organizations, we think these PEMs would be among those most likely to be recommended to patients by their surgeons. In addition, although we used a well-established tool for examining readability—the FK readability scale10-13—this tool has its own inherent limitations, as FK readability grade level is calculated purely on the basis of words per sentence and total syllables per word, and does not take into account other article elements, such as images, which also provide information.1,10 Nevertheless, the FK scale is an inexpensive, easily accessed readability tool that provides a reproducible readability value that is easily comparable to results from earlier studies.10 The final limitation is that we excluded from the study AAOS website articles written in a language other than English. Such articles, however, are important, as a large portion of the patient population speaks English as a second language. Indeed, the readability of Spanish PEMs has been investigated—albeit using a readability measure other than the FK scale—and may be a topic pertinent to orthopedic PEMs.22Most of the literature on the readability of orthopedic PEMs has found their reading levels too high for the average patient to comprehend.1,9-12 The trend continues with our study findings regarding OT-PEMs available online from AAOS. Although the literature on the inadequacies of orthopedic PEMs is vast,1,9-12 more work is needed to improve the quality, accuracy, and readability of these materials. There has been some success in improving PEM readability and producing appropriately readable materials within the medical profession,19,23 so we know that appropriately readable orthopedic PEMs are feasible.
Am J Orthop. 2017;46(3):E190-E194. Copyright Frontline Medical Communications Inc. 2017. All rights reserved.
1. Polishchuk DL, Hashem J, Sabharwal S. Readability of online patient education materials on adult reconstruction web sites. J Arthroplasty. 2012;27(5):716-719.
2. Bluman EM, Foley RP, Chiodo CP. Readability of the patient education section of the AOFAS website. Foot Ankle Int. 2009;30(4):287-291.
3. Hoffmann T, Russell T. Pre-admission orthopaedic occupational therapy home visits conducted using the Internet. J Telemed Telecare. 2008;14(2):83-87.
4. Rider T, Malik M, Chevassut T. Haematology patients and the Internet—the use of on-line health information and the impact on the patient–doctor relationship. Patient Educ Couns. 2014;97(2):223-238.
5. AlGhamdi KM, Moussa NA. Internet use by the public to search for health-related information. Int J Med Inform. 2012;81(6):363-373.
6. Beredjiklian PK, Bozentka DJ, Steinberg DR, Bernstein J. Evaluating the source and content of orthopaedic information on the Internet. The case of carpal tunnel syndrome. J Bone Joint Surg Am. 2000;82(11):1540-1543.
7. Meena S, Palaniswamy A, Chowdhury B. Web-based information on minimally invasive total knee arthroplasty. J Orthop Surg (Hong Kong). 2013;21(3):305-307.
8. Labovitch RS, Bozic KJ, Hansen E. An evaluation of information available on the Internet regarding minimally invasive hip arthroplasty. J Arthroplasty. 2006;21(1):1-5.
9. Badarudeen S, Sabharwal S. Assessing readability of patient education materials: current role in orthopaedics. Clin Orthop Relat Res. 2010;468(10):2572-2580.
10. Badarudeen S, Sabharwal S. Readability of patient education materials from the American Academy of Orthopaedic Surgeons and Pediatric Orthopaedic Society of North America web sites. J Bone Joint Surg Am. 2008;90(1):199-204.
11. Yi PH, Ganta A, Hussein KI, Frank RM, Jawa A. Readability of arthroscopy-related patient education materials from the American Academy of Orthopaedic Surgeons and Arthroscopy Association of North America web sites. Arthroscopy. 2013;29(6):1108-1112.
12. Ganta A, Yi PH, Hussein K, Frank RM. Readability of sports medicine–related patient education materials from the American Academy of Orthopaedic Surgeons and the American Orthopaedic Society for Sports Medicine. Am J Orthop. 2014;43(4):E65-E68.
13. Vives M, Young L, Sabharwal S. Readability of spine-related patient education materials from subspecialty organization and spine practitioner websites. Spine. 2009;34(25):2826-2831.
14. Strategic and Proactive Communication Branch, Division of Communication Services, Office of the Associate Director for Communication, Centers for Disease Control and Prevention, US Department of Health and Human Services. Simply Put: A Guide for Creating Easy-to-Understand Materials. 3rd ed. http://www.cdc.gov/healthliteracy/pdf/Simply_Put.pdf. Published July 2010. Accessed February 7, 2015.
15. Wallace LS, Keenum AJ, DeVoe JE. Evaluation of consumer medical information and oral liquid measuring devices accompanying pediatric prescriptions. Acad Pediatr. 2010;10(4):224-227.
16. Kadakia RJ, Tsahakis JM, Issar NM, et al. Health literacy in an orthopedic trauma patient population: a cross-sectional survey of patient comprehension. J Orthop Trauma. 2013;27(8):467-471.
17. Peterson PN, Shetterly SM, Clarke CL, et al. Health literacy and outcomes among patients with heart failure. JAMA. 2011;305(16):1695-1701.
18. Feghhi DP, Agarwal N, Hansberry DR, Berberian WS, Sabharwal S. Critical review of patient education materials from the American Academy of Orthopaedic Surgeons. Am J Orthop. 2014;43(8):E168-E174.
19. Schoof ML, Wallace LS. Readability of American Academy of Family Physicians patient education materials. Fam Med. 2014;46(4):291-293.
20. Doak CC, Doak LG, Root JH. Teaching Patients With Low Literacy Skills. 2nd ed. Philadelphia, PA: Lippincott; 1996.
21. Berkman ND, Sheridan SL, Donahue KE, Halpern DJ, Crotty K. Low health literacy and health outcomes: an updated systematic review. Ann Intern Med. 2011;155(2):97-107.
22. Berland GK, Elliott MN, Morales LS, et al. Health information on the Internet: accessibility, quality, and readability in English and Spanish. JAMA. 2001;285(20):2612-2621.
23. Sheppard ED, Hyde Z, Florence MN, McGwin G, Kirchner JS, Ponce BA. Improving the readability of online foot and ankle patient education materials. Foot Ankle Int. 2014;35(12):1282-1286.
Take-Home Points
- The Flesch-Kincaid Readability Scale is a useful tool in evaluating the readability of PEMs.
- Only 1 article analyzed in our study was below a sixth-grade readability level.
- Coauthorship of PEMs with other subspecialty groups had no effect on readability.
- Poor health literacy has been associated with poor health outcomes.
- Efforts must be undertaken to make PEMs more readable across medical subspecialties.
Patients increasingly turn to the Internet to self-educate about orthopedic conditions.1,2 Accordingly, the Internet has become a valuable tool in maintaining effective physician-patient communication.3-5 Given the Internet’s importance as a medium for conveying patient information, it is important that orthopedic patient education materials (PEMs) on the Internet provide high-quality information that is easily read by the target patient population. Unfortunately, studies have found that many of the Internet’s orthopedic PEMs have been neither of high quality6-8 nor presented such that they are easy for patients to read and comprehend.1,9-12
Readability, which is the reading comprehension level (school grade level) a person must have to understand written materials, is determined by systematic formulae12; readability levels correlate with the ability to comprehend written information.2 Studies have consistently found that orthopedic PEMs are written at readability levels too high for the average patient to understand.1,9,13 The readability of PEMs in orthopedics as a whole9 and within the orthopedic subspecialties of arthroplasty,1 foot and ankle surgery,2 sports medicine,12 and spine surgery13 has been evaluated, but so far there has been no evaluation of PEMs in orthopedic trauma (OT).
We conducted a study to assess the readability of OT-PEMs available online from the American Academy of Orthopaedic Surgeons (AAOS) in conjunction with the Orthopaedic Trauma Association (OTA) and other orthopedic subspecialty societies. We hypothesized the readability levels of these OT-PEMs would be above the level (sixth to eighth grade) recommended by several healthcare organizations, including the Centers for Disease Control and Prevention.9,11,14 We also assessed the effect that orthopedic subspecialty coauthorship has on PEM readability.
Methods
In July 2014, we searched the AAOS online patient education library (Broken Bones & Injuries section, http://orthoinfo.aaos.org/menus/injury.cfm) and the AAOS OrthoPortal website (Trauma section, http://pubsearch.aaos.org/search?q=trauma&client=OrthoInfo&site=PATIENT&output=xml_no_dtd&proxystylesheet=OrthoInfo&filter=0) for all relevant OT-PEMs. Although OTA does not publish its own PEMs on its website, it coauthored several of the articles in the AAOS patient education library. Other subspecialty organizations, including the American Orthopaedic Society for Sports Medicine (AOSSM), the American Society for Surgery of the Hand (ASSH), the Pediatric Orthopaedic Society of North America (POSNA), the American Shoulder and Elbow Surgeons (ASES), the American Association of Hip and Knee Surgeons (AAHKS), and the American Orthopaedic Foot and Ankle Society (AOFAS), coauthored several of these online OT-PEMs as well.
Using the technique described by Badarudeen and Sabharwal,10 we saved all articles to be included in the study as separate Microsoft Word 2011 files. We saved them in plain-text format to remove any HTML tags and any other hidden formatting that might affect readability results. Then we edited them to remove elements that might affect readability result accuracy—deleted article topic–unrelated information (eg, copyright notice, disclaimers, author information) and all numerals, decimal points, bullets, abbreviations, paragraph breaks, colons, semicolons, and dashes.10Mr. Mohan used the Flesch-Kincaid (FK) Readability Scale to calculate grade level for each article. Microsoft Word 2011 was used as described in other investigations of orthopedic PEM readability2,10,12,13: Its readability function is enabled by going to the Tools tab and then to the Spelling & Grammar tool, where the “Show readability statistics” option is selected.10 Readability scores are calculated with the Spelling & Grammar tool; the readability score is displayed after completion of the spelling-and-grammar check. The formula used to calculate FK grade level is15: (0.39 × average number of words per sentence) + (11.8 × average number of syllables per word) – 15.59.
Statistical Analysis
Descriptive statistics, including means and 95% confidence intervals (CIs), were calculated for the FK grade levels. Student t tests were used to compare average FK grade levels of articles written exclusively by AAOS with those of articles coauthored by AAOS and other orthopedic subspecialty societies. A 2-sample unequal-variance t test was used, and significance was set at P < .05. Total number of articles written at or below the sixth- and eighth-grade levels, the reading levels recommended for PEMs, were tabulated.1,9-12 Intraobserver and interobserver reliabilities were calculated with intraclass correlation coefficients (ICCs): Mr. Mohan, who calculated the FK scores earlier, now 1 week later calculated the readability levels of 15 randomly selected articles10,11; in addition, Mr. Mohan and Dr. Yi independently calculated the readability levels of 30 randomly selected articles.10,11 The same method described earlier—edit plain-text files, then use Microsoft Word to obtain FK scores—was again used. ICCs of 0 to 0.24 correspond to poor correlation; 0.25 to 0.49, low correlation; 0.5 to 0.69, fair correlation; 0.7 to 0.89, good correlation; and 0.9 to 1.0, excellent correlation.10,11 All statistical analyses were performed with Microsoft Excel 2011 and VassarStats (http://vassarstats.net/tu.html).
Results
Of the 115 AAOS website articles included in the study and reviewed, 18 were coauthored by OTA, 10 by AOSSM, 14 by POSNA, 2 by ASSH, 2 by ASES, 1 by AAHKS, 3 by AOFAS, 1 by AOSSM and ASES, and 1 by AOFAS and AOSSM.
Mean FK grade level was 9.1 (range, 6.2-12; 95% CI, 8.9-9.3) for all articles reviewed and 9.1 (range, 6.2-12; 95% CI, 8.8-9.4) for articles exclusively written by AAOS. For coauthored articles, mean FK grade level was 9.3 (range, 7.6-11.3; 95% CI, 8.8-9.8) for AAOS-OTA; 8.9 (range, 7.4-10.4; 95% CI, 8.4-9.6) for AAOS-AOSSM; 9.4 (range, 7-11.8; 95% CI, 8.9-10.1) for AAOS-POSNA; 7.8 (range, 7.8-9.1; 95% CI, 7.2-9.8) for AAOS-ASSH; 9 (range, 8.2-9.6; 95% CI, 7.6-10.2) for AAOS-ASES; 9 (range, 7.9-9; 95% CI, 7.9-9.3) for AAOS-AOFAS; 8.1 for the 1 AAOS-AAHKS article; 8.5 for the 1 AAOS-AOSSM-ASES article; and 8 for the 1 AAOS-AOFAS-AOSSM article (Figure).
For FK readability calculations, interobserver reliability (ICC, 0.9982) and intraobserver reliability (ICC, 1) were both excellent.
Discussion
Although increasing numbers of patients are using information from the Internet to inform their healthcare decisions,12 studies have shown that online PEMs are written at a readability level above that of the average patient.1,9,13 In the present study, we also found that OT-PEMs from AAOS are written at a level considerably higher than the recommended sixth-grade reading level,16 potentially impairing patient comprehension and leading to poorer health outcomes.17
The pervasiveness of too-high PEM readability levels has been found across orthopedic subspecialties.2,9,12,13 Following this trend, the OT articles we reviewed had a ninth-grade reading level on average, and only 1 of 115 articles was below the recommended sixth-grade level.10 The issue of too-high PEM readability levels is thus a problem both in OT and in orthopedics in general. Accordingly, efforts to address this problem are warranted, especially as orthopedic PEM readability has not substantially improved over the past several years.18In this study, we also tried to identify any readability differences between articles coauthored by orthopedic societies and articles that were not coauthored by orthopedic societies. We hypothesized that multidisciplinary authorship could improve PEM readability; for example, orthopedic societies could collaborate with other medical specialties (eg, family medicine) that have produced appropriately readable PEMs. One study found that the majority of PEMs from the American Academy of Family Physicians (AAFP) were written below the sixth-grade reading level because of strict organizational regulation of the production of such materials.19 By noting and adopting successful PEM development methods used by groups such as AAFP,19,20 we might be able to improve OT-PEM readability. However, this was not the case in our study, though our observations may have been limited by the small sample of reviewable articles.
One factor contributing to the poor readability of orthopedic PEMs is that orthopedics terminology is complex and includes words that are often difficult to translate into simpler terms without losing their meaning.10 When PEMs are written at a level that is too complex, patients cannot fully comprehend them, which may lead to poor health literacy. This problem may be even more harmful when considering the poor literacy levels of patients at baseline. Kadakia and colleagues16 found that OT patients had poor health literacy; for example, fewer than half knew which bone they fractured. As health literacy is associated with poorer health outcomes and reduced use of healthcare services,21 optimizing patients’ health literacy is of crucial importance to both their education and their outcomes.
Our study should be viewed in light of some important limitations. As OTA does not publish its own PEMs, we assessed only OT-related articles that were available on the AAOS website and were exclusively written by AAOS, or coauthored by AAOS and by OTA and/or another orthopedic subspecialty organization. As these articles represent only a subset of the full spectrum of OT-PEMs available on the Internet, our results may not be generalizable to the entire scope of such materials. However, as AAOS and OTA represent the most authoritative OT organizations, we think these PEMs would be among those most likely to be recommended to patients by their surgeons. In addition, although we used a well-established tool for examining readability—the FK readability scale10-13—this tool has its own inherent limitations, as FK readability grade level is calculated purely on the basis of words per sentence and total syllables per word, and does not take into account other article elements, such as images, which also provide information.1,10 Nevertheless, the FK scale is an inexpensive, easily accessed readability tool that provides a reproducible readability value that is easily comparable to results from earlier studies.10 The final limitation is that we excluded from the study AAOS website articles written in a language other than English. Such articles, however, are important, as a large portion of the patient population speaks English as a second language. Indeed, the readability of Spanish PEMs has been investigated—albeit using a readability measure other than the FK scale—and may be a topic pertinent to orthopedic PEMs.22Most of the literature on the readability of orthopedic PEMs has found their reading levels too high for the average patient to comprehend.1,9-12 The trend continues with our study findings regarding OT-PEMs available online from AAOS. Although the literature on the inadequacies of orthopedic PEMs is vast,1,9-12 more work is needed to improve the quality, accuracy, and readability of these materials. There has been some success in improving PEM readability and producing appropriately readable materials within the medical profession,19,23 so we know that appropriately readable orthopedic PEMs are feasible.
Am J Orthop. 2017;46(3):E190-E194. Copyright Frontline Medical Communications Inc. 2017. All rights reserved.
1. Polishchuk DL, Hashem J, Sabharwal S. Readability of online patient education materials on adult reconstruction web sites. J Arthroplasty. 2012;27(5):716-719.
2. Bluman EM, Foley RP, Chiodo CP. Readability of the patient education section of the AOFAS website. Foot Ankle Int. 2009;30(4):287-291.
3. Hoffmann T, Russell T. Pre-admission orthopaedic occupational therapy home visits conducted using the Internet. J Telemed Telecare. 2008;14(2):83-87.
4. Rider T, Malik M, Chevassut T. Haematology patients and the Internet—the use of on-line health information and the impact on the patient–doctor relationship. Patient Educ Couns. 2014;97(2):223-238.
5. AlGhamdi KM, Moussa NA. Internet use by the public to search for health-related information. Int J Med Inform. 2012;81(6):363-373.
6. Beredjiklian PK, Bozentka DJ, Steinberg DR, Bernstein J. Evaluating the source and content of orthopaedic information on the Internet. The case of carpal tunnel syndrome. J Bone Joint Surg Am. 2000;82(11):1540-1543.
7. Meena S, Palaniswamy A, Chowdhury B. Web-based information on minimally invasive total knee arthroplasty. J Orthop Surg (Hong Kong). 2013;21(3):305-307.
8. Labovitch RS, Bozic KJ, Hansen E. An evaluation of information available on the Internet regarding minimally invasive hip arthroplasty. J Arthroplasty. 2006;21(1):1-5.
9. Badarudeen S, Sabharwal S. Assessing readability of patient education materials: current role in orthopaedics. Clin Orthop Relat Res. 2010;468(10):2572-2580.
10. Badarudeen S, Sabharwal S. Readability of patient education materials from the American Academy of Orthopaedic Surgeons and Pediatric Orthopaedic Society of North America web sites. J Bone Joint Surg Am. 2008;90(1):199-204.
11. Yi PH, Ganta A, Hussein KI, Frank RM, Jawa A. Readability of arthroscopy-related patient education materials from the American Academy of Orthopaedic Surgeons and Arthroscopy Association of North America web sites. Arthroscopy. 2013;29(6):1108-1112.
12. Ganta A, Yi PH, Hussein K, Frank RM. Readability of sports medicine–related patient education materials from the American Academy of Orthopaedic Surgeons and the American Orthopaedic Society for Sports Medicine. Am J Orthop. 2014;43(4):E65-E68.
13. Vives M, Young L, Sabharwal S. Readability of spine-related patient education materials from subspecialty organization and spine practitioner websites. Spine. 2009;34(25):2826-2831.
14. Strategic and Proactive Communication Branch, Division of Communication Services, Office of the Associate Director for Communication, Centers for Disease Control and Prevention, US Department of Health and Human Services. Simply Put: A Guide for Creating Easy-to-Understand Materials. 3rd ed. http://www.cdc.gov/healthliteracy/pdf/Simply_Put.pdf. Published July 2010. Accessed February 7, 2015.
15. Wallace LS, Keenum AJ, DeVoe JE. Evaluation of consumer medical information and oral liquid measuring devices accompanying pediatric prescriptions. Acad Pediatr. 2010;10(4):224-227.
16. Kadakia RJ, Tsahakis JM, Issar NM, et al. Health literacy in an orthopedic trauma patient population: a cross-sectional survey of patient comprehension. J Orthop Trauma. 2013;27(8):467-471.
17. Peterson PN, Shetterly SM, Clarke CL, et al. Health literacy and outcomes among patients with heart failure. JAMA. 2011;305(16):1695-1701.
18. Feghhi DP, Agarwal N, Hansberry DR, Berberian WS, Sabharwal S. Critical review of patient education materials from the American Academy of Orthopaedic Surgeons. Am J Orthop. 2014;43(8):E168-E174.
19. Schoof ML, Wallace LS. Readability of American Academy of Family Physicians patient education materials. Fam Med. 2014;46(4):291-293.
20. Doak CC, Doak LG, Root JH. Teaching Patients With Low Literacy Skills. 2nd ed. Philadelphia, PA: Lippincott; 1996.
21. Berkman ND, Sheridan SL, Donahue KE, Halpern DJ, Crotty K. Low health literacy and health outcomes: an updated systematic review. Ann Intern Med. 2011;155(2):97-107.
22. Berland GK, Elliott MN, Morales LS, et al. Health information on the Internet: accessibility, quality, and readability in English and Spanish. JAMA. 2001;285(20):2612-2621.
23. Sheppard ED, Hyde Z, Florence MN, McGwin G, Kirchner JS, Ponce BA. Improving the readability of online foot and ankle patient education materials. Foot Ankle Int. 2014;35(12):1282-1286.
In good-candidate CLL, don’t wait too long for alloHCT
NEW YORK – Allogeneic hematopoietic stem cell transplantation (alloHCT) using HLA-compatible donors results in excellent long-term progression-free survival in younger high-risk chronic lymphocytic leukemia (CLL) patients, an analysis of data from a European Society for Blood and Marrow Transplantation registry cohort suggests.
AlloHCT may, in some patients, be preferable to sequential targeted therapy, according to Michel van Gelder, MD.

This is especially true for those progressing with Richter’s syndrome, who comprise about one-third of patients, he noted.
“On the other hand, allogeneic stem cell transplantation can induce prolonged progression-free survival,” said Dr. van Gelder of Maastricht (the Netherlands) University Medical Center.
Further, most alloHCT patients become minimal residual disease negative, which predicts prolonged progression-free survival (PFS).
“The down-side, of course, is nonrelapse mortality,” he said, noting that NRM depends on factors such as age, performance status, and HLA match.
In a recent risk factor analysis currently pending publication, he and his colleagues found, in a large group of patients, that age, performance status, remission at time of transplant, donor relationship, HLA and sex match each had an impact on 5-year PFS after alloHCT.
The more risk factors a patient had, the worse the outcome, he said.
Based on current knowledge, the place for alloHCT in CLL treatment is in patients with high-risk cytogenetics. Patients can be treated first with a kinase inhibitor or venetoclax followed by transplant, or they can wait for progression and then do the transplant, he said.
Those without high risk cytogenetics but with short PFS after treatment with a kinase inhibitor or venetoclax may also be candidates for alloHCT, he added.
“Preferably they should be young [and] have a good matched donor and low comorbidity,” he said.
In the current study, the focus was on younger CLL patients. “We tried to identify factors that predict for a low 2-year NRM and a high 8-year PFS. We studied the impact of high risk cytogenetics, and, for this study, we chose del(17p) and del(11q), and we tried to officialize the PFS, the relapse incidence, and the nonrelapse mortality of so-called ‘good transplant risk CLL patients’ with these high cytogenetic risk factors,” he explained.
In 197 patients under age 50 years (median 46 years) with a median follow-up of 90 months in an updated EBMT registry cohort, the most important relevant prognostic factor for 2-year NRM was the donor HLA match (adjusted hazard ratio, 2.5 for a matched unrelated donor, 4.0 for a partially matched unrelated donor, both vs. a matched sibling), and predictors for poor 8-year PFS were no remission at the time of alloHCT (hazard ratio, 1.7), and partially HLA matched unrelated donor (HR, 2.8).
High-risk cytogenetics did not significantly impact 8-year PFS, Dr. van Gelder said, noting that this confirms findings from prior studies.
Most of the patients included in the analysis were fludarabine refractory, 70% had del(17p), 35% had del(11q), and the median number of prior treatments was 3. Additionally, 12% had previous autologous transplant, 62% had remission at time of transplant, and most had good performance status, he said.
Conditioning regimens varied by site, 42% of patients had an HLA-matched sibling donor, and 50% had a matched unrelated donor.
Based on the regression model, a reference patient with high risk cytogenetics (del[17p] and/or del[11q]) and good transplant characteristics (age 46 years, no prior autologous stem cell transplantation, remission at the time of alloHCT and HLA- and sex-matched sibling donor) was created. A reference patient with poor transplant characteristics (not in remission at the time of transplant, with an unrelated, non-sex-matched donor) was also created. The predicted 2-year NRM for the good transplant risk patient was 12.1%, and 8-year PFS was more than 50%, Dr. van Gelder said.
For the poor risk patient, 2-year NRM was 37%, and PFS was below 50%, he said.
“So, in conclusion ... good transplant risk young patients with a low nonrelapse mortality and high 8-year progression-free survival can be identified,” he said.
The problem in clinical practice is determining whether – and when – to do a transplant in a young patient, he continued.
“There are a lot of possibilities. Nobody knows, of course, what is the best regimen, but a problem in these patients is that, if they have progression with Richter’s transformation, then you are lost,” he said. “So, if you would like to prevent this, and you have a patient with a low nonrelapse mortality risk, maybe it is better to do the transplant before.”
As for whether alloHCT can be done after kinase inhibitor therapy, the data are limited, but data presented at EBMT 2017 suggest the approach is feasible and effective. In 43 younger patients who underwent alloHCT after ibrutinib treatment, including 37% with TP53 mutation, the 1-year NRM and PFS rates were 9% and 63%, which is “in the same range as in the era before kinase inhibitors,” Dr. van Gelder said regarding the abstract presented by Peter Dreger, MD.
In 32 patients who underwent alloHCT after idelalisib treatment, including 44% with del(17p)/del(11q) and 85% in remission at the time of alloHCT, early follow-up showed that 6-month NRM and PFS was 7% and 83%, respectively, according to another abstract presented by Johannes Schetelig, MD.
“It’s all about balancing the risks. On the one hand you can use sequential therapies. On the other, if you have patients with high-risk cytogenetics [and] CLL in remission and you have a well-matched donor, maybe you should consider the transplant earlier, Dr. van Gelder said. “If you have a good transplant patient in remission, I would propose [that you] don’t wait too long.”
Dr. van Gelder reported having no relevant disclosures.
NEW YORK – Allogeneic hematopoietic stem cell transplantation (alloHCT) using HLA-compatible donors results in excellent long-term progression-free survival in younger high-risk chronic lymphocytic leukemia (CLL) patients, an analysis of data from a European Society for Blood and Marrow Transplantation registry cohort suggests.
AlloHCT may, in some patients, be preferable to sequential targeted therapy, according to Michel van Gelder, MD.
This is especially true for those progressing with Richter’s syndrome, who comprise about one-third of patients, he noted.
“On the other hand, allogeneic stem cell transplantation can induce prolonged progression-free survival,” said Dr. van Gelder of Maastricht (the Netherlands) University Medical Center.
Further, most alloHCT patients become minimal residual disease negative, which predicts prolonged progression-free survival (PFS).
“The down-side, of course, is nonrelapse mortality,” he said, noting that NRM depends on factors such as age, performance status, and HLA match.
In a recent risk factor analysis currently pending publication, he and his colleagues found, in a large group of patients, that age, performance status, remission at time of transplant, donor relationship, HLA and sex match each had an impact on 5-year PFS after alloHCT.
The more risk factors a patient had, the worse the outcome, he said.
Based on current knowledge, the place for alloHCT in CLL treatment is in patients with high-risk cytogenetics. Patients can be treated first with a kinase inhibitor or venetoclax followed by transplant, or they can wait for progression and then do the transplant, he said.
Those without high risk cytogenetics but with short PFS after treatment with a kinase inhibitor or venetoclax may also be candidates for alloHCT, he added.
“Preferably they should be young [and] have a good matched donor and low comorbidity,” he said.
In the current study, the focus was on younger CLL patients. “We tried to identify factors that predict for a low 2-year NRM and a high 8-year PFS. We studied the impact of high risk cytogenetics, and, for this study, we chose del(17p) and del(11q), and we tried to officialize the PFS, the relapse incidence, and the nonrelapse mortality of so-called ‘good transplant risk CLL patients’ with these high cytogenetic risk factors,” he explained.
In 197 patients under age 50 years (median 46 years) with a median follow-up of 90 months in an updated EBMT registry cohort, the most important relevant prognostic factor for 2-year NRM was the donor HLA match (adjusted hazard ratio, 2.5 for a matched unrelated donor, 4.0 for a partially matched unrelated donor, both vs. a matched sibling), and predictors for poor 8-year PFS were no remission at the time of alloHCT (hazard ratio, 1.7), and partially HLA matched unrelated donor (HR, 2.8).
High-risk cytogenetics did not significantly impact 8-year PFS, Dr. van Gelder said, noting that this confirms findings from prior studies.
Most of the patients included in the analysis were fludarabine refractory, 70% had del(17p), 35% had del(11q), and the median number of prior treatments was 3. Additionally, 12% had previous autologous transplant, 62% had remission at time of transplant, and most had good performance status, he said.
Conditioning regimens varied by site, 42% of patients had an HLA-matched sibling donor, and 50% had a matched unrelated donor.
Based on the regression model, a reference patient with high risk cytogenetics (del[17p] and/or del[11q]) and good transplant characteristics (age 46 years, no prior autologous stem cell transplantation, remission at the time of alloHCT and HLA- and sex-matched sibling donor) was created. A reference patient with poor transplant characteristics (not in remission at the time of transplant, with an unrelated, non-sex-matched donor) was also created. The predicted 2-year NRM for the good transplant risk patient was 12.1%, and 8-year PFS was more than 50%, Dr. van Gelder said.
For the poor risk patient, 2-year NRM was 37%, and PFS was below 50%, he said.
“So, in conclusion ... good transplant risk young patients with a low nonrelapse mortality and high 8-year progression-free survival can be identified,” he said.
The problem in clinical practice is determining whether – and when – to do a transplant in a young patient, he continued.
“There are a lot of possibilities. Nobody knows, of course, what is the best regimen, but a problem in these patients is that, if they have progression with Richter’s transformation, then you are lost,” he said. “So, if you would like to prevent this, and you have a patient with a low nonrelapse mortality risk, maybe it is better to do the transplant before.”
As for whether alloHCT can be done after kinase inhibitor therapy, the data are limited, but data presented at EBMT 2017 suggest the approach is feasible and effective. In 43 younger patients who underwent alloHCT after ibrutinib treatment, including 37% with TP53 mutation, the 1-year NRM and PFS rates were 9% and 63%, which is “in the same range as in the era before kinase inhibitors,” Dr. van Gelder said regarding the abstract presented by Peter Dreger, MD.
In 32 patients who underwent alloHCT after idelalisib treatment, including 44% with del(17p)/del(11q) and 85% in remission at the time of alloHCT, early follow-up showed that 6-month NRM and PFS was 7% and 83%, respectively, according to another abstract presented by Johannes Schetelig, MD.
“It’s all about balancing the risks. On the one hand you can use sequential therapies. On the other, if you have patients with high-risk cytogenetics [and] CLL in remission and you have a well-matched donor, maybe you should consider the transplant earlier, Dr. van Gelder said. “If you have a good transplant patient in remission, I would propose [that you] don’t wait too long.”
Dr. van Gelder reported having no relevant disclosures.
AT THE IWCLL MEETING
Key clinical point:
Major finding: The predicted 2-year nonrelapse mortality was 12.1% for a patient who is a good transplant risk and predicted 8-year PFS was more than 50%.
Data source: An analysis of updated registry data for 197 patients.
Disclosures: Dr. van Gelder reported having no relevant disclosures
Results prove lasting from iCBT in mild to moderate depression
SAN DIEGO – Cognitive-behavioral therapy (CPT) interventions delivered online are effective in reducing symptoms of mild to moderate depression in adults, according to results presented at the annual meeting of the American Psychiatric Association.
The findings, presented by Charles Koransky, MD, of the University of Maryland, Baltimore, derive from a meta-analysis of 14 randomized studies, conducted between 2005 and 2015, that enrolled more than 1,600 patients aged 18 years and older in Europe and Australia.
Patients in the studies were not receiving any other form of therapy, though some studies allowed concurrent use of antidepressant medications.
Results from patients assigned to the web-based interventions, which lasted 1 month or more, were compared with those who remained on waiting lists for treatment. Most of the interventions included brief clinician contact as part of their designs. Others were entirely self-guided.
Dr. Koransky and his colleagues found that completion rates were high, with between 55% and 93% of patients finishing the assigned interventions. The intervention groups saw significant improvement in symptoms after the online CBT interventions, with a standard mean difference of 0.74 (95% confidence interval, 0.63-0.86; P less than 0.001), compared with patients randomized to wait lists.
For the 11 studies that included between 3- and 6-months’ follow-up, improvement in depressive symptoms was seen to be durable, with a large SMD of 0.85 (95% CI, 0.79-0.90; P less than 0.001). “This shows that the effects last,” Dr. Koransky told conference attendees.
Dr. Koransky noted that statistically significant difference was seen between the studies with interventions that included clinician contact and those that did not. “This is probably because the clinician contact in the studies was brief, 10-minute chats or emails,” he said.
“Internet-based CBT leads to immediate and sustained reduction of depressive symptoms, which is consistent with analyses in the past,” Dr. Koransky said. “We also found that iCBT may be a good option for patients not able to access traditional face-to-face therapy,” he said, noting that several of the interventions in the study were designed to help address access issues in rural Australia.
Dr. Koransky noted that the results might not be generalizable because of the large portion of female patients across studies – more than 75% – and the fact that all patients were recruited through advertisements, suggesting that these were “highly motivated participants seeking some alleviation of their symptoms.” Another limitation of the study was a lack of uniformity across iCBT interfaces.
Nonetheless, he said, the findings have implications for U.S. practitioners, particularly primary care doctors in regions with poor access to mental health specialists.
Internet-delivered CBT may be “great for people in rural settings, especially if prescribed by primary care providers who don’t have the training to provide CBT,” he said.
Dr. Koransky said his group aimed to study these interventions in a U.S. population and among patients referred to iCBT by their primary care doctors. The researchers disclosed no conflicts of interest related to their findings.
AT APA
Key clinical point: CBT delivered online with minimal therapist involvement can produce immediate and sustained reduction of depressive symptoms.
Major finding: Treatment groups saw a standard mean difference of 0.74 vs. nontreated patients immediately after intervention and 0.85 after 3-6 months follow-up (P less than 0.001 for both) .
Data source: A meta-analysis of 14 randomized, controlled trials from Europe and Australia randomizing 1,600 patients to online CBT or a wait list for care.
Disclosures: The researchers disclosed no conflicts of interest related to their findings.
Benefit of rtPA in acute ischemic stroke doesn’t diminish with weight over 100 kg
BOSTON – Body weight over 100 kg in acute ischemic stroke patients does not reduce the clinical benefit derived from a 90-mg fixed dose of intravenous recombinant tissue plasminogen activator, according to a pooled analysis of data from three randomized clinical trials.
Prior small studies have suggested that the magnitude of benefit with intravenous recombinant tissue plasminogen activator (IV rtPA) is reduced in patients with body weight over 100 kg who receive less than 0.9 mg/kg of IV rtPA under current guidelines. However, in the current study, the rate of favorable outcomes at 90 days – defined as modified Rankin scale score of 0-2 – did not differ significantly between 872 patients with weight at or below 100 kg and 105 with body weight over 100 kg (and up to 190 kg) after adjustment for patient demographics, stroke severity, and 90-day modified Rankin scale score (adjusted odds ratio, 0.99), Shahram Majidi, MD, said at the annual meeting of the American Academy of Neurology.
The results were similar when patients with NIHSS score less than 8 were excluded, and when those with weight over 150 kg were compared with those with weight at 100 kg or less, Dr. Majidi said.
There were only eight patients who weighed more than 150 kg, but those patients did very well at 90 days, and had favorable outcomes that were comparable to those in the lower weight group, he noted.
“Body weight more than 100 kg, and receiving less than 0.9 mg/kg of IV rtPA, did not reduce the benefit of IV rtPA in acute ischemic stroke patients, and our results support the current recommendations from the American Stroke Association,” Dr. Majidi concluded.
Dr. Majidi reported having no disclosures.
Key clinical point:
Major finding: Patients with weight at or below 100 kg and those with weight over 100 kg had a similar rate of favorable outcome at 90 days (adjusted OR, 0.99).
Data source: A pooled analysis of data from 977 patients in three randomized trials.
Disclosures: Dr. Majidi reported having no disclosures.
PCV10 vaccination in Brazil nearly eliminated serotypes
The effect of 10-valent pneumococcal conjugate vaccine (PCV10) after 4 years of routine childhood vaccination in Brazil was near elimination of PCV10 serotypes in a study of over 500 children, said Felipe P.G. Neves, PhD, of the University of California, Berkeley, and his associates.
The emergence of multidrug-resistant (MDR) serotype 6C isolates, however, is of concern, they said.
Of the 284 children who attended a public clinic and 238 children who went to two private clinics in the greater Rio de Janeiro metropolitan area between Sept. 29 and Dec. 5, 2014, 118 (23%) were pneumococcal carriers. Their median age was 2 years and all were under age 6 years. All 118 isolates were susceptible to levofloxacin, rifampicin, and vancomycin; 26 (22%) isolates were MDR, and 14 of the 18 serotype 6C isolates were MDR.
“Serotype 6C has already been reported as having caused meningitis in the pre-PCV10 era in northeastern Brazil. Additionally, following PCV7 implementation, carriage with serotype 6C emerged worldwide and reflected in an increase in IPD [invasive pneumococcal disease] cases,” Dr. Neves and his associates said. “Considering the apparent consistency of MDR 6C as the most common serotype associated with colonization in Brazil after PCV10 universal use, ongoing surveillance to monitor its increase in invasive diseases in Brazil is warranted.”
Read more in Vaccine (2017 May 15;35[21]:2794-800).
FROM VACCINE
PNSP rates did not increase after PCV13 introduction
Streptococcus pneumoniae did not grow more resistant to penicillin after the introduction of 13-valent pneumococcal conjugate vaccine, though geographic differences remained, according to Cheryl P. Andam, Ph.D., and her associates.
Data from the Active Bacterial Core surveillance system on 285 patients before introduction of PCV13 and from 339 patients after PCV13 introduction were used in the study. Patients were from California, Colorado, Connecticut, Georgia, Maryland, Minnesota, New Mexico, New York, Oregon, and Tennessee. New Mexico, Maryland, and Georgia saw the largest increases in penicillin-nonsusceptible pneumococcus (PNSP) rates, while Colorado, New York, and Connecticut saw decreases. No change was seen in the nationwide PNSP rate.
Preintroduction of PCV13, geographic heterogeneity in serotype distribution, and serotype-specific differences in penicillin resistance were equally responsible for geographic variation in PNSP rates. Although no significant change was seen after introduction, influence of serotype-specific differences did decrease slightly while geographic heterogeneity of PSNP serotypes increased.
“Further long-term nationwide surveillance of serotype dynamics is required to assess the multiple ecologic factors that influence antibiotic resistance in the pneumococcus in the conjugate vaccine era,” the investigators concluded.
Find the full research letter in Emerging Infectious Diseases (doi: 10.3201/eid2306.161331).
FROM EMERGING INFECTIOUS DISEASES
HM17 session summary: Building a practice that people want to be part of
Presenters
Roberta Himebaugh MBA, SHM; John Nelson, MD, FACP, MHM; Jerome Siy, MD, SFHM
Session summary
Creating a “culture of ownership” by recruiting the right people, promoting physician leadership, and improving structural elements such as compensation model and schedule were topics discussed in this practice management precourse at HM17.
The presenters said leaders must reduce hierarchy and promote shared decision making among the group, while instilling a “thank you culture” that recognizes motivations such as autonomy, mastery, and purpose.

Leaders must also consider current changes in health care payment models, such as MIPS (Merit-based Incentive Payment System), bundled payments, and Hospital Value-based Purchasing. Hospitalist groups must be prepared for these changes by learning about them and looking for potential cost reduction opportunities (e.g., reducing the number of patients going to skilled nursing facilities after joint replacement by sending patients home whenever possible).
Promoting a culture of engagement might include the development of interpersonal support strategies (e.g., meditation and mindfulness), innovative staffing (is 7 on/7 off right for everyone?), and comprehensive support for career and leadership development.
Finally, hospitalists should give special attention to the value formula by focusing on improving patient outcomes and experience, but also reducing direct and indirect costs. This is crucial for the sustainability of any hospitalist group.
Key takeaways for HM
• Create a culture of ownership to promote engagement and job satisfaction.
• Make adjustments to schedule and workflow to improve efficiency.
• Prepare for evolving pay-for-performance programs.
• Demonstrate the value of the group by setting expectations with key stakeholders, developing a practice score, and providing effective feedback to providers.
Dr. Villagra is a chief hospitalist in Batesville, Ark., and an editorial board member of The Hospitalist.
Presenters
Roberta Himebaugh MBA, SHM; John Nelson, MD, FACP, MHM; Jerome Siy, MD, SFHM
Session summary
Creating a “culture of ownership” by recruiting the right people, promoting physician leadership, and improving structural elements such as compensation model and schedule were topics discussed in this practice management precourse at HM17.
The presenters said leaders must reduce hierarchy and promote shared decision making among the group, while instilling a “thank you culture” that recognizes motivations such as autonomy, mastery, and purpose.
Leaders must also consider current changes in health care payment models, such as MIPS (Merit-based Incentive Payment System), bundled payments, and Hospital Value-based Purchasing. Hospitalist groups must be prepared for these changes by learning about them and looking for potential cost reduction opportunities (e.g., reducing the number of patients going to skilled nursing facilities after joint replacement by sending patients home whenever possible).
Promoting a culture of engagement might include the development of interpersonal support strategies (e.g., meditation and mindfulness), innovative staffing (is 7 on/7 off right for everyone?), and comprehensive support for career and leadership development.
Finally, hospitalists should give special attention to the value formula by focusing on improving patient outcomes and experience, but also reducing direct and indirect costs. This is crucial for the sustainability of any hospitalist group.
Key takeaways for HM
• Create a culture of ownership to promote engagement and job satisfaction.
• Make adjustments to schedule and workflow to improve efficiency.
• Prepare for evolving pay-for-performance programs.
• Demonstrate the value of the group by setting expectations with key stakeholders, developing a practice score, and providing effective feedback to providers.
Dr. Villagra is a chief hospitalist in Batesville, Ark., and an editorial board member of The Hospitalist.
The Design and Implementation of a Home-Based Cardiac Rehabilitation Program
Despite a 30% decline in heart disease mortality from 2001 to 2011, heart disease prevalence is on the rise, responsible for 1 of every 3 deaths in the U.S.1 Cardiac rehabilitation (CR) is an evidence-based, secondary prevention strategy that has been proven effective in preventing future cardiovascular events and decreasing heart disease mortality.2-4 The American Association of Cardiovascular and Pulmonary Rehabilitation (AACVPR) is the leading authority on CR and provides guidelines for CR programs. The AACVPR and the American Heart Association (AHA) published core components for CR programs deemed essential for all CR/secondary prevention programs, including evaluations, interventions, and expected outcomes.5 These core components are aimed at promoting a healthy lifestyle and increasing function and well-being while reducing injury, death, and the reoccurrence of disease.6
In a meta-analysis of 47 trials with 10,794 participants, CR reduced cardiovascular disease (CVD) mortality and hospital admissions by 26% and 18%, respectively.2 Performance measures (Class 1, Level A) recommend the following types of patients should be referred from the inpatient setting: “all patients hospitalized with a primary diagnosis of an acute myocardial infarction (MI) or chronic stable angina, or who during hospitalization have undergone coronary artery bypass graft (CABG) surgery, a percutaneous coronary intervention (PCI), cardiac valve surgery, or cardiac transplantation.”7 However, despite overwhelming evidence and widespread endorsement (Class 1, Level A), service utilization, uptake, and patient adherence to CR programs remain suboptimal. In a U.S. study of claims from > 250,000 Medicare beneficiaries, < 30% of eligible patients participated
This treatment gap is echoed throughout the VHA. Schopfer and colleagues found that only 28% of the 124 VAMCs that provide inpatient care also offer a supervised, facility-based CR program.10 Furthermore, only 10.3% of eligible veterans participated in at least 1 CR session (VA or non-VA). On a systemic level, low patient referral rates and inadequate third-party reimbursement were the most common barriers to participation in CR.10,11 On a patient level, distance was by far the largest barrier to veterans receiving CR. Currently, 74% of the 9.3 million VA-enrolled veterans live at least 1 hour by car from a VA facility that offers CR.9 Within some regions of the VHA, there are no VA facility-based CR programs. For example, VISN 21 has no facility-based CR programs. At the same time, referral of eligible veterans to facility-based CR outside the VA remains low. Prior to April 2013, < 2% of qualified patients residing in VISN 21 were being referred to Non-VA CR programs, making it the VISN with the lowest participation rate for CR.
One potential solution that addresses both systemic and patient barriers to CR utilization is home-based CR. Veterans within the wide geographic area of VISN 21 are referred to San Francisco VAMC (SFVAMC) for ischemic heart disease, cardiovascular revascularization, and cardiac valve surgeries. In 2013, a comprehensive home-based CR program named The Healthy Heart Program was developed based on a successful evidence-based CVD secondary prevention program. The Healthy Heart Program is designed to be a physician-directed, nurse case-managed, customized exercise and lifestyle program that provides a safe and convenient way for veterans to participate in CR. Exercise and disease self-management education are the cornerstones of the Healthy Heart Program. The program’s multidisciplinary team includes physicians, nurses, a dietician, an exercise physiologist, and a health behavior psychologist.
An Alternative Approach
DeBusk and colleagues demonstrated that a physician-directed, nurse-managed, home-based cardiac risk-factor modification program improved smoking cessation, reduced low-density lipoprotein cholesterol, and increased exercise capacity compared with usual care.12 The results of this study helped pave the way for one of the first CR programs with a strong home-based element. The MULTIFIT program was jointly developed by the Stanford Coronary Rehabilitation Program and Kaiser Permanente (Oakland, CA) in 1995. MULTIFIT is a nurse-based care model for CVD prevention.
Further research that evaluated other home-based programs showed similar promise. A Cochrane review demonstrated that home- and facility-based CR programs were equal in cardiac risk factor reduction, reduced hospital readmissions and mortality rates, and improved quality of life (QOL).13 Cost-effectiveness also seemed to be similar in both home- and hospital-based CR
Referrals
To address the problems with referrals that plague other CR programs, staff of the Healthy Heart Program worked closely with interventional cardiology and the cardiothoracic team, including the clinical informatics coordinators, to develop an automatic referral system for CR evaluation. Consults for CR evaluation were embedded within the post-CABG and PCI order sets in the electronic health record. Laboratory troponin alerts were created to alert CR staff of patients with elevated troponins, which identified patients admitted for acute MI. Healthy Heart Program staff members received the referrals once a patient was admitted to the unit following their heart procedure. Early referrals for evaluation allowed staff to begin a chart review of all eligible patients and to follow the patient’s course of recovery. Most consults were generated during hospitalization for one of the indications; however, a minority of consults come from both the cardiology and primary care clinics.
Three Phases of CR
The AACVPR describes the challenges and opportunities found throughout the CR continuum.5 Over the past several decades, the continuum of care was more program centered and service utilization was more isolated. Today, CR is viewed as more process oriented and coordinates care across many professionals and services. Phase 1 inpatient CR begins in the hospital and is a shared responsibility between several services. Shortened hospital stays have led to innovative solutions for early ambulation, risk factor education, and discharge planning, including enrollment into phase 2 CR. Phase 2, also known as early outpatient, should begin within 1 to 2 weeks postevent in healthier patients and can last between 6 and 12 weeks postdischarge. Phase 3 (maintenance phase) should begin immediately at the conclusion of phase 2.
Phase 1
Prior to the advent of the Healthy Heart Program, secondary prevention education was not done at the bedside for SFVAMC patients following cardiac revascularization. The AACVPR recommends patient assessment, mobilization, risk-factor identification and education, and facilitation into outpatient CR as essential components of phase 1 CR.5 The Healthy Heart Program clinician initiates phase 1 CR by examining cardiac risk factor management for all referred patients. Physical and cardiac risk factor assessments are accomplished by completing a detailed chart review and interview with the patient. During this interview with the patient, the clinician evaluates cognitive function and readiness to learn. Staff will interview the patient further to assess the overall patient needs, including availability of social support, resources to maintain optimal health, and the need for secondary preventive education. For the PCI patient, the interview may occur in the hours following their procedure; for the surgical patient, this bedside visit typically occurs postoperative day 3 or 4.
A standardized cardiac risk factor evaluation tool was designed, which also serves as an education form to help guide the conversation on risk factor management. The interactive, patient-centered form includes opportunities to review risk, discuss current laboratory values (eg, lipids and hemoglobin A1c), and establish individualized goals based on patient preference and recommended guidelines. Healthy Heart Program staff assist the patient in formulating achievable goals using the SMART (specific, measurable, attainable, realistic, and time-related) criteria.19 Immediately after a heart event or procedure, patients often feel highly motivated to initiate lifestyle changes.20 However, PCI patients may have a short window of opportunity for learning between their readiness to learn state and before the activities of discharge. Staff use these opportunities as a teachable moment and to increase enrollment into outpatient CR (phase 2).
The provider performs a thorough chart review and bedside consultation to determine whether home-based CR is indicated, feasible, and appropriate. Not every patient that is referred will be enrolled in CR. Patients have the option to opt out. In addition, clinical staff adhere to the program protocol’s exclusion criteria.
Absolute contraindications for home enrollment include unstable angina, staged cardiac procedure (PCI and surgery), complex ventricular arrhythmias, severe or symptomatic aortic stenosis, decompensated heart failure, and uncontrolled hypertension (Table). Patients deemed high risk for home-based CR may be referred to a non-VA facility-based CR program. Risk stratification, using the Canadian Cardiovascular Society Grading of Angina Pectoris, is a continuous process that is used to identify patients who may move from moderate to high risk, both before and during the program.21,22
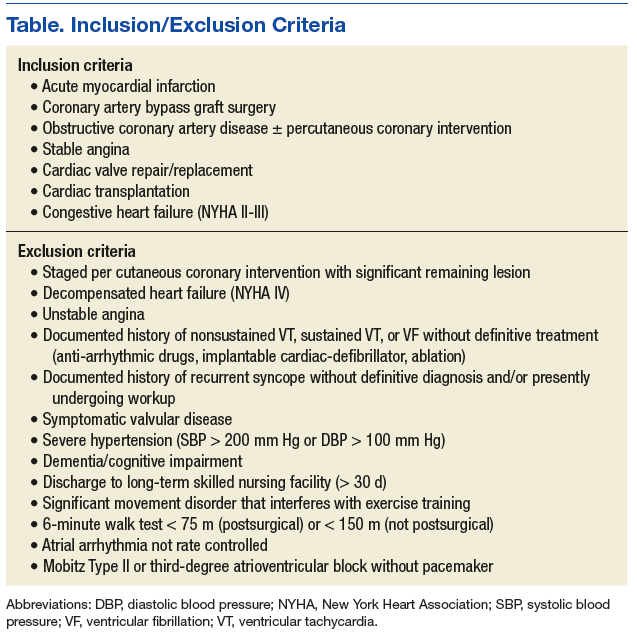
Phases 2 and 3
Phase 2 of the Healthy Heart Program CR includes physical activity, risk-factor modification, nutritional guidance, psychosocial modification, a return to previous activities, and an improved QOL. Prior to entry into the program, a submaximal exercise test, the 6-minute walk test (6MWT), is used as both a qualifying test and for developing the initial exercise prescription.22 The minimum 6MWT distance needed to qualify is 75 m for postoperative and 150 m for nonsurgical patients. The 6MWT is performed in-hospital for patients who were admitted for stable angina, PCI, and are > 4 days following acute MI.23 Cardiothoracic surgery patients are tested at their first follow-up clinic visit (typically 2-3 weeks postoperatively). The clinician monitors the heart rate with either a wearable device or via inpatient telemetry monitors. This exercise testing also serves as a motivational tool for patients to gain confidence in their ability to begin to exercise at home.
Each participant receives a workbook and a DVD titled An Active Partnership for the Health of Your Heart. A personal health journal is provided for documenting vital signs, activity, and dietary intake. In addition, each participant receives equipment on an as-needed basis, including resistance bands, a weight scale, a blood pressure cuff, a pedometer/heart rate monitoring device, an exercise peddler or stationary bike, and a dietary video. Baseline assessments include the General Anxiety Disorder (GAD-7), Personal Health Questionnaire (PHQ-9) and a nutrition (Rate Your Plate) questionnaire. A cognitive function test (Montreal Cognitive Assessment) is used on an as-needed basis.
Nine 30-minute telephone follow-up sessions are scheduled within a 12-week period (weekly for the first 6 weeks, then biweekly). Topics covered are customized and include exercise; nutrition; medications; smoking cessation; and diabetes, hypertension, and weight management. Via a telephone follow-up session, the program nurses and patients codevelop an electronic individualized treatment plan that is tailored to the patient’s diagnosis, individual goals, and preferences. Clinicians teach participants how to self-monitor exercise, using a continuous heart rate monitoring device (Mio Alpha II or Fuse) and the 6-20 Borg dyspnea rating scale.24 Initially, moderate intensity exercise is prescribed with a target heart rate that is 60% to 75% of the 6MWT peak heart rate and an initial Borg scale target (11-14 on 20 point scale). The program physicians approve the treatment plan at the first patient visit and every 30 days until phase 2 is complete.
Patients who have completed early outpatient phase 2 CR can benefit from continuing to a phase 3 CR program.25 Participants of the Healthy Heart Program automatically are enrolled in phase 3, which is a long-term maintenance program that includes monthly or bimonthly phone calls for up to 1-year posthospital discharge. The goal is to support each veteran’s transition to a long-term healthy lifestyle that includes regular exercise.
Client-Clinician Partnership
The Healthy Heart Program establishes the client-clinician partnership prior to discharge for hospitalized patients. The nurse who initiates phase 1 at the bedside is the primary clinician throughout phases 2 and 3 with the exception of a dietician, psychologist, and/or exercise physiologist who provide follow-up calls as needed. Throughout these weekly follow-up phone sessions, the clinician gains an appreciation of the patient’s understanding of his or her disease, patterns of behavior, desire to change, confidence in being able to change, potential barriers, and responses to obstacles
Tailored Behavioral Change
The clinician’s responsibility is to listen to the patient’s concerns, assess their level of commitment for changing health behaviors, and provide guidance and support at the patient’s current level. The clinician applies the Transtheoretical Model founded on the Stages of Change principals to help understand and provide guidance based on the patient’s feelings about health behavior change.26 People are actively open to changing behaviors by only 20% at any given time.27 Therefore, action-oriented guidance for patients who are in the contemplative stage would not be helpful. This patient-centered approach promotes patients’ self-awareness, participation, and understanding of their decision-making role in their health management. Ultimately, individuals must take ownership of their health care maintenance for sustained behavioral change and medication management, and clinicians should facilitate that process.
Discussion
Secondary prevention strategies for heart disease continue to be underutilized. The Healthy Heart Program aims to improve participation in CR, improve QOL, help patients understand their heart disease, and support these patients psychologically. An advantage of this program is that it begins inpatient CR immediately following the heart event, when many patients often are more receptive to behavioral change support and guidance. Another advantage is that the program breaks down barriers to access, which is especially important in the veteran population. The Healthy Heart Program provides support and guidance for exercise and cardiac risk factor management to patients who otherwise would have not participated in any type of CR program.
A home-based CR program can be adopted independently or in conjunction with a facility-based program to which patients lack access. Furthermore, home-based CR programs function well as a phase 3 maintenance program at the completion of a traditional CR program. Since its inception, the Healthy Heart Program has increased the number of veterans enrolled in cardiac rehabilitation at the SFVAMC dramatically, from < 1% in FY 2012 to > 40% in FY 2015.
Program Limitations
One potential disadvantage of a home-based CR program is patients’ fear of returning to an exercise routine following a cardiac event. In addition, a lack of in-person supervision in home-based CR can lead patients to engage in less intensive activity than in facility-based CR. Other disadvantages include a lack of social support, less patient accountability, and safety concerns for sicker patients. Staff have consulted on several patients who expressed a lack of confidence in their ability to do well in this type of program, where accountability for exercising is self-reported. Staff referred these patients, who had the means to travel, to a non-VA facility-based CR program of their choice. Ideally, patients would have the choice between facility- or home-based programs or be able to choose a hybrid program that would best meet their needs.
Another identified limitation of this program was the lack of group support and in-person interactions with rehabilitation staff. Finally, although this program uses mobile devices with heart rate monitoring technology, these devices currently lack the capability to remotely share data with clinicians. Clinicians are reliant on the patient’s use of a personal health journal and memory. Subjective patient reporting has been found to be overestimated; therefore, more objective methods to measure important clinical outcomes are necessary.28
Conclusion
Facility-based CR is effective but underutilized. Alternative secondary programs are needed to help meet patient needs and overcome patient barriers. One promising approach to increase participation is home-based CR. Home-based CR programs have the potential to increase CR uptake and adherence. Home-based CR optimizes enrollment through evidence-based alternative models due to improved access. The future of CR will become highly individualized and multifaceted as a result of available mobile technologies and Internet-based tools, which will help increase the number of participants and expand the reach of cardiac risk factor management programs beyond the facility-based setting. A home-based program will be a valuable addition to facility-based programs as a stand-alone program or adopted into a hybrid program.
Acknowledgments
This work was funded by the VA Quality Enhancement Research Initiative.
1. Benjamin EJ, Blaha MJ, Chiuve SE, et al. Heart Disease and Stroke Statistics-2017 Update: A Report From the American Heart Association. Cicrulation. 2017;135(10):e146-e603.
2. Anderson L, Oldridge N, Thompson DR, Zwisler A, Rees K, Martin N, Taylor RS. Exercise-based cardiac rehabilitation for coronary heart disease. Cochrane Systematic Review and Meta-analysis. J Am Coll Card. 2016;67:1-12.
3. Oldridge NB, Guyatt GH, Fischer ME, Rimm AA. Cardiac rehabilitation after myocardial infarction. Combined experience of randomized clinical trials. JAMA. 1988;260:940-950.
4. Taylor RS, Brown A, Ebrahim S, et al. Exercise-based rehabilitation for patients with coronary heart disease: systematic review and meta-analysis of randomized controlled trials. Am J Med. 2004;116(10):682-692.
5. American Association of Cardiovascular and Pulmonary Rehabilitation. Guidelines for Cardiac Rehabilitation and Secondary Prevention Programs. 5th ed. Champaign, IL: Human Kinetics; 2013.
6. Balady GJ, Williams MA, Ades PA, et al; American Heart Association Exercise, Cardiac Rehabilitation, and Prevention Committee, the Council on Clinical Cardiology; American Heart Association Council on Cardiovascular Nursing; American Heart Association Council on Epidemiology and Prevention; American Heart Association Council on Nutrition, Physical Activity, and Metabolism; American Association of Cardiovascular and Pulmonary Rehabilitation. Core components of cardiac rehabilitation/secondary prevention programs: 2007 update: a scientific statement from the American Heart Association Exercise, Cardiac Rehabilitation, and Prevention Committee, the Council on Clinical Cardiology; the Councils on Cardiovascular Nursing, Epidemiology and Prevention, and Nutrition, Physical Activity, and Metabolism; and the American Association of Cardiovascular and Pulmonary Rehabilitation. Circulation. 2007;115(10):2675-2682.
7. Thomas R J, King M, Lui K, et al; Writing Committee Members. AACVPR/ACCF/AHA 2010 update: performance measures on cardiac rehabilitation for referral to cardiac rehabilitation/secondary prevention services: a report of the American Association of Cardiovascular and Pulmonary Rehabilitation and the American College of Cardiology Foundation/American Heart Association Task Force on Performance Measures (Writing Committee to Develop Clinical Performance Measures for Cardiac Rehabilitation). Circulation. 2010;122(13):1342-1350.
8. Suaya JA, Shepard DS, Normand SL, Ades PA, Prottas J, Stason WB. Use of cardiac rehabilitation by Medicare beneficiaries after myocardial infarction or coronary bypass surgery. Circulation. 2007;116(15):1653-1662.
9. Balady GJ, Ades PA, Bitner VA, et al; American Heart Association Science Advisory and Coordinating Committee. Referral, enrollment, and delivery of cardiac rehabilitation/secondary prevention programs at clinical centers and beyond: a presidential advisory from the American Heart Association. Circulation. 2011;124(25):2951-2960.
10. Schopfer DW, Takemoto S, Allsup K, et al. Notice of Retraction and Replacement. Schopfer DW, et al. Cardiac rehabilitation use among veterans with ischemic heart disease. JAMA Intern Med. 2014;174(10):1687-1689. JAMA Intern Med. 2016;176(11):1726-1727.
11. Ferguson EE. Cardiac rehabilitation—an effective and comprehensive but underutilized program to reduce cardiovascular risk in patients with CVD. US Cardiology. 2006;3(2):14-16.
12. DeBusk RF, Miller NH, Superko HR, et al. A case-management system for coronary risk factor modification after acute myocardial infarction. Ann Intern Med. 1994;120(9):721-729.
13. Buckingham SA, Taylor RS, Jolly K, et al. Home-based versus centre-based cardiac rehabilitation: abridged Cochrane systematic review and meta-analysis. Open Heart. 2016;3(2):e000463.
14. Taylor RS, Watt A, Dalal HM, et al. Home-based cardiac rehabilitation versus hospital-based rehabilitation: a cost effectiveness analysis. Int J Cardiol. 2007;119(2):196-201.
15. Kotb A, Hsieh S, Wells GA. The effect of telephone support interventions on coronary artery disease (CAD) patient outcomes during cardiac rehabilitation: a systematic review and meta-analysis. PLoS One. 2014;9(5):e96581.
16. Grace SL, McDonald J, Fishman D, Caruso V. Patient preferences for home-based versus hospital-based cardiac rehabilitation. J Cardiopulm Rehabil. 2005;25(1):24-29.
17. Wakefield B, Drwal K, Scherubel M, Klobucar T, Johnson S, Kaboli P. Feasibility and effectiveness of remote, telephone-based delivery of cardiac rehabilitation. Telemed J E Health. 2014;20(1):32-38.
18. Smith SC, Benjamin EJ, Bonow RO, et al; World Heart Federation and the Preventive Cardiovascular Nurses Association. AHA/ACCF secondary prevention and risk reduction therapy for patients with coronary and other atherosclerotic vascular disease: 2011 update: a guideline from the American Heart Association and American College of Cardiology Foundation. Circulation. 2011;124(22):2458-2473.
19. Doran GT. There’s a S.M.A.R.T. way to write management’s goals and objectives. Manage Rev. 1981;70(11):35-36.
20. Dullaghan L, Lusk L, Donnelly P, McGeough M, Fitzsimons D. Communicating with people who have experienced heart attack. Emerg Nurse. 2013;21(6):33-36.
21. Campeau L. Letter: grading of angina pectoris. Circulation. 1976;54(3):522-523.
22. Fletcher GF, Balady GJ, Armstrong EA, et al. Exercise standards for testing and training: a statement for healthcare professionals from the American Heart Association. Circulation. 2001;104(14):1694-1740.
23. Gibbons RJ, Balady GJ, Bricker JT, et al; American College of Cardiology/American Heart Association Task Force on Practice Guidelines. Committee to Update the 1997 Exercise Testing Guidelines. Committee to Update the 1997 Exercise Testing Guidelines. ACC/AHA 2002 guideline update for exercise testing: a report of the American College of Cardiology/American Heart Association Task Force on Practice Guidelines (Committee on Exercise Testing). J Am Coll Cardiol. 2002;40(8):1531-1540.
24. Borg G. Borg’s Perceived Exertion and Pain Scales. Champaign, IL: Human Kinetics; 1998.
25. Seki E, Watanabe Y, Sunayama S, et al. Effects of phase III cardiac rehabilitation programs on health-related quality of life in elderly patients with coronary artery disease: Juntendo Cardiac Rehabilitation Program (J-CARP). Circ J. 2003;67(1):73-77.
26. The transtheoretical model. Pro-Change Behavior Systems, Inc. http://www.prochange.com/transtheoretical-model-of-behavior-change. Published 2016. Accessed April 6, 2017.
27. Prochaska JO, Ever KE, Castle PH, et al. Enhancing multiple domains of well-being by decreasing multiple health risk behaviors: a randomized clinical trial. Popul Health Manag. 2012;15(5):276-286.
28. Prince SA, Adamo KB, Hamel ME, Hardt J, Connor Gorber S, Tremblay M. A comparison of direct versus self-report measures for assessing physical activity in adults: a systematic review. Int J Behav Nutr Phys Act. 2008;5:56.
Despite a 30% decline in heart disease mortality from 2001 to 2011, heart disease prevalence is on the rise, responsible for 1 of every 3 deaths in the U.S.1 Cardiac rehabilitation (CR) is an evidence-based, secondary prevention strategy that has been proven effective in preventing future cardiovascular events and decreasing heart disease mortality.2-4 The American Association of Cardiovascular and Pulmonary Rehabilitation (AACVPR) is the leading authority on CR and provides guidelines for CR programs. The AACVPR and the American Heart Association (AHA) published core components for CR programs deemed essential for all CR/secondary prevention programs, including evaluations, interventions, and expected outcomes.5 These core components are aimed at promoting a healthy lifestyle and increasing function and well-being while reducing injury, death, and the reoccurrence of disease.6
In a meta-analysis of 47 trials with 10,794 participants, CR reduced cardiovascular disease (CVD) mortality and hospital admissions by 26% and 18%, respectively.2 Performance measures (Class 1, Level A) recommend the following types of patients should be referred from the inpatient setting: “all patients hospitalized with a primary diagnosis of an acute myocardial infarction (MI) or chronic stable angina, or who during hospitalization have undergone coronary artery bypass graft (CABG) surgery, a percutaneous coronary intervention (PCI), cardiac valve surgery, or cardiac transplantation.”7 However, despite overwhelming evidence and widespread endorsement (Class 1, Level A), service utilization, uptake, and patient adherence to CR programs remain suboptimal. In a U.S. study of claims from > 250,000 Medicare beneficiaries, < 30% of eligible patients participated
This treatment gap is echoed throughout the VHA. Schopfer and colleagues found that only 28% of the 124 VAMCs that provide inpatient care also offer a supervised, facility-based CR program.10 Furthermore, only 10.3% of eligible veterans participated in at least 1 CR session (VA or non-VA). On a systemic level, low patient referral rates and inadequate third-party reimbursement were the most common barriers to participation in CR.10,11 On a patient level, distance was by far the largest barrier to veterans receiving CR. Currently, 74% of the 9.3 million VA-enrolled veterans live at least 1 hour by car from a VA facility that offers CR.9 Within some regions of the VHA, there are no VA facility-based CR programs. For example, VISN 21 has no facility-based CR programs. At the same time, referral of eligible veterans to facility-based CR outside the VA remains low. Prior to April 2013, < 2% of qualified patients residing in VISN 21 were being referred to Non-VA CR programs, making it the VISN with the lowest participation rate for CR.
One potential solution that addresses both systemic and patient barriers to CR utilization is home-based CR. Veterans within the wide geographic area of VISN 21 are referred to San Francisco VAMC (SFVAMC) for ischemic heart disease, cardiovascular revascularization, and cardiac valve surgeries. In 2013, a comprehensive home-based CR program named The Healthy Heart Program was developed based on a successful evidence-based CVD secondary prevention program. The Healthy Heart Program is designed to be a physician-directed, nurse case-managed, customized exercise and lifestyle program that provides a safe and convenient way for veterans to participate in CR. Exercise and disease self-management education are the cornerstones of the Healthy Heart Program. The program’s multidisciplinary team includes physicians, nurses, a dietician, an exercise physiologist, and a health behavior psychologist.
An Alternative Approach
DeBusk and colleagues demonstrated that a physician-directed, nurse-managed, home-based cardiac risk-factor modification program improved smoking cessation, reduced low-density lipoprotein cholesterol, and increased exercise capacity compared with usual care.12 The results of this study helped pave the way for one of the first CR programs with a strong home-based element. The MULTIFIT program was jointly developed by the Stanford Coronary Rehabilitation Program and Kaiser Permanente (Oakland, CA) in 1995. MULTIFIT is a nurse-based care model for CVD prevention.
Further research that evaluated other home-based programs showed similar promise. A Cochrane review demonstrated that home- and facility-based CR programs were equal in cardiac risk factor reduction, reduced hospital readmissions and mortality rates, and improved quality of life (QOL).13 Cost-effectiveness also seemed to be similar in both home- and hospital-based CR
Referrals
To address the problems with referrals that plague other CR programs, staff of the Healthy Heart Program worked closely with interventional cardiology and the cardiothoracic team, including the clinical informatics coordinators, to develop an automatic referral system for CR evaluation. Consults for CR evaluation were embedded within the post-CABG and PCI order sets in the electronic health record. Laboratory troponin alerts were created to alert CR staff of patients with elevated troponins, which identified patients admitted for acute MI. Healthy Heart Program staff members received the referrals once a patient was admitted to the unit following their heart procedure. Early referrals for evaluation allowed staff to begin a chart review of all eligible patients and to follow the patient’s course of recovery. Most consults were generated during hospitalization for one of the indications; however, a minority of consults come from both the cardiology and primary care clinics.
Three Phases of CR
The AACVPR describes the challenges and opportunities found throughout the CR continuum.5 Over the past several decades, the continuum of care was more program centered and service utilization was more isolated. Today, CR is viewed as more process oriented and coordinates care across many professionals and services. Phase 1 inpatient CR begins in the hospital and is a shared responsibility between several services. Shortened hospital stays have led to innovative solutions for early ambulation, risk factor education, and discharge planning, including enrollment into phase 2 CR. Phase 2, also known as early outpatient, should begin within 1 to 2 weeks postevent in healthier patients and can last between 6 and 12 weeks postdischarge. Phase 3 (maintenance phase) should begin immediately at the conclusion of phase 2.
Phase 1
Prior to the advent of the Healthy Heart Program, secondary prevention education was not done at the bedside for SFVAMC patients following cardiac revascularization. The AACVPR recommends patient assessment, mobilization, risk-factor identification and education, and facilitation into outpatient CR as essential components of phase 1 CR.5 The Healthy Heart Program clinician initiates phase 1 CR by examining cardiac risk factor management for all referred patients. Physical and cardiac risk factor assessments are accomplished by completing a detailed chart review and interview with the patient. During this interview with the patient, the clinician evaluates cognitive function and readiness to learn. Staff will interview the patient further to assess the overall patient needs, including availability of social support, resources to maintain optimal health, and the need for secondary preventive education. For the PCI patient, the interview may occur in the hours following their procedure; for the surgical patient, this bedside visit typically occurs postoperative day 3 or 4.
A standardized cardiac risk factor evaluation tool was designed, which also serves as an education form to help guide the conversation on risk factor management. The interactive, patient-centered form includes opportunities to review risk, discuss current laboratory values (eg, lipids and hemoglobin A1c), and establish individualized goals based on patient preference and recommended guidelines. Healthy Heart Program staff assist the patient in formulating achievable goals using the SMART (specific, measurable, attainable, realistic, and time-related) criteria.19 Immediately after a heart event or procedure, patients often feel highly motivated to initiate lifestyle changes.20 However, PCI patients may have a short window of opportunity for learning between their readiness to learn state and before the activities of discharge. Staff use these opportunities as a teachable moment and to increase enrollment into outpatient CR (phase 2).
The provider performs a thorough chart review and bedside consultation to determine whether home-based CR is indicated, feasible, and appropriate. Not every patient that is referred will be enrolled in CR. Patients have the option to opt out. In addition, clinical staff adhere to the program protocol’s exclusion criteria.
Absolute contraindications for home enrollment include unstable angina, staged cardiac procedure (PCI and surgery), complex ventricular arrhythmias, severe or symptomatic aortic stenosis, decompensated heart failure, and uncontrolled hypertension (Table). Patients deemed high risk for home-based CR may be referred to a non-VA facility-based CR program. Risk stratification, using the Canadian Cardiovascular Society Grading of Angina Pectoris, is a continuous process that is used to identify patients who may move from moderate to high risk, both before and during the program.21,22
Phases 2 and 3
Phase 2 of the Healthy Heart Program CR includes physical activity, risk-factor modification, nutritional guidance, psychosocial modification, a return to previous activities, and an improved QOL. Prior to entry into the program, a submaximal exercise test, the 6-minute walk test (6MWT), is used as both a qualifying test and for developing the initial exercise prescription.22 The minimum 6MWT distance needed to qualify is 75 m for postoperative and 150 m for nonsurgical patients. The 6MWT is performed in-hospital for patients who were admitted for stable angina, PCI, and are > 4 days following acute MI.23 Cardiothoracic surgery patients are tested at their first follow-up clinic visit (typically 2-3 weeks postoperatively). The clinician monitors the heart rate with either a wearable device or via inpatient telemetry monitors. This exercise testing also serves as a motivational tool for patients to gain confidence in their ability to begin to exercise at home.
Each participant receives a workbook and a DVD titled An Active Partnership for the Health of Your Heart. A personal health journal is provided for documenting vital signs, activity, and dietary intake. In addition, each participant receives equipment on an as-needed basis, including resistance bands, a weight scale, a blood pressure cuff, a pedometer/heart rate monitoring device, an exercise peddler or stationary bike, and a dietary video. Baseline assessments include the General Anxiety Disorder (GAD-7), Personal Health Questionnaire (PHQ-9) and a nutrition (Rate Your Plate) questionnaire. A cognitive function test (Montreal Cognitive Assessment) is used on an as-needed basis.
Nine 30-minute telephone follow-up sessions are scheduled within a 12-week period (weekly for the first 6 weeks, then biweekly). Topics covered are customized and include exercise; nutrition; medications; smoking cessation; and diabetes, hypertension, and weight management. Via a telephone follow-up session, the program nurses and patients codevelop an electronic individualized treatment plan that is tailored to the patient’s diagnosis, individual goals, and preferences. Clinicians teach participants how to self-monitor exercise, using a continuous heart rate monitoring device (Mio Alpha II or Fuse) and the 6-20 Borg dyspnea rating scale.24 Initially, moderate intensity exercise is prescribed with a target heart rate that is 60% to 75% of the 6MWT peak heart rate and an initial Borg scale target (11-14 on 20 point scale). The program physicians approve the treatment plan at the first patient visit and every 30 days until phase 2 is complete.
Patients who have completed early outpatient phase 2 CR can benefit from continuing to a phase 3 CR program.25 Participants of the Healthy Heart Program automatically are enrolled in phase 3, which is a long-term maintenance program that includes monthly or bimonthly phone calls for up to 1-year posthospital discharge. The goal is to support each veteran’s transition to a long-term healthy lifestyle that includes regular exercise.
Client-Clinician Partnership
The Healthy Heart Program establishes the client-clinician partnership prior to discharge for hospitalized patients. The nurse who initiates phase 1 at the bedside is the primary clinician throughout phases 2 and 3 with the exception of a dietician, psychologist, and/or exercise physiologist who provide follow-up calls as needed. Throughout these weekly follow-up phone sessions, the clinician gains an appreciation of the patient’s understanding of his or her disease, patterns of behavior, desire to change, confidence in being able to change, potential barriers, and responses to obstacles
Tailored Behavioral Change
The clinician’s responsibility is to listen to the patient’s concerns, assess their level of commitment for changing health behaviors, and provide guidance and support at the patient’s current level. The clinician applies the Transtheoretical Model founded on the Stages of Change principals to help understand and provide guidance based on the patient’s feelings about health behavior change.26 People are actively open to changing behaviors by only 20% at any given time.27 Therefore, action-oriented guidance for patients who are in the contemplative stage would not be helpful. This patient-centered approach promotes patients’ self-awareness, participation, and understanding of their decision-making role in their health management. Ultimately, individuals must take ownership of their health care maintenance for sustained behavioral change and medication management, and clinicians should facilitate that process.
Discussion
Secondary prevention strategies for heart disease continue to be underutilized. The Healthy Heart Program aims to improve participation in CR, improve QOL, help patients understand their heart disease, and support these patients psychologically. An advantage of this program is that it begins inpatient CR immediately following the heart event, when many patients often are more receptive to behavioral change support and guidance. Another advantage is that the program breaks down barriers to access, which is especially important in the veteran population. The Healthy Heart Program provides support and guidance for exercise and cardiac risk factor management to patients who otherwise would have not participated in any type of CR program.
A home-based CR program can be adopted independently or in conjunction with a facility-based program to which patients lack access. Furthermore, home-based CR programs function well as a phase 3 maintenance program at the completion of a traditional CR program. Since its inception, the Healthy Heart Program has increased the number of veterans enrolled in cardiac rehabilitation at the SFVAMC dramatically, from < 1% in FY 2012 to > 40% in FY 2015.
Program Limitations
One potential disadvantage of a home-based CR program is patients’ fear of returning to an exercise routine following a cardiac event. In addition, a lack of in-person supervision in home-based CR can lead patients to engage in less intensive activity than in facility-based CR. Other disadvantages include a lack of social support, less patient accountability, and safety concerns for sicker patients. Staff have consulted on several patients who expressed a lack of confidence in their ability to do well in this type of program, where accountability for exercising is self-reported. Staff referred these patients, who had the means to travel, to a non-VA facility-based CR program of their choice. Ideally, patients would have the choice between facility- or home-based programs or be able to choose a hybrid program that would best meet their needs.
Another identified limitation of this program was the lack of group support and in-person interactions with rehabilitation staff. Finally, although this program uses mobile devices with heart rate monitoring technology, these devices currently lack the capability to remotely share data with clinicians. Clinicians are reliant on the patient’s use of a personal health journal and memory. Subjective patient reporting has been found to be overestimated; therefore, more objective methods to measure important clinical outcomes are necessary.28
Conclusion
Facility-based CR is effective but underutilized. Alternative secondary programs are needed to help meet patient needs and overcome patient barriers. One promising approach to increase participation is home-based CR. Home-based CR programs have the potential to increase CR uptake and adherence. Home-based CR optimizes enrollment through evidence-based alternative models due to improved access. The future of CR will become highly individualized and multifaceted as a result of available mobile technologies and Internet-based tools, which will help increase the number of participants and expand the reach of cardiac risk factor management programs beyond the facility-based setting. A home-based program will be a valuable addition to facility-based programs as a stand-alone program or adopted into a hybrid program.
Acknowledgments
This work was funded by the VA Quality Enhancement Research Initiative.
1. Benjamin EJ, Blaha MJ, Chiuve SE, et al. Heart Disease and Stroke Statistics-2017 Update: A Report From the American Heart Association. Cicrulation. 2017;135(10):e146-e603.
2. Anderson L, Oldridge N, Thompson DR, Zwisler A, Rees K, Martin N, Taylor RS. Exercise-based cardiac rehabilitation for coronary heart disease. Cochrane Systematic Review and Meta-analysis. J Am Coll Card. 2016;67:1-12.
3. Oldridge NB, Guyatt GH, Fischer ME, Rimm AA. Cardiac rehabilitation after myocardial infarction. Combined experience of randomized clinical trials. JAMA. 1988;260:940-950.
4. Taylor RS, Brown A, Ebrahim S, et al. Exercise-based rehabilitation for patients with coronary heart disease: systematic review and meta-analysis of randomized controlled trials. Am J Med. 2004;116(10):682-692.
5. American Association of Cardiovascular and Pulmonary Rehabilitation. Guidelines for Cardiac Rehabilitation and Secondary Prevention Programs. 5th ed. Champaign, IL: Human Kinetics; 2013.
6. Balady GJ, Williams MA, Ades PA, et al; American Heart Association Exercise, Cardiac Rehabilitation, and Prevention Committee, the Council on Clinical Cardiology; American Heart Association Council on Cardiovascular Nursing; American Heart Association Council on Epidemiology and Prevention; American Heart Association Council on Nutrition, Physical Activity, and Metabolism; American Association of Cardiovascular and Pulmonary Rehabilitation. Core components of cardiac rehabilitation/secondary prevention programs: 2007 update: a scientific statement from the American Heart Association Exercise, Cardiac Rehabilitation, and Prevention Committee, the Council on Clinical Cardiology; the Councils on Cardiovascular Nursing, Epidemiology and Prevention, and Nutrition, Physical Activity, and Metabolism; and the American Association of Cardiovascular and Pulmonary Rehabilitation. Circulation. 2007;115(10):2675-2682.
7. Thomas R J, King M, Lui K, et al; Writing Committee Members. AACVPR/ACCF/AHA 2010 update: performance measures on cardiac rehabilitation for referral to cardiac rehabilitation/secondary prevention services: a report of the American Association of Cardiovascular and Pulmonary Rehabilitation and the American College of Cardiology Foundation/American Heart Association Task Force on Performance Measures (Writing Committee to Develop Clinical Performance Measures for Cardiac Rehabilitation). Circulation. 2010;122(13):1342-1350.
8. Suaya JA, Shepard DS, Normand SL, Ades PA, Prottas J, Stason WB. Use of cardiac rehabilitation by Medicare beneficiaries after myocardial infarction or coronary bypass surgery. Circulation. 2007;116(15):1653-1662.
9. Balady GJ, Ades PA, Bitner VA, et al; American Heart Association Science Advisory and Coordinating Committee. Referral, enrollment, and delivery of cardiac rehabilitation/secondary prevention programs at clinical centers and beyond: a presidential advisory from the American Heart Association. Circulation. 2011;124(25):2951-2960.
10. Schopfer DW, Takemoto S, Allsup K, et al. Notice of Retraction and Replacement. Schopfer DW, et al. Cardiac rehabilitation use among veterans with ischemic heart disease. JAMA Intern Med. 2014;174(10):1687-1689. JAMA Intern Med. 2016;176(11):1726-1727.
11. Ferguson EE. Cardiac rehabilitation—an effective and comprehensive but underutilized program to reduce cardiovascular risk in patients with CVD. US Cardiology. 2006;3(2):14-16.
12. DeBusk RF, Miller NH, Superko HR, et al. A case-management system for coronary risk factor modification after acute myocardial infarction. Ann Intern Med. 1994;120(9):721-729.
13. Buckingham SA, Taylor RS, Jolly K, et al. Home-based versus centre-based cardiac rehabilitation: abridged Cochrane systematic review and meta-analysis. Open Heart. 2016;3(2):e000463.
14. Taylor RS, Watt A, Dalal HM, et al. Home-based cardiac rehabilitation versus hospital-based rehabilitation: a cost effectiveness analysis. Int J Cardiol. 2007;119(2):196-201.
15. Kotb A, Hsieh S, Wells GA. The effect of telephone support interventions on coronary artery disease (CAD) patient outcomes during cardiac rehabilitation: a systematic review and meta-analysis. PLoS One. 2014;9(5):e96581.
16. Grace SL, McDonald J, Fishman D, Caruso V. Patient preferences for home-based versus hospital-based cardiac rehabilitation. J Cardiopulm Rehabil. 2005;25(1):24-29.
17. Wakefield B, Drwal K, Scherubel M, Klobucar T, Johnson S, Kaboli P. Feasibility and effectiveness of remote, telephone-based delivery of cardiac rehabilitation. Telemed J E Health. 2014;20(1):32-38.
18. Smith SC, Benjamin EJ, Bonow RO, et al; World Heart Federation and the Preventive Cardiovascular Nurses Association. AHA/ACCF secondary prevention and risk reduction therapy for patients with coronary and other atherosclerotic vascular disease: 2011 update: a guideline from the American Heart Association and American College of Cardiology Foundation. Circulation. 2011;124(22):2458-2473.
19. Doran GT. There’s a S.M.A.R.T. way to write management’s goals and objectives. Manage Rev. 1981;70(11):35-36.
20. Dullaghan L, Lusk L, Donnelly P, McGeough M, Fitzsimons D. Communicating with people who have experienced heart attack. Emerg Nurse. 2013;21(6):33-36.
21. Campeau L. Letter: grading of angina pectoris. Circulation. 1976;54(3):522-523.
22. Fletcher GF, Balady GJ, Armstrong EA, et al. Exercise standards for testing and training: a statement for healthcare professionals from the American Heart Association. Circulation. 2001;104(14):1694-1740.
23. Gibbons RJ, Balady GJ, Bricker JT, et al; American College of Cardiology/American Heart Association Task Force on Practice Guidelines. Committee to Update the 1997 Exercise Testing Guidelines. Committee to Update the 1997 Exercise Testing Guidelines. ACC/AHA 2002 guideline update for exercise testing: a report of the American College of Cardiology/American Heart Association Task Force on Practice Guidelines (Committee on Exercise Testing). J Am Coll Cardiol. 2002;40(8):1531-1540.
24. Borg G. Borg’s Perceived Exertion and Pain Scales. Champaign, IL: Human Kinetics; 1998.
25. Seki E, Watanabe Y, Sunayama S, et al. Effects of phase III cardiac rehabilitation programs on health-related quality of life in elderly patients with coronary artery disease: Juntendo Cardiac Rehabilitation Program (J-CARP). Circ J. 2003;67(1):73-77.
26. The transtheoretical model. Pro-Change Behavior Systems, Inc. http://www.prochange.com/transtheoretical-model-of-behavior-change. Published 2016. Accessed April 6, 2017.
27. Prochaska JO, Ever KE, Castle PH, et al. Enhancing multiple domains of well-being by decreasing multiple health risk behaviors: a randomized clinical trial. Popul Health Manag. 2012;15(5):276-286.
28. Prince SA, Adamo KB, Hamel ME, Hardt J, Connor Gorber S, Tremblay M. A comparison of direct versus self-report measures for assessing physical activity in adults: a systematic review. Int J Behav Nutr Phys Act. 2008;5:56.
Severe hospital-acquired anemia linked to readmission, death

Severe hospital-acquired anemia (HAA) may increase a person’s risk of hospital readmission and death, a new study suggests.
Researchers studied more than 11,000 patients admitted to 6 Texas hospitals and found that a third of the patients developed HAA.
The team also found that severe HAA was associated with a higher risk of death or readmission, even after the researchers adjusted for other factors.
They reported these findings in the Journal of Hospital Medicine.
“This study shines a spotlight on a very common but underappreciated risk of hospitalization, hospital-acquired anemia, which has traditionally been viewed as an incidental change in the red blood count of no significance,” said study author Ethan Halm, MD, of the University of Texas Southwestern Medical Center in Dallas.
“However, our results showed that hospital-acquired anemia was associated with worse clinical outcomes after leaving the hospital, so it needs to be taken more seriously.”
Dr Halm and his colleagues looked at consecutive medicine discharges between November 1, 2009, and October 30, 2010, from 6 hospitals in Texas (safety-net, teaching, and nonteaching).
Of the 11,309 patients studied, 33.1% developed HAA. Most (21.6%) had mild HAA, followed by moderate HAA (10.1%), and severe HAA (1.4%).
The study’s primary outcome was a composite of 30-day mortality and nonelective readmission. This occurred in 9.7% of patients without HAA and 16.4% of those with severe HAA.
The researchers found that severe HAA was independently associated with a 39% increase in the odds of meeting the primary outcome (readmission or 30-day mortality).
The team noted that 85% of patients with severe HAA underwent a major procedure, had a discharge diagnosis of hemorrhage, and/or a discharge diagnosis of hemorrhagic disorder.
The researchers identified 2 potentially modifiable predictors of moderate or severe HAA. These were length of hospital stay (adjusted odds ratio=1.26 per day) and undergoing a major procedure (adjusted odds ratio=5.09).
“Our findings suggest that reducing blood loss during major surgeries and reducing unnecessary testing during hospital stays may lower a patient’s risk of developing severe hospital-acquired anemia, and potentially improve their recovery,” said Anil N. Makam, MD, of the University of Texas Southwestern Medical Center.
In the future, the researchers hope to examine other patient-centered outcomes that may be related to HAA, such as fatigue, functional impairment, and the trajectory of post-hospital recovery. ![]()
Declines in frequent binge drinking vary in some teen subgroups
The drop in frequent binge drinking (FBD) among adolescents can be attributed to age, period, and cohort effects, but there are variations in certain subgroups of teens, said Joy Bohyun Jang, PhD, and her associates.
The decline in FBD is not as great in teen girls, African American youth, and youth from low socioeconomic backgrounds, so those groups deserve close attention by researchers and clinicians, they said.
The study used an age-period-cohort analysis to examine how these variables affected drinking trends among adolescents, with a particular focus on FBD, which was defined as two or more occasions of consuming at least five alcoholic drinks in a row in the past 2 weeks.
FBD decreased in recent years in all ages during adolescence, suggesting that declines in teen FBD in the past 25 years were “driven by factors influencing all age groups simultaneously as well as influences on particular birth cohorts,” the researchers said. These factors might include greater public efforts to lessen the risk of underage drinking and disapproval of heavy alcohol use among the recent cohorts of teens. “Those born around 1990 had the highest decline of FBD compared with those in the preceding and subsequent cohorts of adolescents.”
But there are variations in FBD among teens by demographics. Boys and those of higher socioeconomic status (SES) showed rapid increases in FBD by age, compared with girls and teens of lower SES, respectively. However, there also has been a convergence in FBD by sex in the more recent time periods because of greater declines in FBD among boys than in girls. Likewise, there is a growing discrepancy by SES in FBD in U.S. teens because higher SES teens were less likely than those from a lower SES to engage in FBD and “the strength of the association is growing in more recent time periods.”
African American youth had the lowest rates of FBD for all the racial groups, yet declines in FBD have been slower among African American youth, compared with white adolescents, since 2007, reported Dr. Jang of the University of Michigan, Ann Arbor, and her associates.
The study was supported by grants from the National Institute on Alcohol Abuse and Alcoholism, the National Institute on Drug Abuse, and was funded by the National Institutes of Health. Dr. Jang and her associates said they had no relevant financial disclosures.
[email protected]
Teens who drink heavily are more likely to have unprotected sex, perform poorly at school or work, and have problems with their parents. Monitoring the Future data previously have shown that since the late 1990s, the prevalence of binge drinking has dropped to lows of 3%, 10%, and 16% among 8th, 10th, and 12th graders, respectively.
Dr. Jang et al. took a look at Monitoring the Future data to see how age, period, and cohort effects might alter FBD patterns among teens. There was an overall decrease in FBD since the 1990s, with the greatest decline among teens born between 1985 and 1990. It appeared that period and cohort effects drove this decline.
However, some subgroups exhibited differences. “The decline in frequent heavy drinking is not uniform, with female adolescents, black youth, and youth from low-SES backgrounds experiencing a less steep decline.”
“Pediatric primary care providers have an opportunity to screen all adolescents for alcohol use as part of routine annual care and to provide brief prevention and early intervention strategies. Despite the reassuring decline in frequent heavy drinking, it is critical that ongoing efforts address differences in declining rates to avoid exacerbating disparities.”
Justine Wittenauer Welsh, MD, of Emory Adolescent Substance Abuse Treatment Services, Emory University, Atlanta; John Rogers Knight, MD, at the Center for Adolescent Substance Abuse Research, Boston Children’s Hospital; and Scott Evan Hadland, MD, MPH, of Boston University, made these comments in an accompanying editorial (Pediatrics. 2017 May 22;139[6]:e20170932). The authors said they received no funding and have no relevant financial disclosures.
The drop in frequent binge drinking (FBD) among adolescents can be attributed to age, period, and cohort effects, but there are variations in certain subgroups of teens, said Joy Bohyun Jang, PhD, and her associates.
The decline in FBD is not as great in teen girls, African American youth, and youth from low socioeconomic backgrounds, so those groups deserve close attention by researchers and clinicians, they said.
The study used an age-period-cohort analysis to examine how these variables affected drinking trends among adolescents, with a particular focus on FBD, which was defined as two or more occasions of consuming at least five alcoholic drinks in a row in the past 2 weeks.
FBD decreased in recent years in all ages during adolescence, suggesting that declines in teen FBD in the past 25 years were “driven by factors influencing all age groups simultaneously as well as influences on particular birth cohorts,” the researchers said. These factors might include greater public efforts to lessen the risk of underage drinking and disapproval of heavy alcohol use among the recent cohorts of teens. “Those born around 1990 had the highest decline of FBD compared with those in the preceding and subsequent cohorts of adolescents.”
But there are variations in FBD among teens by demographics. Boys and those of higher socioeconomic status (SES) showed rapid increases in FBD by age, compared with girls and teens of lower SES, respectively. However, there also has been a convergence in FBD by sex in the more recent time periods because of greater declines in FBD among boys than in girls. Likewise, there is a growing discrepancy by SES in FBD in U.S. teens because higher SES teens were less likely than those from a lower SES to engage in FBD and “the strength of the association is growing in more recent time periods.”
African American youth had the lowest rates of FBD for all the racial groups, yet declines in FBD have been slower among African American youth, compared with white adolescents, since 2007, reported Dr. Jang of the University of Michigan, Ann Arbor, and her associates.
The study was supported by grants from the National Institute on Alcohol Abuse and Alcoholism, the National Institute on Drug Abuse, and was funded by the National Institutes of Health. Dr. Jang and her associates said they had no relevant financial disclosures.
[email protected]
FROM PEDIATRICS
Key clinical point: The drop in frequent binge drinking (FBD) among U.S. teens can be attributed to age, period, and cohort effects, but there are variations in certain teen subgroups.
Major finding: FBD decreased in recent years among all ages during adolescence, suggesting that decreases in teen FBD in the past 25 years were “driven by factors influencing all age groups simultaneously as well as influences on particular birth cohorts.”
Data source: A Monitoring the Future study involved 1,065,022 student responses on self-administered questionnaires during 1991-2015 regarding binge drinking.
Disclosures: The study was supported by grants from the National Institutes of Health. Dr. Jang and her associates said they had no relevant financial disclosures.