User login
Alzheimer’s mortality in U.S. grew from 1999 to 2014
The rate of death attributable to Alzheimer’s disease increased by more than 50% from 1999 to 2014 in the United States, according to a report from the Centers for Disease Control and Prevention.
According to data collected from the National Vital Statistics System, the total number of Alzheimer’s deaths was 44,536 in 1999 and 93,541 in 2014. The mortality in 1999 was 16.5 per 100,000 people, and in 2014 it was 25.4 per 100,000 people, a rate increase of 54.5%. Alzheimer’s was the sixth most common cause of death in 2014, accounting for 3.6% of all U.S. deaths.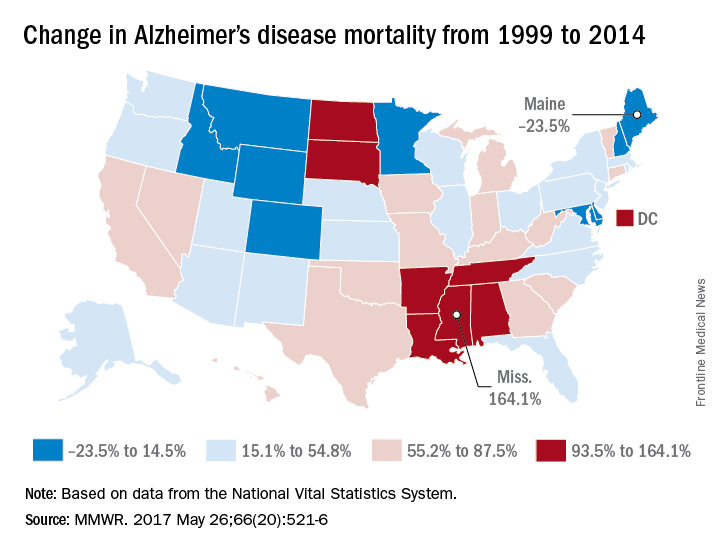
Mississippi, Louisiana, Arkansas, South Dakota, and Tennessee had mortality increases of more than 100%; Mississippi’s 164.1% increase from 13.3 to 35.2 per 100,000 people was the greatest during the study period. Maine, Montana, and Maryland saw decreases in mortality, with the percentages falling 23.5%, 9.9%, and 6.1%, respectively.
“An increasing number of Alzheimer’s deaths coupled with an increasing number of patients dying at home suggests that there is an increasing number of caregivers of persons with Alzheimer’s. It is likely that these caregivers might benefit from interventions such as education, respite care, and case management that can lessen the potential burden of caregiving,” the CDC investigators concluded.
Find the full study in MMWR (2017;66[20]:521-6).
FROM MMWR
My face is all red!
My grandson is almost 3. He is, of course, very advanced in many areas, including self-awareness.
At the moment he is suffering from Fifth Disease. (See how advanced he is – he skipped right over Diseases One through Four!) Every now and then his face clouds over as he announces, to anyone and no one, “My face is all red!”
I am not worried about long-term psychic harm. A moment later his face lights up as he looks up at the sky. “It’s a helicopter!” he declares.

By the way, does his behavior remind you of anyone else you’ve met? How about all your patients with rosacea or facial keratosis pilaris who stop by the office to say, “My face is all red!” If they didn’t notice this themselves, others have been happy to help. “You’re all red!” say their family, friends, and coworkers. “Are you all right?”
What about patients like those? Would you call them vain, or cosmetically oriented?
It seems to me that the behavior of little kids – too young to elaborate their psychological musings – sheds light on the way their elders behave, or the way they will themselves when they grow up. Years ago, I was about to laser the face of a woman with an old pulsed-dye unit that left deep-purple bruises. Her job was to train monkeys for the blind. “I need makeup,” she said. “When my monkeys see red spots on my face, they get very upset and start to point at me.”
“Not just monkeys,” I replied.
To take another example, many years ago I saw a little tyke about 18 months old. His parents were concerned about a mole on his palm.
He was not happy to let me examine him, and he let me know. “It’s OK,” I said, in my most condescending, clueless adult voice. “Your Mom and Dad just asked me to check your boo-boo.”
That set him off. “No boo-boo!” he shouted. “No boo-boo!”
Well, silly me, I later realized. The tyke was right: Of course it was not a boo-boo. A boo-boo is an assault on the integrity of the body: a cut, a scrape, a burn, something new, painful, hard to look at. That is why 9.8 out of 10 people whom we freeze, burn, or puncture look the other way while we do it. It’s also why kids dial their screams down to whimpers when we hide what we froze, burned, or punctured by covering it with a Band-Aid. Now the boo-boo is out of sight.
The tyke’s mole, on the other hand, is not an insult to the body but a part of it. It’s him.
Fast forward 15 years and ask a teen with a large (but not giant) hairy congenital nevus if she wants it off. She does not. “That’s me,” she explains.
Or ask an adult with what you would think is a disfiguring facial port-wine stain what growing up with that was like. “It was fine,” they reply. “Strangers sometimes commented, but my friends knew that was just how I looked.”
Or listen to folks who want their liver spots lasered off. They point to a dozen or so, then add, “But don’t take off that one! That’s always been there. That’s just me.”
If you listen for it, you can pick up how early a lot of adult behavior starts. Little ones destined to be lifetime pickers start scraping off anything that’s raised above the skin. Teens finicky about facial moles or minute perturbations in their complexion grow into fussy adults.
We grownups learn to embroider our primal responses with words, thoughts, feeling, explanations. Kids just come out and say what they think – “My face is all red!”
Soon my grandson will have overcome his Fifth Disease without, I hope, graduating to any higher numbers. His other grandfather is a retired engineer who used to design helicopters. By next year I expect that our mutual grandson will be able to identify anything flying overhead by make and model number.
As I said, he’s very advanced.
Also cute as all get-out, (temporary) red face and all.
Dr. Rockoff practices dermatology in Brookline, Mass., and is a longtime contributor to Dermatology News. He serves on the clinical faculty at Tufts University, Boston, and has taught senior medical students and other trainees for 30 years. His second book, “Act Like a Doctor, Think Like a Patient,” is available at amazon.com and barnesandnoble.com. Write to him at [email protected]
My grandson is almost 3. He is, of course, very advanced in many areas, including self-awareness.
At the moment he is suffering from Fifth Disease. (See how advanced he is – he skipped right over Diseases One through Four!) Every now and then his face clouds over as he announces, to anyone and no one, “My face is all red!”
I am not worried about long-term psychic harm. A moment later his face lights up as he looks up at the sky. “It’s a helicopter!” he declares.
By the way, does his behavior remind you of anyone else you’ve met? How about all your patients with rosacea or facial keratosis pilaris who stop by the office to say, “My face is all red!” If they didn’t notice this themselves, others have been happy to help. “You’re all red!” say their family, friends, and coworkers. “Are you all right?”
What about patients like those? Would you call them vain, or cosmetically oriented?
It seems to me that the behavior of little kids – too young to elaborate their psychological musings – sheds light on the way their elders behave, or the way they will themselves when they grow up. Years ago, I was about to laser the face of a woman with an old pulsed-dye unit that left deep-purple bruises. Her job was to train monkeys for the blind. “I need makeup,” she said. “When my monkeys see red spots on my face, they get very upset and start to point at me.”
“Not just monkeys,” I replied.
To take another example, many years ago I saw a little tyke about 18 months old. His parents were concerned about a mole on his palm.
He was not happy to let me examine him, and he let me know. “It’s OK,” I said, in my most condescending, clueless adult voice. “Your Mom and Dad just asked me to check your boo-boo.”
That set him off. “No boo-boo!” he shouted. “No boo-boo!”
Well, silly me, I later realized. The tyke was right: Of course it was not a boo-boo. A boo-boo is an assault on the integrity of the body: a cut, a scrape, a burn, something new, painful, hard to look at. That is why 9.8 out of 10 people whom we freeze, burn, or puncture look the other way while we do it. It’s also why kids dial their screams down to whimpers when we hide what we froze, burned, or punctured by covering it with a Band-Aid. Now the boo-boo is out of sight.
The tyke’s mole, on the other hand, is not an insult to the body but a part of it. It’s him.
Fast forward 15 years and ask a teen with a large (but not giant) hairy congenital nevus if she wants it off. She does not. “That’s me,” she explains.
Or ask an adult with what you would think is a disfiguring facial port-wine stain what growing up with that was like. “It was fine,” they reply. “Strangers sometimes commented, but my friends knew that was just how I looked.”
Or listen to folks who want their liver spots lasered off. They point to a dozen or so, then add, “But don’t take off that one! That’s always been there. That’s just me.”
If you listen for it, you can pick up how early a lot of adult behavior starts. Little ones destined to be lifetime pickers start scraping off anything that’s raised above the skin. Teens finicky about facial moles or minute perturbations in their complexion grow into fussy adults.
We grownups learn to embroider our primal responses with words, thoughts, feeling, explanations. Kids just come out and say what they think – “My face is all red!”
Soon my grandson will have overcome his Fifth Disease without, I hope, graduating to any higher numbers. His other grandfather is a retired engineer who used to design helicopters. By next year I expect that our mutual grandson will be able to identify anything flying overhead by make and model number.
As I said, he’s very advanced.
Also cute as all get-out, (temporary) red face and all.
Dr. Rockoff practices dermatology in Brookline, Mass., and is a longtime contributor to Dermatology News. He serves on the clinical faculty at Tufts University, Boston, and has taught senior medical students and other trainees for 30 years. His second book, “Act Like a Doctor, Think Like a Patient,” is available at amazon.com and barnesandnoble.com. Write to him at [email protected]
Recognizing and treating pediatric bug infestations
Pruritic bug infestations are a common problem among school-age children, Albert C. Yan, MD, said at a pediatric dermatology meeting sponsored by Rady Children’s Hospital-San Diego and UC San Diego School of Medicine.
– and it is essential for you to be able to recognize and treat these appropriately. You also need to know resistance patterns, and how to counsel patient on full treatment protocol.

Carpet beetle dermatitis presents in children with a history of spending lots of time on a carpet, presenting with nondescript itchy patches on skin areas that were in contact with the carpet. Carpet beetle dermatitis is becoming more common on the east coast. Patients can actually find these beetles, which have tiger-striped coloring and have little prickly hairs that stick out of them, in their carpets. The beetles do not bite; rather, the rash is a reaction from exposure to insect blood or the larval hairs. The adult beetles tend to feed on carpet fabrics, wool, grains of food products, animal material, or nectar and pollen in flowers. The treatment is to get rid of the beetles. To rid the house of the beetles, it is recommended to vacuum, remove contaminated food sources, freeze stuffed animals for 10-14 days, and have an exterminator visit the home. Bringing in fresh cut flowers from the garden without rinsing them may bring the beetles into the house.
Scabies tends to be an itchy, widespread dermatosis. It is associated with extensive small skin papules scattered across the body with linear or curvilinear burrows, and tends to present from the elbows or knees distally, and especially in webbed areas, such as between the fingers. Keeping these geographic locations in mind makes it easier to differentiate scabies from hand dermatitis and eczema, said Dr. Yan, chief of pediatric dermatology at Children’s Hospital of Philadelphia and professor of pediatrics and dermatology at the University of Pennsylvania, Philadelphia.
To help diagnose this infestation, scrape the lesion and visualize the mite, the scybala or mite feces, or the oval eggs under the microscope.
The treatment is a “permethrin party.” Luckily, the scabies mite has very little documented resistance to permethrin 5% cream. However, with recurrent treatment, resistance starts to develop, he said. Proper administration is critical in controlling the infestation. For an adult, use 3 ounces or one tube, and for a child, use about 1.5 ounces for a child or one-half a tube. Apply it to the skin from neck down, leave it on for 8 hours overnight. Treat the patient and family members or close contacts. Repeat this application in 1 week. Oral ivermectin is effective and is useful in older kids who may not adhere to the permethrin.
A commonly encountered problem is apparent treatment failure. The scabies may be identified, treated, and then they appear to recur. Some patients have persistent postscabetic itch – the patients are still itchy afterward, but the lesions look excoriated and different than the original scabies lesions. The patient does not need retreatment, Dr. Yan emphasized. Rather, use topical corticosteroids or antihistamines to treat the itch.
Another explanation is improper use of medication – for instance, only certain parts of the skin were treated or all family members had not been treated. In this case, everyone needs to be retreated, he said. Reinfection is possible, but resistance is unlikely. Patients with scabies sometimes develop scabetic nodules or hypersensitivity nodules. Often, these are leftover areas of inflammation that can remain for up to 1 year. Dr. Yan recommends treating these areas with low-dose topical steroids.
The last phenomena presents with recurrent crops of pustules in the acral area, which is acropustulosis of infancy or postscabetic pustulosis. This is a variant of acropustulosis of infancy, in that it is more likely to involve the torso than is traditional acropustulosis and tends to be cyclical in that it reappears every few weeks.

Recently, the Journal of Medical Entomology published study findings in which head lice genetics were assessed, raising the concern about the development of “super lice.” However, this information has not yet brought treatment changes.
The conventional treatments include Nix, Rid, Triple X, but there can be a fair amount of resistance with these OTC treatment. Other options include mayonnaise and olive oil, however, not much data support the efficacy of this treatment. There are three prescription medications available: benzyl alcohol lotion, spinosad topical suspension, and ivermectin lotion. Start with these treatments quickly when dealing with lice that are resistant. Oral ivermectin also is effective. Dr. Yan concluded his lecture with discussion of other techniques that have been Food and Drug Administration–cleared, such as blowing drying them off the head, if one is okay with them landing in the office!
Dr. Yan reported no relevant financial disclosures.
Pruritic bug infestations are a common problem among school-age children, Albert C. Yan, MD, said at a pediatric dermatology meeting sponsored by Rady Children’s Hospital-San Diego and UC San Diego School of Medicine.
– and it is essential for you to be able to recognize and treat these appropriately. You also need to know resistance patterns, and how to counsel patient on full treatment protocol.
Carpet beetle dermatitis presents in children with a history of spending lots of time on a carpet, presenting with nondescript itchy patches on skin areas that were in contact with the carpet. Carpet beetle dermatitis is becoming more common on the east coast. Patients can actually find these beetles, which have tiger-striped coloring and have little prickly hairs that stick out of them, in their carpets. The beetles do not bite; rather, the rash is a reaction from exposure to insect blood or the larval hairs. The adult beetles tend to feed on carpet fabrics, wool, grains of food products, animal material, or nectar and pollen in flowers. The treatment is to get rid of the beetles. To rid the house of the beetles, it is recommended to vacuum, remove contaminated food sources, freeze stuffed animals for 10-14 days, and have an exterminator visit the home. Bringing in fresh cut flowers from the garden without rinsing them may bring the beetles into the house.
Scabies tends to be an itchy, widespread dermatosis. It is associated with extensive small skin papules scattered across the body with linear or curvilinear burrows, and tends to present from the elbows or knees distally, and especially in webbed areas, such as between the fingers. Keeping these geographic locations in mind makes it easier to differentiate scabies from hand dermatitis and eczema, said Dr. Yan, chief of pediatric dermatology at Children’s Hospital of Philadelphia and professor of pediatrics and dermatology at the University of Pennsylvania, Philadelphia.
To help diagnose this infestation, scrape the lesion and visualize the mite, the scybala or mite feces, or the oval eggs under the microscope.
The treatment is a “permethrin party.” Luckily, the scabies mite has very little documented resistance to permethrin 5% cream. However, with recurrent treatment, resistance starts to develop, he said. Proper administration is critical in controlling the infestation. For an adult, use 3 ounces or one tube, and for a child, use about 1.5 ounces for a child or one-half a tube. Apply it to the skin from neck down, leave it on for 8 hours overnight. Treat the patient and family members or close contacts. Repeat this application in 1 week. Oral ivermectin is effective and is useful in older kids who may not adhere to the permethrin.
A commonly encountered problem is apparent treatment failure. The scabies may be identified, treated, and then they appear to recur. Some patients have persistent postscabetic itch – the patients are still itchy afterward, but the lesions look excoriated and different than the original scabies lesions. The patient does not need retreatment, Dr. Yan emphasized. Rather, use topical corticosteroids or antihistamines to treat the itch.
Another explanation is improper use of medication – for instance, only certain parts of the skin were treated or all family members had not been treated. In this case, everyone needs to be retreated, he said. Reinfection is possible, but resistance is unlikely. Patients with scabies sometimes develop scabetic nodules or hypersensitivity nodules. Often, these are leftover areas of inflammation that can remain for up to 1 year. Dr. Yan recommends treating these areas with low-dose topical steroids.
The last phenomena presents with recurrent crops of pustules in the acral area, which is acropustulosis of infancy or postscabetic pustulosis. This is a variant of acropustulosis of infancy, in that it is more likely to involve the torso than is traditional acropustulosis and tends to be cyclical in that it reappears every few weeks.
Recently, the Journal of Medical Entomology published study findings in which head lice genetics were assessed, raising the concern about the development of “super lice.” However, this information has not yet brought treatment changes.
The conventional treatments include Nix, Rid, Triple X, but there can be a fair amount of resistance with these OTC treatment. Other options include mayonnaise and olive oil, however, not much data support the efficacy of this treatment. There are three prescription medications available: benzyl alcohol lotion, spinosad topical suspension, and ivermectin lotion. Start with these treatments quickly when dealing with lice that are resistant. Oral ivermectin also is effective. Dr. Yan concluded his lecture with discussion of other techniques that have been Food and Drug Administration–cleared, such as blowing drying them off the head, if one is okay with them landing in the office!
Dr. Yan reported no relevant financial disclosures.
Pooled Data Show Benefits of Cladribine Tablets on Relapse Rates and Disability Progression in Patients With MS
NEW ORLEANS—Analysis of pooled data from the CLARITY and ONWARD studies showed that cladribine tablets 3.5 mg/kg decreased annualized relapse rate by 57% and reduced the risk for six-month confirmed disability progression by 39% versus placebo in a population of patients with active relapsing multiple sclerosis (MS). These findings were presented at the 31st Annual Meeting of the Consortium of MS Centers.
Treatment with cladribine tablets in the CLARITY and ONWARD studies demonstrated efficacy versus placebo across a range of patients with active MS. “Combining efficacy data from the double-blind periods of these studies allows assessment of the efficacy of two years’ treatment with cladribine tablets 3.5 mg/kg,” said Gavin Giovannoni, MBBCh, PhD, on behalf of his research colleagues. Dr. Giovannoni is a Professor at the Blizard Institute at Barts and the London School of Medicine and Dentistry in London.

Dr. Giovannoni and colleagues used pooled data from the two-year, double-blind periods of CLARITY and ONWARD to analyze the efficacy of cladribine tablets 3.5 mg/kg in patients with relapsing MS (n = 1,067) and in subgroups defined by baseline characteristics. Patients from ONWARD on cladribine tablets or placebo were also taking interferon beta. Annualized relapse rates and three-month and six-month confirmed disability progression were compared using relative risk ratios from a Poisson regression model, hazard ratios from a Cox proportional hazard model, and 95% confidence intervals for patients treated with cladribine tablets 3.5 mg/kg or placebo. The subgroups analyzed included, among others, patients with no T1 gadolinium-enhancing lesions (n = 759) or one or more T1 gadolinium-enhancing lesions (n = 308) and patients with an Expanded Disability Status Scale (EDSS) score of 3.0 or lower (n = 653) or 3.5 or greater (n = 414).
For annualized relapse rate, consistent benefits were seen with cladribine tablets 3.5 mg/kg versus placebo in the overall population (relative risk ratio: 0.43) and in the subgroups: no T1 gadolinium-enhancing lesions, 0.46; one or more T1 gadolinium-enhancing lesions, 0.38; EDSS of 3.0 or lower, 0.40; EDSS of 3.5 or greater, 0.47. Benefits favored cladribine tablets 3.5 mg/kg versus placebo in the overall population for time to three-month confirmed disability progression (hazard ratio: 0.64) and six-month confirmed disability progression (hazard ratio: 0.61) and in each of these outcomes in a majority of subgroups. For three-month confirmed disability progression: no T1 gadolinium-enhancing lesions, hazard ratio: 0.59; one or more T1 gadolinium-enhancing lesions, hazard ratio: 0.75; EDSS of 3.0 or lower, hazard ratio: 0.76; EDSS of 3.5 or greater, hazard ratio: 0.55. For six-month confirmed disability progression: no T1 gadolinium-enhancing lesions, hazard ratio: 0.59; one or more T1 gadolinium-enhancing lesions, hazard ratio: 0.66; EDSS of 3.0 or lower, hazard ratio: 0.75; EDSS of 3.5 or greater, hazard ratio: 0.51.
This study was supported by EMD Serono.
NEW ORLEANS—Analysis of pooled data from the CLARITY and ONWARD studies showed that cladribine tablets 3.5 mg/kg decreased annualized relapse rate by 57% and reduced the risk for six-month confirmed disability progression by 39% versus placebo in a population of patients with active relapsing multiple sclerosis (MS). These findings were presented at the 31st Annual Meeting of the Consortium of MS Centers.
Treatment with cladribine tablets in the CLARITY and ONWARD studies demonstrated efficacy versus placebo across a range of patients with active MS. “Combining efficacy data from the double-blind periods of these studies allows assessment of the efficacy of two years’ treatment with cladribine tablets 3.5 mg/kg,” said Gavin Giovannoni, MBBCh, PhD, on behalf of his research colleagues. Dr. Giovannoni is a Professor at the Blizard Institute at Barts and the London School of Medicine and Dentistry in London.
Dr. Giovannoni and colleagues used pooled data from the two-year, double-blind periods of CLARITY and ONWARD to analyze the efficacy of cladribine tablets 3.5 mg/kg in patients with relapsing MS (n = 1,067) and in subgroups defined by baseline characteristics. Patients from ONWARD on cladribine tablets or placebo were also taking interferon beta. Annualized relapse rates and three-month and six-month confirmed disability progression were compared using relative risk ratios from a Poisson regression model, hazard ratios from a Cox proportional hazard model, and 95% confidence intervals for patients treated with cladribine tablets 3.5 mg/kg or placebo. The subgroups analyzed included, among others, patients with no T1 gadolinium-enhancing lesions (n = 759) or one or more T1 gadolinium-enhancing lesions (n = 308) and patients with an Expanded Disability Status Scale (EDSS) score of 3.0 or lower (n = 653) or 3.5 or greater (n = 414).
For annualized relapse rate, consistent benefits were seen with cladribine tablets 3.5 mg/kg versus placebo in the overall population (relative risk ratio: 0.43) and in the subgroups: no T1 gadolinium-enhancing lesions, 0.46; one or more T1 gadolinium-enhancing lesions, 0.38; EDSS of 3.0 or lower, 0.40; EDSS of 3.5 or greater, 0.47. Benefits favored cladribine tablets 3.5 mg/kg versus placebo in the overall population for time to three-month confirmed disability progression (hazard ratio: 0.64) and six-month confirmed disability progression (hazard ratio: 0.61) and in each of these outcomes in a majority of subgroups. For three-month confirmed disability progression: no T1 gadolinium-enhancing lesions, hazard ratio: 0.59; one or more T1 gadolinium-enhancing lesions, hazard ratio: 0.75; EDSS of 3.0 or lower, hazard ratio: 0.76; EDSS of 3.5 or greater, hazard ratio: 0.55. For six-month confirmed disability progression: no T1 gadolinium-enhancing lesions, hazard ratio: 0.59; one or more T1 gadolinium-enhancing lesions, hazard ratio: 0.66; EDSS of 3.0 or lower, hazard ratio: 0.75; EDSS of 3.5 or greater, hazard ratio: 0.51.
This study was supported by EMD Serono.
Preliminary Results Suggest Ublituximab Is Safe in Relapsing Multiple Sclerosis
NEW ORLEANS—Ublituximab, a novel glycoengineered anti-CD20 antibody, is well tolerated and demonstrates rapid and robust B-cell depletion, according to a report presented at the 31st Annual Meeting of the Consortium of Multiple Sclerosis Centers. “Unlike other anti-CD20s, ublituximab can be delivered in shorter infusions, providing a convenience benefit for patients,” reported Amy Lovett-Racke, PhD, and her research colleagues. Dr. Lovett-Racke is a Professor in the Department of Microbial Infection and Immunity at Ohio State University Medical Center in Columbus.

Patients with relapsing or primary progressive forms of multiple sclerosis (MS) have shown significant clinical improvement after B-cell depletion with an anti-CD20 antibody. Ublituximab is a chimeric monoclonal antibody that targets a unique epitope on the CD20 antigen. It has been glycoengineered to enhance affinity for all variants of FcgRIIIa receptors, demonstrating greater antibody-dependent cellular cytotoxicity (ADCC) activity than rituximab. Ublituximab is currently in phase III trials for the treatment of hematologic malignancies.
To determine the level of B-cell depletion by ublituximab in subjects with relapsing MS, Dr. Lovett-Racke and colleagues conducted a 52-week, phase II, placebo-controlled, multicenter study that was designed to assess the infusion time and optimal dose as well as the safety and tolerability of ublituximab in patients with relapsing MS. The investigators also performed radiologic and clinical analyses. Optimal dosing was determined by B-cell depletion, defined as percentage of CD19+ B cells present following ublituximab administration. This percentage was calculated by gating the entire lymphocyte/myeloid population. Within this population, CD19+ CD3− cells were gated, and the percentage of CD19+ B cells was determined.
To date, B-cell data from 11 subjects have been analyzed up to week four of the 52-week study, encompassing two infusions of ublituximab. No severe adverse events have been reported, including in subjects receiving rapid infusions. Only patients whose B-cell levels were within a normal range (≥ 5% of total lymphocytes) at screening were included in the study. At week four (one week post second infusion), median B-cell depletion was 99% from baseline in ublituximab-treated subjects, while controls maintained similar B-cell levels, as compared with baseline.
This study was supported by TG Therapeutics.
NEW ORLEANS—Ublituximab, a novel glycoengineered anti-CD20 antibody, is well tolerated and demonstrates rapid and robust B-cell depletion, according to a report presented at the 31st Annual Meeting of the Consortium of Multiple Sclerosis Centers. “Unlike other anti-CD20s, ublituximab can be delivered in shorter infusions, providing a convenience benefit for patients,” reported Amy Lovett-Racke, PhD, and her research colleagues. Dr. Lovett-Racke is a Professor in the Department of Microbial Infection and Immunity at Ohio State University Medical Center in Columbus.
Patients with relapsing or primary progressive forms of multiple sclerosis (MS) have shown significant clinical improvement after B-cell depletion with an anti-CD20 antibody. Ublituximab is a chimeric monoclonal antibody that targets a unique epitope on the CD20 antigen. It has been glycoengineered to enhance affinity for all variants of FcgRIIIa receptors, demonstrating greater antibody-dependent cellular cytotoxicity (ADCC) activity than rituximab. Ublituximab is currently in phase III trials for the treatment of hematologic malignancies.
To determine the level of B-cell depletion by ublituximab in subjects with relapsing MS, Dr. Lovett-Racke and colleagues conducted a 52-week, phase II, placebo-controlled, multicenter study that was designed to assess the infusion time and optimal dose as well as the safety and tolerability of ublituximab in patients with relapsing MS. The investigators also performed radiologic and clinical analyses. Optimal dosing was determined by B-cell depletion, defined as percentage of CD19+ B cells present following ublituximab administration. This percentage was calculated by gating the entire lymphocyte/myeloid population. Within this population, CD19+ CD3− cells were gated, and the percentage of CD19+ B cells was determined.
To date, B-cell data from 11 subjects have been analyzed up to week four of the 52-week study, encompassing two infusions of ublituximab. No severe adverse events have been reported, including in subjects receiving rapid infusions. Only patients whose B-cell levels were within a normal range (≥ 5% of total lymphocytes) at screening were included in the study. At week four (one week post second infusion), median B-cell depletion was 99% from baseline in ublituximab-treated subjects, while controls maintained similar B-cell levels, as compared with baseline.
This study was supported by TG Therapeutics.

Five year survival doubles for younger women with de novo MBC
Nearly 155,000 women in the United States are living with metastatic breast cancer (MBC), three-fourths of whom were initially diagnosed with lower-stage disease that progressed to stage IV, based on estimated prevalence data.
The estimates, derived from national breast cancer mortality and survival data, also show positive trends in breast cancer care, especially a doubling of 5-year survival rates among younger women diagnosed with de novo metastatic disease from the 1990s to the 2000s, reported Angela B. Mariotto, PhD, of the National Cancer Institute and her colleagues.
“Despite the progressive and incurable nature of almost all MBC, median survival after diagnosis with metastatic disease has been increasing, resulting in a growing number of women living with MBC in the United States. The increased survival is especially noted for women diagnosed at younger ages,” they wrote in Cancer Epidemiology, Biomarkers, & Prevention (2017 May 18. doi: 10.1158/1055-9965.epi-16-088).
Patients with advanced breast cancer require extensive care and intensive use of medical and other resources, but, until this study, there were no reliable estimates of the number of women actually living with metastatic disease in the United States, the authors said.
To get a clearer picture of the prevalence of advanced breast cancer in the United States, they worked backward from Surveillance, Epidemiology, and End Results data on breast cancer deaths and survival, working on the assumption that each observed breast cancer death is the result of metastatic disease, either in women whose initial diagnosis was stage IV disease (de novo metastatic disease) or disease recurrence with metastases.
They estimated that, in 2013, the most recent year for which there were observed data, the prevalence of metastatic breast cancer was 138,622, and that 38,897 (28%) of survivors were diagnosed with metastatic disease. The remaining 99,725 survivors (72%) were women who were initially diagnosed with stage I-III disease that either recurred or metastasized.
The authors calculated that 50,344 women were diagnosed with de novo metastatic disease in 2013, 12,966 of whom (26%) had de novo metastatic breast cancer and 37,378 of whom had recurrent disease. They projected that, as of Jan. 1, 2017, there are 154,794 women living with metastatic breast cancer in the United States.
They also estimated changes over time in survival and found that, for women diagnosed from the ages of 15 to 49 during the 1992-1994 surveillance period, median survival time was 22.3 months, which improved to 38.7 months during the 2005-2012 surveillance period. The respective survival times for women 50-64 years were 19.1 months and 29.7 months.
For women 15-49 years who were diagnosed with de novo metastatic breast cancer, the 5-year relative survival rates doubled from 18% during 1992-1994 to 36% during 2005-2012.
“Despite a poor prognosis, there is a small but meaningful percentage of these cases who survive 10 years or more. More than 11% of women diagnosed between 2000-2004 under the age of 64 years survived 10 years or more. Younger women diagnosed with de novo MBC have higher survival than women diagnosed at older ages,” Dr. Mariotto and her colleagues wrote.
The investigators pointed to the population size, population-based data, long follow-up, and use of consistent staging definitions over time as study strengths but acknowledged that the study was limited by the absence of population-based estimates of survival following recurrence of metastatic breast cancer.
“To our knowledge, this is the first time that the number of women living with MBC in the United States has been estimated. These estimates provide a new perspective on the population burden of breast cancer and have great potential significance to the research and advocacy community working on behalf of patients with MBC and their families,” the authors wrote.
The study was supported by the National Cancer Institute. The authors reported no relevant financial disclosures.
This article was updated June 5, 2017.
FROM CANCER EPIDEMIOLOGY, BIOMARKERS & PREVENTION
Key clinical point: An estimated 155,000 women are living with metastatic breast cancer in the United States.
Major finding: Among women diagnosed from ages 15 to 49 with de novo metastatic breast cancer, the 5-year relative survival doubled from 18% during 1992-1994 to 36% during 2005-2012.
Data source: An epidemiologic estimate of metastatic breast cancer prevalence in the United States using SEER data.
Disclosures: The study was supported by the National Cancer Institute. The authors reported no relevant financial disclosures.
Continuing tamoxifen costs less, performs better in ER+ breast cancer
AT ACOG 2017
SAN DIEGO – Continuation of tamoxifen for an additional 5 years is a cost-effective strategy that does not increase all-cause mortality for premenopausal women with estrogen receptor–positive breast cancer, based on an analysis using sophisticated computational modeling techniques.
“For premenopausal women with an early estrogen receptor–positive breast cancer who have completed 5 years of tamoxifen as initial treatment, another 5 years of tamoxifen is preferable to ovarian ablation with an aromatase inhibitor as extended endocrine treatment,” Janice Kwon, MD, said at the annual meeting of the American College of Obstetricians and Gynecologists.
The researchers sought to answer a key clinical question: “What is the optimal endocrine strategy for premenopausal women who have completed 5 years of tamoxifen? Another 5 years of tamoxifen? An aromatase inhibitor preceded by ovarian ablation? Or no further treatment?”
Dr. Kwon and her coinvestigators used a Markov Monte Carlo simulation to project adverse events that would occur with each of the three treatments in a hypothetical cohort of 18,000 premenopausal women with estrogen receptor–positive breast cancer. They also conducted sensitivity analyses to ascertain the point at which a given treatment would become cost effective. The investigators used a time horizon of 40 years in the Monte Carlo simulation, which uses repeated random sampling of a large data set to model the probability of a variety of outcomes. The primary outcome measure used to compare the three treatment strategies was the incremental cost-effectiveness ratio (ICER).
For the no further treatment strategy, the average costs were $1,074, for an average life expectancy gain of 16.69 years. Compared with this strategy, 5 more years of tamoxifen would cost $3,550 for an average life expectancy gain of 17.31 years, yielding an ICER of $4,042. The strategy of performing a bilateral salpingo-oophorectomy (BSO), followed by 5 years of aromatase inhibitor therapy, was more costly at $14,312 and yielded a shorter life expectancy gain at an average of 17.06 years, eliminating it as a feasible strategy in the ICER analysis.
Using the Monte Carlo simulation to assess treatment-related mortality, Dr. Kwon and her colleagues found that no further treatment would result in the most deaths from breast cancer, at 7,358. For this, and each of the other two strategies, the investigators also modeled deaths from other causes and from early BSO, using the Nurses’ Health Study hazard ratios. No further treatment would result in 5,878 deaths from other causes and none from early BSO, for a total of 13,236.
Another 5 years of tamoxifen, the model showed, would result in 6,227 deaths from breast cancer, 6,330 from other causes, and none from BSO, for a total of 12,557.
The BSO–aromatase inhibitor strategy was modeled to have the fewest deaths from breast cancer (5,504) and from other causes (5,834) but would result in an additional 1,897 deaths from the early BSO. The BSO–aromatase inhibitor strategy thus resulted in a virtually identical number of deaths over a 40-year period as no treatment at all, at 13,235.
An aromatase inhibitor is frequently considered as a treatment strategy for women with estrogen receptor–positive breast cancer. However, using an aromatase inhibitor is predicated on the patient being menopausal, so ovarian ablation is recommended for patients who have, or who may have, intact ovarian function.
Nearly 3 decades’ worth of data from the Nurses’ Health Study showed an overall hazard ratio of 1.41 for premenopausal oophorectomy without hormone therapy, said Dr. Kwon of the gynecologic oncology division at the University of British Columbia, Vancouver. Increased rates of osteoporosis, stroke, and coronary heart disease contributed to the increased risk, with 80% of the excess deaths occurring within 15 years of oophorectomy. The analysis yielded a number needed to harm for the procedure of eight.
The study’s results have also been substantiated by a recent meta-analysis, said Dr. Kwon, that also saw “fewer disease-free events but more deaths with aromatase inhibitor versus tamoxifen” (Breast Cancer Res Treat. 2017;161:185-90). However, she said, the long-term outcomes of breast cancer over many decades are unknown, and the analysis did not include costs for treatment of recurrent breast cancer.
No external funding sources were reported, and Dr. Kwon reported having no relevant financial disclosures.
[email protected]
On Twitter @karioakes
Key clinical point:
Major finding: Continuation of tamoxifen for 5 more years resulted in 678 fewer deaths than did receipt of an aromatase inhibitor and oophorectomy in a hypothetical cohort of 18,000 women.
Data source: Monte Carlo simulation and sensitivity analysis of a hypothetical cohort of 18,000 premenopausal women with estrogen receptor–positive breast cancer.
Disclosures: No external funding sources were reported, and the researchers reported having no relevant financial disclosures.
FDA advisory committee supports L-glutamine for SCD
The available data on the use of L-glutamine powder for treating sickle cell disease is favorable in terms of the agent’s overall benefit-risk profile, a majority of the Food and Drug Administration’s Oncologic Drugs Advisory Committee agreed during a meeting May 24.
L-glutamine powder, which is used as an oral solution for treating sickle cell disease, showed moderate benefit in a phase III study and a smaller phase II study, and if approved by the FDA – which usually follows the recommendations of its advisory committees – would be only the second treatment approved for the debilitating and sometimes deadly disease. The first, hydroxyurea, was approved for use in adults in 1998.
The committee voted 10-3 in favor of L-glutamate, after hearing from representatives of the new drug marketing applicant, Emmaus Medical, about the efficacy and safety data, as well as from FDA representatives who analyzed the data, physicians who treat sickle cell patients, patient advocates, and patients and their family members who gave emotional testimony in favor of approving this treatment.
“This is clearly a bad disease. It’s worse than cancer in many ways. I think probably mostly from a stigma standpoint it has a desperate need [for treatments],” said acting committee chair Brian I. Rini, MD, who voted in favor of the agent.
While there were some concerns about the data, including questions about methodologies, differential dropout rates between study arms, baseline characteristics that may have affected outcomes, and discrepancies between the Emmaus Medical data and the FDA’s analyses of the data, “all seemed to come down in favor of the agent,” Dr. Rini said, citing its “modest but consistent benefit” and low risk.
“I think one thing that’s strikingly clear is that even any sort of modest benefit in this community, given the sequelae of crises, is significant; it doesn’t take much to produce a clinical impact, and that should be motivation to study more drugs in this disease,” he said.
Another focus among those who voted “yes” was on the overwhelming need for treatment for sickle cell patients, who spend “a hugely disproportionate part of their life in the health care system, and who have had a tremendous burden imposed on them by their disease,” according to Harold J. Burstein, MD, PhD, of Dana-Farber Cancer Institute in Boston, who said he was swayed by the low risk of toxicity and the corroborating evidence in the phase II and III trials.
“What I took away was that one fewer hospital visit per year was a clinically compelling benefit for any individual or family or hospital that might be caring for patients with sickle cell disease,” he said, referencing a finding that treated patients had three visits, compared with four visits among patients in the placebo group, in the phase III study.
The data presented to the committee during the meeting by Yutaka Niihara, MD, of Emmaus Medical, included findings from a phase III randomized, placebo-controlled multicenter study (GLUSCC09-01) involving patients aged 5 years and older with sickle cell disease or beta-0 thalassemia who had at least two episodes of painful crises within the 12 months prior to screening. A total of 152 patients were randomized to receive oral L-glutamine at a dose of 0.3 mg/kg per day for 48 weeks followed by a 3-week tapering period, and 78 received placebo.
The Emmaus Medical analysis demonstrated a significant decrease in crisis events (median of 3 vs. 4) among treatment vs. placebo group patients, and the time to second crisis was delayed by 79 days in the treatment group (hazard ratio 0.68). The analysis, however, was complicated by the differential dropout rates (36% vs. 24% in the treatment and placebo arms, respectively), necessitating the use of imputation methods. Various methods were used to handle the missing data, and the findings with each of them favored L-glutamine, but each had important limitations, and while the FDA’s analysis of the various approaches showed that each favored L-glutamine over placebo with a range of reduction in the rates of crises from 0.4 to 0.9, this contributed to the decision by some panel member to vote against the agent.
The phase II study (Study 10478), which had a similar design, failed to meet its specified significance level for primary efficacy analysis, but showed a trend in favor of L-glutamine vs. placebo, Dr. Niihara said.
As for safety, Dr. Niihara reported that a safety population of 187 patients treated with L-glutamine and 111 treated with placebo in the phase II and III studies showed that most patients experienced a treatment-emergent adverse event – most often sickle cell anemia with crisis (66% and 72% in the groups, respectively) and acute chest syndrome (7% and 19%, respectively). Treatment-emergent adverse events led to withdrawal in 2.7% and 0.9% of patients, respectively. The most common adverse reactions were constipation, nausea, headache, cough, pain in the extremities, back pain, chest pain, and abdominal pain.
Bernard F. Cole, PhD, who was among the “no” votes, said he had concerns about “the limitations resulting from differential dropout” rates, which may have artificially shifted the risk profile.
“As a result of those limitations, it’s not clear whether patients at higher risk of a [sickle cell crisis] event might have disproportionately dropped out of the L-glutamine arm,” he explained. “My hope is that the sponsors can more thoroughly address the limitations of this pivotal trial with the FDA,” said Dr. Cole, a professor in the department of mathematics and statistics at the University of Vermont, Burlington.
Dr. Rini, despite his “yes” vote, agreed with the need for more data, noting that additional data analysis could help when it comes to clinical application of L-glutamine.
Specifically, more data regarding duration of therapy and quality data collection that “borrows from the cancer world ... in terms of rigor or data collection,” is needed, he said.
The committee members had no relevant conflicts of interests to disclose.
Key clinical point:
Major finding: In a phase III study, there was a significant decrease in crisis events (median of 3 vs. 4) among treatment vs. placebo group patients.
Data source: A total of 152 patients were randomized to receive oral L-glutamine at a dose of 0.3 mg/kg per day for 48 weeks followed by a 3-week tapering period, and 78 received placebo.
Disclosures: The committee members had no relevant conflicts of interests to disclose.
MRI Lesion Activity and Relapses May Predict Short- and Long-Term Outcomes in MS
NEW ORLEANS—MRI lesion activity and relapses in the phase III TRANSFORMS study predicted relapses in the short and long terms among patients with multiple sclerosis (MS), according to research presented at the 31st Annual Meeting of the Consortium of MS Centers. In addition, baseline Expanded Disability Status Scale (EDSS) score, age, and disease duration predicted six-month confirmed disability progression.

Disease and treatment history, early MRI lesion activity, and relapses may predict long-term clinical outcomes in patients with relapsing forms of MS. To test the ability of parameters at baseline and during treatment to predict relapses or six-month disability progression in the short and long terms, Dr. Boster and colleagues conducted a post-hoc analysis of the 36-month follow-up of TRANSFORMS, a 12-month, double-blind study in which researchers randomized patients to oral fingolimod or intramuscular interferon beta-1a.
After the 12-month, double-blind study, patients could enter a long-term extension. Upon entering the extension, researchers switched patients who originally received intramuscular interferon beta-1a to fingolimod. The investigators used unadjusted logistic regression to assess which parameters from baseline to month 12 predicted clinical outcomes (ie, relapses or six-month confirmed disability progress, measured using the EDSS) during months 12–24 and months 12–48.
In all, researchers randomized 1,292 patients in TRANSFORMS. Predictors of relapses in the short and long terms included a combination of MRI lesion activity (ie, at least one gadolinium-enhancing lesion or at least two new T2 lesions) and at least one confirmed relapse (odds ratio [OR], 2.776 for months 12–24; OR, 3.703 for months 12–48). The number of confirmed relapses from baseline to month 12 also predicted relapses during the extension.
Novartis Pharmaceuticals supported this study.
NEW ORLEANS—MRI lesion activity and relapses in the phase III TRANSFORMS study predicted relapses in the short and long terms among patients with multiple sclerosis (MS), according to research presented at the 31st Annual Meeting of the Consortium of MS Centers. In addition, baseline Expanded Disability Status Scale (EDSS) score, age, and disease duration predicted six-month confirmed disability progression.
Disease and treatment history, early MRI lesion activity, and relapses may predict long-term clinical outcomes in patients with relapsing forms of MS. To test the ability of parameters at baseline and during treatment to predict relapses or six-month disability progression in the short and long terms, Dr. Boster and colleagues conducted a post-hoc analysis of the 36-month follow-up of TRANSFORMS, a 12-month, double-blind study in which researchers randomized patients to oral fingolimod or intramuscular interferon beta-1a.
After the 12-month, double-blind study, patients could enter a long-term extension. Upon entering the extension, researchers switched patients who originally received intramuscular interferon beta-1a to fingolimod. The investigators used unadjusted logistic regression to assess which parameters from baseline to month 12 predicted clinical outcomes (ie, relapses or six-month confirmed disability progress, measured using the EDSS) during months 12–24 and months 12–48.
In all, researchers randomized 1,292 patients in TRANSFORMS. Predictors of relapses in the short and long terms included a combination of MRI lesion activity (ie, at least one gadolinium-enhancing lesion or at least two new T2 lesions) and at least one confirmed relapse (odds ratio [OR], 2.776 for months 12–24; OR, 3.703 for months 12–48). The number of confirmed relapses from baseline to month 12 also predicted relapses during the extension.
Novartis Pharmaceuticals supported this study.

Stem cell therapy significantly improves ulcer healing
PORTLAND, ORE. – Treating chronic venous leg ulcers with mesenchymal stem cells and fibrin spray significantly improved wound healing, compared with vehicle control or saline plus conventional therapy, according to the results of a small randomized, controlled, double-blind pilot trial.
“Topical application of autologous, bone-marrow–derived mesenchymal stem cells may be an effective way to promote healing in patients with difficult-to-heal wounds,” said Ayman Grada, MD, of the department of dermatology at Boston University. “However, larger studies are needed to confirm this finding.”

“Various treatment modalities have been used, but treatment outcomes are not always satisfactory,” said Dr. Grada. “In about 60% of cases, wounds fail to close, and there is also a high rate of recurrence.”
Preclinical work in several animal models indicated that applying mesenchymal stem cells to wounds accelerated healing through a variety of mechanisms, Dr. Grada noted. Based on that premise, he and his associates hypothesized that autologous cultured mesenchymal stem cells could accelerate wound healing in humans.
To test that idea, they randomly assigned the 11 trial participants to one of two control treatments or to the stem cell intervention. Four patients received normal saline with conventional standard care, three patients received fibrin spray plus conventional therapy, and four patients received conventional therapy plus autologous mesenchymal stem cells delivered in fibrin spray at a dose of 1 x 10⁶ cells per square centimeter of wound surface. Patients were treated every 3 weeks, up to three times or until complete wound healing, and were followed for up to 24 weeks.
To acquire the stem cells, the researchers obtained 30- to 50-mL samples of bone marrow aspirate from the iliac crest, then separated and cultured the cells in-house. The controls underwent sham aspiration with needles that did not penetrate the bone, Dr. Grada said. At each 4-week follow-up visit, the investigators measured the perimeter and area of each wound and analyzed the results with public domain software called ImageJ. They calculated the linear advance of the wound margin by dividing change in area by average perimeter.
The healing rate of the intervention group outpaced that of either control group at each time point measured, Dr. Grada said. Average weekly healing rates by time point ranged between –0.002 cm and 0.006 cm for the saline group and between –0.05 cm and 0.01 cm for the fibrin spray group. Neither of these control groups achieved meaningful wound closure by week 24.
In contrast, stem cell recipients experienced consistent wound closure at rates of 0.11-0.13 cm per week. The study was too small for conventional statistical analysis, but a Bayesian time aggregated one-way analysis of variance yielded a statistically significant difference in healing rates among groups (P less than .0005).
Dr. Grada also discussed several case studies. An 82-year-old white woman with a decades-long history of venous ulcers experienced complete wound healing with mesenchymal stem cell therapy, which enabled her to become more independent within her long-term care facility. A 75-year-old African American woman achieved 80% wound healing with stem cell therapy after previously having failed to benefit from two applications of bioengineered skin.
Finally, a 39-year-old man with chronic, treatment-resistant venous ulcers achieved partial wound healing. “He has almost healed, with very thin epidermal coverage, but never to the point of no exudate and complete closure,” Dr. Grada said. “Therefore, we could not declare him healed, even though the ulcer was smaller at the end of the study.”
No patient in the study experienced adverse events from treatment. However, recruiting for the trial was difficult, because patients were reluctant to undergo bone marrow aspiration, Dr. Grada said.
Previous work indicates that the initial rate at which the wound heals dictates its final rate (J Am Acad Dermatol. 1993 Mar;28[3]:418-21), and that 4 weeks is enough to establish a healing trend, he noted. Dr. Grada concluded by quoting Hippocrates: “Natural forces within us are the true healers of disease.”
The National Institutes of Health supported the trial. Dr. Grada had no conflicts of interest.
PORTLAND, ORE. – Treating chronic venous leg ulcers with mesenchymal stem cells and fibrin spray significantly improved wound healing, compared with vehicle control or saline plus conventional therapy, according to the results of a small randomized, controlled, double-blind pilot trial.
“Topical application of autologous, bone-marrow–derived mesenchymal stem cells may be an effective way to promote healing in patients with difficult-to-heal wounds,” said Ayman Grada, MD, of the department of dermatology at Boston University. “However, larger studies are needed to confirm this finding.”
“Various treatment modalities have been used, but treatment outcomes are not always satisfactory,” said Dr. Grada. “In about 60% of cases, wounds fail to close, and there is also a high rate of recurrence.”
Preclinical work in several animal models indicated that applying mesenchymal stem cells to wounds accelerated healing through a variety of mechanisms, Dr. Grada noted. Based on that premise, he and his associates hypothesized that autologous cultured mesenchymal stem cells could accelerate wound healing in humans.
To test that idea, they randomly assigned the 11 trial participants to one of two control treatments or to the stem cell intervention. Four patients received normal saline with conventional standard care, three patients received fibrin spray plus conventional therapy, and four patients received conventional therapy plus autologous mesenchymal stem cells delivered in fibrin spray at a dose of 1 x 10⁶ cells per square centimeter of wound surface. Patients were treated every 3 weeks, up to three times or until complete wound healing, and were followed for up to 24 weeks.
To acquire the stem cells, the researchers obtained 30- to 50-mL samples of bone marrow aspirate from the iliac crest, then separated and cultured the cells in-house. The controls underwent sham aspiration with needles that did not penetrate the bone, Dr. Grada said. At each 4-week follow-up visit, the investigators measured the perimeter and area of each wound and analyzed the results with public domain software called ImageJ. They calculated the linear advance of the wound margin by dividing change in area by average perimeter.
The healing rate of the intervention group outpaced that of either control group at each time point measured, Dr. Grada said. Average weekly healing rates by time point ranged between –0.002 cm and 0.006 cm for the saline group and between –0.05 cm and 0.01 cm for the fibrin spray group. Neither of these control groups achieved meaningful wound closure by week 24.
In contrast, stem cell recipients experienced consistent wound closure at rates of 0.11-0.13 cm per week. The study was too small for conventional statistical analysis, but a Bayesian time aggregated one-way analysis of variance yielded a statistically significant difference in healing rates among groups (P less than .0005).
Dr. Grada also discussed several case studies. An 82-year-old white woman with a decades-long history of venous ulcers experienced complete wound healing with mesenchymal stem cell therapy, which enabled her to become more independent within her long-term care facility. A 75-year-old African American woman achieved 80% wound healing with stem cell therapy after previously having failed to benefit from two applications of bioengineered skin.
Finally, a 39-year-old man with chronic, treatment-resistant venous ulcers achieved partial wound healing. “He has almost healed, with very thin epidermal coverage, but never to the point of no exudate and complete closure,” Dr. Grada said. “Therefore, we could not declare him healed, even though the ulcer was smaller at the end of the study.”
No patient in the study experienced adverse events from treatment. However, recruiting for the trial was difficult, because patients were reluctant to undergo bone marrow aspiration, Dr. Grada said.
Previous work indicates that the initial rate at which the wound heals dictates its final rate (J Am Acad Dermatol. 1993 Mar;28[3]:418-21), and that 4 weeks is enough to establish a healing trend, he noted. Dr. Grada concluded by quoting Hippocrates: “Natural forces within us are the true healers of disease.”
The National Institutes of Health supported the trial. Dr. Grada had no conflicts of interest.
At SID 2017
Key clinical point: Treating chronic venous leg ulcers with mesenchymal stem cells and fibrin spray significantly improved wound healing, compared with vehicle control or saline plus conventional therapy.
Major finding: Neither control group achieved meaningful wound closure by week 24, while stem cell recipients experienced consistent wound closure at rates of 0.11-0.13 cm per week (P less than .0005 for difference in healing rates among groups).
Data source: A randomized, controlled, double-blind pilot trial of 11 patients.
Disclosures: The National Institutes of Health supported the study. Dr. Grada had no conflicts of interest.