User login
Hurricane Harvey tests Houston physicians’ mettle
As Houston-area citizens evacuated or hunkered down at home in anticipation of Hurricane Harvey, doctors like Mary L. Brandt, MD, FACS, packed a bag and headed to work.
“I came in on Saturday morning [Aug. 23] – I was on call – and so I packed a big suitcase and a big bag of food because I anticipated I would be here until Thursday,” Dr. Brandt said in an interview, “So I became part of the ‘ride-out crew.’ ”
Hospitals were hit hard by Hurricane Harvey, and many struggled against the effects of the Category 4 storm, which made landfall then stalled over Texas for almost a week, pummeling the area.

“We all know this [flooding] could happen, so all the facilities in the medical center have flood gates, and generators are out of the basement so that there is not any risk of losing all electricity, but then the issue becomes the staff,” Dr. Brandt said. “They can’t get to and from the facility, and that’s particularly true if they live in the periphery of Houston, which is common.”
The situation was the same for many area hospitals. Just 2 miles away from Texas Children’s Hospital, SreyRam Kuy, MD, FACS, associate chief of staff at the Michael E DeBakey VA Medical Center, and her colleagues prepared to run the hospital with a skeleton crew.
“We were preparing when it was still a tropical storm, and we talked to the staff ahead of time to let them know this would be a marathon, not a sprint,” Dr. Kuy said in an interview. “We had people staying in the hospital ahead of time because we were worried that when the hurricane hit, we would not be able to have people return.”
But when Harvey made landfall with Category 4 intensity, many medical facilities were caught by surprise.
“We didn’t know how bad it would be, I honestly don’t think anyone in the city or the state had any idea of how tremendous the impact would be, particularly with the flooding,” Dr. Kuy said. “We had staff going 5, 6 days here at the hospital, working continuously, sleeping on the floor, and because of that, we were able to perform multiple emergency surgeries during the disaster, including laparoscopic treatment of ruptured appendicitis and replacement of an infection aortic graft, which required massive transfusion.” The VA hospital broke from its core mission of caring for veterans, treating “homeless folks and nonveterans who were brought here by the Coast Guard, or the ambulances, or by air.”
At Texas Children’s Hospital, Dr. Brandt and her colleagues were dealing with similar situations, staying on their feet and moving quickly as rescued patients arrived by air.
“We were near the area that was flooding really terribly, and so the Coast Guard had been coming in and bringing kids,” Dr. Brandt said. “Sometimes, we knew what was coming and sometimes we didn’t. It was pretty much controlled chaos.”
Staff shared responsibilities, often taking on tasks far outside their usual roles.
“We didn’t have enough people working the cafeteria, and so, at one point, I put on my hair net, grabbed a ladle, and served in the lunch line,” Dr. Kuy said.
Throughout the storm and flooding, medical professionals fought through exhaustion and depleting supplies, all with little or no knowledge of how their own homes and families were faring.
“We had people here for so long, and they had no idea what was happening in their own homes,” Dr. Kuy said. “They were watching on the news, seeing the reports and watching their own neighborhoods flooded.”
Dr. Brandt and her colleagues would watch as reports came in of what was happening beyond the hospital walls.
“We have some meeting areas, we would watch the weather together and that goes from the janitors to the head of the hospital who was in the hospital with us,” she said.
Despite the chaos outside, morale did not waiver for either Dr. Kuy’s or Dr. Brandt’s crew.
“I remember walking throughout the hospital, doing my rounds, checking up on the units. I went to talk with some of the staff nurses, and what struck me was as I walk in I see these big smiles on their faces, I absolutely did not expect that,” Dr. Kuy said. “They had been in the hospital for 5 days, they were exhausted. It just makes me so proud to serve along these kinds of people.”
As travel became possible, Dr. Kuy and other area physicians – as well as volunteers from across the country – began to shift their focus to evacuation shelters, treating ambulatory patients there.
“The response has been phenomenal,” said Dr. Kuy. “I met an ER doctor from North Carolina who came to volunteer, we have FEMA [Federal Emergency Management Agency] doctors from all across the state, and then of course, all the people from the different VA [hospitals].”
Pediatricians have sent their support as well, offering time and supplies to help take care of the patients at Texas Children’s Hospital, Dr. Brandt said.
At presstime, volunteers were still needed. The Texas Department of State Health Services opened a web portal for volunteer opportunities, and lifted restriction on out-of-state doctors from practicing medicine without state registration.
While there is still much that needs to be done to recover, those on the ground said that they feel an overwhelming feeling of community as people face what will inevitably be a tough road ahead.
“Houston has a reputation and a culture of helping neighbors and it has been astounding to watch what’s happening,” said Dr. Brandt. “No matter how tired people are or how stressful any cases are, everyone’s morale stays high.”
[email protected]
On Twitter @eaztweets
As Houston-area citizens evacuated or hunkered down at home in anticipation of Hurricane Harvey, doctors like Mary L. Brandt, MD, FACS, packed a bag and headed to work.
“I came in on Saturday morning [Aug. 23] – I was on call – and so I packed a big suitcase and a big bag of food because I anticipated I would be here until Thursday,” Dr. Brandt said in an interview, “So I became part of the ‘ride-out crew.’ ”
Hospitals were hit hard by Hurricane Harvey, and many struggled against the effects of the Category 4 storm, which made landfall then stalled over Texas for almost a week, pummeling the area.
“We all know this [flooding] could happen, so all the facilities in the medical center have flood gates, and generators are out of the basement so that there is not any risk of losing all electricity, but then the issue becomes the staff,” Dr. Brandt said. “They can’t get to and from the facility, and that’s particularly true if they live in the periphery of Houston, which is common.”
The situation was the same for many area hospitals. Just 2 miles away from Texas Children’s Hospital, SreyRam Kuy, MD, FACS, associate chief of staff at the Michael E DeBakey VA Medical Center, and her colleagues prepared to run the hospital with a skeleton crew.
“We were preparing when it was still a tropical storm, and we talked to the staff ahead of time to let them know this would be a marathon, not a sprint,” Dr. Kuy said in an interview. “We had people staying in the hospital ahead of time because we were worried that when the hurricane hit, we would not be able to have people return.”
But when Harvey made landfall with Category 4 intensity, many medical facilities were caught by surprise.
“We didn’t know how bad it would be, I honestly don’t think anyone in the city or the state had any idea of how tremendous the impact would be, particularly with the flooding,” Dr. Kuy said. “We had staff going 5, 6 days here at the hospital, working continuously, sleeping on the floor, and because of that, we were able to perform multiple emergency surgeries during the disaster, including laparoscopic treatment of ruptured appendicitis and replacement of an infection aortic graft, which required massive transfusion.” The VA hospital broke from its core mission of caring for veterans, treating “homeless folks and nonveterans who were brought here by the Coast Guard, or the ambulances, or by air.”
At Texas Children’s Hospital, Dr. Brandt and her colleagues were dealing with similar situations, staying on their feet and moving quickly as rescued patients arrived by air.
“We were near the area that was flooding really terribly, and so the Coast Guard had been coming in and bringing kids,” Dr. Brandt said. “Sometimes, we knew what was coming and sometimes we didn’t. It was pretty much controlled chaos.”
Staff shared responsibilities, often taking on tasks far outside their usual roles.
“We didn’t have enough people working the cafeteria, and so, at one point, I put on my hair net, grabbed a ladle, and served in the lunch line,” Dr. Kuy said.
Throughout the storm and flooding, medical professionals fought through exhaustion and depleting supplies, all with little or no knowledge of how their own homes and families were faring.
“We had people here for so long, and they had no idea what was happening in their own homes,” Dr. Kuy said. “They were watching on the news, seeing the reports and watching their own neighborhoods flooded.”
Dr. Brandt and her colleagues would watch as reports came in of what was happening beyond the hospital walls.
“We have some meeting areas, we would watch the weather together and that goes from the janitors to the head of the hospital who was in the hospital with us,” she said.
Despite the chaos outside, morale did not waiver for either Dr. Kuy’s or Dr. Brandt’s crew.
“I remember walking throughout the hospital, doing my rounds, checking up on the units. I went to talk with some of the staff nurses, and what struck me was as I walk in I see these big smiles on their faces, I absolutely did not expect that,” Dr. Kuy said. “They had been in the hospital for 5 days, they were exhausted. It just makes me so proud to serve along these kinds of people.”
As travel became possible, Dr. Kuy and other area physicians – as well as volunteers from across the country – began to shift their focus to evacuation shelters, treating ambulatory patients there.
“The response has been phenomenal,” said Dr. Kuy. “I met an ER doctor from North Carolina who came to volunteer, we have FEMA [Federal Emergency Management Agency] doctors from all across the state, and then of course, all the people from the different VA [hospitals].”
Pediatricians have sent their support as well, offering time and supplies to help take care of the patients at Texas Children’s Hospital, Dr. Brandt said.
At presstime, volunteers were still needed. The Texas Department of State Health Services opened a web portal for volunteer opportunities, and lifted restriction on out-of-state doctors from practicing medicine without state registration.
While there is still much that needs to be done to recover, those on the ground said that they feel an overwhelming feeling of community as people face what will inevitably be a tough road ahead.
“Houston has a reputation and a culture of helping neighbors and it has been astounding to watch what’s happening,” said Dr. Brandt. “No matter how tired people are or how stressful any cases are, everyone’s morale stays high.”
[email protected]
On Twitter @eaztweets
More States Get Funding to Fight Opioid Epidemic
The CDC plans to award more than $12 million to 20 states and the District of Columbia to support responses to the opioid overdose epidemic. The new funding brings the number of recipients to 32.
States can use the funds to report nonfatal and fatal opioid overdose and risk factors linked to fatal overdoses more quickly, share data with key stakeholders, and share data with the CDC to improve multistate surveillance and response.
Fourteen states currently get funding under the Prescription Drug Overdose: Prevention for States (PfS) program, and another 8 will get $4.8 million. The money will allow states to enhance prescription drug-monitoring programs and implement and evaluate strategies to improve safe opioid prescribing practices.
Studies of donor CAR T cells placed on hold

The US Food and Drug Administration (FDA) has placed a clinical hold on both phase 1 studies of UCART123, a universal (allogeneic) chimeric antigen receptor (CAR) T-cell therapy targeting CD123.
One study was designed for patients with acute myeloid leukemia (AML), and the other was designed for patients with blastic plasmacytoid dendritic cell neoplasm (BPDCN).
The clinical hold is due to the death of the first patient treated in the BPDCN trial.
The hold means no new subjects can be enrolled in either trial, and there can be no further dosing of subjects who are already enrolled.
BPDCN patient
The first patient treated in the BPDCN trial was a 78-year-old male who had received 1 prior therapy. He presented with relapsed/refractory BPDCN with 30% blasts in his bone marrow and cutaneous lesions (biopsy-proven BPDCN) at baseline.
The patient first received pre-conditioning with fludarabine (30 mg/m²/day for 4 days) and cyclophosphamide (1 g/m²/day for 3 days).
On August 16, 2017 (Day 0), the patient received UCART123 at 6.25 x 10⁵ cells/kg, the first dose level explored in the protocol, without complication.
By Day 5, the patient had developed grade 2 cytokine release syndrome (CRS) and a grade 3 lung infection, which improved after a first dose of tocilizumab and the administration of broad-spectrum, intravenous antibiotics.
On Day 8, the patient was found to have more severe CRS (ultimately grade 5) and grade 4 capillary leak syndrome. Despite receiving treatment in keeping with CRS management, including the administration of corticosteroids and tociluzumab as well as intensive care unit support, the patient died on Day 9.
AML patient
The first patient treated in the AML study experienced similar adverse effects as the BPDCN patient but is still alive.
The AML patient was a 58-year-old woman with 84% blasts in her bone marrow at baseline.
On June 27, 2017 (Day 0), the patient received the same pre-conditioning regimen and the same dose of UCART123 as the BPDCN patient, without complication.
By Day 8, the AML patient had developed grade 2 CRS. This worsened to grade 3 on Day 9 and resolved on Day 11 with treatment in the intensive care unit.
The patient also experienced grade 4 capillary leak syndrome on Day 9 that resolved on Day 12.
Next steps
The data safety monitoring board for these trials met on August 28 and recommended lowering the dose of UCART123 to 6.25 x 10⁴ cells/kg in both studies and capping cyclophosphamide to a total dose of 4 g over 3 days.
Cellectis, the company developing UCART123, said it is working with study investigators and the FDA to resume both trials with an amended protocol that includes these dose adjustments. ![]()
FDA grants orphan designation to product for CMV

The US Food and Drug Administration (FDA) has granted orphan drug designation to ATA230 for the treatment of cytomegalovirus (CMV) viremia and disease in immunocompromised patients.
ATA230 is an allogeneic, cytotoxic T-lymphocyte (CTL) product targeting antigens expressed by CMV.
The product is under investigation in phase 2 trials of patients with CMV viremia and disease who are refractory or resistant to antiviral treatment.
Atara Biotherapeutics, Inc., the company developing ATA230, said it will evaluate development plans for this therapy with the FDA and other global health authorities after beginning phase 3 studies of another product, ATA129.
The company said it decided to prioritize ATA129, which is being developed to treat patients with Epstein-Barr-virus-associated post-transplant lymphoproliferative disorder.
Phase 2 trial of ATA230
Researchers reported phase 2 results with ATA230 at the 2016 ASH Annual Meeting.
The data encompassed 15 patients with documented CMV mutations conferring resistance to antiviral therapies. The patients had received a median of 3 prior therapies.
Eleven of the 15 patients (73.3%) responded to ATA230, 6 with complete responses and 5 with partial responses.
At 6 months, the overall survival was 72.7% in responders and 25% in non-responders.
Within the 6 months of follow-up, 1 of the 11 responders died of CMV, and 3 of the 4 non-responders died of CMV.
Adverse events occurred in 6 patients. One grade 3 event and 1 grade 4 event were considered possibly related to ATA230.
About orphan designation
The FDA grants orphan designation to products intended to treat, diagnose, or prevent diseases/disorders that affect fewer than 200,000 people in the US.
The designation provides incentives for sponsors to develop products for rare diseases. This may include tax credits toward the cost of clinical trials, prescription drug user fee waivers, and 7 years of market exclusivity if the product is approved. ![]()
SCD drug receives rare pediatric disease designation

The US Food and Drug Administration (FDA) has granted rare pediatric disease designation to GBT440 for the treatment of sickle cell disease (SCD).
GBT440 is being developed by Global Blood Therapeutics, Inc. as a potentially disease-modifying therapy for SCD.
The drug works by increasing hemoglobin’s affinity for oxygen. Since oxygenated sickle hemoglobin does not polymerize, it is believed that GBT440 blocks polymerization and the resultant sickling of red blood cells.
If GBT440 can restore normal hemoglobin function and improve oxygen delivery, the therapy may be capable of modifying the progression of SCD.
The FDA previously granted GBT440 fast track and orphan drug designations.
About rare pediatric disease designation
Rare pediatric disease designation is granted to drugs that show promise to treat diseases affecting fewer than 200,000 patients in the US, primarily patients age 18 or younger.
The designation provides incentives to advance the development of drugs for rare disease, including access to the FDA’s expedited review and approval programs.
Under the FDA’s Rare Pediatric Disease Priority Review Voucher Program, if a drug with rare pediatric disease designation is approved, the drug’s developer may qualify for a voucher that can be redeemed to obtain priority review for any subsequent marketing application.
GBT440 trials
GBT440 is currently under investigation in a phase 1/2 trial (GBT440-001) of healthy subjects and adults with SCD. Data from this trial were presented at the 2016 ASH Annual Meeting.
At that time, there were 41 SCD patients who had been receiving GBT440 for up to 6 months.
All of these patients experienced a “profound and durable” reduction in hemolysis, as assessed by hemoglobin, reticulocytes, and/or bilirubin, according to Global Blood Therapeutics.
Patients treated with GBT440 for at least 90 days demonstrated a “clinically significant” increase in hemoglobin (greater than 1 g/dL increase) when compared with placebo-treated patients (46% vs 0%; P=0.006).
Patients treated with GBT440 also had a sustained reduction in irreversibly sickled cells when compared with placebo-treated patients (-76.6% vs +9.7%; P<0.001).
The most common treatment-related adverse events were grade 1/2 headache and gastrointestinal disorders. These events occurred in similar rates in the placebo and GBT440 arms. There were no drug-related serious or severe adverse events.
No sickle cell crises events occurred while participants were on GBT440. Exercise testing data showed normal tissue oxygen delivery (no change in oxygen consumption compared to placebo).
GBT440 is also under investigation in the phase 3 HOPE study, which includes SCD patients age 12 and older. And the drug is being tested in the phase 2 HOPE-KIDS 1 study, which includes pediatric patients (ages 6 to 17) with SCD. ![]()
FDA grants orphan designation to product for GVHD
The US Food and Drug Administration (FDA) has granted orphan drug designation to ApoGraft™ as prophylaxis for acute and chronic graft-versus-host disease (GVHD) in transplant recipients.
ApoGraft is a mobilized peripheral blood cell product collected via apheresis from a matched, related donor. The product is exposed to the apoptotic mediator Fas ligand prior to transplantation.
ApoGraft was designed to eliminate immune responses after transplantation of foreign cells and tissues.
ApoGraft is being developed by Cellect Biotechnology Ltd.
The company is testing ApoGraft as acute GVHD prophylaxis in a phase 1/2 trial.
The trial is currently enrolling patients with hemato-oncology disorders who are eligible for allogeneic, HLA-matched hematopoietic stem cell transplant (HSCT).
The study is expected to have 4 cohorts, each consisting of 3 patients.
The difference between the cohorts is the amount of apoptotic mediator Fas ligand (APO010) to which the graft is exposed during incubation prior to ApoGraft transplantation and HSCT:
- 10 ng/mL APO010 in Cohort 1
- 25 ng/mL APO010 in Cohort 2
- 50 ng/mL APO010 in Cohort 3
- 100 ng/mL APO010 in Cohort 4.
The study is expected to progress from one cohort to the next based on an independent data safety monitoring board review and analysis of safety data.
About orphan designation
The FDA grants orphan designation to products intended to treat, diagnose, or prevent diseases/disorders that affect fewer than 200,000 people in the US.
The designation provides incentives for sponsors to develop products for rare diseases. This may include tax credits toward the cost of clinical trials, prescription drug user fee waivers, and 7 years of market exclusivity if the product is approved. ![]()
Respiratory infections in early years of life linked to celiac disease
in those with a family history of CD, according to Renata Auricchio, MD, University of Naples (Italy) Federico II, and her associates.
In a prospective cohort study, 373 newborns from families with at least one relative with CD were recruited. The cumulative incidence of new cases of CD was 6% at 3 years and 13.5% at 5 years of age, the researchers noted. In the first year when no child produced anti-tissue transglutaminase (anti-tTG) antibodies, respiratory infections (upper and lower tract) were more common among the case patients than among the controls (58% vs. 40%). During the second year, respiratory infections were again more frequent among the case patients than among controls (52% vs. 32%). And in the third year of life when most of the case patients were diagnosed with CD, no clinical event was more frequent in the case patients than in the control group.
“In this study, we report that early infections significantly contribute to the risk of developing CD,” Dr. Auricchio and her associates concluded. “It is possible that the exposure to early infection stimulates a genetically predisposed immune profile, which contributes to the switch from tolerance to intolerance to gluten, which is a common food antigen.”
Read the full study in Pediatrics (doi: 10.1542/peds.2016-4102).
FROM PEDIATRICS
Total Eclipse of the Heart
ANSWER
The correct interpretation includes sinus rhythm with complete heart block and a junctional rhythm. Normal sinus rhythm is evidenced by normal-appearing P waves at a rate of about 66 beats/min, although there is some respiratory variation. There is no correlation of the P waves to the QRS complex. A junctional rhythm is diagnosed based on narrow QRS complexes of normal duration (82 ms). The patient underwent implantation of a dual-chamber pacemaker and had a complete recovery.
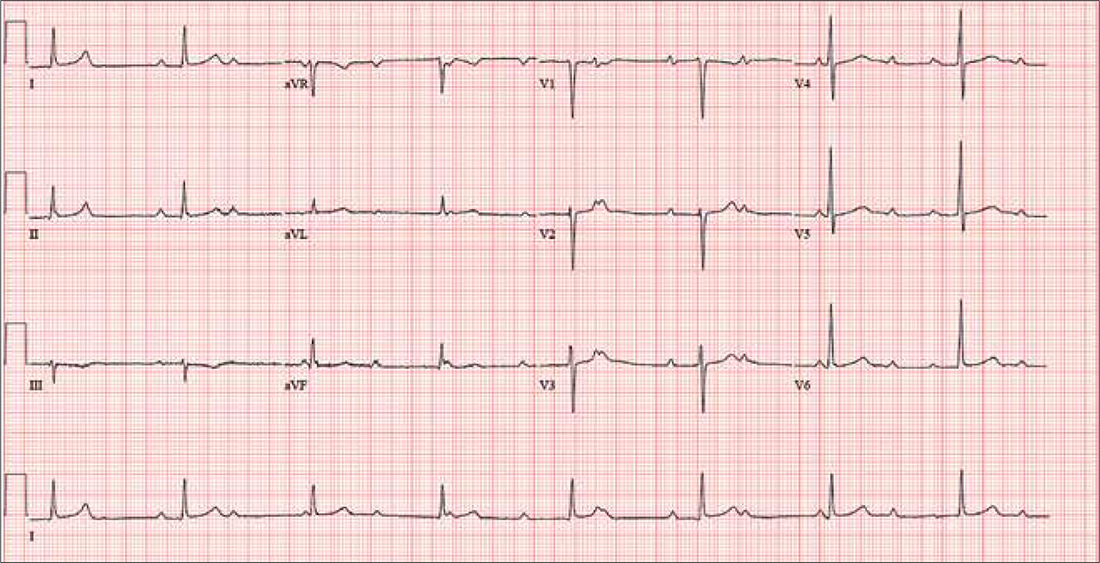
For the past two months, a 72-year-old man has been experiencing dyspnea on exertion “off and on.” In the past three days, this shortness of breath has been more consistent.
When his son drops by to check on him, the father mentions the problem, noting that although he’s usually quite active, he hasn’t “had the stamina” to finish his current woodworking project. The son, a paramedic, checks his father’s pulse; it is regular, but the rate is below 40 beats/min. The son decides to bring him to the emergency department for evaluation.
His medical history is remarkable for hypertension, gout, and cholelithiasis. He underwent a right orchiectomy secondary to trauma in the remote past and had bilateral total knee replacements four years ago. Since the latter procedure, he has been extremely active; prior to his current complaint, he walked three miles each day.
The patient, a retired minister, lost his wife to cancer four years ago and now lives at home alone. He has four sons—one of whom visits twice a week—and two daughters, all of whom are in good health. He has never smoked and only drinks a glass of wine on holidays.
His current medications include metoprolol XL (25 mg/d) for hypertension and acetaminophen as needed for arthritic joint pain. He denies missing or doubling his medication doses. He is allergic to sulfa, which causes an anaphylactic reaction with significant airway narrowing.
The patient wears corrective lenses and hearing aids. He denies recent changes in bowel or bladder function, extreme temperature changes, productive cough, or constitutional symptoms suggestive of indolent infection.
Vital signs include a regular pulse of 50 beats/min; blood pressure, 104/66 mm Hg; respiratory rate, 14 breaths/min-1; and temperature, 98.4°F. His height is 70 in and his weight, 172 lb.
On physical exam, you notice that the patient tires walking 20 feet from the waiting room to the exam room. Otherwise, he is in no apparent distress. He denies chest pain with exertion or dyspnea at rest. His funduscopic exam is normal, his oropharynx is normal, and he is not missing teeth. There are no carotid bruits. The lungs are clear in all fields without evidence of rales, rhonchi, or crackles.
Cardiac exam reveals a grade II/VI early systolic murmur at the left upper sternal border, which does not radiate to the carotid arteries or the back. The abdomen is scaphoid and soft with no palpable masses. Peripheral pulses are strong bilaterally in all extremities. He has evidence of osteoarthritis in his hands and feet, as well as surgical scars consistent with knee replacements. His neurologic exam is intact.
An ECG reveals a ventricular rate of 47 beats/min; no discernable PR interval; QRS duration, 82 ms; QT/QTc interval, 450/398 ms; P axis, 48°; R axis, 14°; and T axis, 26°. What is your interpretation?

Trump administration ends DACA program, stranding medical students
President Trump has ended the Obama administration’s Deferred Action for Childhood Arrivals (DACA) program, a policy that protected immigrants who came to the United States as children from deportation and authorized them to work in the United States.
In a Sept. 5 press conference, Attorney General Jeff Sessions called the DACA program an unconstitutional overreach of executive branch power by the former administration that deliberately sought to undermine the legislative branch. Rollback of the DACA program will begin immediately, Mr. Sessions said, with the program expiring completely on March 5, 2018.
“The effect of this unilateral executive amnesty, among other things, contributed to a surge of minors at the southern border that yielded terrible humanitarian consequences,” Mr. Sessions said during the press conference. “[DACA has] also denied jobs to hundreds of thousands of Americans by allowing those same illegal aliens to take those jobs. To have a lawful system of immigration that serves the national interest, we cannot admit everyone. Therefore the nation must set and enforce a limit on how many immigrants we admit and that means all cannot be accepted.”
In a statement issued shortly after the press conference, President Trump said winding down the DACA program is in the nation’s best interest, and that there can be no principled immigration reform if the executive branch is able to “rewrite or nullify federal laws at will.
“As President, my highest duty is to defend the American people and the Constitution of the United States of America,” President Trump said in the statement. “At the same time, I do not favor punishing children, most of whom are now adults, for the actions of their parents. But we must also recognize that we are nation of opportunity because we are a nation of laws.”
The DACA program was created by the Obama administration in 2012 as a way of protecting young, undocumented immigrants from deportation after Congress repeatedly blocked legislation that would develop such a safe haven. The policy allowed about 800,000 young adults brought to the United States illegally as children to work legally in the U.S. and remain in the country without the fear of deportation.
The program’s end will affect the growing number of medical students with DACA status and likely jeopardize the funding invested in their training. Sixty-two medical schools accept applications from DACA applicants, according to the Association of American Medical Colleges (AAMC). For the 2016 -2017 school year, 113 students with DACA status applied to US medical schools, and there were 65 medical students enrolled who had DACA status. AAMC does not collect data on medical students with DACA status; the National Resident Matching Program, likewise, does not collect data on residents with DACA status.
Loyola University in Chicago is one institute that could be significantly impacted by recension of DACA. The university has accepted more students with DACA status than any other U.S. medical school, and currently has 32 DACA students attending, said Mark Kuczewski, Ph.D., chair of medical education at Loyola University.
“It’s a tragic decision,” he said in an interview. “It once again puts a cloud over these young people who DACA has given the first real opportunity to come out of the shadows, be educated, and serve the community. Now they’re returned back to the situation of uncertainty.”
The decision to end DACA means that current DACA medical students may not be able to finish their training and that those close to completion may not be able to use their degrees in the workforce, Dr. Kuczewski said. Since they are not citizens, DACA students do not qualify for federal student loans, so medical schools must find ways to help DACA students finance their education. A major Catholic health system provides student loan packages for several DACA students at Loyola’s Stritch School of Medicine, Dr. Kuczewski said. However, such loan programs require DACA status. Without DACA or another path to citizenship, medical students in the middle of training will not be able to obtain financial aid to finish their training, he said. The work authorization that DACA provided will also be eliminated.
Dr. Kuczewski said his university plans to advocate strongly for Congress to pass legislation to protect DACA youth, such as the Dream Act of 2017.
“We are going to advocate strongly because we believe this is common sense,” he said. “You don’t just throw away the talents of these young people and the investments they’ve made in their education and the investments we’ve made in them. DACA has given many people the chance to see these young people as students, as employees, as colleagues, and we hope that helps people to mobilize.”
In a statement, Jack Ende, MD, president of the American College of Physicians, said President Trump’s decision to end the DACA program threatens to deny the country the talents of more than half a million individuals making enormous contributions and will also undermine public health and medical education.
“Today’s executive order has the potential to gravely impact public health,” Dr. Ende said in the statement. “We know that noncitizens and undocumented immigrants are more likely to lack health insurance coverage. If the nearly 800,000 people who are currently benefiting from DACA have their protections removed, many will avoid seeking health care in order to reduce the risk of detection and deportation. … Those who seek to serve in the health care professions will be denied that opportunity.”
The Immigration Reform Law Institute praised President Trump’s decision to rescind the DACA program, calling the policy an affront to Congress and a violation of the U.S. Constitution.
“Contrary to former President Obama’s claims, not only is DACA not authorized by federal statute, but prior to the unlawful program, deferred action has only ever been applied to small numbers of illegal aliens on a case-by-case basis,” Dale Wilcox, executive director, said in a statement. “Applying it to approximately 15% of the illegal alien population was never a proper exercise of the president’s discretion under the Constitution and is inconsistent with the president’s duty to take care that the laws be faithfully executed. By rescinding DACA, President Trump has put an end to the previous administration’s flagrant violation of our immigration laws and its abuse of hard-working American taxpayers.”
In a memorandum issued Sept. 5, the Department of Homeland Security said it will begin winding down the DACA program, while providing a limited window in which it will adjudicate certain requests for DACA and associated applications. DHS will adjudicate, on an individual, case-by-case basis, properly filed pending DACA initial requests and associated applications for employment authorization documents that have been accepted by the department as of Sept.5, 2017, according to the memorandum. All DACA initial requests and associated applications filed after this date will be rejected.
[email protected]
On Twitter @legal_med