User login
Point/Counterpoint: Should FEVAR be used for a short neck?
FEVAR is generally the best option
The advent of endovascular aortic aneurysm repair (EVAR) has steadily become the standard of care in the management of infrarenal abdominal aortic aneurysms (AAAs). In fact, it has now surpassed open surgical repair and is the predominant therapeutic modality in managing this disease entity. Clearly, there are specific anatomic and technical factors that may preclude the use of traditional EVAR – most notably, challenging proximal neck anatomy, be it insufficient length or severe angulation.
It is estimated that up to 30%-40% of patients are unsuitable candidates because of these concerns.1 Such patients are thus relegated to traditional open repair with the associated concerns for supravisceral clamping, including dramatic changes in hemodynamics and prolonged ICU and hospital stays.

Open surgical repair of pararenal, juxtarenal, and suprarenal AAAs is tried, tested, and durable. Knott and the group from Mayo Clinic reviewed their repair of 126 consecutive elective juxtarenal AAAs requiring suprarenal aortic clamping noting a 30-day mortality of .8%.2 More recent data from Kabbani and the Henry Ford group involved their 27-year clinical experience suggesting that open repair of complex proximal aortic aneurysms can be performed with clinical outcomes that are similar to those of open infrarenal repair.3 I respectfully accept this traditional – and historic – treatment modality.
However, we vascular surgeons are progressive and resilient in our quest to innovate and modernize – some of us even modified the traditional endografts on the back table. We charged forward despite the initial paucity of data on infrarenal EVAR compared to traditional open repair of aneurysms in the past. Now, a large percentage of infrarenal AAA repairs are performed via EVAR. In fact, our steadfast progression to advanced endovascular techniques has raised the concern that our graduating trainees are no longer proficient, competent, or even capable, in open complex aneurysm repair!
Tsilimparis and colleagues reported the first outcomes comparing open repair and FEVAR.4 They queried the NSQIP database comparing 1,091 patients undergoing open repair with 264 in the FEVAR group. There was an increased risk of morbidity in all combined endpoints including pulmonary and cardiovascular complications as well as length of stay in patients undergoing the open repair group. A larger comprehensive review pooled the results from 8 FEVAR and 12 open repair series. Analysis of the data found the groups to be identical. Open repair, however, was found to have an increased 30-day mortality when compared to FEVAR (relative risk 1.03, 2% increased absolute mortality).5
Gupta and colleagues reported the latest multi-institutional data noting that open repair was associated with higher risk than FEVAR for 30-day mortality, cardiac and pulmonary complications, renal failure requiring dialysis, return to the operating room, and in this age of cost-containment, length of stay (2 days vs. 7 days; P less than .0001).6
A further study by Donas and colleagues evaluated 90 consecutive patients with primary degenerative juxtarenal AAAs to different operative strategies based on morphologic and clinical characteristics – 29 FEVAR, 30 chEVAR, and 31 open repair.7 Early procedure-related and all-cause 30-day mortality was 0% in the endovascular group and 6.4% in the open group.
Although open repair for juxtarenal AAAs is the gold standard, short- and mid-term data on the outcomes for complex endovascular repair are excellent. Data on long-term durability, graft fixation/migration as well as the integrity of the graft and concerns for endoleaks and branch vessel patency, however, are limited. We do not have long-term data because we have not been doing these newer procedures for that long – but the data thus far show great promise.
We need to continue to challenge the status quo, particularly when the current data are satisfactory and the procedure feasible. With our continued appraisal of the data we publish as vascular surgeons, we can then identify if these innovations and techniques will withstand the test of time. After all, we are vascular surgeons (particularly those of us who have trained extensively in open repair) – and if open repair is necessary, then we will be ready.
But, if I can avoid a thoracoabdominal incision for a few percutaneous access sites, then sign me up!
Dr. Mouawad is chief of vascular and endovascular surgery, medical director of the vascular laboratory, and vice-chair of the department of surgery at McLaren Bay Region, Bay City, Mich. He is assistant professor of surgery at Michigan State University and Central Michigan University.
References
1. Perspect Vasc Surg Endovasc Ther. 2009;21:13-8.
2. J Vasc Surg. 2008;47:695-701.
3. J Vasc Surg. 2014;59:1488-94.
4. Ann Vasc Surg. 2013;27(3):267-73.
5. Eur J Vasc Endovasc Surg. 2009;38(1):35-41.
6. J Vasc Surg. 2017 Dec;66(6):1653-8.
7. J Vasc Surg. 2012 Aug;56(2):285-90.
FEVAR may not be the best choice
Over the past 3 decades, EVAR, with its very low periprocedural morbidity and mortality, and satisfactory long-term results, has become the primary treatment modality for the majority of infrarenal AAAs. The success of stent grafts for the repair of AAA relies heavily on satisfactory proximal and distal seal zones. Each commercially available standard EVAR graft has a manufacturer’s instructions for use requiring a proximal landing zone length of between 10 and 15 mm. Patients with less than this required length are considered to have “short necks.” Evaluation of this group of patients has demonstrated that this is not an uncommon finding and that EVAR performed outside the instructions for use has been associated with an increased risk of intraoperative failure, aneurysm expansion, and later complications.1-3
Current treatment options for patients with short necks include open surgical repair (OSR), FEVAR, and EVAR with the chimney graft technique (Ch-EVAR).

Thus, current knowledge acquired from case series, registries, and clinical experience must be used in deciding which therapeutic option to offer patients. Relevant factors influencing this decision include the availability and adaptability of the technique, early outcomes including technical success, morbidity and mortality, and late outcomes including survival, need for reintervention, and other late morbidity. Finally, in an era of value-based medical care, cost also must be considered.
Currently there is only one Food and Drug Administration–approved fenestrated graft. When used in properly selected patients, excellent periprocedural results have been reported approaching those of standard EVAR. However, there are limitations in both the availability and adaptability of FEVAR. These grafts are custom made for each patient, often requiring several weeks of lead time. Adaptability also has its limitations, including access vessels, severe neck angulation, calcification, mural thrombus, and branch vessel size, number, location, and associated arterial disease. Any of these factors may preclude the use of this technology. Open repair, on the other hand, is not limited by graft availability and allows for custom modification for each patient’s specific disease morphology. The essential limitation for open repair is the patient’s physiological ability to withstand the operation.
Several studies attempting to compare the early outcomes of FEVAR versus comparable patients undergoing OSR of similar aneurysms have reported significantly lower 30-day mortality and major morbidity rates for FEVAR.4,5 However, Rao et al., in a recent systematic review and meta-analysis that included data on 2,326 patients from 35 case series reporting on elective repair of juxtarenal aneurysms by either OSR or FEVAR, found perioperative mortality to not be significantly different (4.1% for both). Also, no significant difference was found between the two groups when evaluating postoperative renal insufficiency and need for permanent dialysis. However, OSR did have significantly higher major complication rates (25% vs. 15.7%).6 These findings suggest that both modalities can be performed successfully, but that long term outcomes need to be considered to determine if the increased initial morbidity of OSR is justified by differences in long term results between the two modalities.
Open surgical repair of juxtarenal AAA has been shown to be a durable repair.7 While early and even intermediate results of FEVAR appear to be satisfactory, long-term durability has yet to be determined.4,8 Along with continuing to exclude the aneurysm sac, as with standard EVAR, there is the additional concern regarding the outcome of the organs supplied by the fenestrated/stent-grafted branches with FEVAR. Longer-term follow-up in the same review by Rao et al. showed that significantly more FEVAR patients developed renal failure compared with OSR patients (19.7% vs. 7.7%). FEVAR patients also had a higher rate of reintervention.
And finally, long-term survival was significantly greater in OSR patients compared to FEVAR at 3 and 5 years (80% vs. 74% vs. 73% vs. 55%). These authors concluded that open repair remains the gold standard while FEVAR is a favorable option for high risk patients.6
These new and innovative stent graft devices come at considerable expense. While this aspect of FEVAR has not been extensively studied, Michel et al., in their report from the multicenter prospective Windows registry, attempted to evaluate the economic aspect of FEVAR. They compared a group of patients who underwent FEVAR to patients from a large national hospital discharge database who underwent OSR. No difference in 30-day mortality was noted between these two groups; however, there was a significantly greater cost with FEVAR. The authors concluded that FEVAR did not appear to be justified for patients fit for open surgery with juxtarenal AAA.9
For now, the roles of OSR and FEVAR would appear to be complementary. Current evidence suggests that OSR is the most appropriate intervention for good risk patients with an anticipated longer life expectancy. Patients with appropriate anatomy for FEVAR and who are at higher risk for open repair would benefit from FEVAR. As further experience and outcomes are accumulated, our ability to select the appropriate therapy for individual patients should improve.
Dr. Weaver is an assistant clinical professor for surgery at Wayne State School of Medicine, Detroit, and an attending in the division of vascular surgery, Henry Ford Hospital.
References
1. Ir J Med Sci. 2015;184(1):249-55.
2. Circulation. 2011;123(24):2848-55.
3. J Endovasc Therapy. 2001;8(5):457-64.
4. Eur J Vasc Endovasc Surg. 2009;38(1):35-41.
5. Ann Vasc Surg. 2013;27(3):267-73.
6. J Vasc Surg. 2015;61(1):242-55.
7. J Vasc Surg. 2012;56(1):2-7.
8. J Cardiovasc Surg. 2015;56(3):331-7.
9. Eur J Vasc Endovasc Surg. 2015;50(2):189-96.
FEVAR is generally the best option
The advent of endovascular aortic aneurysm repair (EVAR) has steadily become the standard of care in the management of infrarenal abdominal aortic aneurysms (AAAs). In fact, it has now surpassed open surgical repair and is the predominant therapeutic modality in managing this disease entity. Clearly, there are specific anatomic and technical factors that may preclude the use of traditional EVAR – most notably, challenging proximal neck anatomy, be it insufficient length or severe angulation.
It is estimated that up to 30%-40% of patients are unsuitable candidates because of these concerns.1 Such patients are thus relegated to traditional open repair with the associated concerns for supravisceral clamping, including dramatic changes in hemodynamics and prolonged ICU and hospital stays.
Open surgical repair of pararenal, juxtarenal, and suprarenal AAAs is tried, tested, and durable. Knott and the group from Mayo Clinic reviewed their repair of 126 consecutive elective juxtarenal AAAs requiring suprarenal aortic clamping noting a 30-day mortality of .8%.2 More recent data from Kabbani and the Henry Ford group involved their 27-year clinical experience suggesting that open repair of complex proximal aortic aneurysms can be performed with clinical outcomes that are similar to those of open infrarenal repair.3 I respectfully accept this traditional – and historic – treatment modality.
However, we vascular surgeons are progressive and resilient in our quest to innovate and modernize – some of us even modified the traditional endografts on the back table. We charged forward despite the initial paucity of data on infrarenal EVAR compared to traditional open repair of aneurysms in the past. Now, a large percentage of infrarenal AAA repairs are performed via EVAR. In fact, our steadfast progression to advanced endovascular techniques has raised the concern that our graduating trainees are no longer proficient, competent, or even capable, in open complex aneurysm repair!
Tsilimparis and colleagues reported the first outcomes comparing open repair and FEVAR.4 They queried the NSQIP database comparing 1,091 patients undergoing open repair with 264 in the FEVAR group. There was an increased risk of morbidity in all combined endpoints including pulmonary and cardiovascular complications as well as length of stay in patients undergoing the open repair group. A larger comprehensive review pooled the results from 8 FEVAR and 12 open repair series. Analysis of the data found the groups to be identical. Open repair, however, was found to have an increased 30-day mortality when compared to FEVAR (relative risk 1.03, 2% increased absolute mortality).5
Gupta and colleagues reported the latest multi-institutional data noting that open repair was associated with higher risk than FEVAR for 30-day mortality, cardiac and pulmonary complications, renal failure requiring dialysis, return to the operating room, and in this age of cost-containment, length of stay (2 days vs. 7 days; P less than .0001).6
A further study by Donas and colleagues evaluated 90 consecutive patients with primary degenerative juxtarenal AAAs to different operative strategies based on morphologic and clinical characteristics – 29 FEVAR, 30 chEVAR, and 31 open repair.7 Early procedure-related and all-cause 30-day mortality was 0% in the endovascular group and 6.4% in the open group.
Although open repair for juxtarenal AAAs is the gold standard, short- and mid-term data on the outcomes for complex endovascular repair are excellent. Data on long-term durability, graft fixation/migration as well as the integrity of the graft and concerns for endoleaks and branch vessel patency, however, are limited. We do not have long-term data because we have not been doing these newer procedures for that long – but the data thus far show great promise.
We need to continue to challenge the status quo, particularly when the current data are satisfactory and the procedure feasible. With our continued appraisal of the data we publish as vascular surgeons, we can then identify if these innovations and techniques will withstand the test of time. After all, we are vascular surgeons (particularly those of us who have trained extensively in open repair) – and if open repair is necessary, then we will be ready.
But, if I can avoid a thoracoabdominal incision for a few percutaneous access sites, then sign me up!
Dr. Mouawad is chief of vascular and endovascular surgery, medical director of the vascular laboratory, and vice-chair of the department of surgery at McLaren Bay Region, Bay City, Mich. He is assistant professor of surgery at Michigan State University and Central Michigan University.
References
1. Perspect Vasc Surg Endovasc Ther. 2009;21:13-8.
2. J Vasc Surg. 2008;47:695-701.
3. J Vasc Surg. 2014;59:1488-94.
4. Ann Vasc Surg. 2013;27(3):267-73.
5. Eur J Vasc Endovasc Surg. 2009;38(1):35-41.
6. J Vasc Surg. 2017 Dec;66(6):1653-8.
7. J Vasc Surg. 2012 Aug;56(2):285-90.
FEVAR may not be the best choice
Over the past 3 decades, EVAR, with its very low periprocedural morbidity and mortality, and satisfactory long-term results, has become the primary treatment modality for the majority of infrarenal AAAs. The success of stent grafts for the repair of AAA relies heavily on satisfactory proximal and distal seal zones. Each commercially available standard EVAR graft has a manufacturer’s instructions for use requiring a proximal landing zone length of between 10 and 15 mm. Patients with less than this required length are considered to have “short necks.” Evaluation of this group of patients has demonstrated that this is not an uncommon finding and that EVAR performed outside the instructions for use has been associated with an increased risk of intraoperative failure, aneurysm expansion, and later complications.1-3
Current treatment options for patients with short necks include open surgical repair (OSR), FEVAR, and EVAR with the chimney graft technique (Ch-EVAR).
Thus, current knowledge acquired from case series, registries, and clinical experience must be used in deciding which therapeutic option to offer patients. Relevant factors influencing this decision include the availability and adaptability of the technique, early outcomes including technical success, morbidity and mortality, and late outcomes including survival, need for reintervention, and other late morbidity. Finally, in an era of value-based medical care, cost also must be considered.
Currently there is only one Food and Drug Administration–approved fenestrated graft. When used in properly selected patients, excellent periprocedural results have been reported approaching those of standard EVAR. However, there are limitations in both the availability and adaptability of FEVAR. These grafts are custom made for each patient, often requiring several weeks of lead time. Adaptability also has its limitations, including access vessels, severe neck angulation, calcification, mural thrombus, and branch vessel size, number, location, and associated arterial disease. Any of these factors may preclude the use of this technology. Open repair, on the other hand, is not limited by graft availability and allows for custom modification for each patient’s specific disease morphology. The essential limitation for open repair is the patient’s physiological ability to withstand the operation.
Several studies attempting to compare the early outcomes of FEVAR versus comparable patients undergoing OSR of similar aneurysms have reported significantly lower 30-day mortality and major morbidity rates for FEVAR.4,5 However, Rao et al., in a recent systematic review and meta-analysis that included data on 2,326 patients from 35 case series reporting on elective repair of juxtarenal aneurysms by either OSR or FEVAR, found perioperative mortality to not be significantly different (4.1% for both). Also, no significant difference was found between the two groups when evaluating postoperative renal insufficiency and need for permanent dialysis. However, OSR did have significantly higher major complication rates (25% vs. 15.7%).6 These findings suggest that both modalities can be performed successfully, but that long term outcomes need to be considered to determine if the increased initial morbidity of OSR is justified by differences in long term results between the two modalities.
Open surgical repair of juxtarenal AAA has been shown to be a durable repair.7 While early and even intermediate results of FEVAR appear to be satisfactory, long-term durability has yet to be determined.4,8 Along with continuing to exclude the aneurysm sac, as with standard EVAR, there is the additional concern regarding the outcome of the organs supplied by the fenestrated/stent-grafted branches with FEVAR. Longer-term follow-up in the same review by Rao et al. showed that significantly more FEVAR patients developed renal failure compared with OSR patients (19.7% vs. 7.7%). FEVAR patients also had a higher rate of reintervention.
And finally, long-term survival was significantly greater in OSR patients compared to FEVAR at 3 and 5 years (80% vs. 74% vs. 73% vs. 55%). These authors concluded that open repair remains the gold standard while FEVAR is a favorable option for high risk patients.6
These new and innovative stent graft devices come at considerable expense. While this aspect of FEVAR has not been extensively studied, Michel et al., in their report from the multicenter prospective Windows registry, attempted to evaluate the economic aspect of FEVAR. They compared a group of patients who underwent FEVAR to patients from a large national hospital discharge database who underwent OSR. No difference in 30-day mortality was noted between these two groups; however, there was a significantly greater cost with FEVAR. The authors concluded that FEVAR did not appear to be justified for patients fit for open surgery with juxtarenal AAA.9
For now, the roles of OSR and FEVAR would appear to be complementary. Current evidence suggests that OSR is the most appropriate intervention for good risk patients with an anticipated longer life expectancy. Patients with appropriate anatomy for FEVAR and who are at higher risk for open repair would benefit from FEVAR. As further experience and outcomes are accumulated, our ability to select the appropriate therapy for individual patients should improve.
Dr. Weaver is an assistant clinical professor for surgery at Wayne State School of Medicine, Detroit, and an attending in the division of vascular surgery, Henry Ford Hospital.
References
1. Ir J Med Sci. 2015;184(1):249-55.
2. Circulation. 2011;123(24):2848-55.
3. J Endovasc Therapy. 2001;8(5):457-64.
4. Eur J Vasc Endovasc Surg. 2009;38(1):35-41.
5. Ann Vasc Surg. 2013;27(3):267-73.
6. J Vasc Surg. 2015;61(1):242-55.
7. J Vasc Surg. 2012;56(1):2-7.
8. J Cardiovasc Surg. 2015;56(3):331-7.
9. Eur J Vasc Endovasc Surg. 2015;50(2):189-96.
MRI-guided neurofeedback improves ADHD long term in adolescent boys
PARIS – Neurofeedback based upon real-time functional magnetic resonance imaging resulted in long-term reduction in attention-deficit/hyperactivity disorder symptoms in adolescents in a randomized controlled proof-of-concept study, Katya Rubia, PhD, reported at the annual congress of the European College of Neuropsychopharmacology.
The effect size of the improvement when measured at follow-up 11 months after completing the functional MRI-based neurofeedback (fMRI-NF) training exercises was moderate to large and comparable to that of psychostimulant medication in published placebo-controlled clinical trials. But the effects of the medications last only 24 hours after administration, and the drugs have side effects.
Neurofeedback is an operant conditioning procedure, which, through trial and error, teaches patients to self-regulate specific areas of the brain involved in psychopathology. EEG-based neurofeedback for ADHD has been extensively studied, with generally small to medium effect sizes being reported. Morever, patients need to be very highly motivated in order to succeed at EEG-NF: It takes 30-40 EEG-NF sessions, each an hour long, in order to learn targeted brain self-control in ADHD, whereas in Dr. Rubia’s study, patients learned to self-regulate brain activity in an average of eight fMRI sessions, each lasting 8.5 minutes, over the course of 2 weeks. The far speedier learning curve is probably tied to the superior specificity of spatial localization afforded by fMRI neurofeedback, according to the neuroscientist.
Also, fMRI-NF can reach certain key regions of the brain involved in ADHD that EEG-NF cannot, most notably the inferior frontal cortex (IFC) and basal ganglia, she added.
The target region in the proof-of-concept study was the right IFC, an area important for cognitive control, attention, and timing. Functional neuroimaging studies consistently have shown that the right IFC is underactive in ADHD, and that psychostimulant medications upregulate this area. A dysfunctional right IFC is an ADHD-specific abnormality not present in children with obessive-compulsive disorder (JAMA Psychiatry. 2016 Aug 1;73[8]:815-25), conduct disorder, or autism.
“The IFC seems to be a very good functional biomarker for ADHD,” Dr. Rubia said.
The proof-of-concept study, published in Human Brain Mapping, included 31 boys with a DSM-5 diagnosis of ADHD, aged 12-17, who were randomized to fMRI-NF of the right IFC or, as a control condition, to fMRI-NF targeting the left parahippocampal gyrus. Two patients had the inattentive subtype of ADHD; the rest had the combined hyperactive/inattentive form. Parents and patients were blinded as to their study arm.
So this program uses neuroimaging as a treatment. It is neuroimaging employed as neurotherapy. To make the training experience more attractive to young patients, it was presented as a computer game: By making progress in controlling their brain activity, patients could launch a rocket ship on the screen. With further progress, they could send the rocket through the atmosphere into space and eventually land it on another planet.
The primary study endpoint was change in the ADHD Rating Scale. The group that targeted self-upregulation of right IFC activity showed roughly a 20% improvement in scores, from a baseline mean total score of 36.7 to 30.2 immediately post treatment, further improving to a score of 26.7 at roughly 11 months of follow-up. Mean scores on the inattention subscale improved from 19.8 to 15.9 immediately post treatment and 15.3 at follow-up. Scores on the hyperactivity/impulsivity subscale went from 16.9 before treatment to 14.2 after treatment and 11.5 at follow-up.
There were no side effects of fMRI-NF in either study arm.
However, a degree of uncertainty exists regarding the clinical significance of the results, Dr. Rubia said. That’s because the control group showed a similar degree of improvement in ADHD symptoms immediately after learning to upregulate the left parahippocampal gyrus, although their scores did backslide modestly during 11 months of follow-up, while the IFC group continued to improve.
Dr. Rubia acknowledged that this raises the possibility that the observed improvement in clinical symptoms achieved through fMRI-NF could be attributable to a placebo effect. However, she said she believes this is unlikely for several reasons. For one, brain scans showed that targeting either the right IFC or the left parahippocampal gyrus not only resulted in upregulation of activity in those specific regions, but throughout the broader neural networks of which they are a part. The right IFC upregulators showed activation of a bilateral dorsolateral prefrontal cortex/IFC-insular-striato-cerebellar cognitive control network. In contrast, the boys who targeted the left parahippocampal gyrus experienced activation of associated posterior visual-spatial attention regions, which are relevant to ADHD. This made for a far from ideal control group.
Also, the amount of improvement in ADHD symptoms in the right IFC-targeted group correlated with the degree of activation of that region, indicative of a brain-behavior correlation that speaks against a nonspecific effect.
Because this was a small, unpowered pilot study and interest remains intense in potential nonpharmacologic treatments for ADHD, the U.K. Medical Research Council is funding Dr. Rubia and her colleagues for a new 100-patient study – including a sham fMRI-NF arm – in order to definitively address the possibility of a placebo effect. The study also will attempt to pin down the patient population most likely to benefit from fMRI-NF. “It’s possible that the inattentive subtype of ADHD will respond best. Neurofeedback is, after all, a form of attention training,” she noted.
While real-time fMRI-NF might sound prohibitively expensive for widespread use in clinical practice for a disorder as common as ADHD, which has an estimated prevalence of about 7%, it might actually stack up reasonably well in a cost-benefit analysis, compared with ongoing medication costs and side effects or with a year’s worth of weekly psychotherapy, according to Dr. Rubia.
In parallel with the ongoing sham-controlled fMRI-NF study, Dr. Rubia also is conducting a clinical trial of transcranial direct current stimulation of the right IFC in combination with cognitive training. The idea is to study the clinical impact of directly upregulating activity in this area of the brain, bypassing the added step of training patients to gain self-control over this dysregulated region. The early findings, she said, look promising.
The fMRI-NF study (Hum Brain Mapp. 2017 Jun;38[6]:3190-209) was sponsored by the U.K. National Institute for Health Research and the Maudsley NHS Foundation Trust. Dr. Rubia reported receiving speakers honoraria from Lilly, Shire, and Medice.
Source: Rubia K et al. European College of Neuropsychopharmacology.
REPORTING FROM THE ECNP CONGRESS
Key clinical point: Neuroimaging can be employed as neurotherapy to improve ADHD nonpharmacologically.
Major finding: Adolescents with ADHD who learned via functional MRI neurofeedback to upregulate activity in their right inferior frontal cortex showed significant improvement in scores on the ADHD Rating Scale, from a baseline mean total score of 36.7 to 30.2 immediately after the training program, further improving to 26.7 at roughly 11 months of follow-up.
Study details: A prospective, randomized, single-blind study of 31 boys aged 12-17 with ADHD.
Disclosures: The study was sponsored by the U.K. National Institute for Health Research and the Maudsley NHS Foundation Trust. The presenter reported receiving speakers honoraria from Lilly, Shire, and Medice.
Source: Rubia K et al. European College of Neuropsychopharmacology.
New tool predicts late distant recurrence of postmenopausal ER+ breast cancer
SAN ANTONIO – A new prognostic tool that uses four clinical and pathological variables may help to guide decisions about extending adjuvant endocrine therapy for postmenopausal women with estrogen receptor–positive (ER+) breast cancer, according to a study reported at the San Antonio Breast Cancer Symposium.
ER+ breast cancer is well known for recurring long after endocrine therapy stops, but the risk varies widely, ranging from 10% to 40% (N Engl J Med. 2017;377:1836-46), noted lead investigator Ivana Sestak, MS, PhD, a lecturer in medical statistics at the Queen Mary University of London. “A few trials have shown that extended endocrine therapy can reduce the risk of recurrence, but careful assessment of potential side effects and actual risk of developing a late distant recurrence is essential,” she said.

The investigators used the CTS5 to stratify patients into a low-risk group (risk of late distant recurrence less than 5%), an intermediate-risk group (risk between 5% and 10%), and a high-risk group (risk more than 10%). The observed rates of distant recurrence between years 5 and 10 were about 3% for the low-risk group, 7% for the intermediate-risk group, and 19% for the high risk-group. In addition, the CTS5 outperformed the original Clinical Treatment Score (CTS0), which was developed to predict recurrence between 0 and 10 years (J Clin Oncol. 2011;29:4273-8).
“We have developed a simple prognostic tool for the prediction of late distant recurrences which will help clinicians and their patients in the decision-making process about extended endocrine therapy,” Dr. Sestak commented. “The CTS5 was highly prognostic for the prediction of late distant recurrences and identified a large proportion of women, 42%, as low risk, where the value of extended endocrine therapy is limited. The CTS5 was also more prognostic than the already published CTS0 and should be used in this context for the prediction of late distant recurrence.”
“We aim to make the CTS5 algorithm and risk curve, with a read-out table, available to clinicians, and it will also be published in our manuscript,” she added.
Session attendee Frankie Ann Holmes, MD, of the Texas Oncology/US Oncology Network in Houston commented, “Just identifying high risk doesn’t necessarily translate into benefit, which is what we see with the Breast Cancer Index: You get the high risk, but then you learn if there is actually benefit to the extended therapy. Does your assay have a benefit portion to it?”
“No, we can’t look at the predictive benefit [with the CTS5]. This assay is purely a prognostic tool to predict late distant recurrences,” Dr. Sestak replied. “In these two trials, we do not have information on how many patients actually went on to extended endocrine therapy. You have to remember, these are old trials – they finished in about 2007-2008 – so not many women would have been given extended endocrine therapy at that time point.”
Session attendee Laura J. van’t Veer, PhD, of the University of California, San Francisco, asked, “How do you feel this will translate for risk up to 20 years, for which the question of extended endocrine therapy might also be very relevant?”
“For the purpose of this analysis, we only looked at out to 10 years. But I agree, it’s also important if we could apply a prognostic tool out to 20 years,” Dr. Sestak replied. “We have longer follow-up on some of the ATAC women, and we might look into that to see if we see any benefit of using a prognostic tool in the prediction of late distant recurrences.”
Study details
The investigators developed and trained the new tool using data from 4,735 women from the ATAC trial. They then validated the tool using data from 6,711 women from the BIG 1-98 trial.
The final CTS5 model contained four clinical variables, Dr. Sestak reported: number of involved nodes, size of the tumor, grade of the tumor, and age of the patient.
In the ATAC population, the CTS5 model did a better job than the original CTS0 model of predicting late distant recurrence. CTS5 improved the prediction of late distant recurrence by a factor of 2.47, whereas CTS0 improved the predictive value by a factor of 2.04. The CTS5 model performed similarly well regardless of whether patients had received chemotherapy.
In the BIG 1-98 population, the findings were much the same: The CTS5 model improved prediction of late distant recurrence by 2.07, while the CTS0 model improved prediction of late distant recurrence by 1.84. Performance of the CTS5 model was again similarly good regardless of whether patients had received chemotherapy.
Observed rates of distant recurrence between years 5 and 10 were similar in the ATAC and BIG 1-98 populations for the CTS5-defined low-risk group (2.5% and 3.0%, respectively), intermediate-risk group (7.7% and 6.9%), and the high-risk group (20.3% and 17.3%).
When the two trials’ populations were combined, the observed rate was 3.0% in the CTS5-defined low-risk group, 7.3% in the intermediate-risk group, and 18.9% in the high-risk group.
In addition, the main results held up among all node-negative women combined and among all women who had between one and three positive nodes combined. “For women with four or more positive lymph nodes, the CTS5 was not informative and categorized virtually all women into the high-risk group,” Dr. Sestak noted.
The investigators did not look at whether local or regional recurrences modulated the risk of late distant recurrence, she said. However, women who had experienced isolated local recurrence during the first 5 years would have been included in analysis.
“A strength of our study is that we used clinicopathological parameters that are measured in all breast cancer patients, and there is no need for further testing,” noted Dr. Sestak, who disclosed that she has received fees for advisory boards and lectures from Myriad Genetics.
On the other hand, it is unclear how the CTS5 would perform among premenopausal women and among women with HER2-positive disease given that two trials took place before routine HER2 testing and HER2-directed therapy were used.
SOURCE: Sestak I et al. SABCS 2017 Abstract GS6-01.
SAN ANTONIO – A new prognostic tool that uses four clinical and pathological variables may help to guide decisions about extending adjuvant endocrine therapy for postmenopausal women with estrogen receptor–positive (ER+) breast cancer, according to a study reported at the San Antonio Breast Cancer Symposium.
ER+ breast cancer is well known for recurring long after endocrine therapy stops, but the risk varies widely, ranging from 10% to 40% (N Engl J Med. 2017;377:1836-46), noted lead investigator Ivana Sestak, MS, PhD, a lecturer in medical statistics at the Queen Mary University of London. “A few trials have shown that extended endocrine therapy can reduce the risk of recurrence, but careful assessment of potential side effects and actual risk of developing a late distant recurrence is essential,” she said.
The investigators used the CTS5 to stratify patients into a low-risk group (risk of late distant recurrence less than 5%), an intermediate-risk group (risk between 5% and 10%), and a high-risk group (risk more than 10%). The observed rates of distant recurrence between years 5 and 10 were about 3% for the low-risk group, 7% for the intermediate-risk group, and 19% for the high risk-group. In addition, the CTS5 outperformed the original Clinical Treatment Score (CTS0), which was developed to predict recurrence between 0 and 10 years (J Clin Oncol. 2011;29:4273-8).
“We have developed a simple prognostic tool for the prediction of late distant recurrences which will help clinicians and their patients in the decision-making process about extended endocrine therapy,” Dr. Sestak commented. “The CTS5 was highly prognostic for the prediction of late distant recurrences and identified a large proportion of women, 42%, as low risk, where the value of extended endocrine therapy is limited. The CTS5 was also more prognostic than the already published CTS0 and should be used in this context for the prediction of late distant recurrence.”
“We aim to make the CTS5 algorithm and risk curve, with a read-out table, available to clinicians, and it will also be published in our manuscript,” she added.
Session attendee Frankie Ann Holmes, MD, of the Texas Oncology/US Oncology Network in Houston commented, “Just identifying high risk doesn’t necessarily translate into benefit, which is what we see with the Breast Cancer Index: You get the high risk, but then you learn if there is actually benefit to the extended therapy. Does your assay have a benefit portion to it?”
“No, we can’t look at the predictive benefit [with the CTS5]. This assay is purely a prognostic tool to predict late distant recurrences,” Dr. Sestak replied. “In these two trials, we do not have information on how many patients actually went on to extended endocrine therapy. You have to remember, these are old trials – they finished in about 2007-2008 – so not many women would have been given extended endocrine therapy at that time point.”
Session attendee Laura J. van’t Veer, PhD, of the University of California, San Francisco, asked, “How do you feel this will translate for risk up to 20 years, for which the question of extended endocrine therapy might also be very relevant?”
“For the purpose of this analysis, we only looked at out to 10 years. But I agree, it’s also important if we could apply a prognostic tool out to 20 years,” Dr. Sestak replied. “We have longer follow-up on some of the ATAC women, and we might look into that to see if we see any benefit of using a prognostic tool in the prediction of late distant recurrences.”
Study details
The investigators developed and trained the new tool using data from 4,735 women from the ATAC trial. They then validated the tool using data from 6,711 women from the BIG 1-98 trial.
The final CTS5 model contained four clinical variables, Dr. Sestak reported: number of involved nodes, size of the tumor, grade of the tumor, and age of the patient.
In the ATAC population, the CTS5 model did a better job than the original CTS0 model of predicting late distant recurrence. CTS5 improved the prediction of late distant recurrence by a factor of 2.47, whereas CTS0 improved the predictive value by a factor of 2.04. The CTS5 model performed similarly well regardless of whether patients had received chemotherapy.
In the BIG 1-98 population, the findings were much the same: The CTS5 model improved prediction of late distant recurrence by 2.07, while the CTS0 model improved prediction of late distant recurrence by 1.84. Performance of the CTS5 model was again similarly good regardless of whether patients had received chemotherapy.
Observed rates of distant recurrence between years 5 and 10 were similar in the ATAC and BIG 1-98 populations for the CTS5-defined low-risk group (2.5% and 3.0%, respectively), intermediate-risk group (7.7% and 6.9%), and the high-risk group (20.3% and 17.3%).
When the two trials’ populations were combined, the observed rate was 3.0% in the CTS5-defined low-risk group, 7.3% in the intermediate-risk group, and 18.9% in the high-risk group.
In addition, the main results held up among all node-negative women combined and among all women who had between one and three positive nodes combined. “For women with four or more positive lymph nodes, the CTS5 was not informative and categorized virtually all women into the high-risk group,” Dr. Sestak noted.
The investigators did not look at whether local or regional recurrences modulated the risk of late distant recurrence, she said. However, women who had experienced isolated local recurrence during the first 5 years would have been included in analysis.
“A strength of our study is that we used clinicopathological parameters that are measured in all breast cancer patients, and there is no need for further testing,” noted Dr. Sestak, who disclosed that she has received fees for advisory boards and lectures from Myriad Genetics.
On the other hand, it is unclear how the CTS5 would perform among premenopausal women and among women with HER2-positive disease given that two trials took place before routine HER2 testing and HER2-directed therapy were used.
SOURCE: Sestak I et al. SABCS 2017 Abstract GS6-01.
REPORTING FROM SABCS 2017
Key clinical point:
Major finding: The tool stratified patients for risk of distant recurrence between years 5 and 10 as low risk (less than 5% risk), intermediate risk (5%-10% risk), and high risk (more than 10% risk).
Data source: A cohort study of 11,446 postmenopausal women with early-stage breast cancer who were free of distant recurrence after 5 years of adjuvant endocrine therapy.
Disclosures: Dr. Sestak disclosed that she has received fees for advisory boards and lectures from Myriad Genetics.
Source: Sestak I et al. SABCS 2017 Abstract GS6-01.
FDA expands indication for bosutinib in newly diagnosed CML
Bosutinib is now approved for the treatment of adults with newly diagnosed chronic phase Philadelphia chromosome–positive (Ph+) chronic myelogenous leukemia (CML).
The Food and Drug Administration granted accelerated approval for bosutinib (Bosulif), which is marketed by Pfizer. The approval is based on data from the randomized, multicenter phase 3 BFORE trial of 487 patients with Ph+ newly diagnosed chronic phase CML who received either bosutinib or imatinib 400 mg once daily. Major molecular response at 12 months was 47.2% (95% confidence interval, 40.9-53.4) in the bosutinib arm and 36.9% (95% CI, 30.8-43.0) in the imatinib arm (two-sided P = .0200).
Bosutinib, a kinase inhibitor, was first approved in September 2012 for the treatment of adult patients with chronic, accelerated, or blast phase Ph+ CML with resistance or intolerance to prior therapy.
The recommended dose of bosutinib for newly diagnosed chronic phase Ph+ CML is 400 mg orally once daily with food.
The most common adverse reactions to the drug in newly diagnosed CML patients are diarrhea, nausea, thrombocytopenia, rash, increased alanine aminotransferase, abdominal pain, and increased aspartate aminotransferase.
CMS clinical trials raise cardiac mortality
Nearly 2 years ago I speculated in this column that health planners or health economists would attempt to manipulate the patterns of patient care to influence the cost and/or quality of clinical care. At that time I suggested that, in that event, the intervention should be managed as we have with drug or device trials to ensure the authenticity and accuracy and most of all assuring the safety of the patient. Furthermore, the design should be incorporated in the intervention, that equipoise be present in the arms of the trial and that a safety monitoring board be in place to alert investigators when and if patient safety is threatened. Patient consent should also be obtained.

Beginning in 2012, CMS, using claims data from 2008 to 2012, penalized hospitals if they did not achieve acceptable readmission rates. At the same time, the agency established the Hospital Admission Reduction Program to monitor 30-day mortality and standardize readmission data. The recent data indicate that the incentives did achieve some decrease in rehospitalization but this was associated with a 16.5% relative increase in 30-day mortality. It was of particular concern that in the previous decade there had been a progressive decrease in 30-day mortality (Circulation 2014;130:966-75). The increase in 30-day mortality observed in the 4-year observational period appears to have interrupted the progressive decrease in 30-day mortality, which would have decreased to 30% if not impacted by the plan.
My previous concerns with this type of social experimentation and manipulation of health care was carried out, and as far as I can tell, continues without any oversight and little insight into the possible risks of this process. A better designed study would have provided better understanding of these results and might have mitigated the adverse effects and mortality events. It is suggested that some hospitals actually gamed the system to their economic advantage. In addition, no oversight board was or is in place as we have with drug trials to allow monitors to become aware of adverse events before there any further loss of life occurs.
I would agree that a randomized trial in this environment would be difficult to achieve. Obtaining consent from thousands of patients would also be difficult. Nevertheless, .
Dr. Goldstein, medical editor of Cardiology News, is professor of medicine at Wayne State University and division head emeritus of cardiovascular medicine at Henry Ford Hospital, both in Detroit. He is on data safety monitoring committees for the National Institutes of Health and several pharmaceutical companies.
Nearly 2 years ago I speculated in this column that health planners or health economists would attempt to manipulate the patterns of patient care to influence the cost and/or quality of clinical care. At that time I suggested that, in that event, the intervention should be managed as we have with drug or device trials to ensure the authenticity and accuracy and most of all assuring the safety of the patient. Furthermore, the design should be incorporated in the intervention, that equipoise be present in the arms of the trial and that a safety monitoring board be in place to alert investigators when and if patient safety is threatened. Patient consent should also be obtained.
Beginning in 2012, CMS, using claims data from 2008 to 2012, penalized hospitals if they did not achieve acceptable readmission rates. At the same time, the agency established the Hospital Admission Reduction Program to monitor 30-day mortality and standardize readmission data. The recent data indicate that the incentives did achieve some decrease in rehospitalization but this was associated with a 16.5% relative increase in 30-day mortality. It was of particular concern that in the previous decade there had been a progressive decrease in 30-day mortality (Circulation 2014;130:966-75). The increase in 30-day mortality observed in the 4-year observational period appears to have interrupted the progressive decrease in 30-day mortality, which would have decreased to 30% if not impacted by the plan.
My previous concerns with this type of social experimentation and manipulation of health care was carried out, and as far as I can tell, continues without any oversight and little insight into the possible risks of this process. A better designed study would have provided better understanding of these results and might have mitigated the adverse effects and mortality events. It is suggested that some hospitals actually gamed the system to their economic advantage. In addition, no oversight board was or is in place as we have with drug trials to allow monitors to become aware of adverse events before there any further loss of life occurs.
I would agree that a randomized trial in this environment would be difficult to achieve. Obtaining consent from thousands of patients would also be difficult. Nevertheless, .
Dr. Goldstein, medical editor of Cardiology News, is professor of medicine at Wayne State University and division head emeritus of cardiovascular medicine at Henry Ford Hospital, both in Detroit. He is on data safety monitoring committees for the National Institutes of Health and several pharmaceutical companies.
EndoPredict results reflected tumor response to neoadjuvant therapy
SAN ANTONIO – The results of the EndoPredict test appear to predict tumor response in patients with early hormone receptor–positive, HER2-negative breast cancer given neoadjuvant therapy, based on results of a study conducted by the Austrian Breast & Colorectal Cancer Study Group (ABCSG).
“Very good tumor shrinkage in estrogen receptor–positive, HER2-negative disease is going to happen only in a minority of patients, and biomarkers that would predict excellent tumor shrinkage are an unmet medical need,” commented lead investigator Peter Dubsky, MD, PhD, who is head of the Breast Center at Hirslanden Klinik St. Anna, Lucerne, Switzerland. “As a surgeon, that would help me to predict breast conservation at diagnosis, but as a surgical oncologist, I would also recognize that tumor response is an important component of future survival.”
The ABCSG findings suggest expanded utility for EndoPredict. The test’s molecular score is currently used along with tumor size and nodal status to predict the 10-year distant recurrence rate, and whether patients may safely forgo chemotherapy or are at high risk and may need adjuvant chemotherapy in addition to endocrine therapy.
Dr. Dubsky and his coinvestigators assessed performance of the EndoPredict test among 217 patients treated on ABCSG 34, a randomized phase 2 neoadjuvant trial. Findings showed that among patients given neoadjuvant endocrine therapy because they had less aggressive disease features, an EndoPredict high-risk result was associated with poor response (negative predictive value of 92%), defined as a residual cancer burden (RCB) of II or III, he reported at the San Antonio Breast Cancer Symposium.
On the other hand, among patients given neoadjuvant chemotherapy because they had more aggressive disease features, a low-risk result was associated with poor response (negative predictive value of 100%).
“Clinicians really gave us two distinct cohorts within ABCSG 34. In the luminal A–type patients who were treated with neoendocrine therapy, a high EndoPredict score predicted a low chance of tumor shrinkage. In the more aggressive ER-positive tumors, so-called luminal B type, treated with neoadjuvant chemotherapy, there was absolutely no excellent response in the low-risk group,” Dr. Dubsky summarized. “We believe that this molecular score may contribute to patient selection for biomarker-driven studies, especially in the neoadjuvant setting.”
Session attendee Steven Vogl, MD, a medical oncologist with the Montefiore Medical Center in New York, commented, “I have trouble correlating an RCB of 0 or I with what you as a surgeon do for the patient, because you are talking about pathologic complete response or just a few cells there. That’s not what determines how much breast you take off: It’s determined by the total size of the tumor and the size of the breast. So if it’s less than a few centimeters, I’m sure you can do a lumpectomy in every patient. Tell me why I should care that you are getting an RCB of 0 or I in these endocrine patients.”
“Because it’s more likely that these patients will have a smaller tumor and better tumor shrinkage,” Dr. Dubsky replied. “You are of course right, RCB 0 or I was not designed to help surgeons. But it helps me as a translational scientist to have a surrogate and an exact classification for good tumor shrinkage. That’s how I used it.”
C. Kent Osborne, MD, codirector of SABCS and director of the Dan L. Duncan Cancer Center at Baylor College of Medicine in Houston, asked, “We see it in the clinic, and I’m sure you have as well, patients whose tumor doesn’t shrink very much, but the Ki-67 really drops. And that may or may not be a better factor than the actual tumor shrinkage. So how many patients who had tumors that didn’t shrink, which was your endpoint, had a reduction in Ki-67 that was, say, 5%?”
“We haven’t looked at that specifically, but we will do so as we carry on with the follow-up of these patients. Then we can learn more about the prognosis,” Dr. Dubsky replied.
Study details
ABCSG 34 was a randomized phase 2 trial testing addition of the cancer vaccine tecemotide (Stimuvax) to neoadjuvant standard of care among patients with HER2-negative early breast cancer.
Dr. Dubsky and coinvestigators restricted analyses to patients with hormone receptor–positive disease who, depending on clinical and pathologic factors, received neoadjuvant chemotherapy (eight cycles of epirubicin-cyclophosphamide and docetaxel) or neoadjuvant endocrine therapy (6 months of letrozole [Femara]) as standard of care. They were then randomized to additionally receive tecemotide or not before undergoing surgery.
Overall, 25% of the 134 patients in the neoadjuvant chemotherapy group had a good tumor response, defined as pathologic complete response in both breast and nodes (RCB of 0) or minimal residual disease (RCB of I).
Higher EndoPredict score was associated with greater likelihood of good response to chemotherapy. EndoPredict risk group (high vs. low) had a negative predictive value of 100%, a positive predictive value of 26.4%, a true-positive rate of 100%, and a true-negative rate of 8.9% for predicting response (P = .112).
Area under the receiver operating characteristic curve was 0.736.
In a multivariate model, EndoPredict score as a continuous variable was not an independent predictor of response. “The good response was largely driven by covariates that included cell proliferation, and it was Ki-67 that was significant,” Dr. Dubsky noted.
Overall, 18% of the 83 patients in the neoadjuvant endocrine therapy group had a good tumor response (RCB of 0 or I). Here, lower EndoPredict score was associated with greater likelihood of good response. EndoPredict risk group (high vs. low) had a negative predictive value of 92.3%, a positive predictive value of 27.3%, a true-positive rate of 80.0%, and a true-negative rate of 52.9% for predicting response (P = .024). Area under the curve was 0.726.
In a multivariate model here, EndoPredict score as a continuous variable, its estrogen receptor–signaling/differentiation component, and Ki-67 did not independently predict response. “It was maybe a bit surprising that T stage was the strongest factor, possibly indicating that we should have simply treated those women longer than 6 months,” Dr. Dubsky commented. The EndoPredict proliferation component was also a significant predictor.
“Possibly, the very narrow distribution of Ki-67 [among patients given neoendocrine therapy] may have prevented this factor from playing a bigger role in this particular model,” he speculated.
Dr. Dubsky disclosed that he receives consulting fees from Myriad, the maker of EndoPredict, and from Cepheid, Nanostring, and Amgen.
SOURCE: Dubsky P et al. SABCS 2017 Abstract GS6-04.
REPORTING FROM SABCS 2017
Key clinical point:
Major finding: EndoPredict predicted poor tumor shrinkage in patients given neoadjuvant endocrine therapy (high-risk test result NPV, 92%) or neoadjuvant chemotherapy (low-risk test result NPV, 100%).
Data source: A cohort study of 217 patients with HR–positive, HER2-negative breast cancer enrolled in a phase 2 trial of neoadjuvant therapy (ABCSG 34).
Disclosures: Dr. Dubsky disclosed that he receives consulting fees from Cepheid, Myriad, Nanostring, and Amgen.
Wider margins may reduce recurrence risk in early breast cancer
SAN ANTONIO – A margin width beyond ‘no tumor on ink’ may reduce local recurrence in certain subsets of patients undergoing breast-conserving treatment for early-stage breast cancer, according to findings from a meta-analysis.
“Further prospective studies are required to validate the appropriate margin width,” study author Frank A. Vicini, MD, of 21st Century Oncology/Michigan Healthcare Professionals in Farmington Hills, Michigan, said at the San Antonio Breast Cancer Symposium.
Dr. Vicini pointed out that the medical community has been addressing the question of “what is the appropriate margin for breast conserving therapy” for about 3 or 4 decades. A meta-analysis of 33 studies (Ann Surg Oncol. 2014 Mar;21[3]:717-30. doi: 10.1245/s10434-014-3480-5) showed that wider margins are unlikely to have a substantial benefit over “no tumor on ink.”
The results of the meta-analysis led to guidelines published by the Society of Surgical Oncology–American Society for Radiation Oncology that supported those conclusions.
“So the question now is that with additional patients and additional modeling, is this conclusion still correct?” Dr. Vicini said.
The 2014 meta-analysis had significant limitations, and to address them, Dr. Vicini and his colleagues conducted an updated analysis of all available data that included 31 of the initial studies. However, stricter criteria were used for inclusion into their review. The authors reviewed all studies published between 1995 and 2016 that had a minimum follow-up of 50 months, and that included explicit pathologic definitions of margin status and local recurrence in relation to margin status.
The final meta-analysis included 55,302 patients (74% T1 tumors; 72% node-negative disease) from a total of 38 studies, and the median follow up was 7.2 years.
The analysis used three generalized linear mixed models for the outcome of local recurrence, and random effects for study and fixed effects for various patient and study characteristics.
In model 1, all patients with at or equal margin width were compared with those who had wider margins. Model 2 examined the impact of margin width “range” as opposed to a set margin width of 0 mm to 2 mm, 2 mm to 5 mm, or greater than 5 mm. Model 3 divided margin distance by cut points of –1 mm, 2 mm, and 5 mm.
The crude rate of local recurrence was 10.3% for patients with positive margins versus 3.8% for those with negative margins that were defined as no tumor on ink or wider (P less than .001). Local recurrence rates declined as the margin distance increased: 7.2% for patients with margins 0-2 mm, 3.6% for margins of 2-5 mm, and 3.2% for margins wider than 5 mm (P less than .001 for each). The use of endocrine therapy and increasing median study year were associated with decreased rates of local recurrence in univariate models but not in multivariable analyses.
For local recurrence in model 1, a benefit for wider margins was observed, with the greatest benefit seen at 1 mm. The odds ratio (OR) for local recurrence for negative vs. close/positive margins was 0.46 (95% confidence interval, 0.4-0.53) for margins larger than 0 mm, 0.43 (95% CI, 0.36-0.51) for those greater than 1 mm, 0.49 (95% CI, 0.42-0.55) for those larger than 2 mm, and 0.53 (95% CI, 0.43-0.66) for greater than 5 mm. Upon multivariate analysis, the only significant predictive variable was margin status.
For model 2, margin width turned out to be the significant variable, and only wider margins were associated with a decrease in local recurrence.
Finally, in model 3, both margin status and margin width were significantly associated with local recurrence. When modeling as negative, close, or positive margins, the lowest rates were at 2 mm (negative, 3.6%; close, 5.5%; positive, 9.5%) and 5 mm (negative, 2.9%; close, 4.1%; positive, 12.8%).
“So the initial question is the same – should we achieve a 1- to 2-mm margin for our patients as compared to a no tumor on ink, taking into account the potential for local control benefits versus morbidity and time, and cost?” said Dr. Vicini.
“The real question in my mind, is which patients with no tumor on ink require additional surgery,” he concluded. “In my opinion, it may not only be related to the margin status itself, but to the volume of disease near the margin but these meta-analyses were not designed to look at that point.”
SOURCE: Vicini et al. SABCS Abstract GS5-01
REPORTING FROM SABCS 2017
Key clinical point: Margin widths of at least 2 mm are associated with a reduced risk of ipsilateral breast tumor recurrence versus narrower but uninvolved margins.
Major finding: Crude rates of local recurrence decreased as the margin distance increased: 7.2% for patients with margins 0-2 mm, 3.6% for margins of 2-5 mm, and 3.2% for margins wider than 5 mm (P less than .001 for each).
Data source: Meta-analysis of 38 studies with a total cohort of 55,302 patients treated during 1968-2010.
Disclosures: Study funding was not disclosed. The authors have no relevant disclosures.
Source: Vicini et al. SABCS Abstract GS5-01
Biomechanical Evaluation of a Novel Suture Augment in Patella Fixation
Take-Home Points
- Suture augmentation improves construct strength for patella fixation.
- Krackow sutures may be placed in the quadriceps and patella tendons, then secured over the anterior patella (much like an anterior tension band).
- The Krackow technique described was superior to the suture cerclage technique based on mean load values, but did not reach statistical significance.
- The Krackow suture technique is a viable and easily applied technique for suture augmentation of patella fixation constructs.
Patella fractures are relatively uncommon, accounting for only 1% of skeletal injuries.1 Restoration of the function of the patella and the extensor mechanism is vital for knee extension and gait. However, patella fractures have an inherently high rate of complications, making these injuries challenging to treat.2-4 In patients with intact extensor function, displacement of <4 mm, and articular step-off of <3 mm, nonoperative management is extremely effective, with 99% of patients reporting favorable results.5 However, for fractures in which the extensor mechanism is disrupted, surgical intervention typically is indicated.6
Authors have reported various surgical interventions, one of the most commonly used being the anterior tension band (ATB) technique, first described by the AO (Arbeitsgemeinschaft für Osteosynthesefragen) group in the 1950s.7 By converting distractive anterior force during knee flexion to compressive force at the fracture site, the ATB technique provides a repair stronger than the previously used cerclage repair.8 Although initially considered standard of care, the ATB technique was soon found to be associated with implant failure and subcutaneous irritation prompting implant removal.9
To address these issues, Berg10 and Carpenter and colleagues11 evaluated an ATB technique that used cannulated screws instead of Kirschner wires (K-wires). This variation on the ATB technique reduced the implant-related issues while maintaining the mechanical advantage of the tension band. The more rigid design also permitted earlier postoperative rehabilitation, which significantly reduced development of arthrofibrosis.6,7,10 This modified ATB (MATB) technique has since been investigated for additional augments, mainly focusing on use of different tension band materials, including polyester suture and braided composite suture.12-14
However, there is little research on augments that incorporate the surrounding soft tissue, specifically the quadriceps and patellar tendons. In a recent retrospective clinical study, Oh and colleagues15 found positive clinical results with use of Krackow sutures, though 2 or 3 vertically oriented stainless steel wires were used instead of cannulated screws.
We conducted a study to determine the biomechanical efficacy of using a cerclage suture augment and a Krackow suture augment coupled with and compared with conventional MATB repair. If effective, this technique may represent another strategy for increasing repair strength and thereby improve postoperative outcomes.
Materials and Methods
Specimen Preparation
Fresh-frozen cadaver extensor mechanisms (quadriceps tendon, patella, surrounding retinaculum, patellar tendon) were kept frozen at –4°C until preparation. Fifteen specimens were selected. Mean (SD) age at death was 68 (10) years (range, 51-85 years). One specimen was excluded for a short patella tendon, which precluded adequate attachment for testing. All specimens were free of overt osseous pathology.
After specimens were thawed overnight, the patellae were transversely osteotomized with an osteotome at the junction of the middle and distal thirds of the patella. Sharp dissection was performed to carry the division through the medial and lateral retinaculum at the same level. All 14 specimens were then repaired using the MATB technique. First, the transverse fracture was reduced with a reduction clamp. Then, two 4-mm cannulated screws (DePuy Synthes) were inserted parallel to each other and perpendicular to the fracture. An 18-gauge stainless steel wire was then passed through each screw, crossed anteriorly, and tightened to create a figure-of-8 ATB. The specimens were then randomly divided into 3 groups—MATB; MATB with cerclage suture augment; MATB with Krackow suture augment—while ensuring specimens from a single cadaver were placed in different groups to avoid confounding based on bone density differences.
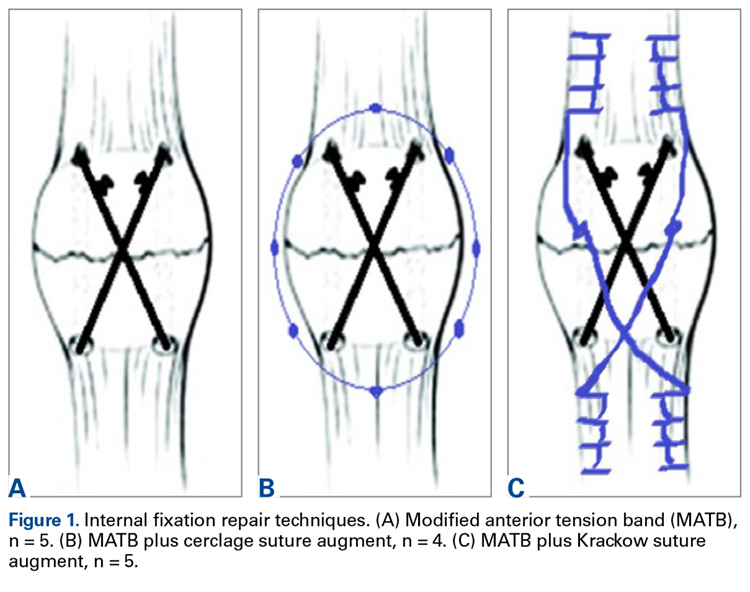
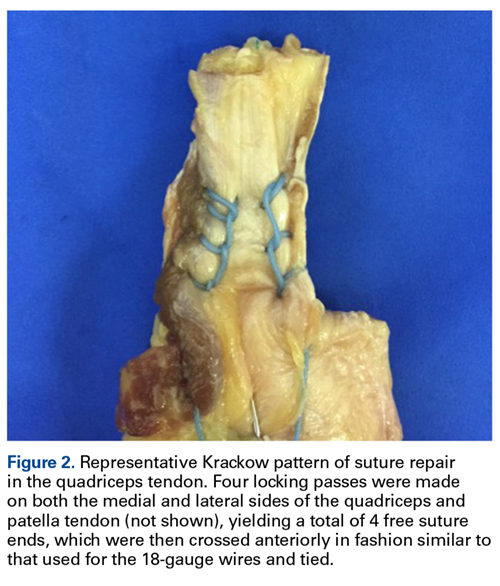
Experimental Setup
Repaired specimens were secured with tissue clamps at the quadriceps and patellar tendons on an MTS Bionix 858 (MTS Systems) hydraulic arm.
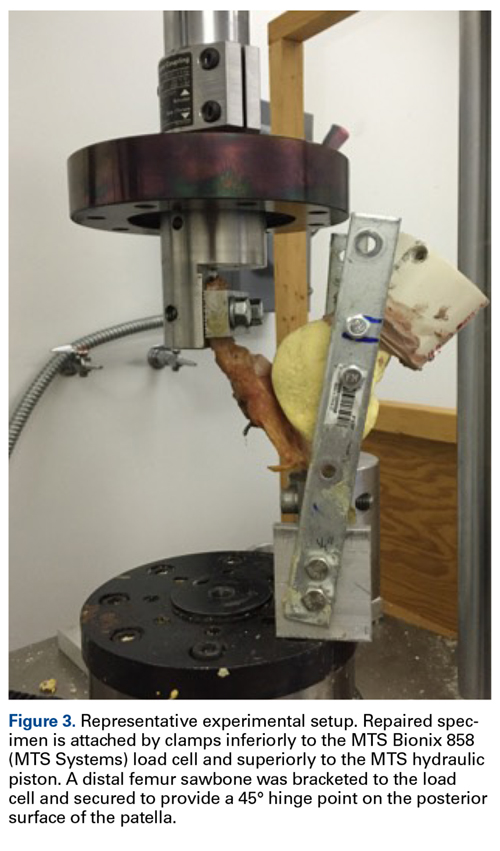
Each patella was secured for cyclic testing. Initially it was placed under 10 N of tension. Then it underwent tensile loading from 10 N to 300 N at 50 N/s for 10 cycles. These parameters were based on previous biomechanical patella studies.10,11 Load was measured with the MTS load cell and displacement with the displacement transducer. Fracture displacement associated with 300-N cyclic tension was recorded. Displacement was calculated as the difference between 10th cycle and 2nd cycle values, which accounted for any degree of initial tissue slippage. After cyclic testing, the patella was placed back in 10 N of tensile loading and subjected to maximum force loading to determine ultimate repair strength. For maximum loading, the patella was stretched progressively at 50 N/s until failure. Again, load and displacement were measured with MTS.
Statistical Analysis
After testing, fracture displacement and maximum load force data were compiled for analysis. One-way analysis of variance with Bonferroni correction was used to determine if there were significant differences between groups. Significance level was set at P < .05.
Results
For cyclic testing, mean total displacement was measured over 10 cycles for each group. Again, displacement was determined by taking the difference between 10th cycle and 2nd cycle values, allowing for system stabilization.
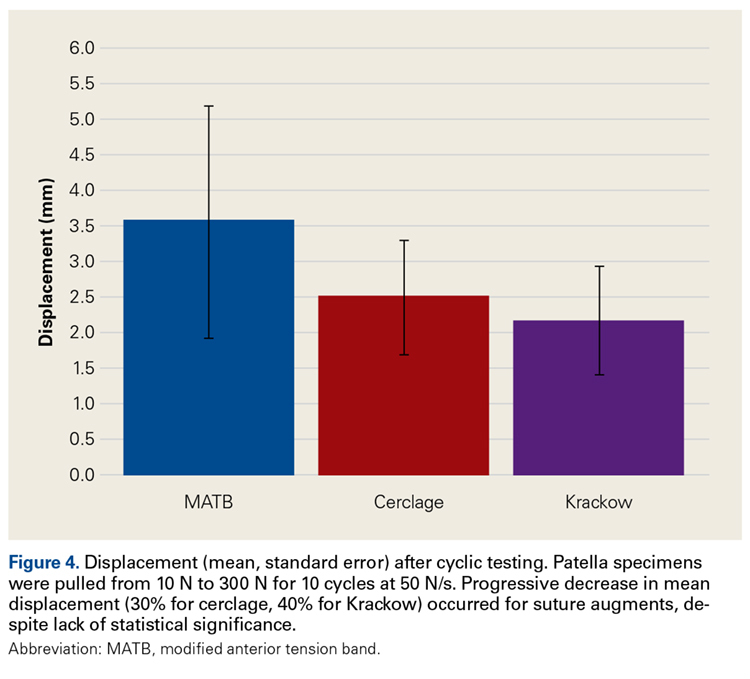
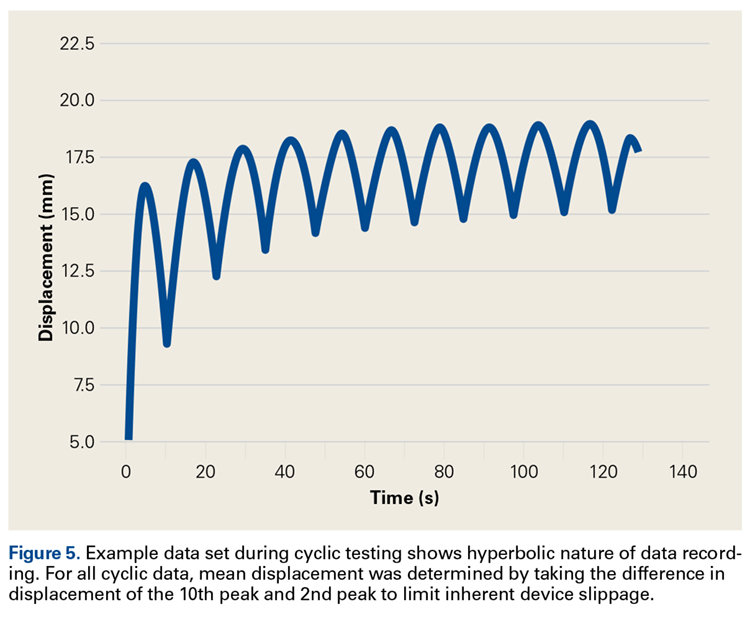
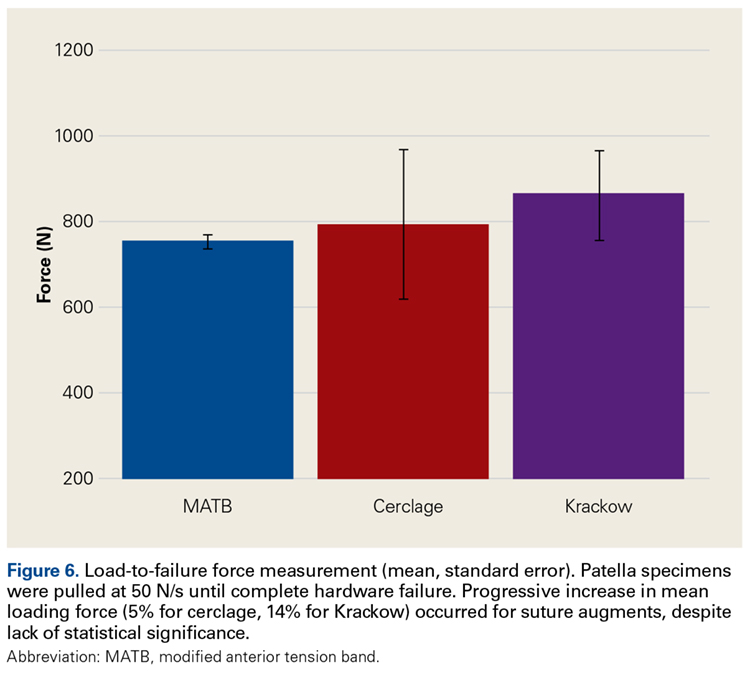
Discussion
Our main objective was to compare the efficacy of a novel suture augment technique with that of other patella fracture repair techniques. Our hypothesis—that adding a Krackow suture augment would increase strength in both cyclic and maximum loading—was supported. Although testing results were not statistically significant because of the small sample size, we think this novel technique has clinically relevant descriptive significance and warrants further investigation.
Proper anatomical reduction and postoperative stabilization are of utmost importance in clinical approaches to patella fractures. In addition, regardless of which technical procedure is used, open reduction should also allow for early range of motion to prevent joint arthrofibrosis. Ever since the ATB technique was first described by the AO group, postoperative outcomes have improved significantly. In a retrospective study by Levack and colleagues,17 30 of 64 patients with patella fractures underwent internal fixation. Mean follow-up was 6.2 years. By both objective and subjective measures, the best functional outcomes were associated with internal tension band fixation (vs cerclage repair). Lotke and Ecker18 also documented the efficacy of the tension band technique. Sixteen patients with patella fractures underwent anterior tension banding; those with a comminuted fracture also underwent cerclage repair for patella stabilization during tension banding. At 6-week follow-up, all patients had good range of motion (≥90° flexion), relatively few symptoms, and no implant failures. Results were similar to those of Levack and colleagues.17
Although it improves stability and functional outcomes over conventional patellectomy and cerclage wiring, the ATB technique has been associated with subcutaneous irritation caused by the K-wires used to secure the band. Hung and colleagues9 followed up 68 patients with patellar fractures. Five of these patients underwent tension banding. Although there was a high level of adequate functional outcomes, implant irritation was found to be “quite frequent.”
To address this issue, Carpenter and colleagues11 evaluated an ATB technique that uses K-wires instead of cannulated screws. Biomechanical testing in a cadaver model revealed less fracture displacement and overall more repair strength through cyclic and maximum load testing. Clinically, these results were supported by Berg,10 who followed up 10 patients with transverse patella fractures repaired with the MATB technique. At a mean follow-up of 24 months, 7 of the 10 patients had good to excellent outcomes, and there were no implant failures.
Further investigation into patella repairs has mainly focused on improving the MATB technique and experimenting with different tension band materials. Rabalais and colleagues13 biomechanically tested high-strength polyethylene suture as a replacement for standard 18-gauge wire, and Bryant and colleagues14 tested a braided composite suture (FiberWire; Arthrex) as a replacement for standard 18-gauge stainless steel wire. Both found no significant difference with use of augmented tension band material, but Rabalais and colleagues13 did find more advantages with a parallel tension band construct than with a standard figure-of-8 arrangement.
In developing our novel technique, we considered that Krackow sutures are routinely used in both quadriceps tendon repair and patellar tendon repair, including partial patellectomy for distal patella fracture. With a suture placed in both tendons, the augment could be expected to resist longitudinal gapping and augment the tension band across the anterior patella. First described by Krackow and colleagues,19 the Krackow suture is widely used for tendon reconstruction. In an interlocking system of sutures, the Krackow suture provides a repair that is more stable than repair with conventional suture techniques, specifically in the context of tendon repair.20 Given the sesamoidal nature of the patella, its repair shares the goal of gap prevention with other tendon repairs. In theory, anchoring the supporting structures that are above and below the patella provides support for the intervening patella and ultimately improves fracture fixation strength.
Oh and colleagues15 reported on the clinical efficacy of a Krackow augment in distal pole patella repairs. Similarly, we found a Krackow augment to be efficacious, supporting its potential in clinical approaches to patella repairs. Our results indicate this augment can be a useful clinical adjunct in biomechanical evaluation.
Limitations of this study include its use of dissected extensor mechanisms, which may have less biofidelity than whole-knee specimens. In our model, specimens were secured at the patellar tendon and the quadriceps tendons, as opposed to the quadriceps tendon and the tibia distally. Use of this model could have led to an increase in early displacement during cyclic testing as a result of tissue slippage. Furthermore, our small sample size could have affected our ability to demonstrate a difference between these techniques.
Given its increased strength as demonstrated by mean displacement during cyclic loading and mean load to failure, as well as the early clinical data recently published, the Krackow suture augment represents a feasible technique for patella fixation. It likely will be most useful in cases in which conventional techniques are prone to failure or cannot be applied, such as severe distal comminution or poor bone density. Further biomechanical testing with a larger number of specimens may be required for statistical significance.
Conclusion
In patella fracture repair strategies, the Krackow suture augment increased strength when used with a MATB technique. Failure to reach statistical significance likely resulted from our small sample size. Further biomechanical testing and clinical studies are needed for more complete evaluation of this technique. We think it will be most useful in the setting of poor bone quality or severe comminution, which can limit fixation options. As increased repair strength allows earlier postoperative rehabilitation and maintains fracture reduction, patient outcomes should improve. This novel technique represents another strategy for managing challenging patella fractures.
1. Boström Å. Fracture of the patella. A study of 422 patellar fractures. Acta Orthop Scand Suppl. 1972;143:1-80.
2. Hungerford DS, Barry M. Biomechanics of the patellofemoral joint. Clin Orthop Relat Res. 1979;(144):9-15.
3. LeBrun CT, Langford JR, Sagi HC. Functional outcomes after operatively treated patella fractures. J Orthop Trauma. 2012;26(7):422-426.
4. Kaufer H. Mechanical function of the patella. J Bone Joint Surg Am. 1971;53(8):1551-1560.
5. Braun W, Wiedemann M, Rüter A, Kundel K, Kolbinger S. Indications and results of nonoperative treatment of patellar fractures. Clin Orthop Relat Res. 1993;(289):197-201.
6. Melvin JS, Mehta S. Patellar fractures in adults. J Am Acad Orthop Surg. 2011;19(4):198-207.
7. Müller M, Allgöwer M, Schneider R, Willeneger H. Manual of Internal Fixation: Techniques Recommended by the AO Group. Berlin, Germany: Springer; 1979.
8. Weber MJ, Janecki CJ, McLeod P, Nelson CL, Thompson JA. Efficacy of various forms of fixation of transverse fractures of the patella. J Bone Joint Surg Am. 1980;62(2):215-220.
9. Hung LK, Chan KM, Chow YN, Leung PC. Fractured patella: operative treatment using the tension band principle. Injury. 1985;16(5):343-347.
10. Berg EE. Open reduction internal fixation of displaced transverse patella fractures with figure-eight wiring through parallel cannulated compression screws. J Orthop Trauma. 1997;11(8):573-576.
11. Carpenter JE, Kasman RA, Patel N, Lee ML, Goldstein SA. Biomechanical evaluation of current patella fracture fixation techniques. J Orthop Trauma. 1997;11(5):351-356.
12. Hughes SC, Stott PM, Hearnden AJ, Ripley LG. A new and effective tension-band braided polyester suture technique for transverse patellar fracture fixation. Injury. 2007;38(2):212-222.
13. Rabalais RD, Burger E, Lu Y, Mansour A, Baratta RV. Comparison of two tension-band fixation materials and techniques in transverse patella fractures: a biomechanical study. Orthopedics. 2008;31(2):128.
14. Bryant TL, Anderson CL, Stevens CG, Conrad BP, Vincent HK, Sadasivan KK. Comparison of cannulated screws with FiberWire or stainless steel wire for patella fracture fixation: a pilot study. J Orthop. 2014;12(2):92-96.
15. Oh HK, Choo SK, Kim JW, Lee M. Internal fixation of displaced inferior pole of the patella fractures using vertical wiring augmented with Krachow suturing. Injury. 2015;46(12):2512-2515.
16. Goodfellow J, Hungerford DS, Zindel M. Patello-femoral joint mechanics and pathology. 1. Functional anatomy of the patello-femoral joint. J Bone Joint Surg Br. 1976;58(3):287-290.
17. Levack B, Flannagan JP, Hobbs S. Results of surgical treatment of patellar fractures. J Bone Joint Surg Br. 1985;67(3):416-419.
18. Lotke PA, Ecker ML. Transverse fractures of the patella. Clin Orthop Relat Res. 1981;(158):180-184.
19. Krackow KA, Thomas SC, Jones LC. Ligament-tendon fixation: analysis of a new stitch and comparison with standard techniques. Orthopedics. 1988;11(6):909-917.
20. Hahn JM, Inceoğlu S, Wongworawat MD. Biomechanical comparison of Krackow locking stitch versus nonlocking loop stitch with varying number of throws. Am J Sports Med. 2014;42(12):3003-3008.
Take-Home Points
- Suture augmentation improves construct strength for patella fixation.
- Krackow sutures may be placed in the quadriceps and patella tendons, then secured over the anterior patella (much like an anterior tension band).
- The Krackow technique described was superior to the suture cerclage technique based on mean load values, but did not reach statistical significance.
- The Krackow suture technique is a viable and easily applied technique for suture augmentation of patella fixation constructs.
Patella fractures are relatively uncommon, accounting for only 1% of skeletal injuries.1 Restoration of the function of the patella and the extensor mechanism is vital for knee extension and gait. However, patella fractures have an inherently high rate of complications, making these injuries challenging to treat.2-4 In patients with intact extensor function, displacement of <4 mm, and articular step-off of <3 mm, nonoperative management is extremely effective, with 99% of patients reporting favorable results.5 However, for fractures in which the extensor mechanism is disrupted, surgical intervention typically is indicated.6
Authors have reported various surgical interventions, one of the most commonly used being the anterior tension band (ATB) technique, first described by the AO (Arbeitsgemeinschaft für Osteosynthesefragen) group in the 1950s.7 By converting distractive anterior force during knee flexion to compressive force at the fracture site, the ATB technique provides a repair stronger than the previously used cerclage repair.8 Although initially considered standard of care, the ATB technique was soon found to be associated with implant failure and subcutaneous irritation prompting implant removal.9
To address these issues, Berg10 and Carpenter and colleagues11 evaluated an ATB technique that used cannulated screws instead of Kirschner wires (K-wires). This variation on the ATB technique reduced the implant-related issues while maintaining the mechanical advantage of the tension band. The more rigid design also permitted earlier postoperative rehabilitation, which significantly reduced development of arthrofibrosis.6,7,10 This modified ATB (MATB) technique has since been investigated for additional augments, mainly focusing on use of different tension band materials, including polyester suture and braided composite suture.12-14
However, there is little research on augments that incorporate the surrounding soft tissue, specifically the quadriceps and patellar tendons. In a recent retrospective clinical study, Oh and colleagues15 found positive clinical results with use of Krackow sutures, though 2 or 3 vertically oriented stainless steel wires were used instead of cannulated screws.
We conducted a study to determine the biomechanical efficacy of using a cerclage suture augment and a Krackow suture augment coupled with and compared with conventional MATB repair. If effective, this technique may represent another strategy for increasing repair strength and thereby improve postoperative outcomes.
Materials and Methods
Specimen Preparation
Fresh-frozen cadaver extensor mechanisms (quadriceps tendon, patella, surrounding retinaculum, patellar tendon) were kept frozen at –4°C until preparation. Fifteen specimens were selected. Mean (SD) age at death was 68 (10) years (range, 51-85 years). One specimen was excluded for a short patella tendon, which precluded adequate attachment for testing. All specimens were free of overt osseous pathology.
After specimens were thawed overnight, the patellae were transversely osteotomized with an osteotome at the junction of the middle and distal thirds of the patella. Sharp dissection was performed to carry the division through the medial and lateral retinaculum at the same level. All 14 specimens were then repaired using the MATB technique. First, the transverse fracture was reduced with a reduction clamp. Then, two 4-mm cannulated screws (DePuy Synthes) were inserted parallel to each other and perpendicular to the fracture. An 18-gauge stainless steel wire was then passed through each screw, crossed anteriorly, and tightened to create a figure-of-8 ATB. The specimens were then randomly divided into 3 groups—MATB; MATB with cerclage suture augment; MATB with Krackow suture augment—while ensuring specimens from a single cadaver were placed in different groups to avoid confounding based on bone density differences.
Experimental Setup
Repaired specimens were secured with tissue clamps at the quadriceps and patellar tendons on an MTS Bionix 858 (MTS Systems) hydraulic arm.
Each patella was secured for cyclic testing. Initially it was placed under 10 N of tension. Then it underwent tensile loading from 10 N to 300 N at 50 N/s for 10 cycles. These parameters were based on previous biomechanical patella studies.10,11 Load was measured with the MTS load cell and displacement with the displacement transducer. Fracture displacement associated with 300-N cyclic tension was recorded. Displacement was calculated as the difference between 10th cycle and 2nd cycle values, which accounted for any degree of initial tissue slippage. After cyclic testing, the patella was placed back in 10 N of tensile loading and subjected to maximum force loading to determine ultimate repair strength. For maximum loading, the patella was stretched progressively at 50 N/s until failure. Again, load and displacement were measured with MTS.
Statistical Analysis
After testing, fracture displacement and maximum load force data were compiled for analysis. One-way analysis of variance with Bonferroni correction was used to determine if there were significant differences between groups. Significance level was set at P < .05.
Results
For cyclic testing, mean total displacement was measured over 10 cycles for each group. Again, displacement was determined by taking the difference between 10th cycle and 2nd cycle values, allowing for system stabilization.
Discussion
Our main objective was to compare the efficacy of a novel suture augment technique with that of other patella fracture repair techniques. Our hypothesis—that adding a Krackow suture augment would increase strength in both cyclic and maximum loading—was supported. Although testing results were not statistically significant because of the small sample size, we think this novel technique has clinically relevant descriptive significance and warrants further investigation.
Proper anatomical reduction and postoperative stabilization are of utmost importance in clinical approaches to patella fractures. In addition, regardless of which technical procedure is used, open reduction should also allow for early range of motion to prevent joint arthrofibrosis. Ever since the ATB technique was first described by the AO group, postoperative outcomes have improved significantly. In a retrospective study by Levack and colleagues,17 30 of 64 patients with patella fractures underwent internal fixation. Mean follow-up was 6.2 years. By both objective and subjective measures, the best functional outcomes were associated with internal tension band fixation (vs cerclage repair). Lotke and Ecker18 also documented the efficacy of the tension band technique. Sixteen patients with patella fractures underwent anterior tension banding; those with a comminuted fracture also underwent cerclage repair for patella stabilization during tension banding. At 6-week follow-up, all patients had good range of motion (≥90° flexion), relatively few symptoms, and no implant failures. Results were similar to those of Levack and colleagues.17
Although it improves stability and functional outcomes over conventional patellectomy and cerclage wiring, the ATB technique has been associated with subcutaneous irritation caused by the K-wires used to secure the band. Hung and colleagues9 followed up 68 patients with patellar fractures. Five of these patients underwent tension banding. Although there was a high level of adequate functional outcomes, implant irritation was found to be “quite frequent.”
To address this issue, Carpenter and colleagues11 evaluated an ATB technique that uses K-wires instead of cannulated screws. Biomechanical testing in a cadaver model revealed less fracture displacement and overall more repair strength through cyclic and maximum load testing. Clinically, these results were supported by Berg,10 who followed up 10 patients with transverse patella fractures repaired with the MATB technique. At a mean follow-up of 24 months, 7 of the 10 patients had good to excellent outcomes, and there were no implant failures.
Further investigation into patella repairs has mainly focused on improving the MATB technique and experimenting with different tension band materials. Rabalais and colleagues13 biomechanically tested high-strength polyethylene suture as a replacement for standard 18-gauge wire, and Bryant and colleagues14 tested a braided composite suture (FiberWire; Arthrex) as a replacement for standard 18-gauge stainless steel wire. Both found no significant difference with use of augmented tension band material, but Rabalais and colleagues13 did find more advantages with a parallel tension band construct than with a standard figure-of-8 arrangement.
In developing our novel technique, we considered that Krackow sutures are routinely used in both quadriceps tendon repair and patellar tendon repair, including partial patellectomy for distal patella fracture. With a suture placed in both tendons, the augment could be expected to resist longitudinal gapping and augment the tension band across the anterior patella. First described by Krackow and colleagues,19 the Krackow suture is widely used for tendon reconstruction. In an interlocking system of sutures, the Krackow suture provides a repair that is more stable than repair with conventional suture techniques, specifically in the context of tendon repair.20 Given the sesamoidal nature of the patella, its repair shares the goal of gap prevention with other tendon repairs. In theory, anchoring the supporting structures that are above and below the patella provides support for the intervening patella and ultimately improves fracture fixation strength.
Oh and colleagues15 reported on the clinical efficacy of a Krackow augment in distal pole patella repairs. Similarly, we found a Krackow augment to be efficacious, supporting its potential in clinical approaches to patella repairs. Our results indicate this augment can be a useful clinical adjunct in biomechanical evaluation.
Limitations of this study include its use of dissected extensor mechanisms, which may have less biofidelity than whole-knee specimens. In our model, specimens were secured at the patellar tendon and the quadriceps tendons, as opposed to the quadriceps tendon and the tibia distally. Use of this model could have led to an increase in early displacement during cyclic testing as a result of tissue slippage. Furthermore, our small sample size could have affected our ability to demonstrate a difference between these techniques.
Given its increased strength as demonstrated by mean displacement during cyclic loading and mean load to failure, as well as the early clinical data recently published, the Krackow suture augment represents a feasible technique for patella fixation. It likely will be most useful in cases in which conventional techniques are prone to failure or cannot be applied, such as severe distal comminution or poor bone density. Further biomechanical testing with a larger number of specimens may be required for statistical significance.
Conclusion
In patella fracture repair strategies, the Krackow suture augment increased strength when used with a MATB technique. Failure to reach statistical significance likely resulted from our small sample size. Further biomechanical testing and clinical studies are needed for more complete evaluation of this technique. We think it will be most useful in the setting of poor bone quality or severe comminution, which can limit fixation options. As increased repair strength allows earlier postoperative rehabilitation and maintains fracture reduction, patient outcomes should improve. This novel technique represents another strategy for managing challenging patella fractures.
1. Boström Å. Fracture of the patella. A study of 422 patellar fractures. Acta Orthop Scand Suppl. 1972;143:1-80.
2. Hungerford DS, Barry M. Biomechanics of the patellofemoral joint. Clin Orthop Relat Res. 1979;(144):9-15.
3. LeBrun CT, Langford JR, Sagi HC. Functional outcomes after operatively treated patella fractures. J Orthop Trauma. 2012;26(7):422-426.
4. Kaufer H. Mechanical function of the patella. J Bone Joint Surg Am. 1971;53(8):1551-1560.
5. Braun W, Wiedemann M, Rüter A, Kundel K, Kolbinger S. Indications and results of nonoperative treatment of patellar fractures. Clin Orthop Relat Res. 1993;(289):197-201.
6. Melvin JS, Mehta S. Patellar fractures in adults. J Am Acad Orthop Surg. 2011;19(4):198-207.
7. Müller M, Allgöwer M, Schneider R, Willeneger H. Manual of Internal Fixation: Techniques Recommended by the AO Group. Berlin, Germany: Springer; 1979.
8. Weber MJ, Janecki CJ, McLeod P, Nelson CL, Thompson JA. Efficacy of various forms of fixation of transverse fractures of the patella. J Bone Joint Surg Am. 1980;62(2):215-220.
9. Hung LK, Chan KM, Chow YN, Leung PC. Fractured patella: operative treatment using the tension band principle. Injury. 1985;16(5):343-347.
10. Berg EE. Open reduction internal fixation of displaced transverse patella fractures with figure-eight wiring through parallel cannulated compression screws. J Orthop Trauma. 1997;11(8):573-576.
11. Carpenter JE, Kasman RA, Patel N, Lee ML, Goldstein SA. Biomechanical evaluation of current patella fracture fixation techniques. J Orthop Trauma. 1997;11(5):351-356.
12. Hughes SC, Stott PM, Hearnden AJ, Ripley LG. A new and effective tension-band braided polyester suture technique for transverse patellar fracture fixation. Injury. 2007;38(2):212-222.
13. Rabalais RD, Burger E, Lu Y, Mansour A, Baratta RV. Comparison of two tension-band fixation materials and techniques in transverse patella fractures: a biomechanical study. Orthopedics. 2008;31(2):128.
14. Bryant TL, Anderson CL, Stevens CG, Conrad BP, Vincent HK, Sadasivan KK. Comparison of cannulated screws with FiberWire or stainless steel wire for patella fracture fixation: a pilot study. J Orthop. 2014;12(2):92-96.
15. Oh HK, Choo SK, Kim JW, Lee M. Internal fixation of displaced inferior pole of the patella fractures using vertical wiring augmented with Krachow suturing. Injury. 2015;46(12):2512-2515.
16. Goodfellow J, Hungerford DS, Zindel M. Patello-femoral joint mechanics and pathology. 1. Functional anatomy of the patello-femoral joint. J Bone Joint Surg Br. 1976;58(3):287-290.
17. Levack B, Flannagan JP, Hobbs S. Results of surgical treatment of patellar fractures. J Bone Joint Surg Br. 1985;67(3):416-419.
18. Lotke PA, Ecker ML. Transverse fractures of the patella. Clin Orthop Relat Res. 1981;(158):180-184.
19. Krackow KA, Thomas SC, Jones LC. Ligament-tendon fixation: analysis of a new stitch and comparison with standard techniques. Orthopedics. 1988;11(6):909-917.
20. Hahn JM, Inceoğlu S, Wongworawat MD. Biomechanical comparison of Krackow locking stitch versus nonlocking loop stitch with varying number of throws. Am J Sports Med. 2014;42(12):3003-3008.
FFR-guided PCI in stable CAD beats medical management
DENVER – Percutaneous coronary intervention plus optimal medical therapy in stable coronary artery disease (CAD) patients with at least one coronary lesion having an abnormal fractional flow reserve measurement resulted in superior clinical outcomes, better quality of life, and virtually identical cost, compared with optimal medical management alone over 3 years of follow-up in the FAME 2 trial.
“These results reinforce the point that the greater the burden of ischemia, the greater the benefit of revascularization with PCI [percutaneous coronary intervention],” William F. Fearon, MD, said while presenting the FAME 2 findings at the Transcatheter Cardiovascular Therapeutics annual meeting.

FAME 2 was a randomized, multicenter trial designed to help bring clarity regarding the optimal treatment strategy for patients with stable angina and CAD. This is an issue surrounded by considerable controversy. The fog descended a decade ago, when the COURAGE trial created a stir with its conclusion that optimal medical therapy (OMT) alone was as good as PCI plus OMT in terms of clinical outcome and quality of life – and was considerably less expensive as well. And the British ORBITA trial, presented earlier in the same session at TCT 2017 as Dr. Fearon’s report on FAME 2, caused an uproar with its finding that PCI plus OMT was no more effective than sham PCI plus OMT in the setting of stable CAD.
However, FAME 2 (Fractional Flow Reserve versus Angiography for Multivessel Evaluation) differed from those studies in a crucial aspect: randomization in FAME 2 was restricted to patients with physiologically significant cardiac ischemia as evidenced by a fractional flow reserve (FFR) measurement of 0.80 or less.
In contrast, COURAGE and ORBITA randomized patients without FFR guidance. As a result, in those trials PCI was performed in a substantial proportion of patients who actually should not have undergone the intervention because they didn’t have physiologic evidence of clinically important ischemia. The non–physiologically based approach to PCI utilized in COURAGE and ORBITA – disappointingly commonplace in daily clinical practice – diluted any true benefit of the procedure when applied appropriately, explained Dr. Fearon, professor of medicine and director of interventional cardiology at Stanford (Calif.) University.
FAME 2 randomized 888 patients with stable single- or multivessel CAD and an FFR of 0.80 or less to PCI plus OMT or an initial strategy of OMT alone at 28 European and North American sites. The primary outcome was the rate of major adverse cardiac events – death, MI, and urgent revascularization – at 3 years. The rate was 10.1% in the PCI group, compared with 22% in the medically managed cohort, Dr. Fearon reported at the meeting sponsored by the Cardiovascular Research Foundation.
Death or MI occurred in 8.3% of the PCI group versus 10.4% in the OMT group, a trend that didn’t reach significance. Of note, however, fully 44% of patients in the OMT group crossed over to PCI during the 3-year study. In the prespecified intent-to-treat analysis they were counted in the OMT group, whereas an as-treated analysis might well have shown statistically significant reductions in death and MI in the PCI group.
The proportion of patients with class II-IV angina was significantly lower in the PCI plus medical therapy group at every time point, including 5.9% versus 15.2% for OMT alone at 1 year, 5.9% versus 12% at 2 years, and 5.2% versus 9.7% at 3 years. This was the case even though the OMT group received significantly more antianginal therapy in an effort to control symptoms.
FAME 2 featured a first-of-its-kind comprehensive cost-effectiveness analysis of OMT vs. PCI over a 3-year period. It showed that, while mean initial costs were as expected higher in the PCI group ($9,944 versus $4,440), by 3 years the cumulative costs were near identical at $16,792 in the PCI group and $16,737 in the initial OMT group. The incremental cost-effectiveness ratio for PCI, compared with OMT at 3 years was attractive at $1,600 per quality-adjusted life-year gained.
The question on TCT attendees’ minds following presentation of the bombshell ORBITA findings was, what would have happened had FAME 2 featured a sham PCI arm? Could the advantageous outcomes for the initial PCI strategy seen in FAME 2 possibly have been due to a placebo effect?
Extremely unlikely, according to Dr. Fearon. For one thing, when he and his coinvestigators broke down the FFR values in the OMT group into quintiles, they saw a clear dose-response effect: The clinical event rate rose further with worsening quintile of FFR. Also, the study endpoints were death, MI, and urgent revascularization – triggered by ACS in half of cases – which are less susceptible to a placebo effect than, say, treadmill exercise time, the primary endpoint in ORBITA.
Moreover, as noted by Gary S. Mintz, MD, who moderated a press conference highlighting the ORBITA and FAME 2 results, placebo effects don’t last for years.
“Most people would say the placebo effect wanes over time. That’s why these 3-year data, analyzed by intent-to-treat, which allow for crossovers to still be analyzed in the medical therapy arm, are pretty compelling to me,” commented Dr. Mintz, chief medical officer for the Cardiovascular Research Foundation in New York.
FAME 2 was supported by St. Jude Medical. Dr. Fearon reported receiving institutional research support from Medtronic, Abbott Vascular, ACIST Medical, CathWorks, and Edwards LifeSciences.
DENVER – Percutaneous coronary intervention plus optimal medical therapy in stable coronary artery disease (CAD) patients with at least one coronary lesion having an abnormal fractional flow reserve measurement resulted in superior clinical outcomes, better quality of life, and virtually identical cost, compared with optimal medical management alone over 3 years of follow-up in the FAME 2 trial.
“These results reinforce the point that the greater the burden of ischemia, the greater the benefit of revascularization with PCI [percutaneous coronary intervention],” William F. Fearon, MD, said while presenting the FAME 2 findings at the Transcatheter Cardiovascular Therapeutics annual meeting.
FAME 2 was a randomized, multicenter trial designed to help bring clarity regarding the optimal treatment strategy for patients with stable angina and CAD. This is an issue surrounded by considerable controversy. The fog descended a decade ago, when the COURAGE trial created a stir with its conclusion that optimal medical therapy (OMT) alone was as good as PCI plus OMT in terms of clinical outcome and quality of life – and was considerably less expensive as well. And the British ORBITA trial, presented earlier in the same session at TCT 2017 as Dr. Fearon’s report on FAME 2, caused an uproar with its finding that PCI plus OMT was no more effective than sham PCI plus OMT in the setting of stable CAD.
However, FAME 2 (Fractional Flow Reserve versus Angiography for Multivessel Evaluation) differed from those studies in a crucial aspect: randomization in FAME 2 was restricted to patients with physiologically significant cardiac ischemia as evidenced by a fractional flow reserve (FFR) measurement of 0.80 or less.
In contrast, COURAGE and ORBITA randomized patients without FFR guidance. As a result, in those trials PCI was performed in a substantial proportion of patients who actually should not have undergone the intervention because they didn’t have physiologic evidence of clinically important ischemia. The non–physiologically based approach to PCI utilized in COURAGE and ORBITA – disappointingly commonplace in daily clinical practice – diluted any true benefit of the procedure when applied appropriately, explained Dr. Fearon, professor of medicine and director of interventional cardiology at Stanford (Calif.) University.
FAME 2 randomized 888 patients with stable single- or multivessel CAD and an FFR of 0.80 or less to PCI plus OMT or an initial strategy of OMT alone at 28 European and North American sites. The primary outcome was the rate of major adverse cardiac events – death, MI, and urgent revascularization – at 3 years. The rate was 10.1% in the PCI group, compared with 22% in the medically managed cohort, Dr. Fearon reported at the meeting sponsored by the Cardiovascular Research Foundation.
Death or MI occurred in 8.3% of the PCI group versus 10.4% in the OMT group, a trend that didn’t reach significance. Of note, however, fully 44% of patients in the OMT group crossed over to PCI during the 3-year study. In the prespecified intent-to-treat analysis they were counted in the OMT group, whereas an as-treated analysis might well have shown statistically significant reductions in death and MI in the PCI group.
The proportion of patients with class II-IV angina was significantly lower in the PCI plus medical therapy group at every time point, including 5.9% versus 15.2% for OMT alone at 1 year, 5.9% versus 12% at 2 years, and 5.2% versus 9.7% at 3 years. This was the case even though the OMT group received significantly more antianginal therapy in an effort to control symptoms.
FAME 2 featured a first-of-its-kind comprehensive cost-effectiveness analysis of OMT vs. PCI over a 3-year period. It showed that, while mean initial costs were as expected higher in the PCI group ($9,944 versus $4,440), by 3 years the cumulative costs were near identical at $16,792 in the PCI group and $16,737 in the initial OMT group. The incremental cost-effectiveness ratio for PCI, compared with OMT at 3 years was attractive at $1,600 per quality-adjusted life-year gained.
The question on TCT attendees’ minds following presentation of the bombshell ORBITA findings was, what would have happened had FAME 2 featured a sham PCI arm? Could the advantageous outcomes for the initial PCI strategy seen in FAME 2 possibly have been due to a placebo effect?
Extremely unlikely, according to Dr. Fearon. For one thing, when he and his coinvestigators broke down the FFR values in the OMT group into quintiles, they saw a clear dose-response effect: The clinical event rate rose further with worsening quintile of FFR. Also, the study endpoints were death, MI, and urgent revascularization – triggered by ACS in half of cases – which are less susceptible to a placebo effect than, say, treadmill exercise time, the primary endpoint in ORBITA.
Moreover, as noted by Gary S. Mintz, MD, who moderated a press conference highlighting the ORBITA and FAME 2 results, placebo effects don’t last for years.
“Most people would say the placebo effect wanes over time. That’s why these 3-year data, analyzed by intent-to-treat, which allow for crossovers to still be analyzed in the medical therapy arm, are pretty compelling to me,” commented Dr. Mintz, chief medical officer for the Cardiovascular Research Foundation in New York.
FAME 2 was supported by St. Jude Medical. Dr. Fearon reported receiving institutional research support from Medtronic, Abbott Vascular, ACIST Medical, CathWorks, and Edwards LifeSciences.
REPORTING FROM TCT 2017
Key clinical point:
Major finding: The rate of major adverse cardiac events at 3 years was 10.1% in the PCI group and 22% in the medically managed cohort.
Data source: The FAME 2 trial randomized 888 patients with stable single- or multivessel CAD and an FFR of 0.80 or less to PCI plus optimal medical therapy or an initial strategy of optimal medical management alone.
Disclosures: The trial was supported by St. Jude Medical. The presenter reported receiving institutional research support from Medtronic, Abbott Vascular, ACIST Medical, CathWorks, and Edwards LifeSciences.
EVAR, venous CPT coding revamped for 2018
CHICAGO – Current Procedural Terminology coding for endovascular aneurysm repair has been totally overhauled for 2018 with the introduction of a family of 20 new codes and codes for other vascular procedures have also been updated.
The new EVAR CPT codes attempt to capture the work involved in performing the procedures based upon the anatomy of the aneurysm and the treated vessels rather than being device-based, as previously, Matthew J. Sideman, MD, explained in presenting the coding and reimbursement for 2018 at a symposium on vascular surgery sponsored by Northwestern University.
“The new EVAR codes for 2018 have got a lot of gains. There are some losses as well, but overall, I think it’s going to be very positive moving forward,” according to Dr. Sideman, a vascular surgeon at the University of Texas, San Antonio, who serves as chair of the Society for Vascular Surgery Coding and Reimbursement Committee and an adviser to the American Medical Association Relative Value Scale Update Committee (RUC).
“What we gained was a new code for ruptured aneurysm repair, a new code for enhanced fixation, a new code for percutaneous access, new codes for alternative access options, and now all the access codes are add-on codes. But what we traded off was loss due to bundling. So catheterization is now bundled into the main procedure, radiographic supervision and interpretation is now bundled. The big thing that really hurt was we lost all proximal extensions to the renal arteries and all distal extensions to the iliac bifurcations – they’re also bundled into the main procedure,” he said.
Restructuring the EVAR codes was a multiyear collaborative project of the SVS, the American College of Surgeons, the Society of Interventional Radiology, the Society of Thoracic Surgery, the American College of Cardiology, and the Society for Cardiovascular Angiography and Interventions. The impetus was twofold: recognition that the existing codes seriously undervalued the work involved in EVAR because, for example, they didn’t distinguish between ruptured and elective aneurysm repair, nor did they recognize the unique challenges and advantages of percutaneous access.
Also, representatives of the professional societies involved with vascular medicine recognized that they had to develop a detailed proposal for coding restructuring or matters might be taken out of their hands. Bundling of codes has become the prevailing dogma at the RUC and the Centers for Medicare and Medicaid. Their current policy is that when analysis of coding patterns indicates two codes are billed together at least 51% of the time, that’s considered a ‘typical’ situation and a new code must be created combining them. The harsh reality for clinicians is that under what Dr. Sideman called “RUC math,” the new bundled codes invariably pay less than the two old ones.
“There was a little bit of smoke and mirrors – ‘Look at the pretty flashing lights and not what’s going on behind over here’ – as we tried to maintain value as we bundled these EVAR codes,” Dr. Sideman recalled. “I can stand here and tell you I did my very best to push for the best values possible. It can be a painful process, but I thought we came out ok.”
How the new EVAR codes work
Dr. Sideman explained that the impact of the new EVAR codes will depend upon a surgeon’s practice pattern.
He offered as a concrete example a patient undergoing elective EVAR of the aorta and both iliac arteries with percutaneous access and placement of a bifurcated device with one docking limb. In 2017, this might have been handled using CPT codes 34802, 36200-50, and 75952-26, for a total of 31.05 Relative Value Units (RVUs) of work.
In 2018, however, this same surgical strategy would be coded as 34705 (elective endovascular repair of infrarenal aorta and/or iliac artery or arteries) plus 34713 x 2 (percutaneous access and closure), for a total of 34.58 RVUs. Thus, the surgeon would come out 3.53 RVUs ahead in 2018, which at a conversion factor of $35.78/RVU translates to an extra $126.30.
On the other hand, if the surgeon chose to use a bifurcated device with one docking limb, a left iliac bell-bottom extension, a right iliac bell-bottom extension, and percutaneous access, in 2017, this would have been coded as 34802, 34825, 34826, 36200-50, 75952-26, and 75953-26 x 2, for a total of 44.29 RVUs of work. In 2018, this same treatment strategy would be coded as 34705 plus 34713 x 2, for a total of 34.58 RVUs, or a knockdown of 9.71 fewer RVUs compared with the year before, which translates to $347.42 less.
“The more extensions you use, the more you’re going to come out behind going forward,” according to Dr. Sideman.
Other coding changes in 2018
Sclerotherapy of single and multiple veins (codes 36470 and 36471) got down-valued from 1.10 and 2.49 to 0.75 and 1.5 RVUs, respectively.
Angiography of the extremities (75710 and 75716) will be better reimbursed in 2018. In what Dr. Sideman called “a good win,” unilateral angiography will be rated as 1.75 RVUs, up from 1.14 in 2017, while bilateral angiography increased from 1.31 to 1.97 RVUs.
“The other nice thing I can tell you is that through campaigning and lobbying and comments to CMS [Centers for Medicare & Medicaid Services], we got them to reverse their recommendations from 2017 to 2018 on the dialysis family of codes,” the surgeon continued.
Reimbursement for the dialysis codes took a big hit from 2016 to 2017, amounting to several hundred million dollars less in reimbursement, but CMS has reversed its policy on that score. The RVUs for the various dialysis codes have increased from 2017 to 2018 by 5%-21%, with central venous angioplasty (CPT 36907) garnering the biggest increase.
Existing RVUs were retained for 2018 in three of the four selective catheter placement codes. However, reimbursement for 36215 (first order catheterization of the thoracic or brachiocephalic branch) dropped from 4.67 to 4.17 RVUs because physician surveys showed the time involved was less than previously rated. Once the RUC and CMS saw that the time involved in a procedure has decreased, it became impossible to maintain the RVU, Dr. Sideman explained.
And speaking of time involved in procedures, Dr. Sideman offered a final plea to his vascular medicine colleagues:
“When you get surveys from the RUC asking for your input, please, please, please, fill them out because that’s how we get our direct physician input into the valuation of codes.”
He reported having no financial conflicts of interest regarding his presentation.
A detailed listing of many of the codes and changes can be found at the American College of Radiology website, and the Society for Vascular Surgery has coding resources available on their website, as well.
EXPERT ANALYSIS FROM THE NORTHWESTERN VASCULAR SYMPOSIUM