User login
Value-based payment: What does it mean, and how can ObGyns get out ahead?
For ObGyns to be successful, understanding the basics of quality and cost measurement is essential, along with devoting more attention to what they are being evaluated on and held accountable for. But how will ObGyns be impacted by the push to incentivize them for delivering value in their work?
Although much of health care policy has become politically divisive lately, one area of agreement is that, in the United States, we have unsustainable health costs and the exorbitant amount our country pays for health care does not translate to improved outcomes. The United States spends more than most other developed nations on health care (roughly, $9,403 per capita in 2014) but has some of the lowest life expectancies, along with the highest maternal and infant mortality rates, compared with peer nations.1–4
One of the key culprits in our health system’s inefficiencies is the fee-for-service payment model. Fee-for-service incentivizes the delivery of a high volume of care without any way to determine whether that care is achieving the desired outcomes of improved health and quality of life. Not only does fee-for-service drive up the volume of care but it also rewards the delivery of high-cost services, regardless of whether those services provide what is best for the patient.
During the previous administration, Secretary of Health and Human Services Sylvia Mathews Burwell set goals for moving away from fee-for-service in Medicare and in the health system more broadly. Congress also passed legislation that provides incentives for Medicare providers to transition away from fee-for-service with the Medicare Access and CHIP Reauthorization Act of 2015 (MACRA). While fee-for-service remains the predominant form of payment for many physicians, value-based payment arrangements are gaining a toehold. In 2014, 86% of physicians reported working in a practice receiving fee-for-service. Those fees accounted for nearly 72% of revenue.5 This percentage likely will continue to decrease over the next few years as government and private payers seek to promote value-based payment systems.
Assessing quality
“Value” in the context of health care is often defined as quality or outcomes relative to costs.6 Before payers can reward value, there must be measurement of performance to determine the quality of care being delivered. Quality measures are tools to help quantify access to care, processes, outcomes, patient experience, and organizational structure within the health care system. ObGyns likely encounter process, outcome, and patient experience measures most frequently in their practice.
Although outcome measures are generally held as the gold standard for quality measurement, they are often hard to obtain—either because of issues of temporality and rarity of events or because the data are hard to capture through existing formats. In lieu of measuring outcomes, process measures are often used to determine whether certain services that are known to be tied to desired health outcomes were delivered. Patient experience measures are also rising in popularity and are seen as a critical tool to ensuring that care that purports to be patient-centered actually is so.
Measures are specified to different levels of accountability, ranging from the individual physician all the way to the population. Some measures also can be specified at multiple levels. One major concern is the problem of attribution—that is, the difficulty of assigning who is primarily responsible for a specific quality metric result. Because obstetrics and gynecology is an increasingly team-based specialty, the American College of Obstetricians and Gynecologists (ACOG) recommends that measures that are used to reward or penalize providers should reflect performance at the care team or practice level, not at the individual physician or health care provider level.7 As consolidation of providers continues, it is expected that team-based care will increase and that the use of advanced practice providers will increase.8
Data to determine performance can come from a variety of sources, including claims, electronic health records (EHRs), paper medical record abstraction, birth certificates, registries, surveys, and separate reporting mechanisms. There are pros and cons of these various sources. Because administrative claims data are so easily obtainable, many measures have been developed based on this data source, but there are significant limitations to assessments made with such data. These limitations include inherent problems with translating clinical diagnoses into specific codes and inadequate documentation to support particular diagnoses and procedure codes.9 Claims data are limited by what physicians and other health care providers code for in their claims, making proper coding an essential skill for ObGyns to master.
Although there has been an increase in measures that rely on clinical data found in EHRs and registries—which are more robust and capture a wider breadth of indicators—claims-based measures still form the basis for many reporting programs because of standardization and ease of access to data. Data quality will become increasingly more important in a value-based payment world because completeness, risk adjustment, and specificity will be determined by the data recorded. This need for data quality will require that improvements be made in the user interface of EHRs and that providers pay specific attention to making sure their documentation is complete. New designs for EHRs should assist in that task, and data extraction should become a by-product of documentation.10
Read about alternative payment models and how ObGyns can succeed.
Paying for value
In an attempt to move away from fee-for-service medicine, payers and employers are adopting alternative payment models (APMs) that are intended to reward physicians and other health care providers for delivering value. Although APMs can be a catchall term, the Health Care Payment Learning and Action Network (LAN), a multi-stakeholder collaborative convened by the US Centers for Medicare & Medicaid Services, has laid out a framework for the different types of APMs11 (FIGURE). This framework provides a common reference point for concepts related to value-based care.
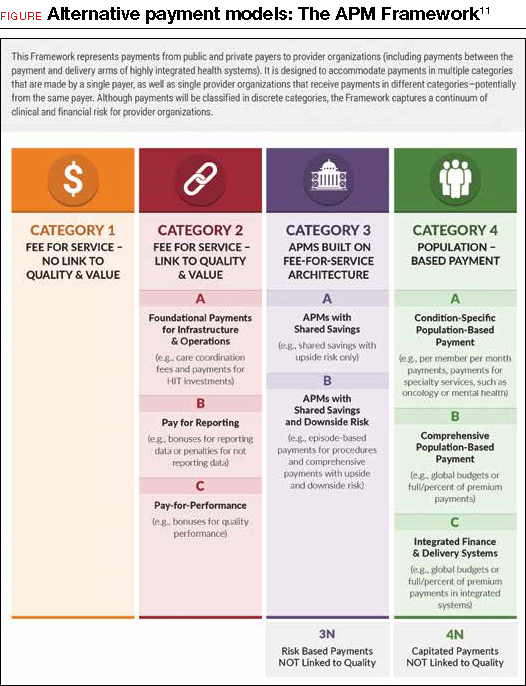
Although ACOG does not endorse all the concepts and principles included in the LAN white paper, it does support moving away from fee-for-service payments that lack any link to quality or outcomes. Originally, the LAN envisioned that all physicians, providers, and hospital systems would move in the direction of adopting Category 4 APMs, but in the recent “refresh” of the LAN’s white paper, the authors recognized that not all entities will be able to move toward population-based payments—nor will it be beneficial for all providers to do so. ACOG agrees that not all ObGyns will be able to thrive under population-based payments, so we must lead the way in developing models and measures that appropriately assess value in the care that ObGyns provide.
ACOG has undertaken its first foray into value-based payments by developing an “episode group” related to benign hysterectomy, with attendant quality measures. (An episode group is a collection of services associated with treating a condition or performing a procedure that are both clinically and temporally related.) The goal in creating episode groups is to create alignment across payers so that ObGyns are not faced with multitudinous payer-specific metrics and reporting requirements. As the benign hysterectomy episode group is refined and adopted by payers, ACOG plans to expand to other treatments and, eventually, develop condition-based episode groups that incentivize the most appropriate treatment options for patients.
Current forms of APMs are mostly Category 2 and 3 models. Rates of proper screening for cervical and breast cancer have been used as performance metrics for bonus payments. Major payers have pushed specific metrics as cutoffs for limiting narrow networks.12 For example, Covered California, the state health care exchange, has set a nulliparous term singleton vertex cesarean rate of 23.9% by 2018 as a necessary standard for inclusion of a hospital’s entire services (obstetric and nonobstetric) in their network. Episode group payments for total obstetric care included in the episode routine services, such as ultrasonography, have been previously utilized to discourage overutilization.
Such payment incentives can lead to underutilization of resources, however, which might lead to poorer outcomes and therefore result in overall greater cost. For example, poor screening for fetal anomalies or poorly managed medical conditions such as diabetes can lead to markedly increased costs in neonatal management. Therefore, some authorities have proposed tying incentives for obstetric care to performance outcome measures in neonatal care as a method of finding “sweet spots” for utilization of complex services and episode groups. Such models will depend on more robust clinical information sources and standardization.8
How can ObGyns succeed?
So what does success look like under these value-based payments for ObGyns? This is new territory, in a rapidly changing environment in which providers who flourished under the fee-for-service system will only survive under the new system if they become knowledgeable about the nuances of the new payment methods. Providers should understand that success is going to be defined as reaching the “Triple Aim”13 of improving the health of the population, containing costs, and improving the experience of health care.
Practice patient-centered care. One way to better position yourself is to focus on delivering patient-centered care and improving customer service in your practice. By implementing patient satisfaction surveys, you can identify where you are most vulnerable. One option is to utilize the Consumer Assessment of Healthcare Providers and Systems Clinician and Group Survey, developed by the US Department of Health and Human Services’ Agency for Healthcare Research & Quality. However, there are other assessment tools available, and you should investigate what works best for your practice.
Code properly. Another key to making sure you are in an optimal position is to properly document and code the services you deliver. Accurately capturing the clinical complexity of your patients will help down the road with risk adjustment and risk stratification for cost and quality measures. Many payment models, including episode groups, are built on the fee-for-service system, so coding for services is still important in the transition to alternative models. Modern EHRs are building new tools to assist clinician documentation, such as tools that aid coding. Carefully groomed and up-to-date problem lists can help providers keep track of appropriate testing and screening by enabling decision support tools that are imbedded in the systems. Although upgrading can be expensive, especially for small group practices, the development of “software as a service” or cloud-based EHRs will likely drive individual costs down.10
One example of point-of-care decision support that ACOG is spearheading to support our Fellows is the ACOG Prenatal Record (APR) by Dorsata.14 The APR is an application designed by ObGyns to work seamlessly with an existing EHR system to improve clinical workflow, save time, and help ObGyns support high-quality prenatal outcomes. The APR uses the same simplicity, flexibility, and familiarity of the original paper-based flowsheet, but in an electronic format to integrate ACOG guidance, which provides a more robust solution. The APR uses information such as gestational age, pregnancy history, the problem list, and other risk factors to provide patient and visit-specific care plans based on ACOG clinical practice guidelines. It was designed to help reduce physician burden by creating an easy-to-navigate electronic flowsheet that provides everything ObGyns need to know about each patient, succinctly captured in a single view.
ACOG also offers comprehensive coding workshops across the country and webinars on special coding topics to help Fellows learn to properly code their services. Availing yourself of these educational opportunities now so that you are better prepared to transition to value-based payment is a great way to ensure success in the future.
Chances are that some of your payers are already requiring you to report on metrics or tracking your performance using claims data. Pay attention to the performance measures that you are being held accountable for by payers when you review your payer contracts. Make sure you understand how your patients may fall into and out of the measure numerators and denominators. Ask yourself whether these metrics are ones that you can reasonably influence and that are within your control.
Of course, you can also reach out to ACOG for help. We are here to educate, inform, and guide you on these changes and provide assistance to ensure your success. Send inquiries to: [email protected].
Share your thoughts! Send your Letter to the Editor to [email protected]. Please include your name and the city and state in which you practice.
- The World Bank. Health expenditure per capita (current US $). 2017. http://data.worldbank.org/indicator/SH.XPD.PCAP?year_high_desc=true. Accessed December 4, 2017.
- Gonzales S, Sawyer B. How does U.S. life expectancy compare to other countries? Peterson Center on Healthcare and the Kaiser Family Foundation. 2017. http://www.healthsystemtracker.org/chart-collection/u-s-life-expectancy-compare-countries/?_sf_s=life#item-start. Accessed December 4, 2017.
- World Health Organization. Trends in maternal mortality: 1990 to 2015: Estimates by WHO, UNICEF, UNFPA, World Bank Group and the United Nations Population Division. http://apps.who.int/iris/bitstream/10665/194254/1/9789241565141_eng.pdf?ua=1. Accessed December 4, 2017.
- MacDorman MF, Mathews TJ, Mohangoo AD, Zeitlin J. International comparisons of infant mortality and related factors: United States and Europe, 2010. Natl Vital Stat Rep. 2014;63(5):1-6.
- Kane, CK. American Medical Association Policy Research Perspectives. Payment and delivery in 2014: The prevalence of new models reported by physicians. 2015. https://www.ama-assn.org/sites/default/files/media-browser/member/health-policy/practicepay-prp2015_0.pdf. Accessed December 4, 2017.
- Porter ME. What is value in health care? N Engl J Med. 2010;363(26):2477-2481.
- Task Force on Collaborative Practice. Collaboration in practice: Implementing team-based care. Washington, DC: American College of Obstetricians and Gynecologists. 2016. https://www.acog.org/Resources-And-Publications/Task-Force-and-Work-Group-Reports/Collaboration-in-Practice-Implementing-Team-Based-Care. Accessed December 4, 2017.
- Lagrew DC Jr, Jenkins TR. The future of obstetrics/gynecology in 2020: a clearer vision: finding true north and the forces of change. Am J Obstet Gynecol. 2014;211(6):617-622.
- Riley GF. Administrative and claims records as sources of health care cost data. Med Care. 2009;47(7 suppl 1):S51-S55.
- Lagrew DC Jr, Jenkins TR. The future of obstetrics/gynecology in 2020: a clearer vision. Transformational forces and thriving in the new system. Am J Obstet Gynecol. 2015;212(1):28-33.
- US Centers for Medicare & Medicaid Services. Health Care Payment Learning and Action Network. Alternative Payment Models (APM) Framework. 2017. https://innovation.cms.gov/initiatives/Health-Care-Payment-Learning-and-Action-Network/. Accessed December 4, 2017.
- Morse S. Covered California will exclude hospitals with high rates of C-sections. Healthcare Finance. 2016. http://www.healthcarefinancenews.com/news/covered-california-will-exclude-hospitals-high-rates-c-sections. Accessed December 4, 2017.
- Institute for Healthcare Improvement. The IHI Triple Aim. 2017. http://www.ihi.org/engage/initiatives/TripleAim/Pages/default.aspx. Accessed December 4, 2017.
- A pregnancy app for your EHR. 2017. https://www.dorsata.com/. Accessed December 4, 2017.
For ObGyns to be successful, understanding the basics of quality and cost measurement is essential, along with devoting more attention to what they are being evaluated on and held accountable for. But how will ObGyns be impacted by the push to incentivize them for delivering value in their work?
Although much of health care policy has become politically divisive lately, one area of agreement is that, in the United States, we have unsustainable health costs and the exorbitant amount our country pays for health care does not translate to improved outcomes. The United States spends more than most other developed nations on health care (roughly, $9,403 per capita in 2014) but has some of the lowest life expectancies, along with the highest maternal and infant mortality rates, compared with peer nations.1–4
One of the key culprits in our health system’s inefficiencies is the fee-for-service payment model. Fee-for-service incentivizes the delivery of a high volume of care without any way to determine whether that care is achieving the desired outcomes of improved health and quality of life. Not only does fee-for-service drive up the volume of care but it also rewards the delivery of high-cost services, regardless of whether those services provide what is best for the patient.
During the previous administration, Secretary of Health and Human Services Sylvia Mathews Burwell set goals for moving away from fee-for-service in Medicare and in the health system more broadly. Congress also passed legislation that provides incentives for Medicare providers to transition away from fee-for-service with the Medicare Access and CHIP Reauthorization Act of 2015 (MACRA). While fee-for-service remains the predominant form of payment for many physicians, value-based payment arrangements are gaining a toehold. In 2014, 86% of physicians reported working in a practice receiving fee-for-service. Those fees accounted for nearly 72% of revenue.5 This percentage likely will continue to decrease over the next few years as government and private payers seek to promote value-based payment systems.
Assessing quality
“Value” in the context of health care is often defined as quality or outcomes relative to costs.6 Before payers can reward value, there must be measurement of performance to determine the quality of care being delivered. Quality measures are tools to help quantify access to care, processes, outcomes, patient experience, and organizational structure within the health care system. ObGyns likely encounter process, outcome, and patient experience measures most frequently in their practice.
Although outcome measures are generally held as the gold standard for quality measurement, they are often hard to obtain—either because of issues of temporality and rarity of events or because the data are hard to capture through existing formats. In lieu of measuring outcomes, process measures are often used to determine whether certain services that are known to be tied to desired health outcomes were delivered. Patient experience measures are also rising in popularity and are seen as a critical tool to ensuring that care that purports to be patient-centered actually is so.
Measures are specified to different levels of accountability, ranging from the individual physician all the way to the population. Some measures also can be specified at multiple levels. One major concern is the problem of attribution—that is, the difficulty of assigning who is primarily responsible for a specific quality metric result. Because obstetrics and gynecology is an increasingly team-based specialty, the American College of Obstetricians and Gynecologists (ACOG) recommends that measures that are used to reward or penalize providers should reflect performance at the care team or practice level, not at the individual physician or health care provider level.7 As consolidation of providers continues, it is expected that team-based care will increase and that the use of advanced practice providers will increase.8
Data to determine performance can come from a variety of sources, including claims, electronic health records (EHRs), paper medical record abstraction, birth certificates, registries, surveys, and separate reporting mechanisms. There are pros and cons of these various sources. Because administrative claims data are so easily obtainable, many measures have been developed based on this data source, but there are significant limitations to assessments made with such data. These limitations include inherent problems with translating clinical diagnoses into specific codes and inadequate documentation to support particular diagnoses and procedure codes.9 Claims data are limited by what physicians and other health care providers code for in their claims, making proper coding an essential skill for ObGyns to master.
Although there has been an increase in measures that rely on clinical data found in EHRs and registries—which are more robust and capture a wider breadth of indicators—claims-based measures still form the basis for many reporting programs because of standardization and ease of access to data. Data quality will become increasingly more important in a value-based payment world because completeness, risk adjustment, and specificity will be determined by the data recorded. This need for data quality will require that improvements be made in the user interface of EHRs and that providers pay specific attention to making sure their documentation is complete. New designs for EHRs should assist in that task, and data extraction should become a by-product of documentation.10
Read about alternative payment models and how ObGyns can succeed.
Paying for value
In an attempt to move away from fee-for-service medicine, payers and employers are adopting alternative payment models (APMs) that are intended to reward physicians and other health care providers for delivering value. Although APMs can be a catchall term, the Health Care Payment Learning and Action Network (LAN), a multi-stakeholder collaborative convened by the US Centers for Medicare & Medicaid Services, has laid out a framework for the different types of APMs11 (FIGURE). This framework provides a common reference point for concepts related to value-based care.
Although ACOG does not endorse all the concepts and principles included in the LAN white paper, it does support moving away from fee-for-service payments that lack any link to quality or outcomes. Originally, the LAN envisioned that all physicians, providers, and hospital systems would move in the direction of adopting Category 4 APMs, but in the recent “refresh” of the LAN’s white paper, the authors recognized that not all entities will be able to move toward population-based payments—nor will it be beneficial for all providers to do so. ACOG agrees that not all ObGyns will be able to thrive under population-based payments, so we must lead the way in developing models and measures that appropriately assess value in the care that ObGyns provide.
ACOG has undertaken its first foray into value-based payments by developing an “episode group” related to benign hysterectomy, with attendant quality measures. (An episode group is a collection of services associated with treating a condition or performing a procedure that are both clinically and temporally related.) The goal in creating episode groups is to create alignment across payers so that ObGyns are not faced with multitudinous payer-specific metrics and reporting requirements. As the benign hysterectomy episode group is refined and adopted by payers, ACOG plans to expand to other treatments and, eventually, develop condition-based episode groups that incentivize the most appropriate treatment options for patients.
Current forms of APMs are mostly Category 2 and 3 models. Rates of proper screening for cervical and breast cancer have been used as performance metrics for bonus payments. Major payers have pushed specific metrics as cutoffs for limiting narrow networks.12 For example, Covered California, the state health care exchange, has set a nulliparous term singleton vertex cesarean rate of 23.9% by 2018 as a necessary standard for inclusion of a hospital’s entire services (obstetric and nonobstetric) in their network. Episode group payments for total obstetric care included in the episode routine services, such as ultrasonography, have been previously utilized to discourage overutilization.
Such payment incentives can lead to underutilization of resources, however, which might lead to poorer outcomes and therefore result in overall greater cost. For example, poor screening for fetal anomalies or poorly managed medical conditions such as diabetes can lead to markedly increased costs in neonatal management. Therefore, some authorities have proposed tying incentives for obstetric care to performance outcome measures in neonatal care as a method of finding “sweet spots” for utilization of complex services and episode groups. Such models will depend on more robust clinical information sources and standardization.8
How can ObGyns succeed?
So what does success look like under these value-based payments for ObGyns? This is new territory, in a rapidly changing environment in which providers who flourished under the fee-for-service system will only survive under the new system if they become knowledgeable about the nuances of the new payment methods. Providers should understand that success is going to be defined as reaching the “Triple Aim”13 of improving the health of the population, containing costs, and improving the experience of health care.
Practice patient-centered care. One way to better position yourself is to focus on delivering patient-centered care and improving customer service in your practice. By implementing patient satisfaction surveys, you can identify where you are most vulnerable. One option is to utilize the Consumer Assessment of Healthcare Providers and Systems Clinician and Group Survey, developed by the US Department of Health and Human Services’ Agency for Healthcare Research & Quality. However, there are other assessment tools available, and you should investigate what works best for your practice.
Code properly. Another key to making sure you are in an optimal position is to properly document and code the services you deliver. Accurately capturing the clinical complexity of your patients will help down the road with risk adjustment and risk stratification for cost and quality measures. Many payment models, including episode groups, are built on the fee-for-service system, so coding for services is still important in the transition to alternative models. Modern EHRs are building new tools to assist clinician documentation, such as tools that aid coding. Carefully groomed and up-to-date problem lists can help providers keep track of appropriate testing and screening by enabling decision support tools that are imbedded in the systems. Although upgrading can be expensive, especially for small group practices, the development of “software as a service” or cloud-based EHRs will likely drive individual costs down.10
One example of point-of-care decision support that ACOG is spearheading to support our Fellows is the ACOG Prenatal Record (APR) by Dorsata.14 The APR is an application designed by ObGyns to work seamlessly with an existing EHR system to improve clinical workflow, save time, and help ObGyns support high-quality prenatal outcomes. The APR uses the same simplicity, flexibility, and familiarity of the original paper-based flowsheet, but in an electronic format to integrate ACOG guidance, which provides a more robust solution. The APR uses information such as gestational age, pregnancy history, the problem list, and other risk factors to provide patient and visit-specific care plans based on ACOG clinical practice guidelines. It was designed to help reduce physician burden by creating an easy-to-navigate electronic flowsheet that provides everything ObGyns need to know about each patient, succinctly captured in a single view.
ACOG also offers comprehensive coding workshops across the country and webinars on special coding topics to help Fellows learn to properly code their services. Availing yourself of these educational opportunities now so that you are better prepared to transition to value-based payment is a great way to ensure success in the future.
Chances are that some of your payers are already requiring you to report on metrics or tracking your performance using claims data. Pay attention to the performance measures that you are being held accountable for by payers when you review your payer contracts. Make sure you understand how your patients may fall into and out of the measure numerators and denominators. Ask yourself whether these metrics are ones that you can reasonably influence and that are within your control.
Of course, you can also reach out to ACOG for help. We are here to educate, inform, and guide you on these changes and provide assistance to ensure your success. Send inquiries to: [email protected].
Share your thoughts! Send your Letter to the Editor to [email protected]. Please include your name and the city and state in which you practice.
- The World Bank. Health expenditure per capita (current US $). 2017. http://data.worldbank.org/indicator/SH.XPD.PCAP?year_high_desc=true. Accessed December 4, 2017.
- Gonzales S, Sawyer B. How does U.S. life expectancy compare to other countries? Peterson Center on Healthcare and the Kaiser Family Foundation. 2017. http://www.healthsystemtracker.org/chart-collection/u-s-life-expectancy-compare-countries/?_sf_s=life#item-start. Accessed December 4, 2017.
- World Health Organization. Trends in maternal mortality: 1990 to 2015: Estimates by WHO, UNICEF, UNFPA, World Bank Group and the United Nations Population Division. http://apps.who.int/iris/bitstream/10665/194254/1/9789241565141_eng.pdf?ua=1. Accessed December 4, 2017.
- MacDorman MF, Mathews TJ, Mohangoo AD, Zeitlin J. International comparisons of infant mortality and related factors: United States and Europe, 2010. Natl Vital Stat Rep. 2014;63(5):1-6.
- Kane, CK. American Medical Association Policy Research Perspectives. Payment and delivery in 2014: The prevalence of new models reported by physicians. 2015. https://www.ama-assn.org/sites/default/files/media-browser/member/health-policy/practicepay-prp2015_0.pdf. Accessed December 4, 2017.
- Porter ME. What is value in health care? N Engl J Med. 2010;363(26):2477-2481.
- Task Force on Collaborative Practice. Collaboration in practice: Implementing team-based care. Washington, DC: American College of Obstetricians and Gynecologists. 2016. https://www.acog.org/Resources-And-Publications/Task-Force-and-Work-Group-Reports/Collaboration-in-Practice-Implementing-Team-Based-Care. Accessed December 4, 2017.
- Lagrew DC Jr, Jenkins TR. The future of obstetrics/gynecology in 2020: a clearer vision: finding true north and the forces of change. Am J Obstet Gynecol. 2014;211(6):617-622.
- Riley GF. Administrative and claims records as sources of health care cost data. Med Care. 2009;47(7 suppl 1):S51-S55.
- Lagrew DC Jr, Jenkins TR. The future of obstetrics/gynecology in 2020: a clearer vision. Transformational forces and thriving in the new system. Am J Obstet Gynecol. 2015;212(1):28-33.
- US Centers for Medicare & Medicaid Services. Health Care Payment Learning and Action Network. Alternative Payment Models (APM) Framework. 2017. https://innovation.cms.gov/initiatives/Health-Care-Payment-Learning-and-Action-Network/. Accessed December 4, 2017.
- Morse S. Covered California will exclude hospitals with high rates of C-sections. Healthcare Finance. 2016. http://www.healthcarefinancenews.com/news/covered-california-will-exclude-hospitals-high-rates-c-sections. Accessed December 4, 2017.
- Institute for Healthcare Improvement. The IHI Triple Aim. 2017. http://www.ihi.org/engage/initiatives/TripleAim/Pages/default.aspx. Accessed December 4, 2017.
- A pregnancy app for your EHR. 2017. https://www.dorsata.com/. Accessed December 4, 2017.
Read all parts of this series
PART 1 Value-based payment: What does it mean and how can ObGyns get out ahead
PART 2 What makes a “quality” quality measure?
PART 3 The role of patient-reported outcomes in women’s health
PART 4 It costs what?! How we can educate residents and students on how much things cost
Topical fluorouracil reduces risk for surgery for SCC
in a population of high-risk older adults.
The findings were published online Jan. 3 in JAMA Dermatology.
Although topical fluorouracil can help reduce actinic keratoses and cure some superficial basal cell and squamous cell carcinomas, it has not been studied as a strategy to prevent the development of lesions that might require surgery, wrote Martin A. Weinstock, MD, PhD, of Providence (R.I.) Veterans Affairs Medical Center, and his colleagues (JAMA Dermatol. 2017 Jan 3. doi: 10.1001/jamadermatol.2017.3631).

Overall, 299 of the 932 participants developed a basal cell carcinoma and 108 developed an SCC over 4 years of follow-up (the median follow-up was 2.8 years). During the 4-year follow-up, no effect was seen on SCC or BCC.
But during the first year, significantly fewer participants in the fluorouracil group than in the control group developed an SCC (5 vs. 20), representing a 75% reduction in the risk of SCCs needing surgery (P = .002).
The number of participants who developed a BCC during the study period was not significantly different between the treatment and control groups (45 vs. 50). During the first year, the BCC risk was reduced by 11%, but it was not statistically significant.
Most patients in the treated group experienced erythema in the first 2 weeks, and more than half described adverse effects of treatment as severe (21%) or moderate (40%). But almost 90% said they would be willing to be treated again if the treatment was shown to reduce the risk of developing skin cancers, the authors wrote.
The study was limited by several factors including the potential unblinding of participants because of side effects and by the homogenous study population, the researchers noted. However, the results suggest the potential value of proactive topical treatment to reduce the need for surgery, they said. “It is reasonable at this point to consider the use of a standard and perhaps annual course of topical fluorouracil, 5%, to the face and ears for the reduction of SCC risk in high-risk populations, and potentially for a reduction in need for Mohs surgery; more detailed study could define precisely the groups that would most benefit,” they wrote.
Lead author Dr. Weinstock is employed by the dermatology practice affiliated with Brown University and is director of the dermatoepidemiology division at Brown. He disclosed serving as a consultant to AbbVie, Castle, and Celgene. Another author disclosed having received grant support from Pfizer for an independent research grant. The remaining 23 authors had no disclosures. The study was partly funded by the U.S. Department of Veterans Affairs.
SOURCE: Weinstock, M et al. JAMA Dermatol. 2017 Jan 3. doi: 10.1001/jamadermatol.2017.3631.
in a population of high-risk older adults.
The findings were published online Jan. 3 in JAMA Dermatology.
Although topical fluorouracil can help reduce actinic keratoses and cure some superficial basal cell and squamous cell carcinomas, it has not been studied as a strategy to prevent the development of lesions that might require surgery, wrote Martin A. Weinstock, MD, PhD, of Providence (R.I.) Veterans Affairs Medical Center, and his colleagues (JAMA Dermatol. 2017 Jan 3. doi: 10.1001/jamadermatol.2017.3631).
Overall, 299 of the 932 participants developed a basal cell carcinoma and 108 developed an SCC over 4 years of follow-up (the median follow-up was 2.8 years). During the 4-year follow-up, no effect was seen on SCC or BCC.
But during the first year, significantly fewer participants in the fluorouracil group than in the control group developed an SCC (5 vs. 20), representing a 75% reduction in the risk of SCCs needing surgery (P = .002).
The number of participants who developed a BCC during the study period was not significantly different between the treatment and control groups (45 vs. 50). During the first year, the BCC risk was reduced by 11%, but it was not statistically significant.
Most patients in the treated group experienced erythema in the first 2 weeks, and more than half described adverse effects of treatment as severe (21%) or moderate (40%). But almost 90% said they would be willing to be treated again if the treatment was shown to reduce the risk of developing skin cancers, the authors wrote.
The study was limited by several factors including the potential unblinding of participants because of side effects and by the homogenous study population, the researchers noted. However, the results suggest the potential value of proactive topical treatment to reduce the need for surgery, they said. “It is reasonable at this point to consider the use of a standard and perhaps annual course of topical fluorouracil, 5%, to the face and ears for the reduction of SCC risk in high-risk populations, and potentially for a reduction in need for Mohs surgery; more detailed study could define precisely the groups that would most benefit,” they wrote.
Lead author Dr. Weinstock is employed by the dermatology practice affiliated with Brown University and is director of the dermatoepidemiology division at Brown. He disclosed serving as a consultant to AbbVie, Castle, and Celgene. Another author disclosed having received grant support from Pfizer for an independent research grant. The remaining 23 authors had no disclosures. The study was partly funded by the U.S. Department of Veterans Affairs.
SOURCE: Weinstock, M et al. JAMA Dermatol. 2017 Jan 3. doi: 10.1001/jamadermatol.2017.3631.
FROM JAMA DERMATOLOGY
Key clinical point: Treatment with topical fluorouracil for 2-4 weeks significantly reduced the risk of squamous cell carcinoma in a high-risk population.
Major finding: After a year of treatment, topical fluorouracil reduced the risk of SCC that would need surgery by 75% compared with a placebo.
Data source: A randomized trial of 932 veterans, most of whom were male, at high risk for keratinocyte carcinoma.
Disclosures: Lead author Martin Weinstock, MD, has served as a consultant to AbbVie, Castle, and Celgene. Another author disclosed having received grant support from Pfizer for an independent research grant. The remaining 23 authors had no disclosures. The study was partly funded by the U.S. Department of Veterans Affairs.
Source: Weinstock, M et al. JAMA Dermatol. 2017 Jan 3; doi:10.1001/jamadermatol.2017.3631
Sorafenib plus chemo prolongs event-free survival in AML
ATLANTA – Adding the targeted agent sorafenib (Nexavar) to standard induction and consolidation chemotherapy in adults with acute myeloid leukemia (AML) significantly extended event-free survival out to more than 6 years and improved relapse-free survival, updated results from the SORAML trial showed.
At a median follow-up of 78 months, median event-free survival (EFS) – the primary endpoint – was 26 months in the chemotherapy plus sorafenib arm, compared with 9 months for chemotherapy plus placebo; these results translate to a hazard ratio for progression or death with sorafenib of 0.68 (P = .011), reported Christoph Röllig, MD, MSc, of University Hospital Carl Gustav Carus in Dresden, Germany.

Sorafenib is a multikinase inhibitor that blocks several cellular pathways that may be involved in leukemogenesis and AML maintenance. To see whether it could improve outcomes over standard chemotherapy alone, the SORAML investigators enrolled 267 patients who were aged 60 years or younger and had good performance status with newly diagnosed AML, irrespective of FLT3 mutational status.
In this phase 2 trial, patients were randomly assigned in a double-blinded fashion to standard chemotherapy plus either oral sorafenib 400 mg twice daily or placebo on days 10 through 19 of induction cycles 1 and 2, from day 8 of each consolidation cycles, and as maintenance for 12 months.
Chemotherapy consisted of two cycles of induction therapy with daunorubicin (60 mg/m2 on days 3-5) plus cytarabine (100 mg/m2 on days 1-7), followed by three cycles of high-dose cytarabine-based consolidation therapy (3 g/m2 twice daily on days 1, 3, and 5).
Intermediate-risk patients with a sibling donor and all high-risk patients with matched donors were scheduled for allogeneic stem cell transplantation in first remission.
The planned final analysis of the trial, reported in 2015, showed that, after a median follow-up of 36 months, the median EFS with sorafenib was 21 months, compared with 9 months for placebo. This difference translated into 3-year EFS rates of 40% vs. 22%, respectively (HR, 0.64; P = .013).
The overall survival (OS) analysis trended in favor of sorafenib at 3 years, but the difference was not statistically significant.
At ASH 2017, Dr. Röllig presented longer-term follow-up data and reported treatments after relapse (intensive versus palliative), remission rates, and survival outcomes. The primary endpoint of EFS continued to favor the sorafenib arm at 6.5 years’ median follow-up.
A multivariate analysis controlling for age, risk category, mutational status, lactate dehydrogenase levels, and secondary or treatment-related AML showed that the benefit of sorafenib was even stronger, with a HR of 0.614 for EFS with sorafenib, compared with EFS with placebo (P = .006). The targeted agent was also superior in patients stratified by risk category and in patients with NPM1 and FLT3-ITD mutations.
Relapse-free survival after 6.5 years was also better in the sorafenib arm, at a median of 63 months, than it was in the placebo arm, in which the median relapse-free survival was only 23 months (HR, 0.64; P = .035).
Following relapse, 73% of patients in the sorafenib arm and 82% of those in the placebo arm were treated with curative intent. Treatments consisted largely of salvage stem cell transplant (SCT) in 93% of this subgroup in the sorafenib arm and in 95% of those in the placebo arm. In each arm, the majority of patients were treated with human leukocyte antigen–identical SCT.
Patients in the sorafenib arm were more likely to require a second allogeneic SCT, which may be attributable to the fact that most patients in this group received their first SCT during the second complete remission, Dr. Röllig said.
Median overall survival from relapse at 6.5 years’ median follow-up was 10 months for patients treated with sorafenib, compared with 27 months for placebo, but this difference did not reach statistical significance.
OS at 6.5 years’ median follow-up had not been reached in the sorafenib arm, compared with 83 months for the placebo arm, translating into 4-year OS rates of 62% and 55%, respectively. The hazard ratio was 0.819 favoring sorafenib, but it was not statistically significant (P = .282).
During a question-and-answer session following the presentation, Farhad Ravandi-Kashani, MD, of the University of Texas MD Anderson Cancer Center in Houston asked why more patients in the placebo arm than in the sorafenib arm were treated after relapse with curative intent and whether there was any crossover to sorafenib at the time of salvage therapy, which could have confounded the results.
“The reasons why they had slightly less curative treatments in the sorafenib arm I can’t explain. There are no indicators; it could just be chance,” Dr. Röllig said.
Of the 30 patients in the sorafenib arm who relapsed, 2 received sorafenib in salvage therapy, but this was a matter of chance given that the treatment assignment was blinded to both physician and patient, he added.
The study was sponsored by the Technical University of Dresden and funded by Bayer. Dr. Röllig reported research funding from Bayer and Janssen; he also reported off-label use of sorafenib.
SOURCE: Röllig C et al. ASH 2017 Abstract 721.
ATLANTA – Adding the targeted agent sorafenib (Nexavar) to standard induction and consolidation chemotherapy in adults with acute myeloid leukemia (AML) significantly extended event-free survival out to more than 6 years and improved relapse-free survival, updated results from the SORAML trial showed.
At a median follow-up of 78 months, median event-free survival (EFS) – the primary endpoint – was 26 months in the chemotherapy plus sorafenib arm, compared with 9 months for chemotherapy plus placebo; these results translate to a hazard ratio for progression or death with sorafenib of 0.68 (P = .011), reported Christoph Röllig, MD, MSc, of University Hospital Carl Gustav Carus in Dresden, Germany.
Sorafenib is a multikinase inhibitor that blocks several cellular pathways that may be involved in leukemogenesis and AML maintenance. To see whether it could improve outcomes over standard chemotherapy alone, the SORAML investigators enrolled 267 patients who were aged 60 years or younger and had good performance status with newly diagnosed AML, irrespective of FLT3 mutational status.
In this phase 2 trial, patients were randomly assigned in a double-blinded fashion to standard chemotherapy plus either oral sorafenib 400 mg twice daily or placebo on days 10 through 19 of induction cycles 1 and 2, from day 8 of each consolidation cycles, and as maintenance for 12 months.
Chemotherapy consisted of two cycles of induction therapy with daunorubicin (60 mg/m2 on days 3-5) plus cytarabine (100 mg/m2 on days 1-7), followed by three cycles of high-dose cytarabine-based consolidation therapy (3 g/m2 twice daily on days 1, 3, and 5).
Intermediate-risk patients with a sibling donor and all high-risk patients with matched donors were scheduled for allogeneic stem cell transplantation in first remission.
The planned final analysis of the trial, reported in 2015, showed that, after a median follow-up of 36 months, the median EFS with sorafenib was 21 months, compared with 9 months for placebo. This difference translated into 3-year EFS rates of 40% vs. 22%, respectively (HR, 0.64; P = .013).
The overall survival (OS) analysis trended in favor of sorafenib at 3 years, but the difference was not statistically significant.
At ASH 2017, Dr. Röllig presented longer-term follow-up data and reported treatments after relapse (intensive versus palliative), remission rates, and survival outcomes. The primary endpoint of EFS continued to favor the sorafenib arm at 6.5 years’ median follow-up.
A multivariate analysis controlling for age, risk category, mutational status, lactate dehydrogenase levels, and secondary or treatment-related AML showed that the benefit of sorafenib was even stronger, with a HR of 0.614 for EFS with sorafenib, compared with EFS with placebo (P = .006). The targeted agent was also superior in patients stratified by risk category and in patients with NPM1 and FLT3-ITD mutations.
Relapse-free survival after 6.5 years was also better in the sorafenib arm, at a median of 63 months, than it was in the placebo arm, in which the median relapse-free survival was only 23 months (HR, 0.64; P = .035).
Following relapse, 73% of patients in the sorafenib arm and 82% of those in the placebo arm were treated with curative intent. Treatments consisted largely of salvage stem cell transplant (SCT) in 93% of this subgroup in the sorafenib arm and in 95% of those in the placebo arm. In each arm, the majority of patients were treated with human leukocyte antigen–identical SCT.
Patients in the sorafenib arm were more likely to require a second allogeneic SCT, which may be attributable to the fact that most patients in this group received their first SCT during the second complete remission, Dr. Röllig said.
Median overall survival from relapse at 6.5 years’ median follow-up was 10 months for patients treated with sorafenib, compared with 27 months for placebo, but this difference did not reach statistical significance.
OS at 6.5 years’ median follow-up had not been reached in the sorafenib arm, compared with 83 months for the placebo arm, translating into 4-year OS rates of 62% and 55%, respectively. The hazard ratio was 0.819 favoring sorafenib, but it was not statistically significant (P = .282).
During a question-and-answer session following the presentation, Farhad Ravandi-Kashani, MD, of the University of Texas MD Anderson Cancer Center in Houston asked why more patients in the placebo arm than in the sorafenib arm were treated after relapse with curative intent and whether there was any crossover to sorafenib at the time of salvage therapy, which could have confounded the results.
“The reasons why they had slightly less curative treatments in the sorafenib arm I can’t explain. There are no indicators; it could just be chance,” Dr. Röllig said.
Of the 30 patients in the sorafenib arm who relapsed, 2 received sorafenib in salvage therapy, but this was a matter of chance given that the treatment assignment was blinded to both physician and patient, he added.
The study was sponsored by the Technical University of Dresden and funded by Bayer. Dr. Röllig reported research funding from Bayer and Janssen; he also reported off-label use of sorafenib.
SOURCE: Röllig C et al. ASH 2017 Abstract 721.
REPORTING FROM ASH 2017
Key clinical point:
Major finding: At a median of 6.5 years, the hazard ratio for progression or death with sorafenib plus chemotherapy versus placebo plus chemotherapy was 0.68 (P = .011).
Data source: Randomized, double-blind, phase 2 trial comprising 267 patients with de novo AML.
Disclosures: The study was sponsored by the Technical University of Dresden and funded by Bayer. Dr. Röllig reported research funding from Bayer and from Janssen; he also reported off-label use of sorafenib.
Source: Röllig C et al. ASH 2017 Abstract 721.
Trial updates will help tailor endocrine therapy for premenopausal breast cancer
SAN ANTONIO – Adjuvant endocrine therapies improve outcomes of premenopausal breast cancer in the long term, with absolute benefit varying somewhat by therapy and by patient and disease characteristics, according to planned updates of a pair of pivotal phase 3 trials.
The trials – TEXT (Tamoxifen and Exemestane Trial) and SOFT (Suppression of Ovarian Function Trial) – are coordinated by the International Breast Cancer Study Group and together randomized more than 5,000 premenopausal women with early hormone receptor–positive breast cancer to 5 years of various types of adjuvant endocrine therapy. Their initial results, reported several years ago, form part of treatment guidelines that are used worldwide.

Relative benefits for various outcomes were generally similar across subgroups, but absolute benefits were greater for women having certain features increasing risk for poor outcomes.
Clinical implications
These updates, along with other emerging data, can be used to optimize endocrine therapy for younger women with breast cancer, according to invited discussant Ann H. Partridge, MD, of Dana Farber Cancer Institute in Boston.
“For higher-risk disease, we should be considering OFS. At this point in time, I don’t think HER2 status alone should drive this decision,” she commented. “If you are getting OFS, what do we do, AI versus tamoxifen? Well, we do see a large improvement in disease-free survival [with AIs], so many women will want to use AIs. Yet tamoxifen is still reasonable, especially in light of the survival data.”
Data on switch strategies and extended-duration therapy are generally lacking at present for the premenopausal population, Dr. Partridge noted. “That’s something that we still need to extrapolate from data that’s predominantly in postmenopausal women.”
Another compelling question is whether OFS can be used instead of chemo for some patients. “We are increasingly recognizing that women with higher-risk anatomy and lower-risk biology having endocrine-responsive tumors may get more bang for the buck from the optimizing of hormonal therapy, and chemo may not add much,” she said.
Both short- and long-term toxicities of the various endocrine therapies and, for aromatase inhibitors, the potential for breakthrough (return of estradiol levels to premenopausal levels) also need to be considered, Dr. Partridge stressed. “And ultimately, patient preference and tolerance are key. After all, the best treatment is the one the patient will take.”
“We need to follow these women on TEXT and SOFT very long term. It would be a crime not to follow these women further out,” she maintained. “We need to conduct real-world comparative effectiveness research to understand the risks and benefits of OFS more fully in our survivors. Then, as we start to suppress more ovaries in more women with breast cancer, we need to be aware clinically of these risks, and we need to share this awareness with their primary care providers because we need to optimize in particular their cardiovascular risk factors, and screen and treat for potential comorbidities that they may be at higher risk for.”
Joint TEXT and SOFT update
Initial results of the joint TEXT and SOFT analysis, reported after a median follow-up of 5.7 years, showed that exemestane plus OFS was superior to tamoxifen plus OFS for the primary outcome, providing a significant 3.8% absolute gain in 5-year disease-free survival (N Engl J Med. 2014;371:107-18).
The updated joint analysis, now with a median follow-up of 9 years and based on data from 4,690 women, showed that the 8-year rate of disease-free survival was 86.8% with exemestane plus OFS versus 82.8% with tamoxifen plus OFS (hazard ratio, 0.77; P = .0006), for a similar absolute benefit of 4.0%, reported Prudence Francis, MD, of the University of Melbourne, head of Medical Oncology in the Breast Service at the Peter MacCallum Cancer Centre, Melbourne.
In stratified analysis, absolute benefit tended to be greater among women in TEXT who received chemotherapy (6.0%); intermediate among women in TEXT who did not receive chemotherapy (3.7%) and women in SOFT who received prior chemotherapy (3.7%); and less among women in SOFT who did not receive chemotherapy (1.9%).
Exemestane plus OFS was also superior to tamoxifen plus OFS in terms of breast cancer–free interval, with an absolute 4.1% benefit (P = .0002), and distant recurrence–free interval, with an absolute 2.1% benefit (P = .02). Overall survival did not differ significantly between arms.
Among the 86% of patients with HER2-negative disease, exemestane plus OFS netted an absolute disease-free survival gain of 5.4% and an absolute distant recurrence–free interval gain of 3.4%. There was a consistent relative treatment benefit across subgroups, but larger absolute benefit, on the order of 5%-9%, in women given chemotherapy and in those younger than 35 years.
“Results for the HER2-positive subgroup require further investigation,” Dr. Francis said. “The trials enrolled both before and after the routine use of adjuvant trastuzumab, and a significant proportion of the patients with HER2-positive breast cancer did not receive adjuvant HER2-targeted therapy.”
In the entire joint-analysis population, exemestane plus OFS was associated with higher rates of musculoskeletal events of grade 3 or 4 (11% vs. 6%) and osteoporosis of grade 2-4 (15% vs. 7%), while tamoxifen plus OFS was associated with a higher rate of thrombosis/embolism of grade 2-4 (2.3% vs. 1.2%) and more cases of endometrial cancer (9 vs. 4 cases). At 4 years, early discontinuation of oral endocrine therapy was greater for exemestane than for tamoxifen (25% vs. 19%).
“After longer follow-up, with a median of 9 years, the combined analysis results confirm a statistically significant improvement in disease outcomes with exemestane plus ovarian suppression. As is critical given the long natural history of estrogen receptor–positive breast cancer, follow-up in these trials is currently continuing,” Dr. Francis summarized.
“To optimally translate the observed absolute trial improvements into clinical practice, oncologists need to discuss and weigh the potential benefits and toxicities in each individual patient who is premenopausal with hormone receptor–positive breast cancer,” she recommended.
Session attendee Hope S. Rugo, MD, of the University of California, San Francisco, Helen Diller Family Comprehensive Cancer Center, noted that exemestane had superior benefit despite the 25% rate of early discontinuation. “I wonder if one of the interpretations of that, given the toxicity of this therapy for very young women, is that we need some but maybe not so much. Maybe they don’t need 5 years altogether,” she said.
“The fact that they stopped their assigned endocrine therapy doesn’t mean that they didn’t continue any therapy. They may have switched over to tamoxifen or they may have decided they wanted to have a baby or there may have been many other things,” Dr. Francis replied, noting that analyses sorting out the reasons for early discontinuation are planned.
Session attendee Mark E. Sherman, MD, of the Mayo Clinic, Jacksonville, Fla., asked, “Do you have any ability to test for tamoxifen metabolites? It’s possible that a third to a half of patients got reduced benefit from that drug.”
Banked samples are available and a substudy is planned, according to Dr. Francis. “We haven’t got data on that yet, but yes, we are analyzing that.”
SOFT update
Initial results of the SOFT trial, reported after a median follow-up of 5.6 years, showed that adding OFS to tamoxifen did not significantly improve disease-free survival over tamoxifen alone in the entire trial population (N Engl J Med. 2015;372:436-46). However, there was benefit for women who received chemotherapy and remained premenopausal.
The updated SOFT analysis, now with a median follow-up of 8 years, focused mainly on the 1,018 women given tamoxifen alone and the 1,015 women given tamoxifen plus OFS. (Another 1,014 women were given exemestane plus OFS.)
“SOFT is now positive for its primary endpoint,” reported first author Gini Fleming, MD, director of the Medical Oncology Breast Program and medical oncology director of Gynecologic Oncology at University of Chicago Medicine. The 8-year disease-free survival rate was 83.2% with tamoxifen plus OFS, compared with 78.9% with tamoxifen alone (HR, 0.76; P = .009), corresponding to a 4.2% gain in this outcome. The relative benefit was identical whether patients had received chemotherapy or not, but absolute benefit was greater for those who had (5.3%), as well as for patients younger than 35 years (8.7%).
In addition, exemestane plus OFS was superior to tamoxifen alone (85.9% vs. 78.9%; HR, 0.65), with an absolute benefit of 7.0%. Again, absolute benefit was more pronounced among women who had received prior chemotherapy (9.0%) or were younger than 35 years (13.1%).
The relative disease-free survival benefit of tamoxifen plus OFS over tamoxifen alone was similar across most subgroups stratified by disease characteristics, but patients with HER2-positive disease derived greater relative benefit from the combination as compared with their HER2-negative counterparts (P = .04 for interaction). “When we look at the combination of exemestane plus OFS versus tamoxifen, this heterogeneity is no longer seen,” Dr. Fleming noted.
In the entire trial population, there was no significant benefit of tamoxifen plus OFS over tamoxifen alone for distant recurrence-free interval and a small, significant absolute 1.9% gain in overall survival.
“The cohort who had elected to receive no prior chemotherapy did exceedingly well regardless of therapy,” she said, with little difference in overall survival across the three arms. “There were only 24 deaths total in this cohort, and 12 of those deaths were in the setting of no distant recurrence.”
On the other hand, among the women who received chemotherapy, there were significant absolute overall survival benefits of 4.3% with tamoxifen plus OFS and 2.1% with exemestane plus OFS, over tamoxifen alone. “This late emergence of an overall survival benefit is consistent with the time course of events in estrogen receptor–positive breast cancer,” Dr. Fleming commented.
The proportion of patients who stopped their oral endocrine therapy early was 22.5% with tamoxifen alone and 18.5% with tamoxifen plus OFS. (It was 27.8% with exemestane plus OFS.) “Almost a quarter of the patients on either tamoxifen arm were using extended oral endocrine therapy at 6 years or later prior to any disease progression. Only about 12% of patients in the exemestane group were doing so,” she noted.
There were more cases of endometrial cancer with tamoxifen alone than with tamoxifen plus OFS (7 vs. 4 cases). Thrombosis/embolism of grade 2-4 occurred in 2.2% of each group (and 0.9% of the exemestane plus OFS group). Musculoskeletal symptoms of grade 3 or 4 occurred in 6.7% of patients with tamoxifen alone and 5.9% with tamoxifen plus OFS, but 12.0% with exemestane plus OFS. Respective rates of osteoporosis grade 2-4 were 3.9%, 6.1%, and 11.9%.
“The addition of OFS to tamoxifen significantly improves disease-free survival at 8 years’ median follow-up, and disease-free survival benefits are further improved by the use of exemestane plus OFS,” Dr. Fleming summarized. “Follow-up, which is critically important given the long natural history of ER-positive disease, continues.”
Session attendee Matthew P. Goetz, MD, of the Mayo Clinic, Rochester, Minn., commented, “For the primary endpoint, I was looking at the tail for tamoxifen. It seemed that there was a relatively rapid drop-off between year 5 and this 8-year follow-up. Have you looked carefully to see whether there is a difference between those who stayed on their therapy versus those who went off it per protocol? That is, extended versus not extended? The question is whether there is a carry-over effect, if you will, that is different in those with OFS versus those not.”
“The percent who went on to extended therapy between the tamoxifen and the tamoxifen plus OFS was fairly similar,” Dr. Fleming replied. “But the answer is no, we have not yet done any sort of per protocol analysis.”
Session attendee Steven Vogl, MD, of Montefiore Medical Center, New York, commented, “I worry about your control group. I’m worried, first, how many of your tamoxifen patients lost their menses and became postmenopausal in those 5 years? And of those, why didn’t they switch to an aromatase inhibitor? Only 25% of the patients continued after the 5 years according to your slide, and all of those patients should either have stayed on tamoxifen or switched to an aromatase inhibitor, now probably for 2 years at least.”
“We have not yet looked at data for who became amenorrheic during treatment, although we have it. However, it’s certainly possible to become amenorrheic on tamoxifen and not be postmenopausal, and we didn’t regularly collect estradiol levels on any but the very small subset of women in the SOFT-S trial. So I don’t know that we have exactly the data that you’re looking for,” Dr. Fleming said. “Many of these women are obviously at very, very low risk and have done well with 5 years of tamoxifen alone, and I don’t know, even given current guidelines, that extended tamoxifen would add a lot to that.”
Finally, session attendee Richard Gray, professor of medical statistics at the University of Oxford (England), wondered, “What is the certainty that follow-up will happen? Because obviously, prolonged follow-up is expensive and there are controversies about that. But this would be the one study you would really want to have 15- and 20-year data on.”
“We are working very, very hard on that,” Dr. Fleming replied. “NCI granted additional funds to institutions for prolonging follow-up, and IBCSG has been ceaselessly working to look for funding to continue it. So I think it’s relatively certain that it will happen.”
Dr. Francis disclosed that she has received fees for non-CME services from AstraZeneca and has given an overseas lecture for Pfizer. Dr. Fleming disclosed that she had no relevant financial relationships with commercial interests. The trials received financial support from Pfizer and Ipsen.
SOURCES: Francis et al. SABCS Abstract GS4-02; Fleming et al. SABCS Abstract GS4-03
SAN ANTONIO – Adjuvant endocrine therapies improve outcomes of premenopausal breast cancer in the long term, with absolute benefit varying somewhat by therapy and by patient and disease characteristics, according to planned updates of a pair of pivotal phase 3 trials.
The trials – TEXT (Tamoxifen and Exemestane Trial) and SOFT (Suppression of Ovarian Function Trial) – are coordinated by the International Breast Cancer Study Group and together randomized more than 5,000 premenopausal women with early hormone receptor–positive breast cancer to 5 years of various types of adjuvant endocrine therapy. Their initial results, reported several years ago, form part of treatment guidelines that are used worldwide.
Relative benefits for various outcomes were generally similar across subgroups, but absolute benefits were greater for women having certain features increasing risk for poor outcomes.
Clinical implications
These updates, along with other emerging data, can be used to optimize endocrine therapy for younger women with breast cancer, according to invited discussant Ann H. Partridge, MD, of Dana Farber Cancer Institute in Boston.
“For higher-risk disease, we should be considering OFS. At this point in time, I don’t think HER2 status alone should drive this decision,” she commented. “If you are getting OFS, what do we do, AI versus tamoxifen? Well, we do see a large improvement in disease-free survival [with AIs], so many women will want to use AIs. Yet tamoxifen is still reasonable, especially in light of the survival data.”
Data on switch strategies and extended-duration therapy are generally lacking at present for the premenopausal population, Dr. Partridge noted. “That’s something that we still need to extrapolate from data that’s predominantly in postmenopausal women.”
Another compelling question is whether OFS can be used instead of chemo for some patients. “We are increasingly recognizing that women with higher-risk anatomy and lower-risk biology having endocrine-responsive tumors may get more bang for the buck from the optimizing of hormonal therapy, and chemo may not add much,” she said.
Both short- and long-term toxicities of the various endocrine therapies and, for aromatase inhibitors, the potential for breakthrough (return of estradiol levels to premenopausal levels) also need to be considered, Dr. Partridge stressed. “And ultimately, patient preference and tolerance are key. After all, the best treatment is the one the patient will take.”
“We need to follow these women on TEXT and SOFT very long term. It would be a crime not to follow these women further out,” she maintained. “We need to conduct real-world comparative effectiveness research to understand the risks and benefits of OFS more fully in our survivors. Then, as we start to suppress more ovaries in more women with breast cancer, we need to be aware clinically of these risks, and we need to share this awareness with their primary care providers because we need to optimize in particular their cardiovascular risk factors, and screen and treat for potential comorbidities that they may be at higher risk for.”
Joint TEXT and SOFT update
Initial results of the joint TEXT and SOFT analysis, reported after a median follow-up of 5.7 years, showed that exemestane plus OFS was superior to tamoxifen plus OFS for the primary outcome, providing a significant 3.8% absolute gain in 5-year disease-free survival (N Engl J Med. 2014;371:107-18).
The updated joint analysis, now with a median follow-up of 9 years and based on data from 4,690 women, showed that the 8-year rate of disease-free survival was 86.8% with exemestane plus OFS versus 82.8% with tamoxifen plus OFS (hazard ratio, 0.77; P = .0006), for a similar absolute benefit of 4.0%, reported Prudence Francis, MD, of the University of Melbourne, head of Medical Oncology in the Breast Service at the Peter MacCallum Cancer Centre, Melbourne.
In stratified analysis, absolute benefit tended to be greater among women in TEXT who received chemotherapy (6.0%); intermediate among women in TEXT who did not receive chemotherapy (3.7%) and women in SOFT who received prior chemotherapy (3.7%); and less among women in SOFT who did not receive chemotherapy (1.9%).
Exemestane plus OFS was also superior to tamoxifen plus OFS in terms of breast cancer–free interval, with an absolute 4.1% benefit (P = .0002), and distant recurrence–free interval, with an absolute 2.1% benefit (P = .02). Overall survival did not differ significantly between arms.
Among the 86% of patients with HER2-negative disease, exemestane plus OFS netted an absolute disease-free survival gain of 5.4% and an absolute distant recurrence–free interval gain of 3.4%. There was a consistent relative treatment benefit across subgroups, but larger absolute benefit, on the order of 5%-9%, in women given chemotherapy and in those younger than 35 years.
“Results for the HER2-positive subgroup require further investigation,” Dr. Francis said. “The trials enrolled both before and after the routine use of adjuvant trastuzumab, and a significant proportion of the patients with HER2-positive breast cancer did not receive adjuvant HER2-targeted therapy.”
In the entire joint-analysis population, exemestane plus OFS was associated with higher rates of musculoskeletal events of grade 3 or 4 (11% vs. 6%) and osteoporosis of grade 2-4 (15% vs. 7%), while tamoxifen plus OFS was associated with a higher rate of thrombosis/embolism of grade 2-4 (2.3% vs. 1.2%) and more cases of endometrial cancer (9 vs. 4 cases). At 4 years, early discontinuation of oral endocrine therapy was greater for exemestane than for tamoxifen (25% vs. 19%).
“After longer follow-up, with a median of 9 years, the combined analysis results confirm a statistically significant improvement in disease outcomes with exemestane plus ovarian suppression. As is critical given the long natural history of estrogen receptor–positive breast cancer, follow-up in these trials is currently continuing,” Dr. Francis summarized.
“To optimally translate the observed absolute trial improvements into clinical practice, oncologists need to discuss and weigh the potential benefits and toxicities in each individual patient who is premenopausal with hormone receptor–positive breast cancer,” she recommended.
Session attendee Hope S. Rugo, MD, of the University of California, San Francisco, Helen Diller Family Comprehensive Cancer Center, noted that exemestane had superior benefit despite the 25% rate of early discontinuation. “I wonder if one of the interpretations of that, given the toxicity of this therapy for very young women, is that we need some but maybe not so much. Maybe they don’t need 5 years altogether,” she said.
“The fact that they stopped their assigned endocrine therapy doesn’t mean that they didn’t continue any therapy. They may have switched over to tamoxifen or they may have decided they wanted to have a baby or there may have been many other things,” Dr. Francis replied, noting that analyses sorting out the reasons for early discontinuation are planned.
Session attendee Mark E. Sherman, MD, of the Mayo Clinic, Jacksonville, Fla., asked, “Do you have any ability to test for tamoxifen metabolites? It’s possible that a third to a half of patients got reduced benefit from that drug.”
Banked samples are available and a substudy is planned, according to Dr. Francis. “We haven’t got data on that yet, but yes, we are analyzing that.”
SOFT update
Initial results of the SOFT trial, reported after a median follow-up of 5.6 years, showed that adding OFS to tamoxifen did not significantly improve disease-free survival over tamoxifen alone in the entire trial population (N Engl J Med. 2015;372:436-46). However, there was benefit for women who received chemotherapy and remained premenopausal.
The updated SOFT analysis, now with a median follow-up of 8 years, focused mainly on the 1,018 women given tamoxifen alone and the 1,015 women given tamoxifen plus OFS. (Another 1,014 women were given exemestane plus OFS.)
“SOFT is now positive for its primary endpoint,” reported first author Gini Fleming, MD, director of the Medical Oncology Breast Program and medical oncology director of Gynecologic Oncology at University of Chicago Medicine. The 8-year disease-free survival rate was 83.2% with tamoxifen plus OFS, compared with 78.9% with tamoxifen alone (HR, 0.76; P = .009), corresponding to a 4.2% gain in this outcome. The relative benefit was identical whether patients had received chemotherapy or not, but absolute benefit was greater for those who had (5.3%), as well as for patients younger than 35 years (8.7%).
In addition, exemestane plus OFS was superior to tamoxifen alone (85.9% vs. 78.9%; HR, 0.65), with an absolute benefit of 7.0%. Again, absolute benefit was more pronounced among women who had received prior chemotherapy (9.0%) or were younger than 35 years (13.1%).
The relative disease-free survival benefit of tamoxifen plus OFS over tamoxifen alone was similar across most subgroups stratified by disease characteristics, but patients with HER2-positive disease derived greater relative benefit from the combination as compared with their HER2-negative counterparts (P = .04 for interaction). “When we look at the combination of exemestane plus OFS versus tamoxifen, this heterogeneity is no longer seen,” Dr. Fleming noted.
In the entire trial population, there was no significant benefit of tamoxifen plus OFS over tamoxifen alone for distant recurrence-free interval and a small, significant absolute 1.9% gain in overall survival.
“The cohort who had elected to receive no prior chemotherapy did exceedingly well regardless of therapy,” she said, with little difference in overall survival across the three arms. “There were only 24 deaths total in this cohort, and 12 of those deaths were in the setting of no distant recurrence.”
On the other hand, among the women who received chemotherapy, there were significant absolute overall survival benefits of 4.3% with tamoxifen plus OFS and 2.1% with exemestane plus OFS, over tamoxifen alone. “This late emergence of an overall survival benefit is consistent with the time course of events in estrogen receptor–positive breast cancer,” Dr. Fleming commented.
The proportion of patients who stopped their oral endocrine therapy early was 22.5% with tamoxifen alone and 18.5% with tamoxifen plus OFS. (It was 27.8% with exemestane plus OFS.) “Almost a quarter of the patients on either tamoxifen arm were using extended oral endocrine therapy at 6 years or later prior to any disease progression. Only about 12% of patients in the exemestane group were doing so,” she noted.
There were more cases of endometrial cancer with tamoxifen alone than with tamoxifen plus OFS (7 vs. 4 cases). Thrombosis/embolism of grade 2-4 occurred in 2.2% of each group (and 0.9% of the exemestane plus OFS group). Musculoskeletal symptoms of grade 3 or 4 occurred in 6.7% of patients with tamoxifen alone and 5.9% with tamoxifen plus OFS, but 12.0% with exemestane plus OFS. Respective rates of osteoporosis grade 2-4 were 3.9%, 6.1%, and 11.9%.
“The addition of OFS to tamoxifen significantly improves disease-free survival at 8 years’ median follow-up, and disease-free survival benefits are further improved by the use of exemestane plus OFS,” Dr. Fleming summarized. “Follow-up, which is critically important given the long natural history of ER-positive disease, continues.”
Session attendee Matthew P. Goetz, MD, of the Mayo Clinic, Rochester, Minn., commented, “For the primary endpoint, I was looking at the tail for tamoxifen. It seemed that there was a relatively rapid drop-off between year 5 and this 8-year follow-up. Have you looked carefully to see whether there is a difference between those who stayed on their therapy versus those who went off it per protocol? That is, extended versus not extended? The question is whether there is a carry-over effect, if you will, that is different in those with OFS versus those not.”
“The percent who went on to extended therapy between the tamoxifen and the tamoxifen plus OFS was fairly similar,” Dr. Fleming replied. “But the answer is no, we have not yet done any sort of per protocol analysis.”
Session attendee Steven Vogl, MD, of Montefiore Medical Center, New York, commented, “I worry about your control group. I’m worried, first, how many of your tamoxifen patients lost their menses and became postmenopausal in those 5 years? And of those, why didn’t they switch to an aromatase inhibitor? Only 25% of the patients continued after the 5 years according to your slide, and all of those patients should either have stayed on tamoxifen or switched to an aromatase inhibitor, now probably for 2 years at least.”
“We have not yet looked at data for who became amenorrheic during treatment, although we have it. However, it’s certainly possible to become amenorrheic on tamoxifen and not be postmenopausal, and we didn’t regularly collect estradiol levels on any but the very small subset of women in the SOFT-S trial. So I don’t know that we have exactly the data that you’re looking for,” Dr. Fleming said. “Many of these women are obviously at very, very low risk and have done well with 5 years of tamoxifen alone, and I don’t know, even given current guidelines, that extended tamoxifen would add a lot to that.”
Finally, session attendee Richard Gray, professor of medical statistics at the University of Oxford (England), wondered, “What is the certainty that follow-up will happen? Because obviously, prolonged follow-up is expensive and there are controversies about that. But this would be the one study you would really want to have 15- and 20-year data on.”
“We are working very, very hard on that,” Dr. Fleming replied. “NCI granted additional funds to institutions for prolonging follow-up, and IBCSG has been ceaselessly working to look for funding to continue it. So I think it’s relatively certain that it will happen.”
Dr. Francis disclosed that she has received fees for non-CME services from AstraZeneca and has given an overseas lecture for Pfizer. Dr. Fleming disclosed that she had no relevant financial relationships with commercial interests. The trials received financial support from Pfizer and Ipsen.
SOURCES: Francis et al. SABCS Abstract GS4-02; Fleming et al. SABCS Abstract GS4-03
REPORTING FROM SABCS 2017
Key clinical point:
Major finding: In the joint TEXT-SOFT update, 8-year disease-free survival was superior with exemestane plus OFS versus tamoxifen plus OFS (86.8% vs. 82.8%; P = .0006). In the SOFT update, 8-year disease-free survival was superior with tamoxifen plus OFS versus tamoxifen alone (83.2% vs. 78.9%; P = .009).
Data source: Updated analyses of phase 3 trials among premenopausal women with HR-positive breast cancer: TEXT and SOFT joint analysis (n = 4,690; median 9-year follow-up) and SOFT analysis (n = 3,047; median 8-year follow-up).
Disclosures: Dr. Francis disclosed that she has received fees for non-CME services from AstraZeneca and has given an overseas lecture for Pfizer. Dr. Fleming disclosed that she had no relevant financial relationships with commercial interests. The trials received financial support from Pfizer and Ipsen.
Source: Francis et al. SABCS Abstract GS4-02; Fleming et al. SABCS Abstract GS4-03
Cars that recognize hypoglycemia? Maybe soon
SAN DIEGO – When researchers at the University of Nebraska placed sensors in the cars of patients with type 1 diabetes, they found something interesting: About 3.4% of the time, the patients were driving with a blood glucose below 70 mg/dL.
Almost 10% of the time, it was above 300 mg/dL, and both hyper and hypoglycemia, but especially hypoglycemia, corresponded with erratic driving, especially at highway speeds.
The finding explains why patients taking insulin for type 1 diabetes have a 12%-19% higher risk of crashing their cars, compared with the general population. But in a larger sense, the study speaks to a new possibility as cars become smarter: monitoring drivers’ mental states and pulling over to the side of the road or otherwise taking control if there’s a problem.
The “results show that vehicle sensor and physiologic data can be successfully linked to quantify individual driver performance and behavior in drivers with metabolic disorders that affect brain function. The work we are doing could be used to tune the algorithm that drive these automated vehicles. I think this is a very important area of study,” said senior investigator Matthew Rizzo, MD, chair of the university’s department of neurological sciences in Omaha.

Participants had the devices in their cars for a month, during which time the diabetes patients were also on continuous, 24-hour blood glucose monitoring. The investigators then synched the car data with the glucose readings, and compared it with the data from the controls’ cars. In all, the system recorded more than 1,000 hours of road time across 3,687 drives and 21,232 miles.
“What we found was that the drivers with diabetes had trouble,” Dr. Rizzo said at the American Neurological Association annual meeting.
Glucose was dangerously high or low about 13% of the time when people with diabetes were behind the wheel. Their accelerometer profiles revealed more risky maneuvering and variability in pedal control even during periods of euglycemia and moderate hyperglycemia, but particularly when hypoglycemia occurred at highway speeds.
One driver almost blacked out behind the wheel when his blood glucose fell below 40 mg/dL. “He might have been driving because he was not aware he had a problem,” Dr. Rizzo said. He is now; he was shown the video.
The team reviewed their subjects’ department of motor vehicles records for the 2 years before the study. All three car crashes in the study population were among drivers with diabetes, and they received 11 of the 13 citations (85%).
The technology has many implications. In the short term, it’s a feedback tool to help people with diabetes stay safer on the road. But the work is also “a model for us to be able to approach all kinds of medical disorders in the real world. We want generalizable models that go beyond type 1 diabetes to type 2 diabetes and other forms of encephalopathy, of which there are many in neurology.” Those models could one day lead to “automated in-vehicle technology responsive to driver’s momentary neurocognitive state. You could have [systems] that alert the car that the driver is in no state to drive; the car could even take over. We are very excited about” the possibilities, Dr. Rizzo said.
Meanwhile, “just the diagnosis of diabetes itself is not enough to restrict a person from driving. But if you record their sugars over long periods of time, and you see the kind of changes we saw in some of the drivers, it means the license might need to be adjusted slightly,” he said.
Dr. Rizzo had no relevant disclosures. One of the investigators was an employee of the Toyota Collaborative Safety Research Center.
SAN DIEGO – When researchers at the University of Nebraska placed sensors in the cars of patients with type 1 diabetes, they found something interesting: About 3.4% of the time, the patients were driving with a blood glucose below 70 mg/dL.
Almost 10% of the time, it was above 300 mg/dL, and both hyper and hypoglycemia, but especially hypoglycemia, corresponded with erratic driving, especially at highway speeds.
The finding explains why patients taking insulin for type 1 diabetes have a 12%-19% higher risk of crashing their cars, compared with the general population. But in a larger sense, the study speaks to a new possibility as cars become smarter: monitoring drivers’ mental states and pulling over to the side of the road or otherwise taking control if there’s a problem.
The “results show that vehicle sensor and physiologic data can be successfully linked to quantify individual driver performance and behavior in drivers with metabolic disorders that affect brain function. The work we are doing could be used to tune the algorithm that drive these automated vehicles. I think this is a very important area of study,” said senior investigator Matthew Rizzo, MD, chair of the university’s department of neurological sciences in Omaha.
Participants had the devices in their cars for a month, during which time the diabetes patients were also on continuous, 24-hour blood glucose monitoring. The investigators then synched the car data with the glucose readings, and compared it with the data from the controls’ cars. In all, the system recorded more than 1,000 hours of road time across 3,687 drives and 21,232 miles.
“What we found was that the drivers with diabetes had trouble,” Dr. Rizzo said at the American Neurological Association annual meeting.
Glucose was dangerously high or low about 13% of the time when people with diabetes were behind the wheel. Their accelerometer profiles revealed more risky maneuvering and variability in pedal control even during periods of euglycemia and moderate hyperglycemia, but particularly when hypoglycemia occurred at highway speeds.
One driver almost blacked out behind the wheel when his blood glucose fell below 40 mg/dL. “He might have been driving because he was not aware he had a problem,” Dr. Rizzo said. He is now; he was shown the video.
The team reviewed their subjects’ department of motor vehicles records for the 2 years before the study. All three car crashes in the study population were among drivers with diabetes, and they received 11 of the 13 citations (85%).
The technology has many implications. In the short term, it’s a feedback tool to help people with diabetes stay safer on the road. But the work is also “a model for us to be able to approach all kinds of medical disorders in the real world. We want generalizable models that go beyond type 1 diabetes to type 2 diabetes and other forms of encephalopathy, of which there are many in neurology.” Those models could one day lead to “automated in-vehicle technology responsive to driver’s momentary neurocognitive state. You could have [systems] that alert the car that the driver is in no state to drive; the car could even take over. We are very excited about” the possibilities, Dr. Rizzo said.
Meanwhile, “just the diagnosis of diabetes itself is not enough to restrict a person from driving. But if you record their sugars over long periods of time, and you see the kind of changes we saw in some of the drivers, it means the license might need to be adjusted slightly,” he said.
Dr. Rizzo had no relevant disclosures. One of the investigators was an employee of the Toyota Collaborative Safety Research Center.
REPORTING FROM ANA 2017
Key clinical point:
Major finding: Glucose was dangerously high or low about 13% of the time when people with diabetes were behind the wheel.
Study details: Investigators paired real-time driving data with continuous glucose monitoring in patients with type 1 diabetes to asses how blood sugar levels affected driving.
Disclosures: Toyota funded the work. The senior investigator had no relevant disclosures.
Source: Rizzo M, et al. ANA 2017 abstract number S131.
8 common questions about newborn circumcision
In the United States, circumcision is the fourth most common surgical procedure—behind cataract removal, cesarean delivery, and joint replacement.1 This operation, which dates to ancient times, is chosen for medical, personal, or religious reasons. It is performed on 77% of males born in the United States and on 42% of those born elsewhere who are living in this country.2 Whether it is performed depends not only on the parents’ race, ethnic background, and religion but also on region: US circumcision rates range from 74% in the Midwest to 30% in the West, and in between are the Northeast (67%) and the South (61%).3
Circumcision is not without controversy. Some claim that it is unnecessary cosmetic surgery, that it is genital mutilation, that the patient cannot choose it or object to it, or that it decreases sexual satisfaction.
In this article, I review 8 common questions about circumcision and provide data-based answers to them.
1. Should a newborn be circumcised?
For many years, the medical benefits of circumcision were scientifically ambiguous. With no clear answers, some thought that parents should base their decision for or against circumcision not on any potential medical benefit but rather on their family or religious tradition, or on a social standard, that is, what the majority of families in their community do.
Over the past 20 years, a growing body of evidence has demonstrated real medical benefits of circumcision. In 2012, the American Academy of Pediatrics (AAP), which previously had been neutral on the subject, issued a task force report concluding that the health benefits of circumcision outweigh its risks and justify access to the procedure.3,4 However, the report stopped short of recommending circumcision.
Opponents have expressed several concerns about circumcision. First, they say, it is painful and unnecessary, and performing it when life has just begun takes the decision away from the adult-to-be, who may want to be uncircumcised as an adult but will have no recourse. Second, they say circumcision will diminish the adult’s sexual pleasure. However, there is no proof this occurs, and it is unclear how the claim could be adequately verified.5
Health benefits of circumcision3
- Prevention of phimosis and balanoposthitis (inflammation of glans and foreskin), penile retraction disorders, and penile cancer
- Fewer infant urinary tract infections
- Decreased spread of human papillomavirus–related disease, including cervical cancer and its precursors, to sexual partners
- Lower risk of acquiring, harboring, and spreading human immunodeficiency virus infection, herpes virus infection, and other sexually transmitted diseases
- Easier genital hygiene
- No need for circumcision later in life, when the procedure is more involved
2. What is the best analgesia for circumcision?
Although in decades past circumcision was often performed without any analgesia, in the United States analgesia is now standard of care. The AAP Task Force on Circumcision formalized this standard in a 2012 policy statement.4 For newborn circumcision, analgesia can be given in the form of analgesic cream, penile ring block, or dorsal nerve block.
Analgesic EMLA cream (a mixture of local anesthetics such as lidocaine 2.5%/prilocaine 2.5%) is easy to use but is minimally effective in relieving circumcision pain,6 although some investigators have reported it is efficacious compared with placebo.7 When used, the analgesic cream is applied 30 to 60 minutes before circumcision.
Both penile ring block and dorsal nerve block with 1% lidocaine are easy to administer and are very effective.8,9 They are best used with buffered lidocaine, which partially relieves the burning that occurs with injection. With both methods, the smaller the needle used (preferably 30 gauge), the better.
These 2 block methods have different injection sites. For the ring block, small amounts of lidocaine (1 to 1.5 mL) are given in a series of injections around the entire circumference of the base of the penis. The dorsal block targets the 2 dorsal nerves located at 10 o’clock and 2 o’clock at the base of the penis. Epinephrine, given its vasoconstrictive properties and the potential for necrosis, should never be used with local analgesia for penile infiltration.
Analgesia can be supplemented with comfort measures, such as a pacifier, sugar water, gentle rubbing on the forehead, and soothing speech.10
Related article:
Circumcision impedes viral disease. Will opposition fade?
3. What conditions are required for safe circumcision?
As circumcision is not medically required and need not occur in the days immediately after birth, it should be performed only when conditions are optimal:
- A pediatrician or other practitioner must first examine the newborn.
- The newborn must be full-term, healthy, and stable.
- The best time to circumcise a baby born prematurely is right before discharge from the intensive care nursery.
- The penis must be of normal size and without anatomical defect—no micropenis, hypospadias, or penoscrotal webbing.
- The lower abdominal fat pad must not be so large that it will cause the shaft’s skin to cover the exposed penile head.
- If there is a family history of a bleeding disorder, the newborn must be evaluated for the disorder before the circumcision.
- The newborn must have received his vitamin K shot.
4. What is the best circumcision method?
Circumcision can be performed with the Gomco circumcision clamp, the Mogen circumcision clamp, or the PlastiBell circumcision device. Each device works well, provides excellent results, and has its pluses and minuses. Practitioners should use the device with which they are most familiar and comfortable, which likely will be the device they used in training.
In the United States, the Gomco clamp is perhaps the most commonly used device. It provides good cosmetic results, and its metal “bell” protects the entire head of the penis. Of the 3 methods, however, it is the most difficult—the partially cut foreskin must be threaded between the bell and the clamp frame before the clamp is tightened. In many cases, too, there is bleeding at the penile frenulum.
The Mogen clamp, another commonly used device, also is used in traditional Jewish circumcisions. Of the 3 methods, it is the quickest, produces the best hemostasis, and is associated with the least discomfort.10 To those unfamiliar with the method, there may seem to be a potential for amputation of the head of the penis, but actually there virtually is no risk, as an indentation on the penile side of the clamp protects the penile head.
The PlastiBell device is very easy to use but must stay on until the foreskin becomes necrotic and the bell and foreskin fall off on their own—a process that takes 7 to 10 days. Many parents dislike this method because its final result is not immediate and they have to contend with a medical implement during their newborn’s first week home.
Electrocautery is not recommended. Some clinicians, especially urologists, use electrocautery as the cutting mechanism for circumcision. A review of the literature, however, reveals that electrocautery has not been studied head-to-head against traditional techniques, and that various significant complications—transected penile head, severe burns, meatal stenosis—have been reported.11,12 It is certainly not a mainstream procedure for neonatal circumcision.
Evaluate penile anatomy for abnormalities
Before performing any circumcision, the head of the penis should be examined to rule out hypospadias or other penile abnormalities. This is because the foreskin is utilized in certain penile repair procedures. The pediatrician should perform an initial examination of the penis at the formal newborn physical within 24 hours of delivery. The clinician performing the circumcision should re-examine the penis just before the procedure is begun—by pushing back the foreskin as much as possible—as well as during the procedure, once the foreskin is lifted off the penile head but before the foreskin is excised.
Read about how to ensure the best outcome of circumcision.
5. When is the best time to perform a circumcision?
The medical literature provides no firm answer to this question. The younger the baby, the easier it is to perform a circumcision as a simple procedure with local anesthesia. The older the baby, the larger the penis and the more aware the baby will be of his surroundings. Both these factors will make the procedure more difficult.
Most clinicians would be reluctant to perform a circumcision in the office or clinic after the baby is 6 to 8 weeks old. If a family desires their son to be circumcised after that time—or a medical condition precludes earlier circumcision—the procedure is best performed by a pediatric urologist in the operating room.
Related article:
Circumcision accident: $1.3M verdict
6. What are the potential complications of circumcision?
The rate of circumcision complications is very low: 0.2%.13 That being said, the 3 most common types of complications are postoperative bleeding, infection, and damage to the penis.
Far and away the most common complication is postoperative bleeding , usually at the frenulum of the head of the penis (the 6 o’clock position). In most cases, the bleeding is light to moderate. It is controlled with direct pressure applied for several minutes, the use of processed gelatin (Gelfoam) or cellulose (Surgicel), sparing use of silver nitrate, or placement of a polyglycolic acid (Vicryl) 5-0 suture.
Infection, an unusual occurrence, is seen within 24 to 72 hours after circumcision. It is marked by swelling, redness, and a foul-smelling mucus discharge. This discharge must be differentiated from dried fibrin, which is commonly seen on the head of the penis in the days after circumcision but has no odor or association with erythema, fever, or infant fussiness. True infection should be treated, in collaboration with the child’s pediatrician, with a staphylococcal-sensitive penicillin (such as dicloxacillin).
More serious is damage to the penis, which ranges from accidental dilation of the meatus to partial amputation of the penile glans. Any such injury should immediately prompt a consultation with a pediatric urologist.
More of a nuisance than a complication is the sliding of the penile shaft’s skin up and over the glans. This is a relatively frequent occurrence after normal, successful circumcisions. Parents of an affected newborn should be instructed to gently slide the skin back until the head of the penis is completely exposed again. After several days, the skin will adhere to its proper position on the shaft.
- Just before the procedure, have a face-to-face discussion with the parents. Confirm that they want the circumcision done, explain exactly what it entails, and let them know they will receive complete aftercare instructions.
- Make sure one of the parents signs the consent form.
- Circumcise the right baby! Check the identification bracelet and confirm that the newborn’s hospital and chart numbers match.
- Prevent excessive hip movement by securing the baby's legs. The usual solution is a specially designed plastic restraint board with Velcro straps for the legs.
- Examine the infant’s penile anatomy prior to the procedure to make certain it is normal.
- For pain relief, administer enough analgesia, as either dorsal nerve block or penile ring block (the best methods). Before injection, draw the plunger of the syringe back to make certain that the needle is not in a blood vessel.
- During the procedure, make sure the entire membranous layer of foreskin covering the head of the penis is separated from the glans.
- Watch the penis for several minutes after the circumcision to make sure there is no bleeding.
7. What is a Jewish ritual circumcision?
For their newborn’s circumcision, Jewish parents may choose a bris ceremony, formally called a brit milah, in fulfillment of religious tradition. The ceremony involves a brief religious service, circumcision with the traditional Mogen clamp, a special blessing, and an official religious naming rite. The bris traditionally is performed by a mohel, a rabbi or other religious official trained in circumcision. Many parents have the bris done by a mohel who is a medical doctor. In the United States, the availability of both types of mohels varies.
8. Who should perform circumcisions—obstetricians or pediatricians?
The answer to this question depends on where you practice. In some communities or hospitals, the obstetrician performs newborn circumcision, while in other places the pediatrician does. In addition, depending on local circumstances or the specific population involved, circumcisions may be performed by a pediatric urologist, nurse practitioner, or even out of hospital by a trained religiously affiliated practitioner.
Obstetricians began doing circumcisions for 2 reasons. First, obstetricians are surgically trained whereas pediatricians are not. It was therefore thought to be more appropriate for obstetricians to do this minor surgical procedure. Second, circumcisions used to be done right in the delivery room shortly after delivery. It was thought that the crying induced by performing the circumcision helped clear the baby’s lungs and invigorated sluggish babies. Now, however, in-hospital circumcisions are usually done in the days following delivery, after the baby has had the opportunity to undergo his first physical examination to make sure that all is well and that the penile anatomy is normal.
Clinician experience, proper protocol contribute to a safe procedure
In the United States, a large percentage of male infants are circumcised. Although circumcision has known medical benefits, the procedure generally is performed for family, religious, or cultural reasons. Circumcision is a safe and straightforward procedure but has its risks and potential complications. As with most surgeries, the best outcomes are achieved by practitioners who are well trained, who perform the procedure under supervision until their experience is sufficient, and who follow correct protocol during the entire operation.
Share your thoughts! Send your Letter to the Editor to [email protected]. Please include your name and the city and state in which you practice.
- Dallas ME. The 10 most common surgeries in the US. Healthgrades website. https://www.healthgrades.com/explore/the-10-most-common-surgeries-in-the-us. Reviewed August 15, 2017. Accessed October 2, 2017.
- Laumann EO, Masi CM, Zuckerman EW. Circumcision in the United States: prevalence, prophylactic effects, and sexual practice. JAMA. 1997;277(13):1052–1057.
- American Academy of Pediatrics Task Force on Circumcision. Male circumcision. Pediatrics. 2012;130(3):e756–e785.
- American Academy of Pediatrics Task Force on Circumcision. Circumcision policy statement. Pediatrics. 2012;130(3):585–586.
- Morris BJ, Krieger JN. Does male circumcision affect sexual function, sensitivity, or satisfaction? A systematic review. J Sex Med. 2013;10(11):2644–2657.
- Howard FM, Howard CR, Fortune K, Generelli P, Zolnoun D, tenHoopen C. A randomized, placebo-controlled comparison of EMLA and dorsal penile nerve block for pain relief during neonatal circumcision. Prim Care Update Ob Gyns. 1998;5(4):196.
- Taddio A, Stevens B, Craig K, et al. Efficacy and safety of lidocaine-prilocaine cream for pain during circumcision. N Engl J Med. 1997;336(17):1197–1201.
- Lander J, Brady-Fryer B, Metcalfe JB, Nazarali S, Muttitt S. Comparison of ring block, dorsal penile nerve block, and topical anesthesia for neonatal circumcision: a randomized controlled trial. JAMA. 1997;278(24):2157–2162.
- Hardwick-Smith S, Mastrobattista JM, Wallace PA, Ritchey ML. Ring block for neonatal circumcision. Obstet Gynecol. 1998;91(6):930–934.
- Kaufman GE, Cimo S, Miller LW, Blass EM. An evaluation of the effects of sucrose on neonatal pain with 2 commonly used circumcision methods. Am J Obstet Gynecol. 2002;186(3):564–568.
- Tucker SC, Cerqueiro J, Sterne GD, Bracka A. Circumcision: a refined technique and 5 year review. Ann R Coll Surg Engl. 2001;83(2):121–125.
- Fraser ID, Tjoe J. Circumcision using bipolar scissors can be a safe and simple operation. Ann R Coll Surg Engl. 2000;82(3):190–191.
- Wiswell TE, Geschke DW. Risks from circumcision during the first month of life compared with those for uncircumcised boys. Pediatrics. 1989;83(6):1011–1015.

Dr. Lerner is Assistant Clinical Professor, Department of Obstetrics and Gynecology, Harvard Medical School, Boston, Massachusetts.
The author reports no financial relationships relevant to this article.
Dr. Lerner is Assistant Clinical Professor, Department of Obstetrics and Gynecology, Harvard Medical School, Boston, Massachusetts.
The author reports no financial relationships relevant to this article.
Dr. Lerner is Assistant Clinical Professor, Department of Obstetrics and Gynecology, Harvard Medical School, Boston, Massachusetts.
The author reports no financial relationships relevant to this article.
In the United States, circumcision is the fourth most common surgical procedure—behind cataract removal, cesarean delivery, and joint replacement.1 This operation, which dates to ancient times, is chosen for medical, personal, or religious reasons. It is performed on 77% of males born in the United States and on 42% of those born elsewhere who are living in this country.2 Whether it is performed depends not only on the parents’ race, ethnic background, and religion but also on region: US circumcision rates range from 74% in the Midwest to 30% in the West, and in between are the Northeast (67%) and the South (61%).3
Circumcision is not without controversy. Some claim that it is unnecessary cosmetic surgery, that it is genital mutilation, that the patient cannot choose it or object to it, or that it decreases sexual satisfaction.
In this article, I review 8 common questions about circumcision and provide data-based answers to them.
1. Should a newborn be circumcised?
For many years, the medical benefits of circumcision were scientifically ambiguous. With no clear answers, some thought that parents should base their decision for or against circumcision not on any potential medical benefit but rather on their family or religious tradition, or on a social standard, that is, what the majority of families in their community do.
Over the past 20 years, a growing body of evidence has demonstrated real medical benefits of circumcision. In 2012, the American Academy of Pediatrics (AAP), which previously had been neutral on the subject, issued a task force report concluding that the health benefits of circumcision outweigh its risks and justify access to the procedure.3,4 However, the report stopped short of recommending circumcision.
Opponents have expressed several concerns about circumcision. First, they say, it is painful and unnecessary, and performing it when life has just begun takes the decision away from the adult-to-be, who may want to be uncircumcised as an adult but will have no recourse. Second, they say circumcision will diminish the adult’s sexual pleasure. However, there is no proof this occurs, and it is unclear how the claim could be adequately verified.5
Health benefits of circumcision3
- Prevention of phimosis and balanoposthitis (inflammation of glans and foreskin), penile retraction disorders, and penile cancer
- Fewer infant urinary tract infections
- Decreased spread of human papillomavirus–related disease, including cervical cancer and its precursors, to sexual partners
- Lower risk of acquiring, harboring, and spreading human immunodeficiency virus infection, herpes virus infection, and other sexually transmitted diseases
- Easier genital hygiene
- No need for circumcision later in life, when the procedure is more involved
2. What is the best analgesia for circumcision?
Although in decades past circumcision was often performed without any analgesia, in the United States analgesia is now standard of care. The AAP Task Force on Circumcision formalized this standard in a 2012 policy statement.4 For newborn circumcision, analgesia can be given in the form of analgesic cream, penile ring block, or dorsal nerve block.
Analgesic EMLA cream (a mixture of local anesthetics such as lidocaine 2.5%/prilocaine 2.5%) is easy to use but is minimally effective in relieving circumcision pain,6 although some investigators have reported it is efficacious compared with placebo.7 When used, the analgesic cream is applied 30 to 60 minutes before circumcision.
Both penile ring block and dorsal nerve block with 1% lidocaine are easy to administer and are very effective.8,9 They are best used with buffered lidocaine, which partially relieves the burning that occurs with injection. With both methods, the smaller the needle used (preferably 30 gauge), the better.
These 2 block methods have different injection sites. For the ring block, small amounts of lidocaine (1 to 1.5 mL) are given in a series of injections around the entire circumference of the base of the penis. The dorsal block targets the 2 dorsal nerves located at 10 o’clock and 2 o’clock at the base of the penis. Epinephrine, given its vasoconstrictive properties and the potential for necrosis, should never be used with local analgesia for penile infiltration.
Analgesia can be supplemented with comfort measures, such as a pacifier, sugar water, gentle rubbing on the forehead, and soothing speech.10
Related article:
Circumcision impedes viral disease. Will opposition fade?
3. What conditions are required for safe circumcision?
As circumcision is not medically required and need not occur in the days immediately after birth, it should be performed only when conditions are optimal:
- A pediatrician or other practitioner must first examine the newborn.
- The newborn must be full-term, healthy, and stable.
- The best time to circumcise a baby born prematurely is right before discharge from the intensive care nursery.
- The penis must be of normal size and without anatomical defect—no micropenis, hypospadias, or penoscrotal webbing.
- The lower abdominal fat pad must not be so large that it will cause the shaft’s skin to cover the exposed penile head.
- If there is a family history of a bleeding disorder, the newborn must be evaluated for the disorder before the circumcision.
- The newborn must have received his vitamin K shot.
4. What is the best circumcision method?
Circumcision can be performed with the Gomco circumcision clamp, the Mogen circumcision clamp, or the PlastiBell circumcision device. Each device works well, provides excellent results, and has its pluses and minuses. Practitioners should use the device with which they are most familiar and comfortable, which likely will be the device they used in training.
In the United States, the Gomco clamp is perhaps the most commonly used device. It provides good cosmetic results, and its metal “bell” protects the entire head of the penis. Of the 3 methods, however, it is the most difficult—the partially cut foreskin must be threaded between the bell and the clamp frame before the clamp is tightened. In many cases, too, there is bleeding at the penile frenulum.
The Mogen clamp, another commonly used device, also is used in traditional Jewish circumcisions. Of the 3 methods, it is the quickest, produces the best hemostasis, and is associated with the least discomfort.10 To those unfamiliar with the method, there may seem to be a potential for amputation of the head of the penis, but actually there virtually is no risk, as an indentation on the penile side of the clamp protects the penile head.
The PlastiBell device is very easy to use but must stay on until the foreskin becomes necrotic and the bell and foreskin fall off on their own—a process that takes 7 to 10 days. Many parents dislike this method because its final result is not immediate and they have to contend with a medical implement during their newborn’s first week home.
Electrocautery is not recommended. Some clinicians, especially urologists, use electrocautery as the cutting mechanism for circumcision. A review of the literature, however, reveals that electrocautery has not been studied head-to-head against traditional techniques, and that various significant complications—transected penile head, severe burns, meatal stenosis—have been reported.11,12 It is certainly not a mainstream procedure for neonatal circumcision.
Evaluate penile anatomy for abnormalities
Before performing any circumcision, the head of the penis should be examined to rule out hypospadias or other penile abnormalities. This is because the foreskin is utilized in certain penile repair procedures. The pediatrician should perform an initial examination of the penis at the formal newborn physical within 24 hours of delivery. The clinician performing the circumcision should re-examine the penis just before the procedure is begun—by pushing back the foreskin as much as possible—as well as during the procedure, once the foreskin is lifted off the penile head but before the foreskin is excised.
Read about how to ensure the best outcome of circumcision.
5. When is the best time to perform a circumcision?
The medical literature provides no firm answer to this question. The younger the baby, the easier it is to perform a circumcision as a simple procedure with local anesthesia. The older the baby, the larger the penis and the more aware the baby will be of his surroundings. Both these factors will make the procedure more difficult.
Most clinicians would be reluctant to perform a circumcision in the office or clinic after the baby is 6 to 8 weeks old. If a family desires their son to be circumcised after that time—or a medical condition precludes earlier circumcision—the procedure is best performed by a pediatric urologist in the operating room.
Related article:
Circumcision accident: $1.3M verdict
6. What are the potential complications of circumcision?
The rate of circumcision complications is very low: 0.2%.13 That being said, the 3 most common types of complications are postoperative bleeding, infection, and damage to the penis.
Far and away the most common complication is postoperative bleeding , usually at the frenulum of the head of the penis (the 6 o’clock position). In most cases, the bleeding is light to moderate. It is controlled with direct pressure applied for several minutes, the use of processed gelatin (Gelfoam) or cellulose (Surgicel), sparing use of silver nitrate, or placement of a polyglycolic acid (Vicryl) 5-0 suture.
Infection, an unusual occurrence, is seen within 24 to 72 hours after circumcision. It is marked by swelling, redness, and a foul-smelling mucus discharge. This discharge must be differentiated from dried fibrin, which is commonly seen on the head of the penis in the days after circumcision but has no odor or association with erythema, fever, or infant fussiness. True infection should be treated, in collaboration with the child’s pediatrician, with a staphylococcal-sensitive penicillin (such as dicloxacillin).
More serious is damage to the penis, which ranges from accidental dilation of the meatus to partial amputation of the penile glans. Any such injury should immediately prompt a consultation with a pediatric urologist.
More of a nuisance than a complication is the sliding of the penile shaft’s skin up and over the glans. This is a relatively frequent occurrence after normal, successful circumcisions. Parents of an affected newborn should be instructed to gently slide the skin back until the head of the penis is completely exposed again. After several days, the skin will adhere to its proper position on the shaft.
- Just before the procedure, have a face-to-face discussion with the parents. Confirm that they want the circumcision done, explain exactly what it entails, and let them know they will receive complete aftercare instructions.
- Make sure one of the parents signs the consent form.
- Circumcise the right baby! Check the identification bracelet and confirm that the newborn’s hospital and chart numbers match.
- Prevent excessive hip movement by securing the baby's legs. The usual solution is a specially designed plastic restraint board with Velcro straps for the legs.
- Examine the infant’s penile anatomy prior to the procedure to make certain it is normal.
- For pain relief, administer enough analgesia, as either dorsal nerve block or penile ring block (the best methods). Before injection, draw the plunger of the syringe back to make certain that the needle is not in a blood vessel.
- During the procedure, make sure the entire membranous layer of foreskin covering the head of the penis is separated from the glans.
- Watch the penis for several minutes after the circumcision to make sure there is no bleeding.
7. What is a Jewish ritual circumcision?
For their newborn’s circumcision, Jewish parents may choose a bris ceremony, formally called a brit milah, in fulfillment of religious tradition. The ceremony involves a brief religious service, circumcision with the traditional Mogen clamp, a special blessing, and an official religious naming rite. The bris traditionally is performed by a mohel, a rabbi or other religious official trained in circumcision. Many parents have the bris done by a mohel who is a medical doctor. In the United States, the availability of both types of mohels varies.
8. Who should perform circumcisions—obstetricians or pediatricians?
The answer to this question depends on where you practice. In some communities or hospitals, the obstetrician performs newborn circumcision, while in other places the pediatrician does. In addition, depending on local circumstances or the specific population involved, circumcisions may be performed by a pediatric urologist, nurse practitioner, or even out of hospital by a trained religiously affiliated practitioner.
Obstetricians began doing circumcisions for 2 reasons. First, obstetricians are surgically trained whereas pediatricians are not. It was therefore thought to be more appropriate for obstetricians to do this minor surgical procedure. Second, circumcisions used to be done right in the delivery room shortly after delivery. It was thought that the crying induced by performing the circumcision helped clear the baby’s lungs and invigorated sluggish babies. Now, however, in-hospital circumcisions are usually done in the days following delivery, after the baby has had the opportunity to undergo his first physical examination to make sure that all is well and that the penile anatomy is normal.
Clinician experience, proper protocol contribute to a safe procedure
In the United States, a large percentage of male infants are circumcised. Although circumcision has known medical benefits, the procedure generally is performed for family, religious, or cultural reasons. Circumcision is a safe and straightforward procedure but has its risks and potential complications. As with most surgeries, the best outcomes are achieved by practitioners who are well trained, who perform the procedure under supervision until their experience is sufficient, and who follow correct protocol during the entire operation.
Share your thoughts! Send your Letter to the Editor to [email protected]. Please include your name and the city and state in which you practice.
- Dallas ME. The 10 most common surgeries in the US. Healthgrades website. https://www.healthgrades.com/explore/the-10-most-common-surgeries-in-the-us. Reviewed August 15, 2017. Accessed October 2, 2017.
- Laumann EO, Masi CM, Zuckerman EW. Circumcision in the United States: prevalence, prophylactic effects, and sexual practice. JAMA. 1997;277(13):1052–1057.
- American Academy of Pediatrics Task Force on Circumcision. Male circumcision. Pediatrics. 2012;130(3):e756–e785.
- American Academy of Pediatrics Task Force on Circumcision. Circumcision policy statement. Pediatrics. 2012;130(3):585–586.
- Morris BJ, Krieger JN. Does male circumcision affect sexual function, sensitivity, or satisfaction? A systematic review. J Sex Med. 2013;10(11):2644–2657.
- Howard FM, Howard CR, Fortune K, Generelli P, Zolnoun D, tenHoopen C. A randomized, placebo-controlled comparison of EMLA and dorsal penile nerve block for pain relief during neonatal circumcision. Prim Care Update Ob Gyns. 1998;5(4):196.
- Taddio A, Stevens B, Craig K, et al. Efficacy and safety of lidocaine-prilocaine cream for pain during circumcision. N Engl J Med. 1997;336(17):1197–1201.
- Lander J, Brady-Fryer B, Metcalfe JB, Nazarali S, Muttitt S. Comparison of ring block, dorsal penile nerve block, and topical anesthesia for neonatal circumcision: a randomized controlled trial. JAMA. 1997;278(24):2157–2162.
- Hardwick-Smith S, Mastrobattista JM, Wallace PA, Ritchey ML. Ring block for neonatal circumcision. Obstet Gynecol. 1998;91(6):930–934.
- Kaufman GE, Cimo S, Miller LW, Blass EM. An evaluation of the effects of sucrose on neonatal pain with 2 commonly used circumcision methods. Am J Obstet Gynecol. 2002;186(3):564–568.
- Tucker SC, Cerqueiro J, Sterne GD, Bracka A. Circumcision: a refined technique and 5 year review. Ann R Coll Surg Engl. 2001;83(2):121–125.
- Fraser ID, Tjoe J. Circumcision using bipolar scissors can be a safe and simple operation. Ann R Coll Surg Engl. 2000;82(3):190–191.
- Wiswell TE, Geschke DW. Risks from circumcision during the first month of life compared with those for uncircumcised boys. Pediatrics. 1989;83(6):1011–1015.

Choosing location after discharge wisely
Of all the care decisions we make during a hospital stay, perhaps the one with the biggest implications for cost and quality is the one determining the location to which we send the patient after discharge.
Yet ironically, we haven’t typically participated in this decision, but instead have left it up to case managers and others to work with patients to determine discharge location. This is a missed opportunity, as patients first look to their doctor for guidance on this decision. Absent such guidance, they turn to other care team members for the conversation. With a principal focus on hospital length of stay, we have prioritized when patients are ready to leave over where they go after they leave.

In terms of cost during hospitalization and for the 30 days after discharge, for common conditions such as pneumonia, heart failure, COPD, or major joint replacement, Medicare spends nearly as much on postacute care – home health, skilled nursing facilities, inpatient rehabilitation, long-term acute care hospitals – as for hospital care.1 Further, an Institute of Medicine analysis showed that geographic variation in postacute care spending is responsible for three-quarters of all variation in Medicare spending.2 Such variation raises questions about the rigor with which postacute care decisions are made by hospital teams.
Perhaps most striking of all, hospitalist care (versus that of traditional primary care providers) has been associated with excess discharge rates to skilled nursing facilities, and savings that accrue under hospitalists during hospitalization are more than outweighed by spending on care during the postacute period.3
All of this leads me to my point: Hospitalists and inpatient teams need a defined process for selecting the most appropriate discharge location. Such a location should ideally be the least restrictive location suitable for a patient’s needs. In the box below, I propose a framework for the process. The domains listed in the box should be evaluated and discussed by the team, with early input and final approval by the patient and caregiver(s). The domains listed are not intended to be an exhaustive list, but rather to serve as the basis for discussion during discharge team rounds.
Identifying patient factors informing an optimal discharge location may represent a new skill set for many hospitalists and underscores the value of collaboration with team members who can provide needed information. In April, the Society of Hospital Medicine published the Revised Core Competencies in Hospital Medicine. In the Care of the Older Patient section, the authors state that hospitalists should be able to “describe postacute care options that can enable older patients to regain functional capacity.”4 Inherent in this competency is an understanding of not only patient factors in postacute care location decisions, but also the differing capabilities of home health agencies, skilled nursing facilities, inpatient rehabilitation facilities, and long-term acute care hospitals.
Dr. Whitcomb is chief medical officer at Remedy Partners in Darien, Conn., and cofounder and past president of the Society of Hospital Medicine. Contact him at [email protected].
References
1. Mechanic R. Post-acute care – the next frontier for controlling Medicare spending. N Engl J Med. 2014;370:692-4.
2. Newhouse JP, et al. Geographic variation in Medicare services. N Engl J Med. 2013;368:1465-8.
3. Kuo YF, et al. Association of hospitalist care with medical utilization after discharge: evidence of cost shift from a cohort study. Ann Intern Med. 2011;155(3):152-9.
4. Nichani S, et al. Core Competencies in Hospital Medicine 2017 Revision. Section 3: Healthcare Systems. J Hosp Med. 2017 April;12(1):S55-S82.
Framework for Selecting Appropriate Discharge Location
Patient Independence
- Can the patient perform activities of daily living?
- Can the patient ambulate?
- Is there cognitive impairment?
Caregiver Availability
- If the patient needs it, is a caregiver who is capable and reliable available? If so, to what extent is s/he available?
Therapy Needs
- Does the patient require PT, OT, and/or ST?
- How much and for how long?
Skilled Nursing Needs
- What, if anything, does the patient require in this area? For example, a new PEG tube, wound care, IV therapies, etc.
Social Factors
- Is there access to transportation, food, and safe housing?
Home Factors
- Are there stairs to enter the house or to get to the bedroom or bathroom?
- Has the home been modified to accommodate special needs? Is the home inhabitable?
Of all the care decisions we make during a hospital stay, perhaps the one with the biggest implications for cost and quality is the one determining the location to which we send the patient after discharge.
Yet ironically, we haven’t typically participated in this decision, but instead have left it up to case managers and others to work with patients to determine discharge location. This is a missed opportunity, as patients first look to their doctor for guidance on this decision. Absent such guidance, they turn to other care team members for the conversation. With a principal focus on hospital length of stay, we have prioritized when patients are ready to leave over where they go after they leave.
In terms of cost during hospitalization and for the 30 days after discharge, for common conditions such as pneumonia, heart failure, COPD, or major joint replacement, Medicare spends nearly as much on postacute care – home health, skilled nursing facilities, inpatient rehabilitation, long-term acute care hospitals – as for hospital care.1 Further, an Institute of Medicine analysis showed that geographic variation in postacute care spending is responsible for three-quarters of all variation in Medicare spending.2 Such variation raises questions about the rigor with which postacute care decisions are made by hospital teams.
Perhaps most striking of all, hospitalist care (versus that of traditional primary care providers) has been associated with excess discharge rates to skilled nursing facilities, and savings that accrue under hospitalists during hospitalization are more than outweighed by spending on care during the postacute period.3
All of this leads me to my point: Hospitalists and inpatient teams need a defined process for selecting the most appropriate discharge location. Such a location should ideally be the least restrictive location suitable for a patient’s needs. In the box below, I propose a framework for the process. The domains listed in the box should be evaluated and discussed by the team, with early input and final approval by the patient and caregiver(s). The domains listed are not intended to be an exhaustive list, but rather to serve as the basis for discussion during discharge team rounds.
Identifying patient factors informing an optimal discharge location may represent a new skill set for many hospitalists and underscores the value of collaboration with team members who can provide needed information. In April, the Society of Hospital Medicine published the Revised Core Competencies in Hospital Medicine. In the Care of the Older Patient section, the authors state that hospitalists should be able to “describe postacute care options that can enable older patients to regain functional capacity.”4 Inherent in this competency is an understanding of not only patient factors in postacute care location decisions, but also the differing capabilities of home health agencies, skilled nursing facilities, inpatient rehabilitation facilities, and long-term acute care hospitals.
Dr. Whitcomb is chief medical officer at Remedy Partners in Darien, Conn., and cofounder and past president of the Society of Hospital Medicine. Contact him at [email protected].
References
1. Mechanic R. Post-acute care – the next frontier for controlling Medicare spending. N Engl J Med. 2014;370:692-4.
2. Newhouse JP, et al. Geographic variation in Medicare services. N Engl J Med. 2013;368:1465-8.
3. Kuo YF, et al. Association of hospitalist care with medical utilization after discharge: evidence of cost shift from a cohort study. Ann Intern Med. 2011;155(3):152-9.
4. Nichani S, et al. Core Competencies in Hospital Medicine 2017 Revision. Section 3: Healthcare Systems. J Hosp Med. 2017 April;12(1):S55-S82.
Framework for Selecting Appropriate Discharge Location
Patient Independence
- Can the patient perform activities of daily living?
- Can the patient ambulate?
- Is there cognitive impairment?
Caregiver Availability
- If the patient needs it, is a caregiver who is capable and reliable available? If so, to what extent is s/he available?
Therapy Needs
- Does the patient require PT, OT, and/or ST?
- How much and for how long?
Skilled Nursing Needs
- What, if anything, does the patient require in this area? For example, a new PEG tube, wound care, IV therapies, etc.
Social Factors
- Is there access to transportation, food, and safe housing?
Home Factors
- Are there stairs to enter the house or to get to the bedroom or bathroom?
- Has the home been modified to accommodate special needs? Is the home inhabitable?
New and Noteworthy Information—January 2018
Sleep Improves After Retirement
Transition to statutory retirement is associated with a decrease in sleep difficulties, especially waking up too early in the morning and nonrestorative sleep, according to a study published online ahead of print November 16, 2017, in Sleep. The study included 5,807 public sector employees who retired between 2000 and 2011. Participants were administered the Jenkins Sleep Problem Scale Questionnaire before and after retirement in surveys conducted every four years. At the last study wave before retirement, 30% of the participants had sleep difficulties. The risk ratio for having sleep difficulties in the first study wave following retirement, compared with the last study wave preceding retirement, was 0.89. The decreases in sleep difficulties occurred primarily among people with psychologic distress, suboptimal self-rated health, short sleep duration, and job strain before retirement.
Myllyntausta S, Salo P, Kronholm E, et al. Changes in sleep difficulties during the transition to statutory retirement. Sleep. 2017 Nov 16 [Epub ahead of print].
Vigorous Exercise May Delay Parkinson’s Disease Progression
High-intensity treadmill exercise may be feasible and prescribed safely for patients with Parkinson’s disease, according to a study published online ahead of print December 11, 2017, in JAMA Neurology. The randomized clinical trial included 128 participants between ages 40 and 80. Participants were at an early stage of the disease and not taking Parkinson’s disease medication. Investigators randomized the population to high-intensity exercise, moderate-intensity exercise, or a control condition. At baseline and six months, clinicians assessed the participants using the Unified Parkinson’s Disease Rating Scale (UPDRS). Participants in the study had a UPDRS score of about 20 at baseline. At six months, the high-intensity group’s score stayed at 20, and the moderate exercise group worsened by 1.5 points. The control group’s score worsened by three points.
Schenkman M, Moore CG, Kohrt WM, et al. Effect of high-intensity treadmill exercise on motor symptoms in patients with de novo Parkinson disease: a phase 2 randomized clinical trial. JAMA Neurol. 2017 Dec 11 [Epub ahead of print].
Can Exposure to Terror Raise the Risk of Headache?
Exposure to terror increases the risk of persistent weekly and daily migraine and tension-type headache in adolescent survivors above expected levels, according to a study published online ahead of print December 13, 2017, in Neurology. Investigators interviewed 213 survivors of a terror attack in Norway. Half were male, the mean age was 17.7, and 13 survivors were severely injured. Participants provided information about their headache frequency four to five months after the attack. For each survivor, eight matched controls were drawn from the Young-HUNT3 Study. After exposure to terror, the odds ratio for migraine was 4.27, and that for tension-type headache was 3.39, as estimated in multivariable logistic regression models adjusted for injury, sex, age, family structure and economy, prior exposure to physical or sexual violence, and psychologic distress.
Stensland SØ, Zwart JA, Wentzel-Larsen T, Dyb G. The headache of terror: a matched cohort study of adolescents from the Utøya and the HUNT Study. Neurology. 2017 Dec 13 [Epub ahead of print].
Diet Reduces Disability and Symptoms of MS
A healthy diet and a composite healthy lifestyle are associated with less disability and symptom burden in multiple sclerosis (MS), according to a study published online ahead of print December 6, 2017, in Neurology. The study involved 6,989 people with MS who completed questionnaires about their diet as part of the North American Research Committee registry. The questionnaire estimated intake of fruits, vegetables and legumes, whole grains, added sugars, and red and processed meats. Researchers constructed an overall diet quality score for each individual based on the food groups. Participants with diet quality scores in the highest quintile had lower levels of disability and lower depression scores. Individuals reporting a composite healthy lifestyle had lower odds of reporting severe fatigue, depression, pain, or cognitive impairment.
Fitzgerald KC, Tyry T, Salter A, et al. Diet quality is associated with disability and symptom severity in multiple sclerosis. Neurology. 2017 Dec 6 [Epub ahead of print].
What Are the Effects of Childhood Convulsive Status Epilepticus?
Childhood convulsive status epilepticus (CSE) is associated with substantial long-term neurologic morbidity, but primarily in people who have epilepsy, neurologic abnormalities, or both before the episode of CSE, according to a study published online ahead of print December 5, 2017, in Lancet Child & Adolescent Health. Researchers followed a population-based childhood CSE cohort. Of 203 survivors, 134 were assessed at a median follow-up of 8.9 years. Lasting neurologic conditions, including epilepsy, learning disabilities, and movement problems, were more common among participants than expected for children from the general population. Children who had existing neurologic or developmental issues at the time of CSE were more likely to have a neurologic problem at follow-up. Children without a neurologic or developmental issue tended to have better outcomes.
Pujar SS, Martinos MM, Cortina-Borja M, et al. Long-term prognosis after childhood convulsive status epilepticus: a prospective cohort study. Lancet Child Adolesc Health. 2017 Dec 5 [Epub ahead of print].
Protein Aggregation May Not Affect Cognition in Parkinson’s Disease
Patterns of cortical β-amyloid and tau do not differ between people with Parkinson’s disease who are cognitively normal (PD-CN), people with Parkinson’s disease with mild cognitive impairment (PD-MCI), and healthy older adults, according to a study published online ahead of print December 11, 2017, in JAMA Neurology. This cross-sectional study included 29 patients with Parkinson’s disease from a tertiary care medical center and research institutions. Imaging measures were compared with those of 49 healthy control participants. Outcomes were tau PET measurements of groups of patients with PD-CN and PD-MCI. Of the participants, 47 were female, and the mean age was 71.1. Voxelwise contrasts of whole-brain tau PET uptake between patients with PD-CN and patients with PD-MCI, and between patients with Parkinson’s disease and β-amyloid-negative controls, did not reveal significant differences.
Winer JR, Maass A, Pressman P, et al. Associations between tau, β-amyloid, and cognition in Parkinson disease. JAMA Neurol. 2017 Dec 11 [Epub ahead of print].
Hormone Therapy Not Linked to Increased Stroke Risk
Postmenopausal hormone therapy is not associated with increased risk of stroke, provided that it is started early, according to a study published November 17 in PLoS Medicine. Researchers analyzed data on postmenopausal hormone therapy from five cohort studies including 88,914 women, combined with data from national registries on diagnoses and causes of death during a follow-up period. During a median follow-up of 14.3 years, 6,371 first-time stroke events (1,080 hemorrhagic) were recorded. Hormone therapy was not linked to increased risk of stroke if the therapy was initiated within five years of menopausal onset, regardless of means of administration, type of therapy, active substance, and treatment duration. In subanalyses, researchers observed an increase in risk for hemorrhagic stroke if the therapy contained the active substance conjugated equine estrogens.
Carrasquilla GD, Frumento P, Berglund A, et al. Postmenopausal hormone therapy and risk of stroke: a pooled analysis of data from population-based cohort studies. PLoS Med. 2017;14(11):e1002445.
Restless Sleep May Be Linked to Parkinson’s Disease
In patients with idiopathic REM sleep behavior disorder (IRBD), PET shows increased microglial activation in the substantia nigra, along with reduced dopaminergic function in the putamen, according to a study published in the October 2017 issue of Lancet Neurology. This prospective, case–control PET study included 20 patients with IRBD and no clinical evidence of parkinsonism and cognitive impairment recruited from tertiary sleep centers and 19 healthy controls. 11C-PK11195 binding was increased on the left side of the substantia nigra in patients with IRBD, compared with controls, but not on the right side. 11C-PK11195 binding was not significantly increased in the putamen and caudate of patients with IRBD. 18F-DOPA uptake was reduced in IRBD in the left putamen and right putamen, but not in the caudate.
Stokholm MG, Iranzo A, Østergaard K, et al. Assessment of neuroinflammation in patients with idiopathic rapid-eye-movement sleep behaviour disorder: a case-control study. Lancet Neurol. 2017;16(10):789-796.
Can Playing Video Games Benefit the Brains of Older Adults?
Playing 3D video games may prevent mild cognitive impairment and, perhaps, Alzheimer’s disease, according to a study published December 6, 2017, in PLoS One. In two separate studies, adults in their 20s played 3D video games on platforms such as Super Mario 64. The gray matter in their hippocampus increased after training. Researchers examined whether the results could be replicated in healthy seniors. Thirty-three people, ages 55 to 75, were randomly assigned to one of three groups. The video game experimental group engaged in 3D-platform video game training over six months. An active control group took a series of self-directed, computerized piano lessons, and a no-contact control group did not engage in any intervention. Participants in the video-game cohort had increases in gray matter volume in the hippocampus and cerebellum. Their short-term memory also improved.
West GL, Zendel BR, Konishi K, et al. Playing Super Mario 64 increases hippocampal grey matter in older adults. PLoS One. 2017;12(12):e0187779.
FDA Approves Vercise Deep Brain Stimulation System
The FDA has approved the Vercise Deep Brain Stimulation System (DBS) to treat symptoms of Parkinson’s disease. The approval is based on the INTREPID study, a multicenter, prospective, double-blind, randomized, sham-controlled trial of DBS for Parkinson’s disease in the US. The study evaluated the system’s safety and efficacy in 292 patients at 23 sites. The Vercise DBS System successfully met its primary end point of mean change in waking hours with good symptom control. The filing also was supported by safety data from the VANTAGE study, in which 40 patients treated with the system demonstrated a 63% improvement in motor function at 52 weeks from baseline, as measured by the Unified Parkinson’s Disease Rating Scale III. Boston Scientific markets Vercise.
Can Social Relationships Aid Cognitive Function?
Although superagers (ie, people older than 80 with episodic memory as good as that of a middle-aged adult) and their cognitively average-for-age peers report similarly high levels of psychological well-being, superagers demonstrate greater levels of positive social relationships, according to a study published October 23, 2017, in PLoS One. Thirty-one superagers and 19 cognitively average-for-age peers completed the Ryff 42-item Psychological Well-Being questionnaire, which includes subscales of autonomy, positive relations with others, environmental mastery, personal growth, purpose in life, and self-acceptance. The groups did not differ on demographic factors, including estimated premorbid intelligence. Compared with cognitively average-for-age peers, superagers endorsed greater levels of positive relations with others. Superagers had a median overall score of 40 in positive relations with others, compared with 36 in the control group.
Cook Maher A, Kielb S, Loyer E, et al. Psychological well-being in elderly adults with extraordinary episodic memory. PLoS One. 2017;12(10):e0186413.
—Kimberly Williams

MRI Reveals Lymphatic Vessels in Dura
Researchers have visualized lymphatic vessels in the dura mater of humans on MRI, according to a short report published October 3, 2017, in eLife. They also have identified lymphatic vessels in brain tissue samples using immunostaining. The results suggest that the vessels could act as a pipeline between the brain and the immune system.
“Overall, our data clearly and consistently demonstrate the existence of lymphatic vessels within the dura mater of human and nonhuman primates,” said Daniel S. Reich, MD, PhD, Senior Investigator at the NINDS, and colleagues. “The ability to image the meningeal lymphatics noninvasively immediately suggests the possibility of studying potential abnormalities” in neurologic disorders, they said.

A Fundamental Shift
In most of the body, lymphatic vessels transport immune cells and waste products from organs to the bloodstream, but the brain was thought not to have lymphatic vessels. In 2015, however, researchers found evidence of the brain’s lymphatic system in the dura of mice. Dr. Reich saw a presentation by an author of one the mouse studies, Jonathan Kipnis, PhD, Chair of the Department of Neuroscience at the University of Virginia in Charlottesville, and “was completely surprised.”
“In medical school, we were taught that the brain has no lymphatic system,” Dr. Reich said. “After Dr. Kipnis’s talk, I thought maybe we could find it in human brains.”
Dr. Reich and colleagues scanned the brains of five healthy volunteers who had been injected with gadobutrol, a dye used during MRI scans to visualize brain blood vessels. Gadobutrol that had leaked out of blood vessels in the dura as part of a normal process collected inside lymphatic vessels in the dura and showed up as bright white lines on MRI. “We watched people’s brains drain fluid into these vessels,” said Dr. Reich. When they repeated the experiment using a different dye that leaks much less out of blood vessels (ie, gadofosveset), the lymphatic vessels did not appear on imaging.
Similar findings were observed in monkeys.
The lymphatic vessels had been difficult to identify because they resemble blood vessels, which are far more numerous, the researchers said.
“These results could fundamentally change the way we think about how the brain and immune system interrelate,” said Walter J. Koroshetz, MD, NINDS director.
Meningeal Lymphatic Network
MRI showed collection of interstitial gadolinium within dural lymphatic vessels in all five of the healthy volunteers (ages 28 to 53, three women) and all three of the common marmoset monkeys studied. The vessels had a maximum apparent diameter of approximately 1 mm. “Our results suggest that in the dura, similar to many other organs throughout the body, small intravascular molecules extravasate into the interstitium and then, under a hydrostatic pressure gradient, collect into lymphatic capillaries through a loose lymphatic endothelium,” the researchers said. “On 3D rendering of subtraction MRI images, dural lymphatics are seen running parallel to the dural venous sinuses, especially the superior sagittal and straight sinuses, and alongside branches of the middle meningeal artery. The topography of the meningeal lymphatics fits with the previously described network in rodents.”

Although MRI shows large, slow-flow lymphatic ducts, “blind-ending and small lymphatic capillaries, clearly seen by histopathology, are unlikely to be revealed by MRI,” the researchers noted. In addition, they “could not prove whether dural lymphatic vessels drain immune cells, CSF, or other substances from the brain to deep cervical lymph nodes” or assess any link with the glymphatic system. “A comprehensive map of the meningeal lymphatic network would have implications for unraveling the ways in which the meningeal lymphatics participate in waste clearance and in immune cell trafficking within the CNS,” the researchers said.
Neuropathologic evaluation focused on dura samples from two formalin-fixed brains (from patients ages 60 and 77 with longstanding progressive multiple sclerosis) and from a 33-year-old patient with refractory epilepsy undergoing anterior temporal lobectomy.
Future studies may examine the role that dural lymphatics play in inflammatory pathologic conditions. The researchers have observed “clusters of extravascular CD3+ lymphocytes and CD68+ phagocytic meningeal macrophages … in the dura of several multiple sclerosis autopsies, confirming intense immune cell trafficking and communication.” Furthermore, “lymphatic dysfunction might impair waste clearance in neurodegenerative diseases and aging, in line with the recently captured deposition of β-amyloid in human dura in elderly people,” the researchers said.
—Jake Remaly
Suggested Reading
Absinta M, Ha SK, Nair G, et al. Human and nonhuman primate meninges harbor lymphatic vessels that can be visualized noninvasively by MRI. Elife. 2017 Oct 3;6:e29738.
Researchers have visualized lymphatic vessels in the dura mater of humans on MRI, according to a short report published October 3, 2017, in eLife. They also have identified lymphatic vessels in brain tissue samples using immunostaining. The results suggest that the vessels could act as a pipeline between the brain and the immune system.
“Overall, our data clearly and consistently demonstrate the existence of lymphatic vessels within the dura mater of human and nonhuman primates,” said Daniel S. Reich, MD, PhD, Senior Investigator at the NINDS, and colleagues. “The ability to image the meningeal lymphatics noninvasively immediately suggests the possibility of studying potential abnormalities” in neurologic disorders, they said.
A Fundamental Shift
In most of the body, lymphatic vessels transport immune cells and waste products from organs to the bloodstream, but the brain was thought not to have lymphatic vessels. In 2015, however, researchers found evidence of the brain’s lymphatic system in the dura of mice. Dr. Reich saw a presentation by an author of one the mouse studies, Jonathan Kipnis, PhD, Chair of the Department of Neuroscience at the University of Virginia in Charlottesville, and “was completely surprised.”
“In medical school, we were taught that the brain has no lymphatic system,” Dr. Reich said. “After Dr. Kipnis’s talk, I thought maybe we could find it in human brains.”
Dr. Reich and colleagues scanned the brains of five healthy volunteers who had been injected with gadobutrol, a dye used during MRI scans to visualize brain blood vessels. Gadobutrol that had leaked out of blood vessels in the dura as part of a normal process collected inside lymphatic vessels in the dura and showed up as bright white lines on MRI. “We watched people’s brains drain fluid into these vessels,” said Dr. Reich. When they repeated the experiment using a different dye that leaks much less out of blood vessels (ie, gadofosveset), the lymphatic vessels did not appear on imaging.
Similar findings were observed in monkeys.
The lymphatic vessels had been difficult to identify because they resemble blood vessels, which are far more numerous, the researchers said.
“These results could fundamentally change the way we think about how the brain and immune system interrelate,” said Walter J. Koroshetz, MD, NINDS director.
Meningeal Lymphatic Network
MRI showed collection of interstitial gadolinium within dural lymphatic vessels in all five of the healthy volunteers (ages 28 to 53, three women) and all three of the common marmoset monkeys studied. The vessels had a maximum apparent diameter of approximately 1 mm. “Our results suggest that in the dura, similar to many other organs throughout the body, small intravascular molecules extravasate into the interstitium and then, under a hydrostatic pressure gradient, collect into lymphatic capillaries through a loose lymphatic endothelium,” the researchers said. “On 3D rendering of subtraction MRI images, dural lymphatics are seen running parallel to the dural venous sinuses, especially the superior sagittal and straight sinuses, and alongside branches of the middle meningeal artery. The topography of the meningeal lymphatics fits with the previously described network in rodents.”
Although MRI shows large, slow-flow lymphatic ducts, “blind-ending and small lymphatic capillaries, clearly seen by histopathology, are unlikely to be revealed by MRI,” the researchers noted. In addition, they “could not prove whether dural lymphatic vessels drain immune cells, CSF, or other substances from the brain to deep cervical lymph nodes” or assess any link with the glymphatic system. “A comprehensive map of the meningeal lymphatic network would have implications for unraveling the ways in which the meningeal lymphatics participate in waste clearance and in immune cell trafficking within the CNS,” the researchers said.
Neuropathologic evaluation focused on dura samples from two formalin-fixed brains (from patients ages 60 and 77 with longstanding progressive multiple sclerosis) and from a 33-year-old patient with refractory epilepsy undergoing anterior temporal lobectomy.
Future studies may examine the role that dural lymphatics play in inflammatory pathologic conditions. The researchers have observed “clusters of extravascular CD3+ lymphocytes and CD68+ phagocytic meningeal macrophages … in the dura of several multiple sclerosis autopsies, confirming intense immune cell trafficking and communication.” Furthermore, “lymphatic dysfunction might impair waste clearance in neurodegenerative diseases and aging, in line with the recently captured deposition of β-amyloid in human dura in elderly people,” the researchers said.
—Jake Remaly
Suggested Reading
Absinta M, Ha SK, Nair G, et al. Human and nonhuman primate meninges harbor lymphatic vessels that can be visualized noninvasively by MRI. Elife. 2017 Oct 3;6:e29738.
Massachusetts named healthiest state for 2017
A year of surprises ended with one more bit of unexpected news:
Massachusetts’ win may have knocked Hawaii out of the top spot for the first time since 2011, but the Aloha State was still second out of 50 in 2017. Two other New England states were in the top five: Vermont in third and Connecticut in fifth, with Utah sandwiched between them in fourth, the United Health Foundation said in its latest report.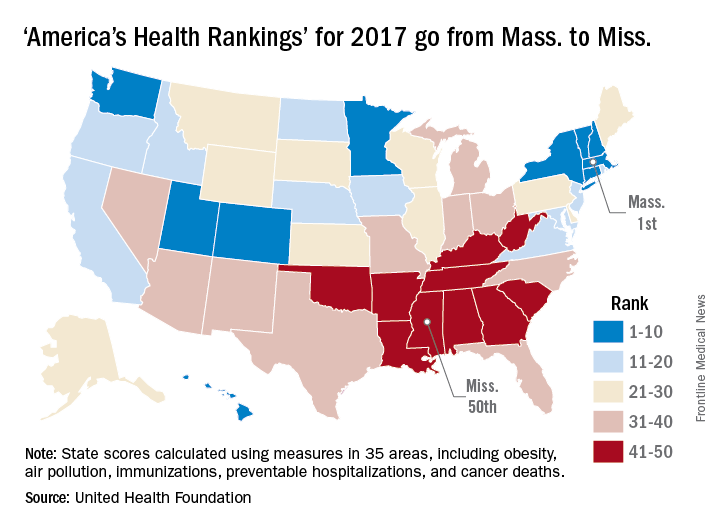
The report ranks states using 35 measures in five broad areas: behaviors, community and environment, policy, clinical care, and outcomes. The measures include drug-related death rate, percentage of children in poverty, public health funding per person, mental health provider rate, and diabetes rate.
“America’s Health Rankings” is funded entirely by the private, not-for-profit United Health Foundation, founded by UnitedHealth Group, which operates UnitedHealthcare.