User login
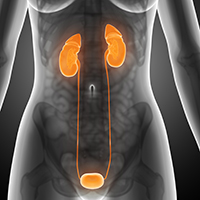
Is mannitol a good alternative agent for evaluating ureteral patency after gynecologic surgery?
EXPERT COMMENTARY
Although the incidence of lower urinary tract and ureteral injury following gynecologic surgery is low, intraoperative identification of ureteral patency can prevent serious long-term sequelae. Since the indigo carmine shortage in 2014, US surgeons have searched for multiple alternative agents. Intravenous methylene blue is suboptimal due to its systemic adverse effects and the length of time for dye excretion in the urine.
Grimes and colleagues conducted a study to determine if there was any significant difference in surgeon satisfaction among 4 different alternatives to indigo carmine for intraoperative ureteral patency evaluation.
Related article:
Farewell to indigo carmine
Details of the study
The investigators conducted a randomized clinical trial of 130 women undergoing benign gynecologic or pelvic reconstructive surgery. Four different regimens were used for intraoperative ureteral evaluation: 1) oral phenazopyridine 200 mg, 2) intravenous sodium fluorescein 25 mg, 3) mannitol bladder distention, and 4) normal saline bladder distention.
Study outcomes. The primary outcome was surgeon satisfaction based on a 0 to 100 point visual analog scale rating (with 0 indicating strong agreement, 100 indicating disagreement). Secondary outcomes included ease of ureteral jet visualization, time to surgeon confidence of ureteral patency, and occurrence of adverse events over 6 weeks.
Surgeon satisfaction rating. The investigators found statistically significant physician satisfaction with the use of mannitol as a bladder distention medium over oral phenazopyridine, and slightly better satisfaction compared with the use of intravenous sodium fluorescein or normal saline distention. The median (range) visual analog scores for ureteral patency were phenazopyridine, 48 (0–83); sodium fluorescein 20 (0–82); mannitol, 0 (0–44); and normal saline, 23 (3–96) (P<.001).
There was no difference across the 4 groups in the timing to surgeon confidence of ureteral patency, length of cystoscopy (on average, 3 minutes), and development of postoperative urinary tract infections (UTIs).
Most dissatisfaction related to phenazopyridine is the fact that the resulting orange-stained urine can obscure the bladder mucosa.
One significant adverse event was a protocol deviation in which 1 patient received an incorrect dose of IV sodium fluorescein (500 mg) instead of the recommended 25-mg dose.
Related article:
Alternative options for visualizing ureteral patency during intraoperative cystoscopy
Study strengths and weaknesses
The strength of this study is in its randomized design and power. Its major weakness is surgeon bias, since the surgeons could not possibly be blinded to the method used.
The study confirms the problem that phenazopyridine makes the urine so orange that bladder mucosal lesions and de novo hematuria could be difficult to detect. Recommending mannitol as a hypertonic distending medium (as it is used in hysteroscopy procedures), however, may be premature. Prior studies have shown increased postoperative UTIs when 50% and 10% dextrose was used versus normal saline for cystoscopy.1,2 Since the Grimes study protocol did not include postoperative urine collection for cultures, more research on UTIs after mannitol use would be needed before surgeons confidently could use it routinely.
In our practice, surgeons prefer that intravenous sodium fluorescein be administered just prior to cystoscopy and oral phenazopyridine en route to the operating room. I agree that a major disadvantage to phenazopyridine is the heavy orange staining that obscures visualization.
Finally, this study did not account for cost of the various methods; standard normal saline would be cheapest, followed by phenazopyridine.
This study showed that surgeon satisfaction was greatest with the use of mannitol as a distending medium for intraoperative evaluation of ureteral patency compared with oral phenazopyridine, intravenous sodium fluorescein, and normal saline distention. However, time to surgeon confidence of ureteral patency was similar with all 4 methods. More data are needed related to UTIs and the cost of mannitol compared with the other 3 methods.
-- Cheryl B. Iglesia, MD
Share your thoughts! Send your Letter to the Editor to [email protected]. Please include your name and the city and state in which you practice.
- Narasimhulu DM, Prabakar C, Tang N, Bral P. 50% dextrose versus normal saline as distention media during cystoscopy for assessment of ureteric patency. Eur J Obstet Gynecol Reprod Biol. 2016;199:38–41.
- Siff LN, Unger CA, Jelovsek JE, Paraiso MF, Ridgeway BM, Barber MD. Assessing ureteral patency using 10% dextrose cystoscopy fluid: evaluation of urinary tract infection rates. Am J Obstet Gynecol. 2016;215(1):74.e1–e6.
EXPERT COMMENTARY
Although the incidence of lower urinary tract and ureteral injury following gynecologic surgery is low, intraoperative identification of ureteral patency can prevent serious long-term sequelae. Since the indigo carmine shortage in 2014, US surgeons have searched for multiple alternative agents. Intravenous methylene blue is suboptimal due to its systemic adverse effects and the length of time for dye excretion in the urine.
Grimes and colleagues conducted a study to determine if there was any significant difference in surgeon satisfaction among 4 different alternatives to indigo carmine for intraoperative ureteral patency evaluation.
Related article:
Farewell to indigo carmine
Details of the study
The investigators conducted a randomized clinical trial of 130 women undergoing benign gynecologic or pelvic reconstructive surgery. Four different regimens were used for intraoperative ureteral evaluation: 1) oral phenazopyridine 200 mg, 2) intravenous sodium fluorescein 25 mg, 3) mannitol bladder distention, and 4) normal saline bladder distention.
Study outcomes. The primary outcome was surgeon satisfaction based on a 0 to 100 point visual analog scale rating (with 0 indicating strong agreement, 100 indicating disagreement). Secondary outcomes included ease of ureteral jet visualization, time to surgeon confidence of ureteral patency, and occurrence of adverse events over 6 weeks.
Surgeon satisfaction rating. The investigators found statistically significant physician satisfaction with the use of mannitol as a bladder distention medium over oral phenazopyridine, and slightly better satisfaction compared with the use of intravenous sodium fluorescein or normal saline distention. The median (range) visual analog scores for ureteral patency were phenazopyridine, 48 (0–83); sodium fluorescein 20 (0–82); mannitol, 0 (0–44); and normal saline, 23 (3–96) (P<.001).
There was no difference across the 4 groups in the timing to surgeon confidence of ureteral patency, length of cystoscopy (on average, 3 minutes), and development of postoperative urinary tract infections (UTIs).
Most dissatisfaction related to phenazopyridine is the fact that the resulting orange-stained urine can obscure the bladder mucosa.
One significant adverse event was a protocol deviation in which 1 patient received an incorrect dose of IV sodium fluorescein (500 mg) instead of the recommended 25-mg dose.
Related article:
Alternative options for visualizing ureteral patency during intraoperative cystoscopy
Study strengths and weaknesses
The strength of this study is in its randomized design and power. Its major weakness is surgeon bias, since the surgeons could not possibly be blinded to the method used.
The study confirms the problem that phenazopyridine makes the urine so orange that bladder mucosal lesions and de novo hematuria could be difficult to detect. Recommending mannitol as a hypertonic distending medium (as it is used in hysteroscopy procedures), however, may be premature. Prior studies have shown increased postoperative UTIs when 50% and 10% dextrose was used versus normal saline for cystoscopy.1,2 Since the Grimes study protocol did not include postoperative urine collection for cultures, more research on UTIs after mannitol use would be needed before surgeons confidently could use it routinely.
In our practice, surgeons prefer that intravenous sodium fluorescein be administered just prior to cystoscopy and oral phenazopyridine en route to the operating room. I agree that a major disadvantage to phenazopyridine is the heavy orange staining that obscures visualization.
Finally, this study did not account for cost of the various methods; standard normal saline would be cheapest, followed by phenazopyridine.
This study showed that surgeon satisfaction was greatest with the use of mannitol as a distending medium for intraoperative evaluation of ureteral patency compared with oral phenazopyridine, intravenous sodium fluorescein, and normal saline distention. However, time to surgeon confidence of ureteral patency was similar with all 4 methods. More data are needed related to UTIs and the cost of mannitol compared with the other 3 methods.
-- Cheryl B. Iglesia, MD
Share your thoughts! Send your Letter to the Editor to [email protected]. Please include your name and the city and state in which you practice.
- Narasimhulu DM, Prabakar C, Tang N, Bral P. 50% dextrose versus normal saline as distention media during cystoscopy for assessment of ureteric patency. Eur J Obstet Gynecol Reprod Biol. 2016;199:38–41.
- Siff LN, Unger CA, Jelovsek JE, Paraiso MF, Ridgeway BM, Barber MD. Assessing ureteral patency using 10% dextrose cystoscopy fluid: evaluation of urinary tract infection rates. Am J Obstet Gynecol. 2016;215(1):74.e1–e6.
Commentary—Study Heightens Awareness, But at What Cost?
The study conducted by Brookmeyer and colleagues is a logical and thoughtful attempt to size the potential impact of Alzheimer's disease now and in the future, updating old-technology estimates based on actual diagnoses with new technologically derived diagnoses of preclinical neurodegenerative states. They acknowledge that the uncertainty in the actual disease burden we will face is centered on the question of conversion rates, which vary between studies and are far less certain in the preclinical stages than the symptomatic ones.
Scientific interest aside, the main purpose of an article like this is to heighten awareness and concern by demonstrating that symptomatic Alzheimer's disease is the tip of a much larger iceberg and warrants more funding for research and clinical care. The worry that articles like this—or that the media attention they receive—create for me, however, is that they potentially contribute to a growing public panic at a time when we still lack truly meaningful therapy. As a doctor, I want to give my patients with MCI and dementia reason to believe they still have a meaningful life and that there is hope, rather than having them feel that I have just pronounced a death sentence.
The attention paid by the Alzheimer's Association is understandable, given its mission of increasing awareness and supporting more funding, but it omits to mention another important article showing that dementia rates are actually declining when data are adjusted for our aging population (observed vs expected).
We need to maintain public awareness without creating panic. There is no question that Alzheimer's disease is a major public health issue that warrants all the funding we can provide to researchers seeking a cure. How to balance that need with the need to give our population hope that all is not lost when they misplace their keys is the challenge this article raises.
—Richard J. Caselli, MD
Professor of Neurology
Mayo Clinic
Scottsdale, Arizona

Sodium Oxybate Reduces Daytime Sleepiness in Parkinson’s Disease
Sodium oxybate effectively treats excessive daytime sleepiness and nocturnal sleep disturbance in patients with Parkinson’s disease, according to research published in the January issue of JAMA Neurology. Patients receiving this therapy should be monitored with follow-up polysomnography to rule out treatment-related complications, the investigators said.
Many patients with Parkinson’s disease have excessive daytime sleepiness and disturbed sleep, but few treatments are available for them. An open-label study found that sodium oxybate, a first-line therapy for narcolepsy type 1, improved sleep and reduced daytime sleepiness in Parkinson’s disease.
A Phase II Crossover Study
To investigate this treatment further, Christian Baumann, MD, Senior Physician at University Hospital Zürich, and colleagues enrolled 18 patients into a double-blind, placebo-controlled, crossover phase IIa study. Eligible participants had Parkinson’s disease and regularly took dopaminergic medication. People with sleep apnea, cognitive problems, or depression, and those who took hypnotics, were excluded from the study.

The researchers randomized participants in equal groups to sodium oxybate or placebo. Study medications were taken daily at bedtime and 2.5 to four hours later for six weeks. Doses were titrated between 3 g/night and 9 g/night according to efficacy and tolerability. After a two- to four-week washout period, participants crossed over to the opposite treatment arm for six weeks.
The trial’s primary efficacy end point was treatment effect on mean sleep latency (MSL), as measured by the Multiple Sleep Latency Test (MSLT). Secondary end points included change in subjective excessive daytime sleepiness (as measured by the Epworth Sleepiness Scale [ESS]), sleep quality, and objective sleep parameters. The investigators measured outcomes in the sleep laboratory at baseline and after six weeks of therapy.
Adverse Events Were Mild or Moderate
Five patients were excluded because of sleep apnea, and one patient withdrew consent. Of the 12 patients randomized, two were women. At baseline, participants’ mean age was 62, and mean disease duration was 8.4 years. Two patients developed de novo sleep apnea during sodium oxybate treatment, and one of them dropped out.
In the intention-to-treat analysis, sodium oxybate increased MSL by 2.9 minutes and reduced ESS score by 4.2 points. In the per-protocol analysis, sodium oxybate increased MSL by 3.5 minutes and reduced ESS score by 5.2 points. The responder rate for sodium oxybate (ie, the percentage of patients who had an improvement in MSL of more than 50%) was 67%. ESS score normalized for half of patients.
Every patient who received sodium oxybate had adverse events of mild or moderate intensity. The majority of these adverse events resolved after dose adjustment. Four patients continued to have adverse events until the end of the study, but none dropped out because of them.
Sodium oxybate had a treatment effect “that, to our knowledge, is unmatched by any other intervention reported so far,” said Dr. Baumann and colleagues. Although the sample size was large enough to provide class I evidence of efficacy, it was insufficient to support conclusions about safety, said the researchers. Larger follow-up trials thus are necessary, they concluded.
—Erik Greb
Suggested Reading
Büchele F, Hackius M, Schreglmann SR, et al. Sodium oxybate for excessive daytime sleepiness and sleep disturbance in Parkinson disease: a randomized clinical trial. JAMA Neurol. 2018;75(1):114-118.
Sodium oxybate effectively treats excessive daytime sleepiness and nocturnal sleep disturbance in patients with Parkinson’s disease, according to research published in the January issue of JAMA Neurology. Patients receiving this therapy should be monitored with follow-up polysomnography to rule out treatment-related complications, the investigators said.
Many patients with Parkinson’s disease have excessive daytime sleepiness and disturbed sleep, but few treatments are available for them. An open-label study found that sodium oxybate, a first-line therapy for narcolepsy type 1, improved sleep and reduced daytime sleepiness in Parkinson’s disease.
A Phase II Crossover Study
To investigate this treatment further, Christian Baumann, MD, Senior Physician at University Hospital Zürich, and colleagues enrolled 18 patients into a double-blind, placebo-controlled, crossover phase IIa study. Eligible participants had Parkinson’s disease and regularly took dopaminergic medication. People with sleep apnea, cognitive problems, or depression, and those who took hypnotics, were excluded from the study.
The researchers randomized participants in equal groups to sodium oxybate or placebo. Study medications were taken daily at bedtime and 2.5 to four hours later for six weeks. Doses were titrated between 3 g/night and 9 g/night according to efficacy and tolerability. After a two- to four-week washout period, participants crossed over to the opposite treatment arm for six weeks.
The trial’s primary efficacy end point was treatment effect on mean sleep latency (MSL), as measured by the Multiple Sleep Latency Test (MSLT). Secondary end points included change in subjective excessive daytime sleepiness (as measured by the Epworth Sleepiness Scale [ESS]), sleep quality, and objective sleep parameters. The investigators measured outcomes in the sleep laboratory at baseline and after six weeks of therapy.
Adverse Events Were Mild or Moderate
Five patients were excluded because of sleep apnea, and one patient withdrew consent. Of the 12 patients randomized, two were women. At baseline, participants’ mean age was 62, and mean disease duration was 8.4 years. Two patients developed de novo sleep apnea during sodium oxybate treatment, and one of them dropped out.
In the intention-to-treat analysis, sodium oxybate increased MSL by 2.9 minutes and reduced ESS score by 4.2 points. In the per-protocol analysis, sodium oxybate increased MSL by 3.5 minutes and reduced ESS score by 5.2 points. The responder rate for sodium oxybate (ie, the percentage of patients who had an improvement in MSL of more than 50%) was 67%. ESS score normalized for half of patients.
Every patient who received sodium oxybate had adverse events of mild or moderate intensity. The majority of these adverse events resolved after dose adjustment. Four patients continued to have adverse events until the end of the study, but none dropped out because of them.
Sodium oxybate had a treatment effect “that, to our knowledge, is unmatched by any other intervention reported so far,” said Dr. Baumann and colleagues. Although the sample size was large enough to provide class I evidence of efficacy, it was insufficient to support conclusions about safety, said the researchers. Larger follow-up trials thus are necessary, they concluded.
—Erik Greb
Suggested Reading
Büchele F, Hackius M, Schreglmann SR, et al. Sodium oxybate for excessive daytime sleepiness and sleep disturbance in Parkinson disease: a randomized clinical trial. JAMA Neurol. 2018;75(1):114-118.
Dementia: Past, Present, and Future
Jeffrey Cummings, MD, ScD
Director, Cleveland Clinic Lou Ruvo Center for Brain Health, Las Vegas
Disclosure: Jeffrey Cummings has provided consultation to Axovant, biOasis Technologies, Biogen, Boehinger-Ingelheim, Bracket, Dart, Eisai, Genentech, Grifols, Intracellular Therapies, Kyowa, Eli Lilly, Lundbeck, Medavante, Merck, Neurotrope, Novartis, Nutricia, Orion, Otsuka, Pfizer, Probiodrug, QR, Resverlogix, Servier, Suven, Takeda, Toyoma, and United Neuroscience companies.

As Neurology Reviews celebrates its 25th anniversary, we take this opportunity to look back and to look ahead in the area of dementia care and research. Most dementia research has focused on Alzheimer’s disease, although there have been important evolutions in the diagnosis, pathology, and potential interventions for frontotemporal dementia spectrum disorders, dementia with Lewy bodies, Parkinson’s disease dementia, and vascular dementia.
Alzheimer’s Disease
Twenty-five years ago—coinciding with the inauguration of Neurology Reviews—the first treatment for Alzheimer’s disease, the cholinesterase inhibitor tacrine, was approved by the FDA. Tacrine had many limitations, including a short half-life and a propensity to cause hepatotoxicity, but it represented an historical breakthrough in transforming an untreatable disease into a treatable one. The approval energized the field and gave hope to thousands of patients with Alzheimer’s disease dementia.
Tacrine was followed by other cholinesterase inhibitors and memantine in the next decade, with five drugs approved by the end of 2003. Unfortunately, no new agents have been approved for the treatment of Alzheimer’s disease since that fertile period.1 Tremendous efforts are now being devoted to developing disease-modifying treatments for Alzheimer’s disease and other dementias. There are promising preliminary observations for immunotherapies that remove amyloid-beta protein from the brain and stabilize cognitive decline.2 Progress in the development of disease-modifying treatments will transform the field, requiring much of the health care system and insurance companies, but offering an improved quality of life for millions of patients with Alzheimer’s disease.
Previous Advances
A major advance in understanding Alzheimer’s disease is the discovery that the disease begins with amyloid accumulation in mid-life, approximately 15 years before the onset of cognitive decline.3 The advent of amyloid imaging has allowed the visualization of fibrillar amyloid-comprising Alzheimer-type neuritic plaques in the brain of the living person. Scans become positive 15 years prior to the emergence of mild cognitive impairment (MCI) and progression to Alzheimer’s disease dementia. If one is destined to develop MCI at age 75, the scan would be positive by approximately age 60. CSF levels of amyloid beta decline simultaneously as the protein is trapped in the brain, thus resulting in positive amyloid imaging. More recently, findings from tau protein imaging have begun to remodel our understanding of the role of tau in Alzheimer’s disease. Tau imaging correlates with the emergence of symptoms in the MCI phase of Alzheimer’s disease.4 Tau correlates with cognitive decline; positive amyloid imaging does not.
Future Challenges
Looking to the future, it is likely that companion biomarkers such as amyloid and tau imaging will be approved for clinical use. They will enable neurologists to identify the patients whose brain changes match the mechanism of action of the intended treatment (eg, positive tau imaging for those to receive anti-tau therapy and positive amyloid imaging for individuals intended to receive anti-amyloid therapy).
Anticipated directions of therapy development include treatment of individuals before the onset of symptoms, phase-specific therapies that respond to the evolving state changes of Alzheimer’s disease, and combination therapies based on the observation that most patients with Alzheimer’s disease harbor multiple types of brain pathology.5 Alzheimer’s disease therapeutics will proceed in the direction of precision medicine with better matching of therapies to the features of the disorder for the individual patient.
The US health care system is unprepared for the advent of disease-modifying treatments for Alzheimer’s disease. Recognition of patients with mild changes, availability of amyloid imaging to support diagnosis and identify therapeutic targets, and the number of infusion centers to administer monoclonal antibodies are all insufficient to respon
Advances in the understanding of frontotemporal dementia have not yet led to a breakthrough therapy. Frontotemporal dementia has been shown to be pathologically heterogeneous, with about half of the patients having an underlying tauopathy, and about half having TDP-43 as the associated aggregated protein.6 A few cases have rarer forms of pathology. Major phenotypes of frontotemporal dementia include behavioral variant frontotemporal dementia, progressive nonfluent aphasia, and semantic dementia. Trials of new candidate therapies are progressing for frontotemporal dementia spectrum disorders, and new treatments are anticipated.
Progress in understanding dementia with Lewy bodies has led to the publication of diagnostic criteria.7 The phenotype of parkinsonism, fluctuating cognition, and visual hallucinations is supported by decreased dopamine uptake on dopamine transporter (DaT) scanning and the presence of REM sleep behavior disorder. Lewy bodies are found in the limbic and neocortex at autopsy; many cases have concomitant amyloid plaques similar to those of Alzheimer’s disease. Parkinson’s disease dementia has many of the same features and is distinguished from dementia with Lewy bodies only by the order of appearance of major symptoms—dementia first in dementia with Lewy bodies, parkinsonism first in Parkinson’s disease dementia. Rivastigmine is approved for the symptomatic treatment of cognitive deficits in Parkinson’s disease dementia, and trials of new therapies are being conducted in Parkinson’s disease dementia and dementia with Lewy bodies. Alpha-synuclein is present in both disorders and is the target of new disease-modifying treatments currently in clinical trials.
Improved understanding of the basic biology of neurodegenerative disease is critically important and must be accelerated. This knowledge will provide the foundation for improved diagnostics and therapeutics essential for responding to the needs of the burgeoning number of patients with these late-life brain disorders.
References
1. Cummings JL, Morstorf T, Zhong K. Alzheimer’s disease drug-development pipeline: few candidates, frequent failures. Alzheimers Res Ther. 2014;6(4):37-43.
2. Sevigny J, Chiao P, Bussiere T, et al. The antibody aducanumab reduces Aβ plaques in Alzheimer’s disease. Nature. 2016;537(7618):50-56.
3. Villemagne VL, Burnham S, Bourgeat P, et al. Amyloid β deposition, neurodegeneration, and cognitive decline in sporadic Alzheimer’s disease: a prospective cohort study. Lancet Neurol. 2013;12(4):357-367.
4. Johnson KA, Schultz A, Betensky RA, et al. Tau positron emission tomographic imaging in aging and early Alzheimer disease. Ann Neurol. 2016;79(1):110-119.
5. James BD, Wilson RS, Boyle PA, et al. TDP-43 stage, mixed pathologies, and clinical Alzheimer’s-type dementia. Brain. 2016;139(11):2983-2993.
6. Lashley T, Rohrer JD, Mead S, Revesz T. Review: an update on clinical, genetic and pathological aspects of frontotemporal lobar degenerations. Neuropathol Appl Neurobiol. 2015;41(7):858-881.
7. McKeith IG, Boeve BF, Dickson DW, et al. Diagnosis and management of dementia with Lewy bodies: Fourth consensus report of the DLB Consortium. Neurology. 2017;89(1):88-100.
Jeffrey Cummings, MD, ScD
Director, Cleveland Clinic Lou Ruvo Center for Brain Health, Las Vegas
Disclosure: Jeffrey Cummings has provided consultation to Axovant, biOasis Technologies, Biogen, Boehinger-Ingelheim, Bracket, Dart, Eisai, Genentech, Grifols, Intracellular Therapies, Kyowa, Eli Lilly, Lundbeck, Medavante, Merck, Neurotrope, Novartis, Nutricia, Orion, Otsuka, Pfizer, Probiodrug, QR, Resverlogix, Servier, Suven, Takeda, Toyoma, and United Neuroscience companies.
As Neurology Reviews celebrates its 25th anniversary, we take this opportunity to look back and to look ahead in the area of dementia care and research. Most dementia research has focused on Alzheimer’s disease, although there have been important evolutions in the diagnosis, pathology, and potential interventions for frontotemporal dementia spectrum disorders, dementia with Lewy bodies, Parkinson’s disease dementia, and vascular dementia.
Alzheimer’s Disease
Twenty-five years ago—coinciding with the inauguration of Neurology Reviews—the first treatment for Alzheimer’s disease, the cholinesterase inhibitor tacrine, was approved by the FDA. Tacrine had many limitations, including a short half-life and a propensity to cause hepatotoxicity, but it represented an historical breakthrough in transforming an untreatable disease into a treatable one. The approval energized the field and gave hope to thousands of patients with Alzheimer’s disease dementia.
Tacrine was followed by other cholinesterase inhibitors and memantine in the next decade, with five drugs approved by the end of 2003. Unfortunately, no new agents have been approved for the treatment of Alzheimer’s disease since that fertile period.1 Tremendous efforts are now being devoted to developing disease-modifying treatments for Alzheimer’s disease and other dementias. There are promising preliminary observations for immunotherapies that remove amyloid-beta protein from the brain and stabilize cognitive decline.2 Progress in the development of disease-modifying treatments will transform the field, requiring much of the health care system and insurance companies, but offering an improved quality of life for millions of patients with Alzheimer’s disease.
Previous Advances
A major advance in understanding Alzheimer’s disease is the discovery that the disease begins with amyloid accumulation in mid-life, approximately 15 years before the onset of cognitive decline.3 The advent of amyloid imaging has allowed the visualization of fibrillar amyloid-comprising Alzheimer-type neuritic plaques in the brain of the living person. Scans become positive 15 years prior to the emergence of mild cognitive impairment (MCI) and progression to Alzheimer’s disease dementia. If one is destined to develop MCI at age 75, the scan would be positive by approximately age 60. CSF levels of amyloid beta decline simultaneously as the protein is trapped in the brain, thus resulting in positive amyloid imaging. More recently, findings from tau protein imaging have begun to remodel our understanding of the role of tau in Alzheimer’s disease. Tau imaging correlates with the emergence of symptoms in the MCI phase of Alzheimer’s disease.4 Tau correlates with cognitive decline; positive amyloid imaging does not.
Future Challenges
Looking to the future, it is likely that companion biomarkers such as amyloid and tau imaging will be approved for clinical use. They will enable neurologists to identify the patients whose brain changes match the mechanism of action of the intended treatment (eg, positive tau imaging for those to receive anti-tau therapy and positive amyloid imaging for individuals intended to receive anti-amyloid therapy).
Anticipated directions of therapy development include treatment of individuals before the onset of symptoms, phase-specific therapies that respond to the evolving state changes of Alzheimer’s disease, and combination therapies based on the observation that most patients with Alzheimer’s disease harbor multiple types of brain pathology.5 Alzheimer’s disease therapeutics will proceed in the direction of precision medicine with better matching of therapies to the features of the disorder for the individual patient.
The US health care system is unprepared for the advent of disease-modifying treatments for Alzheimer’s disease. Recognition of patients with mild changes, availability of amyloid imaging to support diagnosis and identify therapeutic targets, and the number of infusion centers to administer monoclonal antibodies are all insufficient to respon
Advances in the understanding of frontotemporal dementia have not yet led to a breakthrough therapy. Frontotemporal dementia has been shown to be pathologically heterogeneous, with about half of the patients having an underlying tauopathy, and about half having TDP-43 as the associated aggregated protein.6 A few cases have rarer forms of pathology. Major phenotypes of frontotemporal dementia include behavioral variant frontotemporal dementia, progressive nonfluent aphasia, and semantic dementia. Trials of new candidate therapies are progressing for frontotemporal dementia spectrum disorders, and new treatments are anticipated.
Progress in understanding dementia with Lewy bodies has led to the publication of diagnostic criteria.7 The phenotype of parkinsonism, fluctuating cognition, and visual hallucinations is supported by decreased dopamine uptake on dopamine transporter (DaT) scanning and the presence of REM sleep behavior disorder. Lewy bodies are found in the limbic and neocortex at autopsy; many cases have concomitant amyloid plaques similar to those of Alzheimer’s disease. Parkinson’s disease dementia has many of the same features and is distinguished from dementia with Lewy bodies only by the order of appearance of major symptoms—dementia first in dementia with Lewy bodies, parkinsonism first in Parkinson’s disease dementia. Rivastigmine is approved for the symptomatic treatment of cognitive deficits in Parkinson’s disease dementia, and trials of new therapies are being conducted in Parkinson’s disease dementia and dementia with Lewy bodies. Alpha-synuclein is present in both disorders and is the target of new disease-modifying treatments currently in clinical trials.
Improved understanding of the basic biology of neurodegenerative disease is critically important and must be accelerated. This knowledge will provide the foundation for improved diagnostics and therapeutics essential for responding to the needs of the burgeoning number of patients with these late-life brain disorders.
References
1. Cummings JL, Morstorf T, Zhong K. Alzheimer’s disease drug-development pipeline: few candidates, frequent failures. Alzheimers Res Ther. 2014;6(4):37-43.
2. Sevigny J, Chiao P, Bussiere T, et al. The antibody aducanumab reduces Aβ plaques in Alzheimer’s disease. Nature. 2016;537(7618):50-56.
3. Villemagne VL, Burnham S, Bourgeat P, et al. Amyloid β deposition, neurodegeneration, and cognitive decline in sporadic Alzheimer’s disease: a prospective cohort study. Lancet Neurol. 2013;12(4):357-367.
4. Johnson KA, Schultz A, Betensky RA, et al. Tau positron emission tomographic imaging in aging and early Alzheimer disease. Ann Neurol. 2016;79(1):110-119.
5. James BD, Wilson RS, Boyle PA, et al. TDP-43 stage, mixed pathologies, and clinical Alzheimer’s-type dementia. Brain. 2016;139(11):2983-2993.
6. Lashley T, Rohrer JD, Mead S, Revesz T. Review: an update on clinical, genetic and pathological aspects of frontotemporal lobar degenerations. Neuropathol Appl Neurobiol. 2015;41(7):858-881.
7. McKeith IG, Boeve BF, Dickson DW, et al. Diagnosis and management of dementia with Lewy bodies: Fourth consensus report of the DLB Consortium. Neurology. 2017;89(1):88-100.
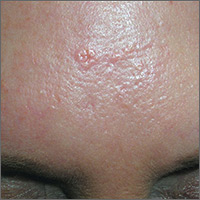
Forehead growth
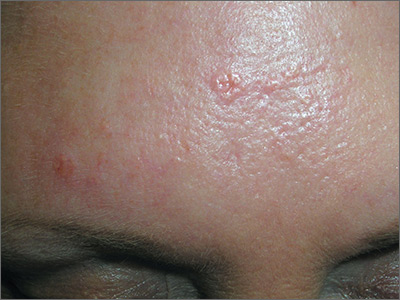
Based on the doughnut shape of the growth, and other similar-looking lesions on the patient’s face, the FP diagnosed sebaceous hyperplasia (SH).
SH is a common, benign condition of the sebaceous glands. It becomes more common on the face starting in middle age. The cells that form the sebaceous gland (sebocytes) accumulate lipid material as they migrate from the basal layer of the gland to the central duct, where they release the lipid content as sebum. In younger individuals, turnover of sebocytes occurs approximately every month. With aging, the sebocyte turnover slows down. This results in crowding of primitive sebocytes within the sebaceous gland, causing the benign hamartomatous enlargement known as SH. Fortunately, there is no known potential for malignant transformation.
SH is located on the face, particularly the cheeks, forehead and nose. (There are other variations of sebaceous hyperplasia found on the lips, areolas, and genitalia.) Single—or groups—of lesions appear as yellowish, soft, small papules ranging in size from 2 to 9 mm. Aging and genetics are the most common risk factors. A small amount of sebum can sometimes be expressed with gentle pressure.
Dermoscopy aids in distinguishing between SH and nodular basal cell carcinoma (BCC). SH has a pattern of crown vessels that extend toward the center of the lesion and do not cross the midline, whereas BCC has branching vessels that can be found randomly distributed throughout the lesion. A biopsy isn’t usually necessary, unless there are features suspicious for BCC. Options for removal include electrodesiccation, cryotherapy, laser treatment, photodynamic therapy, and shave excision. Electrodessication can be performed without anesthesia using a very low setting of an electrosurgical instrument.
The patient in this case wanted the SH removed, so a shave biopsy was performed to make sure this was not a BCC. Pathology confirmed SH and the cosmetic result was excellent.
Photos and text for Photo Rounds Friday courtesy of Richard P. Usatine, MD. This case was adapted from: Smith M. Sebaceous hyperplasia. In: Usatine R, Smith M, Mayeaux EJ, et al, eds. Color Atlas of Family Medicine. 2nd ed. New York, NY: McGraw-Hill; 2013: 931-934.
To learn more about the Color Atlas of Family Medicine, see: www.amazon.com/Color-Family-Medicine-Richard-Usatine/dp/0071769641/
You can now get the second edition of the Color Atlas of Family Medicine as an app by clicking on this link: usatinemedia.com
Gene Replacement Improves Survival in Spinal Muscular Atrophy
A single IV infusion to replace the gene encoding survival motor neuron 1 (SMN1) increases survival among infants with spinal muscular atrophy type 1 (SMA1), according to research published in the November 2, 2017, issue of the New England Journal of Medicine. The treatment also improves motor function, and its effects are maintained for two years, the researchers said.
The loss or dysfunction of SMN1 causes SMA, a progressive disease characterized by the degeneration and loss of lower motor neurons. Onset of SMA1 typically occurs at one month of age. Children with the disease usually are weak, fail to achieve motor milestones, and have declines in respiration and swallowing. At a median age of 10.5 months, patients die or need permanent ventilatory assistance.
In December 2016, the FDA approved nusinersen for the treatment of SMA. A phase III study found that patients treated with nusinersen were more likely than controls to have improved motor function and event-free survival. The trial was stopped early because of the treatment’s efficacy.
A Small, Open-Label Trial
A mouse study indicated that IV administration of an adenoassociated viral vector (ie, AAV9) containing SMN1 reduced the effects of SMA and extended survival. Jerry R. Mendell, MD, Principal Investigator at Nationwide Children’s Hospital’s Center for Gene Therapy in Columbus, Ohio, and colleagues studied this therapeutic technique in humans.

They enrolled 15 patients with a genetically confirmed diagnosis of SMA1 into two cohorts. The first cohort received a low dose (6.7×10¹³ vg/kg) of treatment, and the second cohort received a high dose (2.0×10¹⁴ vg/kg). Because the first patient in cohort one had serum aminotransferase elevations, the investigators gave 1 mg/kg/day of oral prednisolone to all subsequent patients for 30 days, starting 24 hours before gene therapy.
The study’s primary outcome was treatment-related adverse events of grade 3 or higher. The secondary outcome was time until death or the need for permanent ventilatory assistance, which was defined as at least 16 hours/day of continuous respiratory assistance for at least 14 days. The achievement of motor milestones and Children’s Hospital of Philadelphia Infant Test of Neuromuscular Disorders (CHOP INTEND) scores were exploratory outcomes.
Motor Scores Improved
Three patients entered the low-dose cohort, and 12 were enrolled in the high-dose cohort. Patients’ mean age at treatment was 6.3 months in cohort 1 and 3.4 months in cohort 2. At the last follow-up, all patients had reached age 20 months, and none required permanent mechanical ventilation. Approximately 8% of patients in a historical cohort met these criteria.
All patients had increases from baseline in CHOP INTEND score and maintained these increases throughout the study. Patients in cohort 2 had mean increases of 9.8 points at one month and 15.4 points at three months. Eleven patients achieved and sustained scores greater than 40 points, which is considered clinically meaningful in SMA.
Of the patients in cohort 2, 11 sat unassisted, nine rolled over, 11 fed orally and could speak, and two walked independently. No patients in the historical cohorts achieved any of these milestones, and they rarely became able to speak.
Dr. Mendell and colleagues observed two treatment-related grade 4 adverse events. Both were elevations in serum aminotransferase levels that were attenuated after treatment with prednisolone. The researchers also noted three treatment-related nonserious adverse events (ie, asymptomatic elevations in serum aminotransferase levels that were resolved without additional prednisolone treatment).
The study results were consistent with those of the preclinical mouse study. During a follow-up period of as long as two years, Dr. Mendell and colleagues did not observe any decrease in treatment effect or regression in motor function among the study participants. The presence of antibodies to AAV9 could be a potential limitation of the therapy, however. Further research to assess the treatment’s safety and the durability of its effect are needed, according to the authors.
Comparing Two Treatments
It is difficult to compare the results of Dr. Mendell and colleagues with those of the phase III nusinersen study, because of the two trials’ different designs, said Ans T. van der Ploeg, MD, PhD, Chair of the Center for Lysosomal and Metabolic Diseases at the Erasmus MC University in Rotterdam, the Netherlands, in an accompanying editorial. One potential advantage of AAV9 gene therapy is that it might require a single IV infusion. Nusinersen, on the other hand, may require lifelong intrathecal treatment.
“The durability of the effects is uncertain for both treatments,” said Dr. van der Ploeg. “If the expression of the scAAV9 gene therapy declines over time, the same treatment may not be able to be repeated, because antibodies against AAV capsid proteins are anticipated to form.”
In addition, neither of the two therapies cures SMA type 1. Earlier treatment could be beneficial, as could a combination of both treatments, said Dr. van der Ploeg. But the high expected cost of nusinersen is “an important constraint,” she concluded.
—Erik Greb
Suggested Reading
Mendell JR, Al-Zaidy S, Shell R, et al. Single-dose gene-replacement therapy for spinal muscular atrophy. N Engl J Med. 2017;377(18):1713-1722.
van der Ploeg AT. The dilemma of two innovative therapies for spinal muscular atrophy. N Engl J Med. 2017;377(18):1786-1787.
A single IV infusion to replace the gene encoding survival motor neuron 1 (SMN1) increases survival among infants with spinal muscular atrophy type 1 (SMA1), according to research published in the November 2, 2017, issue of the New England Journal of Medicine. The treatment also improves motor function, and its effects are maintained for two years, the researchers said.
The loss or dysfunction of SMN1 causes SMA, a progressive disease characterized by the degeneration and loss of lower motor neurons. Onset of SMA1 typically occurs at one month of age. Children with the disease usually are weak, fail to achieve motor milestones, and have declines in respiration and swallowing. At a median age of 10.5 months, patients die or need permanent ventilatory assistance.
In December 2016, the FDA approved nusinersen for the treatment of SMA. A phase III study found that patients treated with nusinersen were more likely than controls to have improved motor function and event-free survival. The trial was stopped early because of the treatment’s efficacy.
A Small, Open-Label Trial
A mouse study indicated that IV administration of an adenoassociated viral vector (ie, AAV9) containing SMN1 reduced the effects of SMA and extended survival. Jerry R. Mendell, MD, Principal Investigator at Nationwide Children’s Hospital’s Center for Gene Therapy in Columbus, Ohio, and colleagues studied this therapeutic technique in humans.
They enrolled 15 patients with a genetically confirmed diagnosis of SMA1 into two cohorts. The first cohort received a low dose (6.7×10¹³ vg/kg) of treatment, and the second cohort received a high dose (2.0×10¹⁴ vg/kg). Because the first patient in cohort one had serum aminotransferase elevations, the investigators gave 1 mg/kg/day of oral prednisolone to all subsequent patients for 30 days, starting 24 hours before gene therapy.
The study’s primary outcome was treatment-related adverse events of grade 3 or higher. The secondary outcome was time until death or the need for permanent ventilatory assistance, which was defined as at least 16 hours/day of continuous respiratory assistance for at least 14 days. The achievement of motor milestones and Children’s Hospital of Philadelphia Infant Test of Neuromuscular Disorders (CHOP INTEND) scores were exploratory outcomes.
Motor Scores Improved
Three patients entered the low-dose cohort, and 12 were enrolled in the high-dose cohort. Patients’ mean age at treatment was 6.3 months in cohort 1 and 3.4 months in cohort 2. At the last follow-up, all patients had reached age 20 months, and none required permanent mechanical ventilation. Approximately 8% of patients in a historical cohort met these criteria.
All patients had increases from baseline in CHOP INTEND score and maintained these increases throughout the study. Patients in cohort 2 had mean increases of 9.8 points at one month and 15.4 points at three months. Eleven patients achieved and sustained scores greater than 40 points, which is considered clinically meaningful in SMA.
Of the patients in cohort 2, 11 sat unassisted, nine rolled over, 11 fed orally and could speak, and two walked independently. No patients in the historical cohorts achieved any of these milestones, and they rarely became able to speak.
Dr. Mendell and colleagues observed two treatment-related grade 4 adverse events. Both were elevations in serum aminotransferase levels that were attenuated after treatment with prednisolone. The researchers also noted three treatment-related nonserious adverse events (ie, asymptomatic elevations in serum aminotransferase levels that were resolved without additional prednisolone treatment).
The study results were consistent with those of the preclinical mouse study. During a follow-up period of as long as two years, Dr. Mendell and colleagues did not observe any decrease in treatment effect or regression in motor function among the study participants. The presence of antibodies to AAV9 could be a potential limitation of the therapy, however. Further research to assess the treatment’s safety and the durability of its effect are needed, according to the authors.
Comparing Two Treatments
It is difficult to compare the results of Dr. Mendell and colleagues with those of the phase III nusinersen study, because of the two trials’ different designs, said Ans T. van der Ploeg, MD, PhD, Chair of the Center for Lysosomal and Metabolic Diseases at the Erasmus MC University in Rotterdam, the Netherlands, in an accompanying editorial. One potential advantage of AAV9 gene therapy is that it might require a single IV infusion. Nusinersen, on the other hand, may require lifelong intrathecal treatment.
“The durability of the effects is uncertain for both treatments,” said Dr. van der Ploeg. “If the expression of the scAAV9 gene therapy declines over time, the same treatment may not be able to be repeated, because antibodies against AAV capsid proteins are anticipated to form.”
In addition, neither of the two therapies cures SMA type 1. Earlier treatment could be beneficial, as could a combination of both treatments, said Dr. van der Ploeg. But the high expected cost of nusinersen is “an important constraint,” she concluded.
—Erik Greb
Suggested Reading
Mendell JR, Al-Zaidy S, Shell R, et al. Single-dose gene-replacement therapy for spinal muscular atrophy. N Engl J Med. 2017;377(18):1713-1722.
van der Ploeg AT. The dilemma of two innovative therapies for spinal muscular atrophy. N Engl J Med. 2017;377(18):1786-1787.
30 years in service to you, our community of women’s health clinicians
The mission of

OBG Management : Print and electronic portals for knowledge acquisition
Experienced clinicians acquire new knowledge and refresh established concepts through discussions with trusted colleagues and by reading journals and books that contain information relevant to their practice. A continuing trend in professional development is the accelerating transition from a reliance on print media (print journals and books) to electronic information delivery. Many clinicians continue to enjoy reading medical journals and magazines. ObGyns are no different; 96% report reading the print edition of medical journals.1 At
However, in the time-pressured setting of office- and hospital-based patient care, critical information is now frequently accessed through an electronic portal that is web based and focused on immediately answering a high priority question necessary for optimal patient care.
The information base needed to practice medicine is massive and continues to grow rapidly. No single print textbook or journal can cover this vast information base. Libraries of print material are cumbersome to use and ordinarily not accessible at the site of patient care. Electronic portals are the only means of providing immediate access to all medical knowledge. Electronic technology enables the aggregation of vast amounts of information in a database that is rapidly accessible from anywhere, and new search technology is making it easier to quickly locate the information you need.
The next frontier in medical information exchange is the application of artificial intelligence to cull “answers” from the vast aggregation of data. By combining all available medical information and artificial intelligence processes, in the near future, clinicians will be able to instantaneously get an answer to a question they have about how to care for a specific patient. A decade ago, when a question was entered into an Internet search engine, the response was typically a list of potential websites where the answer might be located. In the past few years, with the integration of huge databases and artificial intelligence, some advanced search engines now provide a specific answer to a question, followed by a list of relevant websites. For example, if you enter this question: “What countries have the greatest number of people?” into the Google search tool, in less than 1 second a direct answer is provided: “China has the world’s largest population (1.4 billion), followed by India (1.3 billion). The next most populous nations—the United States, Indonesia, Brazil and Pakistan—combined have less than 1 billion people.” The next step in medical information communication will be the deployment of artificial intelligence systems that can directly answer a query from a clinician about a specific patient.
Our distinguished Editorial Board and authors—the heart and mind of OBG Management
The editorial team at
Improving clinician wellness and resilience and reducing burnout
Clinicians throughout the world are reporting decreased levels of professional fulfillment and increased levels of burnout.2–4 This epidemic is likely caused by many factors, including the deployment of poorly designed electronic health systems, the administrative guidance for clinicians to work faster with fewer support staff, increasing administrative and secretarial burden on clinicians, and institutional constraints on clinician autonomy. Many of these problems only can be addressed at the level of the health system, but some are in the control of individual clinicians.
In the upcoming years,
The gratitude exercise
Showing more gratitude to those who have been most meaningful in your life may increase your wellness. Try the gratitude exercise outlined below.
To prepare for the exercise you will need about 15 minutes of uninterrupted time, a quiet room, and a method for recording your thoughts (pen/paper, electronic word processor, voice recorder).
Sit quietly and close your eyes. Spend 5 minutes thinking about the people in your life whose contributions have had the greatest positive impact on your development. Think deeply about the importance of their role in your life. Select one of those important people.
Open your eyes and spend 10 minutes expressing in writing your thoughts and feelings about that person. Once you have completed expressing yourself in writing, commit to reading your words, verbatim, to the person within the following 48 hours. This could be done by voice communication, video conferencing, or in-person.
The future of obstetrics and gynecology is bright
Medical students are electing to pursue a career in obstetrics and gynecology in record numbers. The students entering the field and the residents currently in training are superbly prepared and have demonstrated their commitment to advancing reproductive health by experiences in advocacy, research, and community service. We need to ensure that these super-star young physicians are able to have a 40-year career that is productive and fulfilling.
Share your thoughts! Send your Letter to the Editor to [email protected]. Please include your name and the city and state in which you practice.
- Kantar Media. Sources and Interactions. Medical/Surgical Edition. Kantar Media; New York, New York; 2017.
- Dyrbye LN, West CP, Satele D, et al. Burnout among U.S. medical students, residents and early career physicians relative to the general U.S. population. Acad Med. 2014;89(3):443-451.
- Vandenbroeck S, Van Gerven E, De Witte H, Vanhaecht K, Godderis L. Burnout in Belgian physicians and nurses. Occup Med (London). 2017;67(7):546-554.
- Siu C, Yuen SK, Cheung A. Burnout among public doctors in Hong Kong: cross-sectional survey. Hong Kong Med J. 2012;18(3):186-192.
- Cheng ST, Tsui PK, Lam JH. Improving mental health in health care practitioners: randomized controlled trial of a gratitude intervention. J Consult Clin Psychol. 2015;83(1):177-186.

Dr. Barbieri is Editor in Chief, OBG Management, and Chair, Department of Obstetrics and Gynecology, Brigham and Women's Hospital, and Kate Macy Ladd Professor of Obstetrics, Gynecology and Reproductive Biology, Harvard Medical School.
Dr. Barbieri reports no financial relationships relevant to this article.
The mission of
OBG Management : Print and electronic portals for knowledge acquisition
Experienced clinicians acquire new knowledge and refresh established concepts through discussions with trusted colleagues and by reading journals and books that contain information relevant to their practice. A continuing trend in professional development is the accelerating transition from a reliance on print media (print journals and books) to electronic information delivery. Many clinicians continue to enjoy reading medical journals and magazines. ObGyns are no different; 96% report reading the print edition of medical journals.1 At
However, in the time-pressured setting of office- and hospital-based patient care, critical information is now frequently accessed through an electronic portal that is web based and focused on immediately answering a high priority question necessary for optimal patient care.
The information base needed to practice medicine is massive and continues to grow rapidly. No single print textbook or journal can cover this vast information base. Libraries of print material are cumbersome to use and ordinarily not accessible at the site of patient care. Electronic portals are the only means of providing immediate access to all medical knowledge. Electronic technology enables the aggregation of vast amounts of information in a database that is rapidly accessible from anywhere, and new search technology is making it easier to quickly locate the information you need.
The next frontier in medical information exchange is the application of artificial intelligence to cull “answers” from the vast aggregation of data. By combining all available medical information and artificial intelligence processes, in the near future, clinicians will be able to instantaneously get an answer to a question they have about how to care for a specific patient. A decade ago, when a question was entered into an Internet search engine, the response was typically a list of potential websites where the answer might be located. In the past few years, with the integration of huge databases and artificial intelligence, some advanced search engines now provide a specific answer to a question, followed by a list of relevant websites. For example, if you enter this question: “What countries have the greatest number of people?” into the Google search tool, in less than 1 second a direct answer is provided: “China has the world’s largest population (1.4 billion), followed by India (1.3 billion). The next most populous nations—the United States, Indonesia, Brazil and Pakistan—combined have less than 1 billion people.” The next step in medical information communication will be the deployment of artificial intelligence systems that can directly answer a query from a clinician about a specific patient.
Our distinguished Editorial Board and authors—the heart and mind of OBG Management
The editorial team at
Improving clinician wellness and resilience and reducing burnout
Clinicians throughout the world are reporting decreased levels of professional fulfillment and increased levels of burnout.2–4 This epidemic is likely caused by many factors, including the deployment of poorly designed electronic health systems, the administrative guidance for clinicians to work faster with fewer support staff, increasing administrative and secretarial burden on clinicians, and institutional constraints on clinician autonomy. Many of these problems only can be addressed at the level of the health system, but some are in the control of individual clinicians.
In the upcoming years,
The gratitude exercise
Showing more gratitude to those who have been most meaningful in your life may increase your wellness. Try the gratitude exercise outlined below.
To prepare for the exercise you will need about 15 minutes of uninterrupted time, a quiet room, and a method for recording your thoughts (pen/paper, electronic word processor, voice recorder).
Sit quietly and close your eyes. Spend 5 minutes thinking about the people in your life whose contributions have had the greatest positive impact on your development. Think deeply about the importance of their role in your life. Select one of those important people.
Open your eyes and spend 10 minutes expressing in writing your thoughts and feelings about that person. Once you have completed expressing yourself in writing, commit to reading your words, verbatim, to the person within the following 48 hours. This could be done by voice communication, video conferencing, or in-person.
The future of obstetrics and gynecology is bright
Medical students are electing to pursue a career in obstetrics and gynecology in record numbers. The students entering the field and the residents currently in training are superbly prepared and have demonstrated their commitment to advancing reproductive health by experiences in advocacy, research, and community service. We need to ensure that these super-star young physicians are able to have a 40-year career that is productive and fulfilling.
Share your thoughts! Send your Letter to the Editor to [email protected]. Please include your name and the city and state in which you practice.
- Kantar Media. Sources and Interactions. Medical/Surgical Edition. Kantar Media; New York, New York; 2017.
- Dyrbye LN, West CP, Satele D, et al. Burnout among U.S. medical students, residents and early career physicians relative to the general U.S. population. Acad Med. 2014;89(3):443-451.
- Vandenbroeck S, Van Gerven E, De Witte H, Vanhaecht K, Godderis L. Burnout in Belgian physicians and nurses. Occup Med (London). 2017;67(7):546-554.
- Siu C, Yuen SK, Cheung A. Burnout among public doctors in Hong Kong: cross-sectional survey. Hong Kong Med J. 2012;18(3):186-192.
- Cheng ST, Tsui PK, Lam JH. Improving mental health in health care practitioners: randomized controlled trial of a gratitude intervention. J Consult Clin Psychol. 2015;83(1):177-186.

New and improved classifiers may sharpen thyroid nodule diagnosis
VICTORIA, B.C. – Several new and improved molecular classifiers show good performance for preoperatively assessing the nature of thyroid nodules, including histologic subsets that continue to pose diagnostic challenges, according to a trio of studies reported at the annual meeting of the American Thyroid Association.
ThyroSeq v3 classifier
In a prospective, blinded, multi-institutional study, investigators validated the ThyroSeq v3 genomic classifier, which uses next-generation sequencing to test for mutations, fusions, gene expression alterations, and copy number variations in 112 genes.
The validation cohort consisted of 234 patients from 10 centers who had thyroid nodules with Bethesda III to V cytology and known surgical outcome, with central pathology review, and successful molecular testing. In total, they had 257 fine needle aspiration samples.
Of the 247 samples from nodules having Bethesda III or IV cytology – those of greatest interest – 28% were cancer or noninvasive follicular thyroid neoplasm with papillary-like nuclear features (NIFTP), reported senior author Yuri Nikiforov, MD, PhD, professor of pathology and director of the division of molecular & genomic pathology at the University of Pittsburgh Medical Center. “Both cancer and NIFTP are surgical diseases, so we felt they belong in one group,” he noted.

Among the Bethesda III or IV samples, ThyroSeq v3 had a sensitivity of 94%, a specificity of 82%, a positive predictive value of 66%, and a negative predictive value of 97%. Additional analyses showed that the test would still have a negative predictive value of 95% or better up to a cancer/NIFTP prevalence of 44%.
All five false-negative cases in the entire study cohort were intrathyroidal nodules of low stage and without aggressive histology.
Of the 33 false-positive cases, 68% were diagnosed on pathology as Hurthle cell or follicular adenomas, 10% were initially diagnosed by local pathologists as cancer or NIFTP, and 94% harbored clonal oncogenic molecular alterations.
“So, these are not actually hyperplasia; these are true tumors. Probably at least some of them would have the potential to progress,” said Dr. Nikiforov. “I believe that this so-called false-positive rate may not be really false positive. This is a rate of detection of precancerous tumors, not hyperplasia, that still may require surgical excision.”
In this study, “we found very high sensitivity and negative predictive value of ThyroSeq v3, with robust negative predictive value in populations with different disease prevalence,” he concluded. “Robust performance was achieved in many thyroid cancer types, including Hurthle cell cancer.”
All study patients underwent surgery, so it is not clear how the classifier would perform in the context of surveillance, he acknowledged. But the 97% negative predictive value gives confidence for patients having a negative result.
“Those patients very likely can be observed – not necessarily dismissed from medical surveillance, but observed – and could probably avoid surgery,” he said. “If patients have a positive test, it will depend on the type of mutation, because some of them confer a high risk and others confer low risk. So, there may be a spectrum of management based on combination of clinical parameters and molecular testing. But those are more likely to be surgical candidates.”
“This is a study that is desperately needed in this field,” session attendee Bryan McIver, MD, PhD, an endocrinologist and deputy physician-in-chief at the Moffitt Cancer Center in Tampa, said in an interview. “These are very challenging studies to do, because the marketing of these molecular tests has run ahead of a lot of the clinical studies.

“It’s very hard in the United States, at least, to find patients who are truly naive to molecular testing whom you can take to the operating room,” he explained. “And if you can’t take patients with a negative molecular test to the operating room, then you can’t actually calculate the true sensitivity and specificity of the test, and the whole evaluation of the test starts to become skewed.”
According to Dr. McIver, this study is noteworthy in that it largely fulfills four key criteria: There were no post hoc sample exclusions after unblinding of data, both pathology evaluation and decision to operate were blinded to classifier results, and patients were generally unselected, with little to no prior molecular testing.
“So, we actually have a proper high-quality validation study now available for this new test, the ThyroSeq v3,” he noted. “That sets the bar where it needed to be set a long time ago, and I can’t begin to tell you how excited I am to finally have a test that passed that bar. The fact that it shows a negative predictive value of 97% in this clinical study and a positive predictive value in the mid-60% range means that there is a potential for a clinical utility there that is backed by solid science. In this field, that’s almost unique.”
Afirma GSC with Hurthle classifiers
In a second study, investigators led by Quan-Yang Duh, MD, professor of surgery, division of general surgery, and chief, section of endocrine surgery, University of California, San Francisco, developed and validated a pair of classifiers to enhance performance of the Afirma platform among Hurthle cell specimens.
“The Hurthle cell lesions tend to give us trouble,” Dr. Duh said. On molecular analysis, those that are malignant seldom harbor mutations that would aid diagnosis, whereas those that are benign are usually classified as suspicious by the original Afirma Gene Expression Classifier (GEC).
“The specific group that is causing trouble are those that are Hurthle cell but not neoplasm, because they are the ones that give you the false positives,” Dr. Duh said. Therefore, it makes sense to stratify lesions on both of these factors, and then subject that specific subset to a more stringent threshold.

The investigators developed two classifiers that work with the Afirma core Genomic Sequencing Classifier (GSC), which uses RNA sequencing and machine learning algorithms.
The first classifier uses differential expression of 1,408 genes to determine whether a sample contains Hurthle cells. The second classifier, applied only to lesions containing Hurthle cells, uses differential expression of 2,041 genes and assesses loss of heterozygosity – which is prevalent in Hurthle cell neoplasms – to determine whether a Hurthle cell lesion is a neoplasm.
The ensemble model then makes a final classification, using a higher threshold for suspicious lesions determined to be Hurthle cell but not neoplasm, and a normal threshold for all the rest.
The investigators validated the Afirma GSC with the two classifiers in blinded fashion using 186 thyroid lesion samples having Bethesda III or IV cytology that had been part of the overall multicenter validation of the original Afirma GEC (N Engl J Med. 2012 Aug 23;367[8]:705-15).
Among the 26 Hurthle cell lesions, specificity for identifying benign lesions improved from 11.8% with the original Afirma GEC to 58.8% with the Afirma GSC and new classifiers. That was an absolute gain of 47% (P = .012), Dr. Duh reported. Sensitivity for identifying cancer was 88.9%.
There were also smaller absolute gains in specificity of 18% among all lesions in the cohort (P = .0028) and 14% among non-Hurthle lesions (P = .028).
“The new GSC test has significantly improved specificity in the patients with Bethesda III and IV specimens with Hurthle cells, and this may reduce unnecessary diagnostic surgery,” said Dr. Duh. “Basically, there are fewer false positives and more patients who can be called benign in the Hurthle cell group who would not need an operation.”
Further validation is needed, he acknowledged. “For a while, I wouldn’t send my Hurthle cell aspirate patients for Afirma, because I knew it was going to come back suspicious. I think I will start to do it now, but we need to see what the answers look like” with additional validation.
Afirma GSC with medullary thyroid cancer classifier
In a third study, investigators developed and validated a classifier for medullary thyroid cancer to be used with the Afirma GSC. They were led by Gregory Randolph, MD, professor of otolaryngology and the Claire and John Bertucci Endowed Chair in Thyroid Surgical Oncology at Harvard Medical School, and division chief of the general and thyroid/parathyroid endocrine surgical divisions at the Massachusetts Eye and Ear Infirmary, Boston.
Better preoperative identification of this cancer is key for several reasons, he maintained.

Establishing the diagnosis from needle biopsy is challenging, because some features overlap with those of other thyroid lesions, according to Dr. Randolph. In about a third of patients with medullary thyroid cancer brought to the operating room, the diagnosis is unknown at the time, and that often results in inadequate initial surgery.
The investigators developed a medullary thyroid cancer classifier cassette that assesses differential expression of 108 genes. They then performed blinded, independent validation in a cohort of 211 fine-needle aspiration samples from thyroid nodules: 21 medullary thyroid cancers and 190 other benign and malignant neoplasms.
Results showed that the Afirma GSC with the medullary thyroid cancer classifier had sensitivity of 100% and specificity of 100%, reported Dr. Randolph.
“The Afirma GSC medullary thyroid cancer testing cassette, within the larger GSC system, uses RNA sequencing and advanced machine learning to improve the diagnostic detection of medullary thyroid cancer, which currently misses approximately a third of medullary thyroid cancer patients,” he said.
Session attendees wondered which patients are appropriate candidates and how much the test will cost.
“We have to have a discussion about that, because the missed medullaries are, frankly, widely distributed – they can be in any of the Bethesda categories, basically,” Dr. Randolph said. “So, there are cytopathologic mistakes made uniformly, including in the suspicious and frankly malignant Bethesda categories. In terms of cost, this is embedded in the GSC classifier; so, if you order that test, you will obtain this medullary cassette.”
Actual sensitivity of the classifier may ultimately be less than 100% with use in larger samples, he acknowledged. “I think a greater number of validation tests is absolutely in order. I imagine this classifier may not be perfect, but it is way better than the third we miss with just cytopathology.”
Dr. Nikiforov disclosed that he is owner of an IP for ThyroSeq, and that his laboratory has a contract to offer the test commercially. Dr. Duh disclosed that he had no relevant conflicts of interest. Dr. Randolph disclosed that he had no relevant conflicts of interest.
VICTORIA, B.C. – Several new and improved molecular classifiers show good performance for preoperatively assessing the nature of thyroid nodules, including histologic subsets that continue to pose diagnostic challenges, according to a trio of studies reported at the annual meeting of the American Thyroid Association.
ThyroSeq v3 classifier
In a prospective, blinded, multi-institutional study, investigators validated the ThyroSeq v3 genomic classifier, which uses next-generation sequencing to test for mutations, fusions, gene expression alterations, and copy number variations in 112 genes.
The validation cohort consisted of 234 patients from 10 centers who had thyroid nodules with Bethesda III to V cytology and known surgical outcome, with central pathology review, and successful molecular testing. In total, they had 257 fine needle aspiration samples.
Of the 247 samples from nodules having Bethesda III or IV cytology – those of greatest interest – 28% were cancer or noninvasive follicular thyroid neoplasm with papillary-like nuclear features (NIFTP), reported senior author Yuri Nikiforov, MD, PhD, professor of pathology and director of the division of molecular & genomic pathology at the University of Pittsburgh Medical Center. “Both cancer and NIFTP are surgical diseases, so we felt they belong in one group,” he noted.
Among the Bethesda III or IV samples, ThyroSeq v3 had a sensitivity of 94%, a specificity of 82%, a positive predictive value of 66%, and a negative predictive value of 97%. Additional analyses showed that the test would still have a negative predictive value of 95% or better up to a cancer/NIFTP prevalence of 44%.
All five false-negative cases in the entire study cohort were intrathyroidal nodules of low stage and without aggressive histology.
Of the 33 false-positive cases, 68% were diagnosed on pathology as Hurthle cell or follicular adenomas, 10% were initially diagnosed by local pathologists as cancer or NIFTP, and 94% harbored clonal oncogenic molecular alterations.
“So, these are not actually hyperplasia; these are true tumors. Probably at least some of them would have the potential to progress,” said Dr. Nikiforov. “I believe that this so-called false-positive rate may not be really false positive. This is a rate of detection of precancerous tumors, not hyperplasia, that still may require surgical excision.”
In this study, “we found very high sensitivity and negative predictive value of ThyroSeq v3, with robust negative predictive value in populations with different disease prevalence,” he concluded. “Robust performance was achieved in many thyroid cancer types, including Hurthle cell cancer.”
All study patients underwent surgery, so it is not clear how the classifier would perform in the context of surveillance, he acknowledged. But the 97% negative predictive value gives confidence for patients having a negative result.
“Those patients very likely can be observed – not necessarily dismissed from medical surveillance, but observed – and could probably avoid surgery,” he said. “If patients have a positive test, it will depend on the type of mutation, because some of them confer a high risk and others confer low risk. So, there may be a spectrum of management based on combination of clinical parameters and molecular testing. But those are more likely to be surgical candidates.”
“This is a study that is desperately needed in this field,” session attendee Bryan McIver, MD, PhD, an endocrinologist and deputy physician-in-chief at the Moffitt Cancer Center in Tampa, said in an interview. “These are very challenging studies to do, because the marketing of these molecular tests has run ahead of a lot of the clinical studies.
“It’s very hard in the United States, at least, to find patients who are truly naive to molecular testing whom you can take to the operating room,” he explained. “And if you can’t take patients with a negative molecular test to the operating room, then you can’t actually calculate the true sensitivity and specificity of the test, and the whole evaluation of the test starts to become skewed.”
According to Dr. McIver, this study is noteworthy in that it largely fulfills four key criteria: There were no post hoc sample exclusions after unblinding of data, both pathology evaluation and decision to operate were blinded to classifier results, and patients were generally unselected, with little to no prior molecular testing.
“So, we actually have a proper high-quality validation study now available for this new test, the ThyroSeq v3,” he noted. “That sets the bar where it needed to be set a long time ago, and I can’t begin to tell you how excited I am to finally have a test that passed that bar. The fact that it shows a negative predictive value of 97% in this clinical study and a positive predictive value in the mid-60% range means that there is a potential for a clinical utility there that is backed by solid science. In this field, that’s almost unique.”
Afirma GSC with Hurthle classifiers
In a second study, investigators led by Quan-Yang Duh, MD, professor of surgery, division of general surgery, and chief, section of endocrine surgery, University of California, San Francisco, developed and validated a pair of classifiers to enhance performance of the Afirma platform among Hurthle cell specimens.
“The Hurthle cell lesions tend to give us trouble,” Dr. Duh said. On molecular analysis, those that are malignant seldom harbor mutations that would aid diagnosis, whereas those that are benign are usually classified as suspicious by the original Afirma Gene Expression Classifier (GEC).
“The specific group that is causing trouble are those that are Hurthle cell but not neoplasm, because they are the ones that give you the false positives,” Dr. Duh said. Therefore, it makes sense to stratify lesions on both of these factors, and then subject that specific subset to a more stringent threshold.
The investigators developed two classifiers that work with the Afirma core Genomic Sequencing Classifier (GSC), which uses RNA sequencing and machine learning algorithms.
The first classifier uses differential expression of 1,408 genes to determine whether a sample contains Hurthle cells. The second classifier, applied only to lesions containing Hurthle cells, uses differential expression of 2,041 genes and assesses loss of heterozygosity – which is prevalent in Hurthle cell neoplasms – to determine whether a Hurthle cell lesion is a neoplasm.
The ensemble model then makes a final classification, using a higher threshold for suspicious lesions determined to be Hurthle cell but not neoplasm, and a normal threshold for all the rest.
The investigators validated the Afirma GSC with the two classifiers in blinded fashion using 186 thyroid lesion samples having Bethesda III or IV cytology that had been part of the overall multicenter validation of the original Afirma GEC (N Engl J Med. 2012 Aug 23;367[8]:705-15).
Among the 26 Hurthle cell lesions, specificity for identifying benign lesions improved from 11.8% with the original Afirma GEC to 58.8% with the Afirma GSC and new classifiers. That was an absolute gain of 47% (P = .012), Dr. Duh reported. Sensitivity for identifying cancer was 88.9%.
There were also smaller absolute gains in specificity of 18% among all lesions in the cohort (P = .0028) and 14% among non-Hurthle lesions (P = .028).
“The new GSC test has significantly improved specificity in the patients with Bethesda III and IV specimens with Hurthle cells, and this may reduce unnecessary diagnostic surgery,” said Dr. Duh. “Basically, there are fewer false positives and more patients who can be called benign in the Hurthle cell group who would not need an operation.”
Further validation is needed, he acknowledged. “For a while, I wouldn’t send my Hurthle cell aspirate patients for Afirma, because I knew it was going to come back suspicious. I think I will start to do it now, but we need to see what the answers look like” with additional validation.
Afirma GSC with medullary thyroid cancer classifier
In a third study, investigators developed and validated a classifier for medullary thyroid cancer to be used with the Afirma GSC. They were led by Gregory Randolph, MD, professor of otolaryngology and the Claire and John Bertucci Endowed Chair in Thyroid Surgical Oncology at Harvard Medical School, and division chief of the general and thyroid/parathyroid endocrine surgical divisions at the Massachusetts Eye and Ear Infirmary, Boston.
Better preoperative identification of this cancer is key for several reasons, he maintained.
Establishing the diagnosis from needle biopsy is challenging, because some features overlap with those of other thyroid lesions, according to Dr. Randolph. In about a third of patients with medullary thyroid cancer brought to the operating room, the diagnosis is unknown at the time, and that often results in inadequate initial surgery.
The investigators developed a medullary thyroid cancer classifier cassette that assesses differential expression of 108 genes. They then performed blinded, independent validation in a cohort of 211 fine-needle aspiration samples from thyroid nodules: 21 medullary thyroid cancers and 190 other benign and malignant neoplasms.
Results showed that the Afirma GSC with the medullary thyroid cancer classifier had sensitivity of 100% and specificity of 100%, reported Dr. Randolph.
“The Afirma GSC medullary thyroid cancer testing cassette, within the larger GSC system, uses RNA sequencing and advanced machine learning to improve the diagnostic detection of medullary thyroid cancer, which currently misses approximately a third of medullary thyroid cancer patients,” he said.
Session attendees wondered which patients are appropriate candidates and how much the test will cost.
“We have to have a discussion about that, because the missed medullaries are, frankly, widely distributed – they can be in any of the Bethesda categories, basically,” Dr. Randolph said. “So, there are cytopathologic mistakes made uniformly, including in the suspicious and frankly malignant Bethesda categories. In terms of cost, this is embedded in the GSC classifier; so, if you order that test, you will obtain this medullary cassette.”
Actual sensitivity of the classifier may ultimately be less than 100% with use in larger samples, he acknowledged. “I think a greater number of validation tests is absolutely in order. I imagine this classifier may not be perfect, but it is way better than the third we miss with just cytopathology.”
Dr. Nikiforov disclosed that he is owner of an IP for ThyroSeq, and that his laboratory has a contract to offer the test commercially. Dr. Duh disclosed that he had no relevant conflicts of interest. Dr. Randolph disclosed that he had no relevant conflicts of interest.
AT ATA 2017
Key clinical point:
Major finding: ThyroSeq v3 had a negative predictive value of 97%. Specificity was an absolute 47% greater for Afirma GSC with Hurthle-specific classifiers than for Afirma GEC. The Afirma GSC with a medullary thyroid cancer classifier had 100% sensitivity and specificity.
Data source: Validation studies of the ThyroSeq v3 classifier (257 samples), the Afirma GSC with Hurthle-specific classifiers (186 samples), and the Afirma GSC with a medullary thyroid cancer classifier (211 samples).
Disclosures: Dr. Nikiforov disclosed that he is owner of an IP for ThyroSeq, and that his laboratory has a contract to offer the test commercially. Dr. Duh disclosed that he had no relevant conflicts of interest. Dr. Randolph disclosed that he had no relevant conflicts of interest.
How to manage cytokine release syndrome
ATLANTA – Closely monitoring for cytokine release syndrome (CRS) and starting anticytokine therapy early can prevent life-threatening organ toxicities in recipients of chimeric antigen receptor (CAR) T-cell therapy, according to Daniel W. Lee III, MD.
There’s no evidence that early anticytokine therapy impairs antitumor response, he noted. “If you wait to give anticytokine therapy until a patient is intubated, it’s too late,” Dr. Lee said at the annual meeting of the American Society of Hematology. “If you wait until a patient has been hypotensive for days, it’s probably too late. If you intervene earlier, you can avoid intubation.”

Treating CRS is a clinical decision that shouldn’t hinge on cytokine levels, according to Dr. Lee. He and his colleagues base treatment on their revised severity grading assessment, which spans mild, moderate, severe, and life-threatening syndromes (Blood. 2014;124:188-95).
Using a consistent CRS severity grading system enables physicians to treat rationally across trials and CAR T-cell therapies, he said. His system defines grade 1 CRS as flu-like symptoms and fever up to 41.5 degrees Celsius. Patients with grade 1 CRS should receive antipyretics and analgesia as needed and should be monitored closely for infections and fluid imbalances, Dr. Lee said.
Hypotension signifies progression beyond grade 1 CRS. Affected patients should receive no more than two to three IV fluid boluses and then should “quickly move on to vasopressors,” such as norepinephrine, he emphasized.
His and his team implemented this important change after one of their patients, a 14-year-old boy with severe hypotensive grade 4 CRS, died of a cardiovascular event after receiving multiple IV fluid boluses. “We had not appreciated the extent of this patient’s ventricular strain,” Dr. Lee said. The patient was heavily pretreated and had an “extremely high disease burden” (more than 99% marrow involvement, hepatosplenomegaly, and pronounced blastic leukocytosis), which increased his risk of severe CRS, he noted. “Admittedly, we pushed the envelope a little bit, and we learned you should start anticytokine therapies much earlier. Earlier seems to be better, although we do not yet know if prophylactic tocilizumab or corticosteroids can prevent CRS symptoms before they start.”
For hypotensive patients on pressors, Dr. Lee recommends vigilant supportive care and daily echocardiograms to monitor ejection fraction and ventricular wall mobility. His system defines grade 2 CRS as hypotension responsive to one low-dose pressor or to fluid therapy and hypoxia responsive to less than 40% oxygen therapy. Patients with grade 2 CRS who also have comorbidities should receive tocilizumab – with or without corticosteroids – both of which “remain the standard of care for managing CRS,” he said. Severe CRS often stems from supraphysiologic release of interleukin 6, which induces not only classic IL-6 signaling but also proinflammatory trans-signaling across many cell types. Tocilizumab reverses this process by binding and blocking the IL-6 receptor, Dr. Lee noted.
Patients with grade 3 CRS have hypotension requiring multiple or high-dose pressors and hypoxia requiring at least 40% oxygen therapy. These patients have grade 3 organ toxicity and grade 4 transaminitis, Dr. Lee said. Even if they lack comorbidities, they need vigilant supportive care, tocilizumab, and possibly corticosteroids, he added. The ultimate goal is to avoid grade 4 CRS, he said, which involves grade 4 organ toxicity, requires mechanical ventilation, and yields a poor prognosis despite vigilant supportive care, tocilizumab, and corticosteroids.
Dr. Lee reported having no relevant conflicts of interest.
ATLANTA – Closely monitoring for cytokine release syndrome (CRS) and starting anticytokine therapy early can prevent life-threatening organ toxicities in recipients of chimeric antigen receptor (CAR) T-cell therapy, according to Daniel W. Lee III, MD.
There’s no evidence that early anticytokine therapy impairs antitumor response, he noted. “If you wait to give anticytokine therapy until a patient is intubated, it’s too late,” Dr. Lee said at the annual meeting of the American Society of Hematology. “If you wait until a patient has been hypotensive for days, it’s probably too late. If you intervene earlier, you can avoid intubation.”
Treating CRS is a clinical decision that shouldn’t hinge on cytokine levels, according to Dr. Lee. He and his colleagues base treatment on their revised severity grading assessment, which spans mild, moderate, severe, and life-threatening syndromes (Blood. 2014;124:188-95).
Using a consistent CRS severity grading system enables physicians to treat rationally across trials and CAR T-cell therapies, he said. His system defines grade 1 CRS as flu-like symptoms and fever up to 41.5 degrees Celsius. Patients with grade 1 CRS should receive antipyretics and analgesia as needed and should be monitored closely for infections and fluid imbalances, Dr. Lee said.
Hypotension signifies progression beyond grade 1 CRS. Affected patients should receive no more than two to three IV fluid boluses and then should “quickly move on to vasopressors,” such as norepinephrine, he emphasized.
His and his team implemented this important change after one of their patients, a 14-year-old boy with severe hypotensive grade 4 CRS, died of a cardiovascular event after receiving multiple IV fluid boluses. “We had not appreciated the extent of this patient’s ventricular strain,” Dr. Lee said. The patient was heavily pretreated and had an “extremely high disease burden” (more than 99% marrow involvement, hepatosplenomegaly, and pronounced blastic leukocytosis), which increased his risk of severe CRS, he noted. “Admittedly, we pushed the envelope a little bit, and we learned you should start anticytokine therapies much earlier. Earlier seems to be better, although we do not yet know if prophylactic tocilizumab or corticosteroids can prevent CRS symptoms before they start.”
For hypotensive patients on pressors, Dr. Lee recommends vigilant supportive care and daily echocardiograms to monitor ejection fraction and ventricular wall mobility. His system defines grade 2 CRS as hypotension responsive to one low-dose pressor or to fluid therapy and hypoxia responsive to less than 40% oxygen therapy. Patients with grade 2 CRS who also have comorbidities should receive tocilizumab – with or without corticosteroids – both of which “remain the standard of care for managing CRS,” he said. Severe CRS often stems from supraphysiologic release of interleukin 6, which induces not only classic IL-6 signaling but also proinflammatory trans-signaling across many cell types. Tocilizumab reverses this process by binding and blocking the IL-6 receptor, Dr. Lee noted.
Patients with grade 3 CRS have hypotension requiring multiple or high-dose pressors and hypoxia requiring at least 40% oxygen therapy. These patients have grade 3 organ toxicity and grade 4 transaminitis, Dr. Lee said. Even if they lack comorbidities, they need vigilant supportive care, tocilizumab, and possibly corticosteroids, he added. The ultimate goal is to avoid grade 4 CRS, he said, which involves grade 4 organ toxicity, requires mechanical ventilation, and yields a poor prognosis despite vigilant supportive care, tocilizumab, and corticosteroids.
Dr. Lee reported having no relevant conflicts of interest.
EXPERT ANALYSIS FROM ASH 2017
Conference News Roundup—Radiological Society of North America
Imaging Shows Youth Football’s Effects on the Brain
School-age football players with a history of concussion and high impact exposure undergo brain changes after one season of play, according to two studies conducted at the University of Texas Southwestern Medical Center in Dallas and Wake Forest University in Winston-Salem, North Carolina.
Both studies analyzed the default mode network (DMN), a system of brain regions that is active during wakeful rest. Changes in the DMN are observed in patients with mental disorders. Decreased connectivity within the network is also associated with traumatic brain injury.
“The DMN exists in the deep gray matter areas of the brain,” said Elizabeth M. Davenport, PhD, a postdoctoral researcher in the Advanced NeuroScience Imaging Research (ANSIR) lab at UT Southwestern’s O’Donnell Brain Institute. “It includes structures that activate when we are awake and engaging in introspection or processing emotions, which are activities that are important for brain health.”
In the first study, researchers studied youth football players without a history of concussion to identify the effect of repeated subconcussive impacts on the DMN.
“Over a season of football, players are exposed to numerous head impacts. The vast majority of these do not result in concussion,” said Gowtham Krishnan Murugesan, a PhD student in biomedical engineering and member of the ANSIR laboratory. “This work adds to a growing body of literature indicating that subconcussive head impacts can have an effect on the brain. This is a highly understudied area at the youth and high school level.”
For the study, 26 youth football players (ages 9–13) were outfitted with the Head Impact Telemetry System (HITS) for an entire football season. HITS helmets are lined with accelerometers that measure the magnitude, location, and direction of impacts to the head. Impact data from the helmets were used to calculate a risk of concussion exposure for each player.
Players were separated into high and low concussion exposure groups. Players with a history of concussion were excluded. A third group of 13 noncontact sport controls was established. Pre- and post-season resting functional MRI (fMRI) scans were performed on all players and controls, and connectivity within the DMN subcomponents was analyzed. The researchers used machine learning to analyze the fMRI data.
“Machine learning has a lot to add to our research because it gives us a fresh perspective and an ability to analyze the complex relationships within the data,” said Mr. Murugesan. “Our results suggest an increasing functional change in the brain with increasing head impact exposure.”
Five machine learning classification algorithms were used to predict whether players were in the high-exposure, low-exposure or noncontact groups, based on the fMRI results. The algorithm discriminated between high-impact exposure and noncontact controls with 82% accuracy, and between low-impact exposure and noncontact controls with 70% accuracy. The results suggest an increasing functional change with increasing head-impact exposure.
“The brains of these youth and adolescent athletes are undergoing rapid maturation in this age range. This study demonstrates that playing a season of contact sports at the youth level can produce neuroimaging brain changes, particularly for the DMN,” Mr. Murugesan said.
In the second study, 20 high school football players (median age, 16.9) wore helmets outfitted with HITS for a season. Of the 20 players, five had experienced at least one concussion, and 15 had no history of concussion.
Before and following the season, the players underwent an eight-minute magnetoencephalography (MEG) scan, which records and analyzes the magnetic fields produced by brain activity. Researchers then analyzed the MEG power associated with the eight brain regions of the DMN.
Post-season, the five players with a history of concussion had significantly lower connectivity between DMN regions. Players with no history of concussion had, on average, an increase in DMN connectivity.
The results demonstrate that concussions from previous years can influence the changes occurring in the brain during the current season, suggesting that longitudinal effects of concussion affect brain function.
“The brain’s DMN changes differently as a result of previous concussion,” said Dr. Davenport. “Previous concussion seems to prime the brain for additional changes. Concussion history may be affecting the brain’s ability to compensate for subconcussive impacts.”
Both researchers said that larger data sets, longitudinal studies that follow young football players, and research that combines MEG and fMRI are needed to better understand the complex factors involved in concussions.
Neurofeedback May Help Treat Tinnitus
Functional MRI (fMRI) suggests that neurofeedback training has the potential to reduce the severity of tinnitus or eliminate it.
Tinnitus affects approximately one in five people. As patients focus more on the noise, they become more frustrated and anxious, which in turn makes the noise seem worse. The primary auditory cortex has been implicated in tinnitus-related distress.
Researchers examined a potential way to treat tinnitus by having people use neurofeedback training to divert their focus from the sounds in their ears. Neurofeedback is a way of training the brain by allowing an individual to view an external indicator of brain activity and attempt to exert control over it.
“The idea is that in people with tinnitus, there is an overattention drawn to the auditory cortex, making it more active than in a healthy person,” said Matthew S. Sherwood, PhD, a research engineer in the Department of Biomedical, Industrial, and Human Factors Engineering at Wright State University in Fairborn, Ohio. “Our hope is that tinnitus sufferers could use neurofeedback to divert attention away from their tinnitus and possibly make it go away.”
To determine the potential efficacy of this approach, the researchers asked 18 healthy volunteers with normal hearing to undergo five fMRI-neurofeedback training sessions. Study participants were given earplugs through which white noise could be introduced. The earplugs also blocked out the scanner noise.
To obtain fMRI results, the researchers used single-shot echoplanar imaging, an MRI technique that is sensitive to blood oxygen levels, providing an indirect measure of brain activity.
“We started with alternating periods of sound and no sound in order to create a map of the brain and find areas that produced the highest activity during the sound phase,” said Dr. Sherwood. “Then we selected the voxels that were heavily activated when sound was being played.”
The subjects then participated in the fMRI-neurofeedback training phase while inside the MRI scanner. They received white noise through their earplugs and were able to view the activity in their primary auditory cortex as a bar on a screen. Each fMRI-neurofeedback training session contained eight blocks separated into a 30-second “relax” period, followed by a 30-second “lower” period. Participants were instructed to watch the bar during the relax period and attempt to lower it by decreasing primary auditory cortex activity during the lower phase. The researchers gave the participants techniques to help them do this, such as trying to divert attention from sound to other sensations like touch and sight.
“Many focused on breathing because it gave them a feeling of control,” said Dr. Sherwood. “By diverting their attention away from sound, the participants’ auditory cortex activity went down, and the signal we were measuring also went down.”
A control group of nine individuals was provided sham neurofeedback. They performed the same tasks as the other group, but the feedback came not from them, but from a random participant. By performing the exact same procedures with both groups using either real or sham neurofeedback, the researchers were able to distinguish the effect of real neurofeedback on control of the primary auditory cortex.
The study represents the first time that fMRI-neurofeedback training has been applied to demonstrate that there is a significant relationship between control of the primary auditory cortex and attentional processes. This result is important to therapeutic development, said Dr. Sherwood, because the neural mechanisms of tinnitus are unknown, but likely related to attention.
The results represent a promising avenue of research that could lead to improvements in other areas of health, like pain management, according to Dr. Sherwood. “Ultimately, we would like to take what we learned from MRI and develop a neurofeedback program that does not require MRI to use, such as an app or home-based therapy that could apply to tinnitus and other conditions,” he said.
Migraine Is Associated With High Sodium Levels in CSF
Migraineurs have significantly higher sodium concentrations in their CSF than people without migraine, according to the first study to use a technique called sodium MRI to examine patients with migraine.
Diagnosis of migraine is challenging, as the characteristics of migraines and the types of attacks vary widely among patients. Consequently, many patients with migraine are undiagnosed and untreated. Other patients, in contrast, are treated with medications for migraines even though they have a different type of headache, such as tension-type headache.
“It would be helpful to have a diagnostic tool supporting or even diagnosing migraine and differentiating migraine from all other types of headache,” said Melissa Meyer, MD, a radiology resident at the Institute of Clinical Radiology and Nuclear Medicine at University Hospital Mannheim and Heidelberg University in Heidelberg, Germany.
Dr. Meyer and colleagues explored a technique called cerebral sodium MRI as a possible means to help in the diagnosis and understanding of migraine. While MRI most often relies on protons to generate an image, sodium can be visualized as well. Research has shown that sodium plays an important role in brain chemistry.
The researchers recruited 12 women (mean age, 34) who had been clinically evaluated for migraine. The women filled out a questionnaire regarding the length, intensity, and frequency of their migraine attacks and accompanying auras. The researchers also enrolled 12 healthy women of similar age as a control group. Both groups underwent cerebral sodium MRI. Sodium concentrations of patients with migraine and healthy controls were compared and statistically analyzed.
The researchers found no significant differences between the two groups in sodium concentrations in the gray and white matter, brainstem, and cerebellum. Significant differences emerged, however, when the researchers looked at sodium concentrations in the CSF. Overall, sodium concentrations were significantly higher in the CSF of migraineurs than in healthy controls.
“These findings might facilitate the challenging diagnosis of a migraine,” said Dr. Meyer. The researchers hope to learn more about the connection between migraine and sodium in future studies. “As this was an exploratory study, we plan to examine more patients, preferably during or shortly after a migraine attack, for further validation.”
Gadolinium May Not Cause Neurologic Harm
There is no evidence that accumulation of gadolinium in the brain speeds cognitive decline, according to researchers.
“Approximately 400 million doses of gadolinium have been administered since 1988,” said Robert J. McDonald, MD, PhD, a neuroradiologist at the Mayo Clinic in Rochester, Minnesota. “Gadolinium contrast material is used in 40% to 50% of MRI scans performed today.”
Scientists previously believed that gadolinium contrast material could not cross the blood–brain barrier. Recent studies, however, including one by Dr. McDonald and colleagues, found that traces of gadolinium could be retained in the brain for years after MRI.
On September 8, 2017, the FDA recommended adding a warning about gadolinium retention in various organs, including the brain, to labels for gadolinium-based contrast agents used during MRI. The FDA highlighted several specific patient populations at greater risk, including children and pregnant women. Yet little is known about the health effects, if any, of gadolinium that is retained in the brain.
For this study, Dr. McDonald and colleagues set out to identify the neurotoxic potential of intracranial gadolinium deposition following IV administration of gadolinium-based contrast agents during MRI. The researchers used the Mayo Clinic Study of Aging (MCSA), the world’s largest prospective population-based cohort on aging, to study the effects of gadolinium exposure on neurologic and neurocognitive function.
All MCSA participants underwent extensive neurologic evaluation and neuropsychologic testing at baseline and 15-month follow-up intervals. Neurologic and neurocognitive scores were compared using standard methods between MCSA patients with no history of prior gadolinium exposure and those who had undergone prior MRI with gadolinium-based contrast agents. Progression from normal cognitive status to mild cognitive impairment and dementia was assessed using multistate Markov model analysis.
The study included 4,261 cognitively normal men and women between ages 50 and 90 (mean age, 72). Mean length of study participation was 3.7 years. Of the 4,261 participants, 1,092 (25.6%) had received one or more doses of gadolinium-based contrast agents, with at least one participant receiving as many as 28 prior doses. Median time since first gadolinium exposure was 5.6 years.
After adjusting for age, sex, education level, baseline neurocognitive performance, and other factors, gadolinium exposure was not a significant predictor of cognitive decline, dementia, diminished neuropsychologic performance, or diminished motor performance. No dose-related effects were observed among these metrics. Gadolinium exposure was not an independent risk factor in the rate of cognitive decline from normal cognitive status to dementia in this study group.
“There is concern over the safety of gadolinium-based contrast agents, particularly relating to gadolinium retention in the brain and other tissues,” said Dr. McDonald. “This study provides useful data that at the reasonable doses [that] 95% of the population is likely to receive in their lifetime, there is no evidence at this point that gadolinium retention in the brain is associated with adverse clinical outcomes.”