User login
C7 nerve transfer shows promising results for spastic arm paralysis
Patients with spastic arm paralysis who received a contralateral C7 nerve graft from their nonparalyzed side to their paralyzed side led to greater improvement in arm function and reduction in spasticity after a year, compared with rehabilitation alone, investigators from Huashan Hospital in China reported online Jan. 3 in the New England Journal of Medicine.
The researchers randomly assigned 36 patients who had unilateral arm paralysis for at least 5 years to either surgical C7 nerve transfer plus rehabilitation or rehabilitation only. Results of the trial’s primary outcome – arm function using the Fugl-Meyer score – showed that those in the surgery group had an average increase of 17.7, while those in the rehabilitation-only group had an average increase of 2.6 (P less than .001). This 15.1-point difference had a 95% confidence interval ranging from 12.2 to 17.9.
To evaluate spasticity, the researchers used the Modified Ashworth Scale, which is a 0-5 scale to score spasticity; a higher score means more spasticity. Surgery patients saw improvement from baseline in all five areas measured across the board, and none saw worsening in scores. The smallest difference between the two groups was in thumb extension, with 15 surgery patients having a 1- and 2-unit improvement and 3 having no change, while 7 controls showed a 1- or 2-unit improvement, another 7 showed no improvement, and 4 had a 1-unit worsening in score (P less than .001). At 1 year, 16 (89%) of surgery patients could accomplish three or more of the functional tasks researchers gave them, whereas none of the controls could.
“The majority of clinical improvements coincided with physiological evidence of connectivity between the hemisphere on the side of the donor nerve and the paralyzed arm,” said lead author Mou-Xiong Zheng, MD, PhD, of the department of hand surgery at Huashan Hospital at Fudan University in Shanghai, and colleagues.
The research by Dr. Zheng and coauthors arises from what is known about hand paralysis after stroke, that damage to the contralateral cerebral hemisphere arises from interruption of the inhibitory activity of upper motor neurons, which causes spasticity, along with hand weakness and loss of fractionated fine motor control. Other studies have noted activity in the cerebral hemisphere on the same side of paralysis during recovery (Neuroimage. 2004;22:1775-83; J Neurophysiol. 2005;93:1209-22; J Neurosci. 2006;26:6096-102; Front Neurol. 2015;6:214), but Dr. Zheng and coauthors noted “sparse” connections between the hand and that part of the brain limit the body’s ability to compensate for spasticity and functional loss.
The latest study followed earlier studies, including one by Dr. Zheng’s coauthors (J Hand Surg Br. 1992;17:518-21), that reported the paralyzed hand could be connected to the unaffected hemisphere by transferring a cervical spine nerve from the nonparalyzed side, a treatment previously reported for injuries of the brachial plexus. Of the five nerves of the brachial plexus, Dr. Zheng and coauthors chose the C7 nerve because it accounts for about 20% of the nerve fibers in the brachial bundle and severing the nerve typically results in transient weakness and numbness in the arm or leg on the same side. Hence, when evaluating the hand on the side of the donor graft, the researchers found no significant changes in power, tactile threshold, or two-point discrimination as a result of surgery.
Their surgical approach was a modification of the C7 nerve transfer method that Dr. Zheng and coauthors had previously reported (Microsurgery. 2011;31:404-8; Neurosurgery. 2015;76:187-95). The operation involved making an incision at the superior aspect of the sternum, mobilizing the donor C7 nerve on the nonparalyzed side, and routing it between the spinal column and esophagus. Then, an anastomosis was performed directly with the C7 nerve on the paralyzed side.
Rehabilitation therapy for both the surgery group and controls was identical, administered four times weekly for 12 months at a single facility, although surgery patients wore an immobilizing cast after their operations.
The nature of the study population – men of varying ages with varying causes of the underlying cerebral lesions – makes it difficult to generalize the findings, Dr. Zheng and coauthors noted. “A larger cohort, followed for a longer period, would be necessary to determine whether cervical nerve transfer results in safe, consistent, and long-term improvements in the function of an arm that is chronically paralyzed as a result of a cerebral lesion,” the authors concluded.
Grants from the following supported the study: National Natural Science Foundation of China; Science and Technology Commission of Shanghai Municipality; Health and Family Planning Commission of Shanghai; and Shanghai Shen-Kang Hospital Development Center.
The results that Dr. Zheng and coauthors reported “are exciting,” said Robert J. Spinner, MD, Alexander Y. Shin, MD, and Allen T. Bishop, MD, in an accompanying editorial, “but need clarification and confirmation” (N Engl J Med. 2017 Dec 20. doi: 10.1056/NEJMe1713313).
Among questions Dr. Spinner and coauthors raised about the study is whether distal muscles can functionally reinnervate in a year, and if C7 neurotomy on the paralyzed side led to improvements in spasticity and function. “The C7 neurotomy itself, associated with an immediate reduction in spasticity, represents a major advance for some patients with brain injury who have poor function and spasticity,” the authors of the editorial noted. Improvement of the damaged motor cortex, which ongoing physical therapy may enhance, may also contribute to a reduction in spasticity.
Dr. Spinner and coauthors also cited a previous trial by some of Dr. Zheng’s coauthors that showed 49% of patients with brachial plexus injury had motor recovery within 7 years (Chin Med J [Engl]. 2013;126:3865-8). “The presence of physiological connectivity observed in the trials does not necessarily equate with functional recovery,” the authors stated.
Future studies of surgical C7 nerve transfer in patients with one-sided arm paralysis should include patients who have C7 neurotomy without nerve transfer, Dr. Spinner and coauthors said. They also noted that Dr. Zheng and coauthors perform a relatively high volume of these operations, so their results may not be easy to reproduce elsewhere.
“Factors other than technical ones, including differences in body-mass index and limb length across different populations, may lead to different surgical outcomes,” Dr. Spinner and coauthors said. Future research should focus on ways to enhance or speed up nerve regeneration, improve plasticity, and maximize rehabilitation, they added.
Dr. Spinner, Dr. Shin, and Dr. Bishop are with the departments of neurologic surgery and orthopedics, division of hand surgery, at the Mayo Clinic in Rochester, Minn.
Patients with spastic arm paralysis who received a contralateral C7 nerve graft from their nonparalyzed side to their paralyzed side led to greater improvement in arm function and reduction in spasticity after a year, compared with rehabilitation alone, investigators from Huashan Hospital in China reported online Jan. 3 in the New England Journal of Medicine.
The researchers randomly assigned 36 patients who had unilateral arm paralysis for at least 5 years to either surgical C7 nerve transfer plus rehabilitation or rehabilitation only. Results of the trial’s primary outcome – arm function using the Fugl-Meyer score – showed that those in the surgery group had an average increase of 17.7, while those in the rehabilitation-only group had an average increase of 2.6 (P less than .001). This 15.1-point difference had a 95% confidence interval ranging from 12.2 to 17.9.
To evaluate spasticity, the researchers used the Modified Ashworth Scale, which is a 0-5 scale to score spasticity; a higher score means more spasticity. Surgery patients saw improvement from baseline in all five areas measured across the board, and none saw worsening in scores. The smallest difference between the two groups was in thumb extension, with 15 surgery patients having a 1- and 2-unit improvement and 3 having no change, while 7 controls showed a 1- or 2-unit improvement, another 7 showed no improvement, and 4 had a 1-unit worsening in score (P less than .001). At 1 year, 16 (89%) of surgery patients could accomplish three or more of the functional tasks researchers gave them, whereas none of the controls could.
“The majority of clinical improvements coincided with physiological evidence of connectivity between the hemisphere on the side of the donor nerve and the paralyzed arm,” said lead author Mou-Xiong Zheng, MD, PhD, of the department of hand surgery at Huashan Hospital at Fudan University in Shanghai, and colleagues.
The research by Dr. Zheng and coauthors arises from what is known about hand paralysis after stroke, that damage to the contralateral cerebral hemisphere arises from interruption of the inhibitory activity of upper motor neurons, which causes spasticity, along with hand weakness and loss of fractionated fine motor control. Other studies have noted activity in the cerebral hemisphere on the same side of paralysis during recovery (Neuroimage. 2004;22:1775-83; J Neurophysiol. 2005;93:1209-22; J Neurosci. 2006;26:6096-102; Front Neurol. 2015;6:214), but Dr. Zheng and coauthors noted “sparse” connections between the hand and that part of the brain limit the body’s ability to compensate for spasticity and functional loss.
The latest study followed earlier studies, including one by Dr. Zheng’s coauthors (J Hand Surg Br. 1992;17:518-21), that reported the paralyzed hand could be connected to the unaffected hemisphere by transferring a cervical spine nerve from the nonparalyzed side, a treatment previously reported for injuries of the brachial plexus. Of the five nerves of the brachial plexus, Dr. Zheng and coauthors chose the C7 nerve because it accounts for about 20% of the nerve fibers in the brachial bundle and severing the nerve typically results in transient weakness and numbness in the arm or leg on the same side. Hence, when evaluating the hand on the side of the donor graft, the researchers found no significant changes in power, tactile threshold, or two-point discrimination as a result of surgery.
Their surgical approach was a modification of the C7 nerve transfer method that Dr. Zheng and coauthors had previously reported (Microsurgery. 2011;31:404-8; Neurosurgery. 2015;76:187-95). The operation involved making an incision at the superior aspect of the sternum, mobilizing the donor C7 nerve on the nonparalyzed side, and routing it between the spinal column and esophagus. Then, an anastomosis was performed directly with the C7 nerve on the paralyzed side.
Rehabilitation therapy for both the surgery group and controls was identical, administered four times weekly for 12 months at a single facility, although surgery patients wore an immobilizing cast after their operations.
The nature of the study population – men of varying ages with varying causes of the underlying cerebral lesions – makes it difficult to generalize the findings, Dr. Zheng and coauthors noted. “A larger cohort, followed for a longer period, would be necessary to determine whether cervical nerve transfer results in safe, consistent, and long-term improvements in the function of an arm that is chronically paralyzed as a result of a cerebral lesion,” the authors concluded.
Grants from the following supported the study: National Natural Science Foundation of China; Science and Technology Commission of Shanghai Municipality; Health and Family Planning Commission of Shanghai; and Shanghai Shen-Kang Hospital Development Center.
FROM NEW ENGLAND JOURNAL OF MEDICINE
Key clinical point:
Major finding: Mean increase in Fugl-Meyer score in the paralyzed arm was 17.7 in the surgery group and 2.6 in the control group at 12 months (P less than .001).
Data source: Thirty-six patients with unilateral arm paralysis randomly assigned to C7 nerve transfer plus rehabilitation or rehabilitation alone.
Disclosures: The National Natural Science Foundation of China, the Science and Technology Commission of Shanghai Municipality, the Health and Family Planning Commission of Shanghai, and the Shanghai Shen-Kang Hospital Development Center provided funding for the study.
Source: Zheng M et al. N Engl J Med. 2018;378:22-34
The Role of White Matter in Focal Epilepsy
Pathological changes in the brain’s white matter may contribute to focal epilepsy, suggests a recent review of the scientific research.
- Investigators have uncovered pathological changes in white matter myelination, axonal integrity, and cellular composition among patients with epilepsy, based on ex vivo and postmortem studies.
- Microstructural changes in several areas of the brain’s white matter near and at a distance from the epileptic focus have been discovered with the help of diffusion-weighted magnetic resonance imaging (MRI), including diffusion tensor imaging.
- MRI of the brain’s white matter may also be helpful in predicting patients’ cognitive functioning and how they respond to drug and surgical treatment.
- The literature review focuses on temporal lobe epilepsy and focal cortical dysplasia and the white matter anomalies detected in these disorders.
Histological and MRI markers of white matter damage in focal epilepsy. Epilepsy Res. 2018;140:29-38.
Autologous stem-cell transplantation for scleroderma beats cyclophosphamide in long term
with improved event-free and overall survival over intravenous cyclophosphamide, according to Keith M. Sullivan, MD, and his associates.
A total of 75 patients with severe scleroderma (diffuse cutaneous systemic sclerosis) underwent randomization to open-label treatment with either transplantation or intravenous cyclophosphamide at an initial dose of 500 mg/m2 of body-surface area, followed by 11 monthly infusions of 750 mg/m2 with mesna prophylaxis.
Additionally in the per-protocol population, the rate of event-free survival at 54 months was 79% in the transplantation group and 50% in the cyclophosphamide group, while the Kaplan-Meier estimated rate of event-free survival at 72 months was 74% in the transplantation group and 47% in the cyclophosphamide group (P = .03), and the rate of overall survival was 86% and 51% (P = .02). Also, in the per-protocol population at 54 months, the percentage of participants who had initiated disease-modifying antirheumatic drugs was lower in the transplantation group than in the cyclophosphamide group (9% vs. 44%; P = .001).
The researchers noted that 21 deaths occurred over a period of 72 months, including 7 participants in the transplantation group, of whom 3 died without receiving a transplant. The percentage of participants who had serious adverse events in the 72-month period was lower in the cyclophosphamide group than in the transplantation group (51% vs. 74%).
“In conclusion, at 54 months after randomization, myeloablative CD34-positive selected autologous hematopoietic stem-cell transplantation resulted in significantly better clinical outcomes than 12 months of cyclophosphamide,” the researchers wrote. “Although there was greater hematopoietic toxicity and an unquantified risk of second cancers from exposure to total body irradiation, toxic effects should be weighed against the beneficial results of treatment and the seriousness of the underlying disease.”
FROM THE NEW ENGLAND JOURNAL OF MEDICINE
Thrombectomy shines in presence of a clinical deficit and imaging mismatch
, according to Raul G. Nogueira, MD, and his DAWN trial coinvestigators.
A total of 206 patients who had experienced occlusion of the intracranial internal carotid artery or proximal middle cerebral artery in the past 6-24 hours were included in the study – 107 receiving thrombectomy with the Trevo device plus standard care and 99 receiving standard care alone. After 90 days of treatment, the mean utility-weighted modified Rankin scale score for patients who received thrombectomy was 5.5, compared with 3.4 in the control group. The rate of functional independence was 49% in the thrombectomy group and 13% in the control group.

“Further studies are needed to establish the prevalence of patients who would be eligible for thrombectomy among the entire population of patients with ischemic stroke. Further studies are also needed to determine whether late thrombectomy has a benefit when more widely available imaging techniques are used to estimate the infarct volume at presentation, such as assessment of the extent of hypodensity on non–contrast-enhanced CT,” the investigators noted.
SOURCE: Nogueira R et al. N Engl J Med. 2018;378:11-21
, according to Raul G. Nogueira, MD, and his DAWN trial coinvestigators.
A total of 206 patients who had experienced occlusion of the intracranial internal carotid artery or proximal middle cerebral artery in the past 6-24 hours were included in the study – 107 receiving thrombectomy with the Trevo device plus standard care and 99 receiving standard care alone. After 90 days of treatment, the mean utility-weighted modified Rankin scale score for patients who received thrombectomy was 5.5, compared with 3.4 in the control group. The rate of functional independence was 49% in the thrombectomy group and 13% in the control group.
“Further studies are needed to establish the prevalence of patients who would be eligible for thrombectomy among the entire population of patients with ischemic stroke. Further studies are also needed to determine whether late thrombectomy has a benefit when more widely available imaging techniques are used to estimate the infarct volume at presentation, such as assessment of the extent of hypodensity on non–contrast-enhanced CT,” the investigators noted.
SOURCE: Nogueira R et al. N Engl J Med. 2018;378:11-21
FROM NEW ENGLAND JOURNAL OF MEDICINE
More thoughts about hospitalist burnout
I wrote about physician burnout and well-being in the July 2017 version of this column, and am still thinking a great deal about those issues. In the past 6 months, I can’t identify anything that strikes me as a real breakthrough in addressing these issues. However, the ever-increasing attention and resources directed at physician burnout and wellness, on both a local and national level, strike me as reason for cautious optimism.
A chief wellness officer
In summer 2017, Stanford University created a new physician executive role called chief wellness officer (CWO). As far as I am aware, this is the first such position connected with a hospital or medical school. It will be interesting to see if other organizations create similar positions, although I suspect that in places where it is explicitly recognized as a priority, responsibility for this work will be one of the many duties of a chief medical officer or other such executive, and not a position devoted solely to wellness. Interestingly, an Internet search revealed that some non–health care businesses have executive positions with that title, though the role seems focused more on physical health – as in exercise and smoking cessation – than emotional well-being and burnout.
According to a statement on the Stanford Medicine website, the new CWO will work with colleagues to continue “building on its innovative WellMD Center , which was established in 2016. The center has engaged more than 200 physicians through programs focusing on peer support, stress reduction, and ways to cultivate compassion and resilience, as well as a literature and a dinner series in which physicians explore the challenges and rewards of being a doctor. The center also aims to relieve some of the burden on physicians by improving efficiency and simplifying workplace systems, such as electronic medical records.”
A national conference
Over the last 2 or 3 years many, if not most, physician conferences, including the SHM annual conference, have added some content around physician burnout and well-being. But for the first time I’m aware of, an entire conference, the American Conference on Physician Health, addressed these topics in San Francisco in October 2017, and attracted 425 attendees along with an all-star faculty. I couldn’t attend myself, but found a reporter’s summary informative and I recommend it.
While the summary didn’t suggest the conference provided a cure or simple path to improvement, I’m encouraged that the topic has attracted the attention of some pretty smart people. If there is a second edition of this conference, I’ll try hard to attend.
Worthwhile web resources
The home page of Stanford’s WellMD Center provides a continuously updated list of recent research publications on physician health and links to many other resources, and is worth bookmarking.
Another great educational resource for physician wellness is the AMA’s STEPS Forward, a site devoted to practice improvement that provides guidance on patient care, work flow and process, leading change, technology and finance, as well as professional well-being. Of the five separate education modules in the latter category, I found the one on “Preventing Physician Burnout” especially informative. The site is free, doesn’t require an AMA membership, and can provide CME credit.
Making a difference locally: Individuals
Surveys, research, and the experience of experts available via the above resources and others are very valuable, but may be hard to translate into action for you and your fellow local caregivers. My sense is that many hospitalists address their own work-related distress by simply working less in total – reducing their full-time equivalents. That may be the most tangible and accessible intervention, and undeniably the right thing to do in some cases. But it isn’t an ideal approach for our field, which faces chronic staffing shortages. And it doesn’t do anything to change the average level of distress of a day of work. I worry that many people will find disappointment if working fewer shifts is their only burnout mitigation strategy.

Ensuring that you have some work-related interest outside of direct patient care, such as being the local electronic health record expert, or even the person leading formation of a support committee, can be really valuable. I first addressed this topic in the June 2011 issue of The Hospitalist, and there is a long list of things to consider: mindfulness, practicing “ self-compassion ,” cultivating deeper social connections in and out of the workplace, etc. Ultimately, each of us will have to choose our own path, and for some that should include professional help, e.g., from a mental health care provider.
But as a colleague once put it, a focus on changing ourselves is akin to just learning to take a punch better. A worthwhile endeavor, but it’s also necessary to try to decrease the number of punches thrown our way.
Making a difference locally: Medical staff
I’m part of the Provider Support Committee at my hospital, and I have concluded that nearly every hospital should have a group like this. Our own committee was modeled after the support committee at a hospital five miles away, and both groups see value in collaborating in our efforts. In fact, a person from each hospital’s committee serves on the committee at the other hospital.
These committees have popped up in other institutions, and many have been at it longer than at my hospital. But they all seem to share a mission of developing and implementing programs to position caregivers to thrive in their work, increase resilience, and reduce their risk of burnout. Some interventions are focused on making changes to an EHR, work schedules, work flows, or even staffing levels (i.e., reducing the “number of punches”). Other efforts are directed toward establishing groups that support personal reflection and/or social connections among providers.
A review of activities undertaken by seven different organizations is available at the AMA STEPS forward Preventing Physician Burnout website (click on “STEPS in practice.”)
Dr. Nelson has had a career in clinical practice as a hospitalist starting in 1988. He is cofounder and past president of SHM, and principal in Nelson Flores Hospital Medicine Consultants. He is codirector for SHM’s practice management courses. Contact him at [email protected]
I wrote about physician burnout and well-being in the July 2017 version of this column, and am still thinking a great deal about those issues. In the past 6 months, I can’t identify anything that strikes me as a real breakthrough in addressing these issues. However, the ever-increasing attention and resources directed at physician burnout and wellness, on both a local and national level, strike me as reason for cautious optimism.
A chief wellness officer
In summer 2017, Stanford University created a new physician executive role called chief wellness officer (CWO). As far as I am aware, this is the first such position connected with a hospital or medical school. It will be interesting to see if other organizations create similar positions, although I suspect that in places where it is explicitly recognized as a priority, responsibility for this work will be one of the many duties of a chief medical officer or other such executive, and not a position devoted solely to wellness. Interestingly, an Internet search revealed that some non–health care businesses have executive positions with that title, though the role seems focused more on physical health – as in exercise and smoking cessation – than emotional well-being and burnout.
According to a statement on the Stanford Medicine website, the new CWO will work with colleagues to continue “building on its innovative WellMD Center , which was established in 2016. The center has engaged more than 200 physicians through programs focusing on peer support, stress reduction, and ways to cultivate compassion and resilience, as well as a literature and a dinner series in which physicians explore the challenges and rewards of being a doctor. The center also aims to relieve some of the burden on physicians by improving efficiency and simplifying workplace systems, such as electronic medical records.”
A national conference
Over the last 2 or 3 years many, if not most, physician conferences, including the SHM annual conference, have added some content around physician burnout and well-being. But for the first time I’m aware of, an entire conference, the American Conference on Physician Health, addressed these topics in San Francisco in October 2017, and attracted 425 attendees along with an all-star faculty. I couldn’t attend myself, but found a reporter’s summary informative and I recommend it.
While the summary didn’t suggest the conference provided a cure or simple path to improvement, I’m encouraged that the topic has attracted the attention of some pretty smart people. If there is a second edition of this conference, I’ll try hard to attend.
Worthwhile web resources
The home page of Stanford’s WellMD Center provides a continuously updated list of recent research publications on physician health and links to many other resources, and is worth bookmarking.
Another great educational resource for physician wellness is the AMA’s STEPS Forward, a site devoted to practice improvement that provides guidance on patient care, work flow and process, leading change, technology and finance, as well as professional well-being. Of the five separate education modules in the latter category, I found the one on “Preventing Physician Burnout” especially informative. The site is free, doesn’t require an AMA membership, and can provide CME credit.
Making a difference locally: Individuals
Surveys, research, and the experience of experts available via the above resources and others are very valuable, but may be hard to translate into action for you and your fellow local caregivers. My sense is that many hospitalists address their own work-related distress by simply working less in total – reducing their full-time equivalents. That may be the most tangible and accessible intervention, and undeniably the right thing to do in some cases. But it isn’t an ideal approach for our field, which faces chronic staffing shortages. And it doesn’t do anything to change the average level of distress of a day of work. I worry that many people will find disappointment if working fewer shifts is their only burnout mitigation strategy.
Ensuring that you have some work-related interest outside of direct patient care, such as being the local electronic health record expert, or even the person leading formation of a support committee, can be really valuable. I first addressed this topic in the June 2011 issue of The Hospitalist, and there is a long list of things to consider: mindfulness, practicing “ self-compassion ,” cultivating deeper social connections in and out of the workplace, etc. Ultimately, each of us will have to choose our own path, and for some that should include professional help, e.g., from a mental health care provider.
But as a colleague once put it, a focus on changing ourselves is akin to just learning to take a punch better. A worthwhile endeavor, but it’s also necessary to try to decrease the number of punches thrown our way.
Making a difference locally: Medical staff
I’m part of the Provider Support Committee at my hospital, and I have concluded that nearly every hospital should have a group like this. Our own committee was modeled after the support committee at a hospital five miles away, and both groups see value in collaborating in our efforts. In fact, a person from each hospital’s committee serves on the committee at the other hospital.
These committees have popped up in other institutions, and many have been at it longer than at my hospital. But they all seem to share a mission of developing and implementing programs to position caregivers to thrive in their work, increase resilience, and reduce their risk of burnout. Some interventions are focused on making changes to an EHR, work schedules, work flows, or even staffing levels (i.e., reducing the “number of punches”). Other efforts are directed toward establishing groups that support personal reflection and/or social connections among providers.
A review of activities undertaken by seven different organizations is available at the AMA STEPS forward Preventing Physician Burnout website (click on “STEPS in practice.”)
Dr. Nelson has had a career in clinical practice as a hospitalist starting in 1988. He is cofounder and past president of SHM, and principal in Nelson Flores Hospital Medicine Consultants. He is codirector for SHM’s practice management courses. Contact him at [email protected]
Patient-centered risk assessment for ovarian cancer: Individualizing your approach

Neal M. Lonky, MD, MPH
Clinical Professor
Department of Obstetrics
and Gynecology
University of California, Irvine
Physician Lead, Strategic EMR
Documentation and Analysis
Department of Obstetrics
and Gynecology
Member, Board of Directors
Southern California Permanente
Medical Group
Kaiser Permanente
OBG Management Contributing Editor

Jeanine M. Genkinger, PhD, MHS
Associate Professor
Department of Epidemiology
Columbia University Mailman School of Public Health
New York, New York

Leslie M. Randall, MD
Associate Professor
Division of Gynecologic Oncology
University of California, Irvine,
School of Medicine

Devansu Tewari, MD
Division Director, Gynecologic Oncology
Department of Obstetrics and Gynecology
Kaiser Permanente Orange County
Women’s Health Services
Associate Clinical Professor
University of California, Irvine,
School of Medicine

Jason D. Wright, MD
Sol Goldman Associate Professor and Chief, Division of Gynecologic Oncology
Department of Obstetrics and Gynecology
Columbia University College of Physicians and Surgeons
New York, New York
Dr. Lonky reports that he has received grant or research support from Merck & Co.
Dr. Genkinger reports no financial relationships relevant to this article.
Dr. Wright reports that he has served as a consultant to Clovis Oncology and Tesaro Inc.
Dr. Randall and Dr. Tewari report no financial relationships relevant to this article.
Neal M. Lonky, MD, MPH
Clinical Professor
Department of Obstetrics
and Gynecology
University of California, Irvine
Physician Lead, Strategic EMR
Documentation and Analysis
Department of Obstetrics
and Gynecology
Member, Board of Directors
Southern California Permanente
Medical Group
Kaiser Permanente
OBG Management Contributing Editor
Jeanine M. Genkinger, PhD, MHS
Associate Professor
Department of Epidemiology
Columbia University Mailman School of Public Health
New York, New York
Leslie M. Randall, MD
Associate Professor
Division of Gynecologic Oncology
University of California, Irvine,
School of Medicine
Devansu Tewari, MD
Division Director, Gynecologic Oncology
Department of Obstetrics and Gynecology
Kaiser Permanente Orange County
Women’s Health Services
Associate Clinical Professor
University of California, Irvine,
School of Medicine
Jason D. Wright, MD
Sol Goldman Associate Professor and Chief, Division of Gynecologic Oncology
Department of Obstetrics and Gynecology
Columbia University College of Physicians and Surgeons
New York, New York
Dr. Lonky reports that he has received grant or research support from Merck & Co.
Dr. Genkinger reports no financial relationships relevant to this article.
Dr. Wright reports that he has served as a consultant to Clovis Oncology and Tesaro Inc.
Dr. Randall and Dr. Tewari report no financial relationships relevant to this article.
Retinal Changes May Reflect Brain Changes in Preclinical Alzheimer’s Disease
BOSTON—Changes in the retina seem to mirror changes that begin to reshape the brain in preclinical Alzheimer’s disease.
Manifested as a reduction in volume in the retinal nerve fiber layer, these changes appear to track the aggregation of beta-amyloid brain plaques well before cognitive problems arise. The changes can be measured with equipment present already in many optometry offices, Peter J. Snyder, PhD, said at the Clinical Trials in Alzheimer’s Disease conference.

The findings suggest that retinal scans might eventually be an easy, noninvasive, and inexpensive way to identify people who may be at elevated risk for Alzheimer’s disease, Dr. Snyder said.
“If we are lucky enough to live past age 45, then it is a given that we are all going to develop some presbyopia,” he said. “So, we all have to go to the optometrist sometime, and that may become a point of entry for broad screening and to track changes over time, to keep an eye on at-risk patients, and to refer those with retinal changes that fit the preclinical Alzheimer’s disease profile to specialty care for more comprehensive diagnostic evaluations.”
A Potential Window to the Brain
The retina begins to form in the third week of embryologic life, arising from the neural tube cells that also form the brain and spinal cord. It makes sense, then, that early neuronal changes in Alzheimer’s disease could occur in the retina as well, said Dr. Snyder, Professor of Neurology and Surgery (Ophthalmology) at Rhode Island Hospital and Brown University in Providence.
“The retina is really a protrusion of the brain, and it is part and parcel of the CNS,” Dr. Snyder said. “In terms of the neuronal structure, the retina develops in layers with specific cell types that are neurochemically and physiologically the same as the nervous tissue in the brain. That is why it is, potentially, literally a window that could let us see what is happening in the brain in early Alzheimer’s disease.”
Prior studies have examined the retina as a predictive marker for Alzheimer’s disease. At the 2016 Alzheimer’s Association International Conference, Fang Sarah Ko, MD, an ophthalmologist in Tallahassee, Florida, presented three-year data associating retinal nerve fiber layer thinning to cognitive decline in the UK Biobank, an ongoing prospective health outcomes study.
Other researchers have explored amyloid in the lens and retina as a possible early Alzheimer’s identification tool. But Dr. Snyder’s study is the first to demonstrate a longitudinal association between neuronal changes in the eye and amyloid burden in the brain among clinically normal subjects.
Patients Had Subjective Memory Complaints
For 27 months, he followed 56 people who had normal cognition but were beginning to experience subjective memory complaints. All subjects had at least one parent with Alzheimer’s disease. Everyone underwent an amyloid PET scan at baseline. Of the cohort, 15 had PET imaging evidence of abnormal beta-amyloid protein aggregation in the neocortex. This group was deemed to have preclinical Alzheimer’s disease, while the remainder served as a control group.
Dr. Snyder imaged each subject’s retinas at baseline and at 27 months, when everyone underwent a second amyloid PET scan. He examined the retina with spectral domain optical coherence tomography, a relatively new method of imaging the retina that typically is used to detect retinal and ocular changes associated with diabetes, macular degeneration, glaucoma, and multiple sclerosis.
Dr. Snyder examined the optic nerve head and macula at both time points and assessed volumetric changes in the peripapillary retinal nerve fiber layer, the macular retinal nerve fiber layer, the ganglion cell layer, the inner plexiform layer, the outer nuclear layer, the outer plexiform layer, and the inner nuclear layer. He also computed changes in total retinal volume.
Between-Group Differences
At baseline assessment, Dr. Snyder found a significant difference between the groups. Among the amyloid-positive subjects, the inner plexiform layer was slightly larger in volume. “This seems a bit counterintuitive, but … it suggests that there may be inflammatory processes going on in this early stage and that we are catching that inflammation.” An independent research group has replicated this finding with a larger sample of participants and plans to report its results later this year, Dr. Snyder noted.
At 27 months, the total retinal volume and the macular retinal nerve fiber layer volume were significantly lower in the preclinical Alzheimer’s disease group than in the control group. There was also a volume reduction in the peripapillary retinal nerve fiber layer, although the between-group difference was not statistically significant.
In a multivariate linear regression model that controlled for age and total amyloid burden, the mean volume change in the macular retinal nerve fiber layer accounted for about 10% of the variation in PET binding to brain amyloid by 27 months. Volume reductions in all the other layers appeared to be associated only with age, representing normal age-related changes in the eye.
Using Advances in Imaging
This volume loss in the retinal nerve fiber layer probably represents early demyelination or degeneration of axons, Dr. Snyder said. “This finding in the retina appears analogous, and possibly directly related, to a similar loss of white matter that is readily observable in the early stages of Alzheimer’s disease,” he said. “At the same time, patients are beginning to experience cholinergic changes in the basal forebrain and the abnormal aggregation of fibrillar beta-amyloid plaques. I do not know to what extent these changes are mechanistically dependent on each other, but they appear to also be happening, in the earliest stages of the disease course, in the retina.”
More research is needed before retinal scanning can be employed as a risk-assessment tool, however. “Every time we have a major advance in imaging, the technical engineering breakthroughs precede our detailed understanding of what we are looking at and what to measure,” Dr. Snyder said. “This is where we are right now with retinal imaging. Biologically, it makes sense to be looking at this as a marker of risk in those who are clinically healthy, and maybe later as a marker of disease progression. But there is a lot of work to be done here yet.”
Dr. Snyder’s project was supported by a research award from Pfizer and a grant from Avid Radiopharmaceuticals.
—Michele G. Sullivan
BOSTON—Changes in the retina seem to mirror changes that begin to reshape the brain in preclinical Alzheimer’s disease.
Manifested as a reduction in volume in the retinal nerve fiber layer, these changes appear to track the aggregation of beta-amyloid brain plaques well before cognitive problems arise. The changes can be measured with equipment present already in many optometry offices, Peter J. Snyder, PhD, said at the Clinical Trials in Alzheimer’s Disease conference.
The findings suggest that retinal scans might eventually be an easy, noninvasive, and inexpensive way to identify people who may be at elevated risk for Alzheimer’s disease, Dr. Snyder said.
“If we are lucky enough to live past age 45, then it is a given that we are all going to develop some presbyopia,” he said. “So, we all have to go to the optometrist sometime, and that may become a point of entry for broad screening and to track changes over time, to keep an eye on at-risk patients, and to refer those with retinal changes that fit the preclinical Alzheimer’s disease profile to specialty care for more comprehensive diagnostic evaluations.”
A Potential Window to the Brain
The retina begins to form in the third week of embryologic life, arising from the neural tube cells that also form the brain and spinal cord. It makes sense, then, that early neuronal changes in Alzheimer’s disease could occur in the retina as well, said Dr. Snyder, Professor of Neurology and Surgery (Ophthalmology) at Rhode Island Hospital and Brown University in Providence.
“The retina is really a protrusion of the brain, and it is part and parcel of the CNS,” Dr. Snyder said. “In terms of the neuronal structure, the retina develops in layers with specific cell types that are neurochemically and physiologically the same as the nervous tissue in the brain. That is why it is, potentially, literally a window that could let us see what is happening in the brain in early Alzheimer’s disease.”
Prior studies have examined the retina as a predictive marker for Alzheimer’s disease. At the 2016 Alzheimer’s Association International Conference, Fang Sarah Ko, MD, an ophthalmologist in Tallahassee, Florida, presented three-year data associating retinal nerve fiber layer thinning to cognitive decline in the UK Biobank, an ongoing prospective health outcomes study.
Other researchers have explored amyloid in the lens and retina as a possible early Alzheimer’s identification tool. But Dr. Snyder’s study is the first to demonstrate a longitudinal association between neuronal changes in the eye and amyloid burden in the brain among clinically normal subjects.
Patients Had Subjective Memory Complaints
For 27 months, he followed 56 people who had normal cognition but were beginning to experience subjective memory complaints. All subjects had at least one parent with Alzheimer’s disease. Everyone underwent an amyloid PET scan at baseline. Of the cohort, 15 had PET imaging evidence of abnormal beta-amyloid protein aggregation in the neocortex. This group was deemed to have preclinical Alzheimer’s disease, while the remainder served as a control group.
Dr. Snyder imaged each subject’s retinas at baseline and at 27 months, when everyone underwent a second amyloid PET scan. He examined the retina with spectral domain optical coherence tomography, a relatively new method of imaging the retina that typically is used to detect retinal and ocular changes associated with diabetes, macular degeneration, glaucoma, and multiple sclerosis.
Dr. Snyder examined the optic nerve head and macula at both time points and assessed volumetric changes in the peripapillary retinal nerve fiber layer, the macular retinal nerve fiber layer, the ganglion cell layer, the inner plexiform layer, the outer nuclear layer, the outer plexiform layer, and the inner nuclear layer. He also computed changes in total retinal volume.
Between-Group Differences
At baseline assessment, Dr. Snyder found a significant difference between the groups. Among the amyloid-positive subjects, the inner plexiform layer was slightly larger in volume. “This seems a bit counterintuitive, but … it suggests that there may be inflammatory processes going on in this early stage and that we are catching that inflammation.” An independent research group has replicated this finding with a larger sample of participants and plans to report its results later this year, Dr. Snyder noted.
At 27 months, the total retinal volume and the macular retinal nerve fiber layer volume were significantly lower in the preclinical Alzheimer’s disease group than in the control group. There was also a volume reduction in the peripapillary retinal nerve fiber layer, although the between-group difference was not statistically significant.
In a multivariate linear regression model that controlled for age and total amyloid burden, the mean volume change in the macular retinal nerve fiber layer accounted for about 10% of the variation in PET binding to brain amyloid by 27 months. Volume reductions in all the other layers appeared to be associated only with age, representing normal age-related changes in the eye.
Using Advances in Imaging
This volume loss in the retinal nerve fiber layer probably represents early demyelination or degeneration of axons, Dr. Snyder said. “This finding in the retina appears analogous, and possibly directly related, to a similar loss of white matter that is readily observable in the early stages of Alzheimer’s disease,” he said. “At the same time, patients are beginning to experience cholinergic changes in the basal forebrain and the abnormal aggregation of fibrillar beta-amyloid plaques. I do not know to what extent these changes are mechanistically dependent on each other, but they appear to also be happening, in the earliest stages of the disease course, in the retina.”
More research is needed before retinal scanning can be employed as a risk-assessment tool, however. “Every time we have a major advance in imaging, the technical engineering breakthroughs precede our detailed understanding of what we are looking at and what to measure,” Dr. Snyder said. “This is where we are right now with retinal imaging. Biologically, it makes sense to be looking at this as a marker of risk in those who are clinically healthy, and maybe later as a marker of disease progression. But there is a lot of work to be done here yet.”
Dr. Snyder’s project was supported by a research award from Pfizer and a grant from Avid Radiopharmaceuticals.
—Michele G. Sullivan
Don’t give up on influenza vaccine
I suspect most health care providers have heard the complaint, “The vaccine doesn’t work. One year I got the vaccine, and I still came down with the flu.”
Over the years, I’ve polished my responses to vaccine naysayers.
Influenza vaccine doesn’t protect you against every virus that can cause cold and flu symptoms. It only prevents influenza. It’s possible you had a different virus, such as adenovirus, coronavirus, parainfluenza virus, or respiratory syncytial virus.

Some years, the vaccine works better than others because there is a mismatch between the viruses chosen for the vaccine, and the viruses that end up circulating. Even when it doesn’t prevent flu, the vaccine can potentially reduce the severity of illness.
The discussion became a little more complicated in 2016 when the Centers for Disease Control and Prevention Advisory Committee on Immunization Practices withdrew its support for the live attenuated influenza virus vaccine (LAIV4) because of concerns about effectiveness. During the 2015-2016 influenza season, LAIV4 demonstrated no statistically significant effectiveness in children 2-17 years of age against H1N1pdm09, the predominant influenza strain. Fortunately, inactivated injectable vaccine did offer protection. An estimated 41.8 million children aged 6 months to 17 years ultimately received this vaccine during the 2016-2017 influenza season.
Now with the 2017-2018 influenza season in full swing, some media reports are proclaiming the influenza vaccine is only 10% effective this year. This claim is based on an interim analysis of data from the most recent flu season in Australia and the effectiveness of the vaccine against the circulating H3N2 virus strain. News from the U.S. CDC is more encouraging. The H3N2 virus contained in this year’s vaccine is the same as that used last year, and so far, circulating H3N2 viruses in the United States are similar to the vaccine virus. Public health officials suggest that we can hope that the vaccine works as well as it did last year, when overall vaccine effectiveness against all circulating flu viruses was 39%, and effectiveness against the H3N2 virus specifically was 32%.

I’m upping my game when talking to parents about flu vaccine. I mention one study conducted between 2010 and 2012 in which influenza immunization reduced a child’s risk of being admitted to an intensive care unit with flu by 74% (J Infect Dis. 2014 Sep 1;210[5]:674-83). I emphasize that flu vaccine reduces the chance that a child will die from flu. According to a study published in 2017, influenza vaccine reduced the risk of death from flu by 65% in healthy children and 51% in children with high-risk medical conditions (Pediatrics. 2017 May. doi: 10.1542/peds.2016-4244).
When I’m talking to trainees, I no longer just focus on the match between circulating strains of flu and vaccine strains. I mention that viruses used to produce most seasonal flu vaccines are grown in eggs, a process that can result in minor antigenic changes in the hemagglutinin protein, especially in H3N2 viruses. These “egg-adapted changes” may result in a vaccine that stimulates a less effective immune response, even with a good match between circulating strains and vaccine strains. For example, Zost et al. found that the H3N2 virus that emerged during the 2014-2015 season possessed a new hemagglutinin-associated glycosylation site (Proc Natl Acad Sci U S A. 2017 Nov 21;114[47]:12578-83). Although this virus was represented in the 2016-2017 influenza vaccine, the egg-adapted version lost the glycosylation site, resulting in decreased vaccine immunogenicity and less protection against H3N2 viruses circulating in the community.
The real take-home message here is that we need better flu vaccines. In the short term, cell-based flu vaccines that use virus grown in animal cells are a potential alternative to egg-based vaccines. In the long term, we need a universal flu vaccine. The National Institute of Allergy and Infectious Diseases is prioritizing work on a vaccine that could provide long-lasting protection against multiple subtypes of the virus. According to a report on the National Institutes of Health website, such a vaccine could “eliminate the need to update and administer the seasonal flu vaccine each year and could provide protection against newly emerging flu strains,” including those with the potential to cause a pandemic. The NIH researchers acknowledge, however, that achieving this goal will require “a broad range of expertise and substantial resources.”
Until new vaccines are available, we need to do a better job of using available, albeit imperfect, flu vaccines. During the 2016-2017 season, only 59% of children 6 months to 17 years were immunized, and there were 110 influenza-associated deaths in children, according to the CDC. It’s likely that some of these were preventable.
The total magnitude of suffering associated with flu is more difficult to quantify, but anecdotes can be illuminating. A friend recently diagnosed with influenza shared her experience via Facebook. “Rough night. I’m seconds away from a meltdown. My body aches so bad that I can’t get comfortable on the couch or my bed. Can’t breathe, and I cough until I vomit. My head is about to burst along with my ears. Just took a hot bath hoping that would help. I don’t know what else to do. The flu really sucks.”
Indeed. Even a 1 in 10 chance of preventing the flu is better than no chance at all.
Dr. Bryant is a pediatrician specializing in infectious diseases at the University of Louisville (Ky.) and Norton Children’s Hospital in Louisville. She said she had no relevant financial disclosures. Email her at [email protected].
I suspect most health care providers have heard the complaint, “The vaccine doesn’t work. One year I got the vaccine, and I still came down with the flu.”
Over the years, I’ve polished my responses to vaccine naysayers.
Influenza vaccine doesn’t protect you against every virus that can cause cold and flu symptoms. It only prevents influenza. It’s possible you had a different virus, such as adenovirus, coronavirus, parainfluenza virus, or respiratory syncytial virus.
Some years, the vaccine works better than others because there is a mismatch between the viruses chosen for the vaccine, and the viruses that end up circulating. Even when it doesn’t prevent flu, the vaccine can potentially reduce the severity of illness.
The discussion became a little more complicated in 2016 when the Centers for Disease Control and Prevention Advisory Committee on Immunization Practices withdrew its support for the live attenuated influenza virus vaccine (LAIV4) because of concerns about effectiveness. During the 2015-2016 influenza season, LAIV4 demonstrated no statistically significant effectiveness in children 2-17 years of age against H1N1pdm09, the predominant influenza strain. Fortunately, inactivated injectable vaccine did offer protection. An estimated 41.8 million children aged 6 months to 17 years ultimately received this vaccine during the 2016-2017 influenza season.
Now with the 2017-2018 influenza season in full swing, some media reports are proclaiming the influenza vaccine is only 10% effective this year. This claim is based on an interim analysis of data from the most recent flu season in Australia and the effectiveness of the vaccine against the circulating H3N2 virus strain. News from the U.S. CDC is more encouraging. The H3N2 virus contained in this year’s vaccine is the same as that used last year, and so far, circulating H3N2 viruses in the United States are similar to the vaccine virus. Public health officials suggest that we can hope that the vaccine works as well as it did last year, when overall vaccine effectiveness against all circulating flu viruses was 39%, and effectiveness against the H3N2 virus specifically was 32%.
I’m upping my game when talking to parents about flu vaccine. I mention one study conducted between 2010 and 2012 in which influenza immunization reduced a child’s risk of being admitted to an intensive care unit with flu by 74% (J Infect Dis. 2014 Sep 1;210[5]:674-83). I emphasize that flu vaccine reduces the chance that a child will die from flu. According to a study published in 2017, influenza vaccine reduced the risk of death from flu by 65% in healthy children and 51% in children with high-risk medical conditions (Pediatrics. 2017 May. doi: 10.1542/peds.2016-4244).
When I’m talking to trainees, I no longer just focus on the match between circulating strains of flu and vaccine strains. I mention that viruses used to produce most seasonal flu vaccines are grown in eggs, a process that can result in minor antigenic changes in the hemagglutinin protein, especially in H3N2 viruses. These “egg-adapted changes” may result in a vaccine that stimulates a less effective immune response, even with a good match between circulating strains and vaccine strains. For example, Zost et al. found that the H3N2 virus that emerged during the 2014-2015 season possessed a new hemagglutinin-associated glycosylation site (Proc Natl Acad Sci U S A. 2017 Nov 21;114[47]:12578-83). Although this virus was represented in the 2016-2017 influenza vaccine, the egg-adapted version lost the glycosylation site, resulting in decreased vaccine immunogenicity and less protection against H3N2 viruses circulating in the community.
The real take-home message here is that we need better flu vaccines. In the short term, cell-based flu vaccines that use virus grown in animal cells are a potential alternative to egg-based vaccines. In the long term, we need a universal flu vaccine. The National Institute of Allergy and Infectious Diseases is prioritizing work on a vaccine that could provide long-lasting protection against multiple subtypes of the virus. According to a report on the National Institutes of Health website, such a vaccine could “eliminate the need to update and administer the seasonal flu vaccine each year and could provide protection against newly emerging flu strains,” including those with the potential to cause a pandemic. The NIH researchers acknowledge, however, that achieving this goal will require “a broad range of expertise and substantial resources.”
Until new vaccines are available, we need to do a better job of using available, albeit imperfect, flu vaccines. During the 2016-2017 season, only 59% of children 6 months to 17 years were immunized, and there were 110 influenza-associated deaths in children, according to the CDC. It’s likely that some of these were preventable.
The total magnitude of suffering associated with flu is more difficult to quantify, but anecdotes can be illuminating. A friend recently diagnosed with influenza shared her experience via Facebook. “Rough night. I’m seconds away from a meltdown. My body aches so bad that I can’t get comfortable on the couch or my bed. Can’t breathe, and I cough until I vomit. My head is about to burst along with my ears. Just took a hot bath hoping that would help. I don’t know what else to do. The flu really sucks.”
Indeed. Even a 1 in 10 chance of preventing the flu is better than no chance at all.
Dr. Bryant is a pediatrician specializing in infectious diseases at the University of Louisville (Ky.) and Norton Children’s Hospital in Louisville. She said she had no relevant financial disclosures. Email her at [email protected].
2018 Update on obstetrics
The past year brought new information and guidance from the American College of Obstetricians and Gynecologists (ACOG) on many relevant obstetric topics, making it difficult to choose just a few for this Update. Opioid use in pregnancy was an obvious choice given the national media attention and the potential opportunity for intervention in pregnancy for both the mother and the fetus/newborn. Postpartum hemorrhage, an “oldie but goodie,” was chosen for several reasons: It got a new definition, a new focus on multidisciplinary care, and an exciting novel tool for the treatment toolbox. Finally, given the rapidly changing technology, new screening recommendations, and the complexity of counseling, carrier screening was chosen as a genetic hot topic for this year.
Opioids, obstetrics, and opportunities
Reddy UM, Davis JM, Ren Z, Greene MF; Opioid Use in Pregnancy, Neonatal Abstinence Syndrome, and Childhood Outcomes Workshop Invited Speakers. Opioid use in pregnancy, neonatal abstinence syndrome, and childhood outcomes: Executive summary of a joint workshop. Obstet Gynecol. 2017;130(1):10-28.
ACOG Committee on Obstetric Practice. ACOG committee opinion No. 711: Opioid use and opioid use disorder in pregnancy. Obstet Gynecol. 2017;130(2):e81-e94.
The term "opioid epidemic" is omnipresent in both the lay media and the medical literature. In the past decade, the United States has had a huge increase in the number of opioid prescriptions, the rate of admissions and deaths due to prescription opioid misuse and abuse, and an increased rate of heroin use attributed to prior prescription opioid use.
Obstetrics is unique in that opioid use and abuse disorders affect 2 patients simultaneously (the mother and fetus), and the treatment options are somewhat at odds in that they need to balance a stable maternal status and intrauterine environment with the risk of neonatal abstinence syndrome (NAS). Additionally, pregnancy is an opportunity for a woman with opioid use disorder to have access to medical care (possibly for the first time) leading to the diagnosis and treatment of her disease. As the clinicians on the front line, obstetricians therefore require education and guidance on best practice for management of opioid use in pregnancy.
In 2017, Reddy and colleagues, as part of a joint workshop on opioid use in pregnancy, and a committee opinion from ACOG provided the following recommendations.
Screening
Universally screen for substance use, starting at the first prenatal visit; this is recommended over risk factor-based screening.
Use a validated screening tool. A tool such as a questionnaire is recommended as the first-line screening test (for example, the 4Ps screen, the National Institute on Drug Abuse Quick Screen, and the CRAFFT Screening Interview).
Do not universally screen urine and hair for drugs. This type of screening has many limitations, such as the limited number of substances tested, false-positive results, and inaccurate determination of the frequency or timing of drug use. Information regarding the consequences of the test must be provided, and patient consent must be obtained prior to performing the test.
Treatment
Use medication-assisted treatment with buprenorphine or methadone, which is preferred to medically supervised withdrawal. Medication-assisted treatment prevents withdrawal symptoms and cravings, decreases the risk of relapse, improves compliance with prenatal care and addiction treatment programs, and leads to better obstetric outcomes (higher birth weight, lower rate of preterm birth, lower perinatal mortality).
Know that buprenorphine has several advantages over methadone, including the convenience of an outpatient prescription, a lower risk of overdose, and improved neonatal outcomes (higher birth weight, lower doses of morphine to treat NAS, shorter treatment duration).
Prioritize methadone as the preferred option for pregnant women who are already receiving methadone treatment (changing to buprenorphine may precipitate withdrawal), those with a long-standing history of or multi-substance abuse, and those who have failed other treatment programs.
Prenatal care
Screen for comorbid conditions such as sexually transmitted infections, other medications or substance use, social conditions, and mental health disorders.
Perform ultrasonography serially to monitor fetal growth because of the increased risk of fetal growth restriction.
Consult with anesthesiology for pain control recommendations for labor and delivery and with neonatalogy/pediatrics for NAS counseling.
Intrapartum/postpartum care
Recognize heightened pain. Women with opioid use disorder have increased sensitivity to painful stimuli.
Continue the maintenance dose of methadone or buprenorphine throughout hospitalization, with short-acting opioids added for a brief period for postoperative pain.
Prioritize regional anesthesia for pain control in labor or for cesarean delivery.
Consider alternative therapies such as regional blocks, nonopioid medications (nonsteroidal anti-inflammatory drugs, acetaminophen), or relaxation/mindfulness training.
Avoid mixed antagonist and agonist narcotics (butorphanol, nalbuphine, pentazocine) as they may cause acute withdrawal.
Encourage breastfeeding to decrease the severity of NAS and maternal stress and increase maternal-child bonding and maternal confidence.
Offer contraceptive counseling and services immediately postpartum in the hospital, with strong consideration for long-acting reversible contraception.
Opioid prescribing practices
Opioids are prescribed in excess post–cesarean delivery. Several recent studies have demonstrated that most women are prescribed opioids post–cesarean delivery in excess of the amount they use (median 30–40 tablets prescribed, median 20 tablets used).1,2 The leftover opioid medication usually is not discarded and therefore is at risk for diversion or misuse. A small subset of patients will use all the opioids prescribed and feel as though they have not received enough medication.
Prescribe post–cesarean delivery opioids more appropriately by considering individual inpatient opioid requirements or a shared decision-making model.3
Prioritize acetaminophen and ibuprofen during breastfeeding. In a recent editorial in OBG Management, Robert L. Barbieri, MD, recommended that whenever possible, acetaminophen and ibuprofen should be the first-line treatment for breastfeeding women, and narcotics that are metabolized by CYP2D6 should be avoided to reduce the risk to the newborn.4
Universal screening for substance use should be performed in all pregnant women, and clinicians should offer medication-assisted treatment in conjunction with prenatal care and other supportive services as the standard therapy for opioid use disorder. More selective, patient-specific opioid prescribing practices should be applied in the obstetric population.
Read about new strategies for postpartum hemorrhage.
Postpartum hemorrhage: New definitions and new strategies for stemming the flow
ACOG Committee on Practice Bulletins—Obstetrics. ACOG practice bulletin No. 183: Postpartum hemorrhage. Obstet Gynecol. 2017;130(4):e168-e186.
From the very first sentence of the new ACOG practice bulletin, postpartum hemorrhage (PPH) is redefined as "cumulative blood loss greater than or equal to 1,000 mL or blood loss accompanied by signs or symptoms of hypovolemia within 24 hours after the birth process (includes intrapartum loss) regardless of route of delivery." Although this does not seem to be a huge change from the traditional teaching of a 500-mL blood loss at vaginal delivery and a 1,000-mL loss at cesarean delivery, it reflects a shift in focus from simply responding to a certain amount of bleeding to using a multidisciplinary action plan for treating this leading cause of maternal mortality worldwide.
Focus on developing a PPH action plan
As part of the shift toward a multidisciplinary action plan for PPH, all obstetric team members should be aware of the following:
- For most postpartum women, by the time they begin to show signs of hemodynamic compromise, the amount of blood loss approaches 25% of their total blood volume (1,500 mL). Lactic acidosis, systemic inflammation, and a consumptive coagulopathy result.
- Risk stratification prior to delivery, recognition and identification of the source of bleeding, and aggressive early resuscitation to prevent hypovolemia are paramount. Experience gleaned from trauma massive transfusion protocols suggests that judicious transfusion of packed red blood cells, fresh frozen plasma, and platelets in a 1:1:1 ratio is appropriate for obstetric patients. Additionally, patients with low fibrinogen levels should be treated with cryoprecipitate.
- The use of fixed transfusion ratios and standardized protocols for recognition and management of PPH has been demonstrated to increase earlier intervention and resolution of hemorrhage at an earlier stage, although the maternal outcomes results have been mixed.
- Multidisciplinary team drills and simulation exercises also should be considered to help solidify training of an institution's teams responsible for PPH response.
Novel management option: Tranexamic acid
In addition to these strategies, there is a new recommendation for managing refractory PPH: tranexamic acid, which works by binding to lysine receptors on plasminogen and plasmin, inhibiting plasmin-mediated fibrin degradation.5 Previously, tranexamic acid was known to be effective in trauma, heart surgery, and in patients with thrombophilias. Pacheco and colleagues recently demonstrated reduced mortality from obstetric bleeding if tranexamic acid was given within 3 hours of delivery, without increased thrombotic complications.5 ACOG recommends its use if initial medical therapy fails, while the World Health Organization strongly recommends that tranexamic acid be part of a standard PPH package for all cases of PPH (TABLE).6
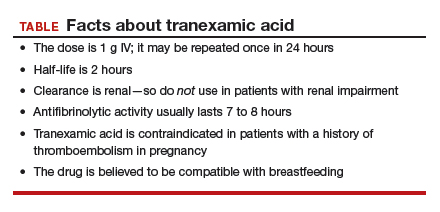
Postpartum hemorrhage requires early, aggressive, and multidisciplinary coordination to ensure that 1) patients at risk for hemorrhage are identified for preventive measures; 2) existing hemorrhage is recognized and quickly treated, first with noninvasive methods and then with more definitive surgical treatments; and 3) blood product replacement follows an evidence-based standardized protocol. Tranexamic acid is recommended as an adjunct treatment for PPH (of any cause) and should be used within 3 hours of delivery.
Read about new ACOG guidance on prepregnancy and prenatal screening.
Carrier screening—choose something
ACOG Committee on Genetics. Committee opinion No. 690: Carrier screening in the age of genomic medicine. Obstet Gynecol. 2017;129(3):e35-e40.
ACOG Committee on Genetics. Committee opinion No. 691: Carrier screening for genetic conditions. Obstet Gynecol. 2017;129(3):e41-e55.
Ideally, carrier screening should be offered prior to pregnancy to fully inform couples of their reproductive risks and options for pregnancy. If not performed in the preconception period, carrier screening should be offered to all pregnant women. If a patient chooses screening and screens positive for a particular disorder, her reproductive partner should then be offered screening so that the risk of having an affected child can be determined.
New ACOG guidance on prepregnancy and prenatal screening
Carrier screening recommendations have evolved as the technology available has expanded. All 3 of the following strategies now are considered "acceptable" according to 2 recently published ACOG committee opinions.
Traditional ethnic-specific carrier screening, previously ACOG's sole recommendation, involves offering specific genetic screening to patients from populations with a high prevalence for certain conditions. One such example is Tay-Sachs disease screening in Ashkenazi Jewish patients.
Panethnic screening, which takes into account mixed or uncertain backgrounds, involves screening for a certain panel of disorders and is available to all patients regardless of their background (for example, cystic fibrosis screening offered to all pregnant patients).
Expanded carrier screening is when a large number of disorders can be screened for simultaneously for a lower cost than previous testing strategies. Expanded carrier screening panels vary in number and which conditions are tested by the laboratory. An ideal expanded carrier screening panel has been debated in the literature but not agreed on.7
ObGyns and practices therefore are encouraged to develop a standard counseling and screening protocol to offer to all their patients while being flexible to make available any patient-requested screening that is outside their protocol. Pretest and posttest counseling, including a thorough family history, is essential (as with any genetic testing) and should include residual risk after testing, potential need for specific familial mutation testing instead of general carrier screening, and issues with consanguinity.
Three essential screens
Regardless of the screening strategy chosen from the above options, 3 screening tests should be offered to all pregnant women or couples considering pregnancy (either individually or in the context of an expanded screening panel):
- Cystic fibrosis. At the least, a panel of the 23 most common mutations should be used. More expanded panels, which include hundreds of mutations, increase detection in non-Caucasian populations and for milder forms of the disease or infertility-related mutations.
- Hemoglobinopathies (sickle cell, α- and β-thalassemia). Complete blood count and red blood indices are recommended for all, with hemoglobin electrophoresis recommended for patients of African, Middle Eastern, Mediterranean, or West Indian descent or if mean corpuscular volume is low.
- Spinal muscular atrophy (SMA). The most recent addition to ACOG's recommendations for general carrier screening due to the relatively high carrier frequency (1-in-40 to 1-in-60) and the severity of the disease, SMA causes degeneration of the spinal cord neurons, skeletal muscular atrophy, and overall weakness. Screening is via polymerase chain reaction for SMN1 copy number: 2 copies are normal, and 1 copy indicates a carrier of the SMN1 deletion. About 3% to 4% of patients will screen negative but still will be "carriers" due to having 2 copies of the SMN1 gene on 1 chromosome and no copies on the other chromosome.
All pregnant patients or patients considering pregnancy should be offered carrier screening as standard reproductive care, including screening for cystic fibrosis, hemoglobinopathies, and spinal muscular atrophy. Ethnic, panethnic, or expanded carrier screening (and patient-requested specific screening) all are acceptable options, and a standard screening and counseling protocol should be determined by the ObGyn or practice.
Share your thoughts! Send your Letter to the Editor to [email protected]. Please include your name and the city and state in which you practice.
- Bateman BT, Cole NM, Maeda A, et al. Patterns of opioid prescription and use after cesarean delivery. Obstet Gynecol. 2017;130(1):29–35.
- Osmundson SS, Schornack LA, Grasch JL, Zuckerwise LC, Young JL, Richardson MD. Postdischarge opioid use after cesarean delivery. Obstet Gynecol. 2017;130(1):36–41.
- Prabhu M, McQuaid-Hanson E, Hopp S, et al. A shared decision-making intervention to guide opioid prescribing after cesarean delivery. Obstet Gynecol. 2017;130(1):42–46.
- Barbieri RL. Stop using codeine, oxycodone, hydrocodone, tramadol, and aspirin in women who are breastfeeding. OBG Manag. 2017;29(10):8–12.
- Pacheco LD, Hankins GD, Saad AF, Costantine MM, Chiossi G, Saade GR. Tranexamic acid for the management of obstetric hemorrhage. Obstet Gynecol. 2017;130(4);765–769.
- WHO recommendation on tranexamic acid for the treatment of postpartum haemorrhage. Geneva, Switzerland: World Health Organization; 2017.
- Stevens B, Krstic N, Jones M, Murphy L, Hoskovec J. Finding middle ground in constructing a clinically useful expanded carrier screening panel. Obstet Gynecol. 2017;130(2):279–284.

Dr. Pauli is Associate Professor and Attending Perinatologist, Division of Maternal-Fetal
Medicine, Department of Obstetrics and Gynecology, Penn State Health, Milton S.
Hershey Medical Center, Hershey, Pennsylvania.
The author reports no financial relationships relevant to this article
Dr. Pauli is Associate Professor and Attending Perinatologist, Division of Maternal-Fetal
Medicine, Department of Obstetrics and Gynecology, Penn State Health, Milton S.
Hershey Medical Center, Hershey, Pennsylvania.
The author reports no financial relationships relevant to this article
Dr. Pauli is Associate Professor and Attending Perinatologist, Division of Maternal-Fetal
Medicine, Department of Obstetrics and Gynecology, Penn State Health, Milton S.
Hershey Medical Center, Hershey, Pennsylvania.
The author reports no financial relationships relevant to this article
The past year brought new information and guidance from the American College of Obstetricians and Gynecologists (ACOG) on many relevant obstetric topics, making it difficult to choose just a few for this Update. Opioid use in pregnancy was an obvious choice given the national media attention and the potential opportunity for intervention in pregnancy for both the mother and the fetus/newborn. Postpartum hemorrhage, an “oldie but goodie,” was chosen for several reasons: It got a new definition, a new focus on multidisciplinary care, and an exciting novel tool for the treatment toolbox. Finally, given the rapidly changing technology, new screening recommendations, and the complexity of counseling, carrier screening was chosen as a genetic hot topic for this year.
Opioids, obstetrics, and opportunities
Reddy UM, Davis JM, Ren Z, Greene MF; Opioid Use in Pregnancy, Neonatal Abstinence Syndrome, and Childhood Outcomes Workshop Invited Speakers. Opioid use in pregnancy, neonatal abstinence syndrome, and childhood outcomes: Executive summary of a joint workshop. Obstet Gynecol. 2017;130(1):10-28.
ACOG Committee on Obstetric Practice. ACOG committee opinion No. 711: Opioid use and opioid use disorder in pregnancy. Obstet Gynecol. 2017;130(2):e81-e94.
The term "opioid epidemic" is omnipresent in both the lay media and the medical literature. In the past decade, the United States has had a huge increase in the number of opioid prescriptions, the rate of admissions and deaths due to prescription opioid misuse and abuse, and an increased rate of heroin use attributed to prior prescription opioid use.
Obstetrics is unique in that opioid use and abuse disorders affect 2 patients simultaneously (the mother and fetus), and the treatment options are somewhat at odds in that they need to balance a stable maternal status and intrauterine environment with the risk of neonatal abstinence syndrome (NAS). Additionally, pregnancy is an opportunity for a woman with opioid use disorder to have access to medical care (possibly for the first time) leading to the diagnosis and treatment of her disease. As the clinicians on the front line, obstetricians therefore require education and guidance on best practice for management of opioid use in pregnancy.
In 2017, Reddy and colleagues, as part of a joint workshop on opioid use in pregnancy, and a committee opinion from ACOG provided the following recommendations.
Screening
Universally screen for substance use, starting at the first prenatal visit; this is recommended over risk factor-based screening.
Use a validated screening tool. A tool such as a questionnaire is recommended as the first-line screening test (for example, the 4Ps screen, the National Institute on Drug Abuse Quick Screen, and the CRAFFT Screening Interview).
Do not universally screen urine and hair for drugs. This type of screening has many limitations, such as the limited number of substances tested, false-positive results, and inaccurate determination of the frequency or timing of drug use. Information regarding the consequences of the test must be provided, and patient consent must be obtained prior to performing the test.
Treatment
Use medication-assisted treatment with buprenorphine or methadone, which is preferred to medically supervised withdrawal. Medication-assisted treatment prevents withdrawal symptoms and cravings, decreases the risk of relapse, improves compliance with prenatal care and addiction treatment programs, and leads to better obstetric outcomes (higher birth weight, lower rate of preterm birth, lower perinatal mortality).
Know that buprenorphine has several advantages over methadone, including the convenience of an outpatient prescription, a lower risk of overdose, and improved neonatal outcomes (higher birth weight, lower doses of morphine to treat NAS, shorter treatment duration).
Prioritize methadone as the preferred option for pregnant women who are already receiving methadone treatment (changing to buprenorphine may precipitate withdrawal), those with a long-standing history of or multi-substance abuse, and those who have failed other treatment programs.
Prenatal care
Screen for comorbid conditions such as sexually transmitted infections, other medications or substance use, social conditions, and mental health disorders.
Perform ultrasonography serially to monitor fetal growth because of the increased risk of fetal growth restriction.
Consult with anesthesiology for pain control recommendations for labor and delivery and with neonatalogy/pediatrics for NAS counseling.
Intrapartum/postpartum care
Recognize heightened pain. Women with opioid use disorder have increased sensitivity to painful stimuli.
Continue the maintenance dose of methadone or buprenorphine throughout hospitalization, with short-acting opioids added for a brief period for postoperative pain.
Prioritize regional anesthesia for pain control in labor or for cesarean delivery.
Consider alternative therapies such as regional blocks, nonopioid medications (nonsteroidal anti-inflammatory drugs, acetaminophen), or relaxation/mindfulness training.
Avoid mixed antagonist and agonist narcotics (butorphanol, nalbuphine, pentazocine) as they may cause acute withdrawal.
Encourage breastfeeding to decrease the severity of NAS and maternal stress and increase maternal-child bonding and maternal confidence.
Offer contraceptive counseling and services immediately postpartum in the hospital, with strong consideration for long-acting reversible contraception.
Opioid prescribing practices
Opioids are prescribed in excess post–cesarean delivery. Several recent studies have demonstrated that most women are prescribed opioids post–cesarean delivery in excess of the amount they use (median 30–40 tablets prescribed, median 20 tablets used).1,2 The leftover opioid medication usually is not discarded and therefore is at risk for diversion or misuse. A small subset of patients will use all the opioids prescribed and feel as though they have not received enough medication.
Prescribe post–cesarean delivery opioids more appropriately by considering individual inpatient opioid requirements or a shared decision-making model.3
Prioritize acetaminophen and ibuprofen during breastfeeding. In a recent editorial in OBG Management, Robert L. Barbieri, MD, recommended that whenever possible, acetaminophen and ibuprofen should be the first-line treatment for breastfeeding women, and narcotics that are metabolized by CYP2D6 should be avoided to reduce the risk to the newborn.4
Universal screening for substance use should be performed in all pregnant women, and clinicians should offer medication-assisted treatment in conjunction with prenatal care and other supportive services as the standard therapy for opioid use disorder. More selective, patient-specific opioid prescribing practices should be applied in the obstetric population.
Read about new strategies for postpartum hemorrhage.
Postpartum hemorrhage: New definitions and new strategies for stemming the flow
ACOG Committee on Practice Bulletins—Obstetrics. ACOG practice bulletin No. 183: Postpartum hemorrhage. Obstet Gynecol. 2017;130(4):e168-e186.
From the very first sentence of the new ACOG practice bulletin, postpartum hemorrhage (PPH) is redefined as "cumulative blood loss greater than or equal to 1,000 mL or blood loss accompanied by signs or symptoms of hypovolemia within 24 hours after the birth process (includes intrapartum loss) regardless of route of delivery." Although this does not seem to be a huge change from the traditional teaching of a 500-mL blood loss at vaginal delivery and a 1,000-mL loss at cesarean delivery, it reflects a shift in focus from simply responding to a certain amount of bleeding to using a multidisciplinary action plan for treating this leading cause of maternal mortality worldwide.
Focus on developing a PPH action plan
As part of the shift toward a multidisciplinary action plan for PPH, all obstetric team members should be aware of the following:
- For most postpartum women, by the time they begin to show signs of hemodynamic compromise, the amount of blood loss approaches 25% of their total blood volume (1,500 mL). Lactic acidosis, systemic inflammation, and a consumptive coagulopathy result.
- Risk stratification prior to delivery, recognition and identification of the source of bleeding, and aggressive early resuscitation to prevent hypovolemia are paramount. Experience gleaned from trauma massive transfusion protocols suggests that judicious transfusion of packed red blood cells, fresh frozen plasma, and platelets in a 1:1:1 ratio is appropriate for obstetric patients. Additionally, patients with low fibrinogen levels should be treated with cryoprecipitate.
- The use of fixed transfusion ratios and standardized protocols for recognition and management of PPH has been demonstrated to increase earlier intervention and resolution of hemorrhage at an earlier stage, although the maternal outcomes results have been mixed.
- Multidisciplinary team drills and simulation exercises also should be considered to help solidify training of an institution's teams responsible for PPH response.
Novel management option: Tranexamic acid
In addition to these strategies, there is a new recommendation for managing refractory PPH: tranexamic acid, which works by binding to lysine receptors on plasminogen and plasmin, inhibiting plasmin-mediated fibrin degradation.5 Previously, tranexamic acid was known to be effective in trauma, heart surgery, and in patients with thrombophilias. Pacheco and colleagues recently demonstrated reduced mortality from obstetric bleeding if tranexamic acid was given within 3 hours of delivery, without increased thrombotic complications.5 ACOG recommends its use if initial medical therapy fails, while the World Health Organization strongly recommends that tranexamic acid be part of a standard PPH package for all cases of PPH (TABLE).6
Postpartum hemorrhage requires early, aggressive, and multidisciplinary coordination to ensure that 1) patients at risk for hemorrhage are identified for preventive measures; 2) existing hemorrhage is recognized and quickly treated, first with noninvasive methods and then with more definitive surgical treatments; and 3) blood product replacement follows an evidence-based standardized protocol. Tranexamic acid is recommended as an adjunct treatment for PPH (of any cause) and should be used within 3 hours of delivery.
Read about new ACOG guidance on prepregnancy and prenatal screening.
Carrier screening—choose something
ACOG Committee on Genetics. Committee opinion No. 690: Carrier screening in the age of genomic medicine. Obstet Gynecol. 2017;129(3):e35-e40.
ACOG Committee on Genetics. Committee opinion No. 691: Carrier screening for genetic conditions. Obstet Gynecol. 2017;129(3):e41-e55.
Ideally, carrier screening should be offered prior to pregnancy to fully inform couples of their reproductive risks and options for pregnancy. If not performed in the preconception period, carrier screening should be offered to all pregnant women. If a patient chooses screening and screens positive for a particular disorder, her reproductive partner should then be offered screening so that the risk of having an affected child can be determined.
New ACOG guidance on prepregnancy and prenatal screening
Carrier screening recommendations have evolved as the technology available has expanded. All 3 of the following strategies now are considered "acceptable" according to 2 recently published ACOG committee opinions.
Traditional ethnic-specific carrier screening, previously ACOG's sole recommendation, involves offering specific genetic screening to patients from populations with a high prevalence for certain conditions. One such example is Tay-Sachs disease screening in Ashkenazi Jewish patients.
Panethnic screening, which takes into account mixed or uncertain backgrounds, involves screening for a certain panel of disorders and is available to all patients regardless of their background (for example, cystic fibrosis screening offered to all pregnant patients).
Expanded carrier screening is when a large number of disorders can be screened for simultaneously for a lower cost than previous testing strategies. Expanded carrier screening panels vary in number and which conditions are tested by the laboratory. An ideal expanded carrier screening panel has been debated in the literature but not agreed on.7
ObGyns and practices therefore are encouraged to develop a standard counseling and screening protocol to offer to all their patients while being flexible to make available any patient-requested screening that is outside their protocol. Pretest and posttest counseling, including a thorough family history, is essential (as with any genetic testing) and should include residual risk after testing, potential need for specific familial mutation testing instead of general carrier screening, and issues with consanguinity.
Three essential screens
Regardless of the screening strategy chosen from the above options, 3 screening tests should be offered to all pregnant women or couples considering pregnancy (either individually or in the context of an expanded screening panel):
- Cystic fibrosis. At the least, a panel of the 23 most common mutations should be used. More expanded panels, which include hundreds of mutations, increase detection in non-Caucasian populations and for milder forms of the disease or infertility-related mutations.
- Hemoglobinopathies (sickle cell, α- and β-thalassemia). Complete blood count and red blood indices are recommended for all, with hemoglobin electrophoresis recommended for patients of African, Middle Eastern, Mediterranean, or West Indian descent or if mean corpuscular volume is low.
- Spinal muscular atrophy (SMA). The most recent addition to ACOG's recommendations for general carrier screening due to the relatively high carrier frequency (1-in-40 to 1-in-60) and the severity of the disease, SMA causes degeneration of the spinal cord neurons, skeletal muscular atrophy, and overall weakness. Screening is via polymerase chain reaction for SMN1 copy number: 2 copies are normal, and 1 copy indicates a carrier of the SMN1 deletion. About 3% to 4% of patients will screen negative but still will be "carriers" due to having 2 copies of the SMN1 gene on 1 chromosome and no copies on the other chromosome.
All pregnant patients or patients considering pregnancy should be offered carrier screening as standard reproductive care, including screening for cystic fibrosis, hemoglobinopathies, and spinal muscular atrophy. Ethnic, panethnic, or expanded carrier screening (and patient-requested specific screening) all are acceptable options, and a standard screening and counseling protocol should be determined by the ObGyn or practice.
Share your thoughts! Send your Letter to the Editor to [email protected]. Please include your name and the city and state in which you practice.
- Bateman BT, Cole NM, Maeda A, et al. Patterns of opioid prescription and use after cesarean delivery. Obstet Gynecol. 2017;130(1):29–35.
- Osmundson SS, Schornack LA, Grasch JL, Zuckerwise LC, Young JL, Richardson MD. Postdischarge opioid use after cesarean delivery. Obstet Gynecol. 2017;130(1):36–41.
- Prabhu M, McQuaid-Hanson E, Hopp S, et al. A shared decision-making intervention to guide opioid prescribing after cesarean delivery. Obstet Gynecol. 2017;130(1):42–46.
- Barbieri RL. Stop using codeine, oxycodone, hydrocodone, tramadol, and aspirin in women who are breastfeeding. OBG Manag. 2017;29(10):8–12.
- Pacheco LD, Hankins GD, Saad AF, Costantine MM, Chiossi G, Saade GR. Tranexamic acid for the management of obstetric hemorrhage. Obstet Gynecol. 2017;130(4);765–769.
- WHO recommendation on tranexamic acid for the treatment of postpartum haemorrhage. Geneva, Switzerland: World Health Organization; 2017.
- Stevens B, Krstic N, Jones M, Murphy L, Hoskovec J. Finding middle ground in constructing a clinically useful expanded carrier screening panel. Obstet Gynecol. 2017;130(2):279–284.

Amyloid depleter/antibody duo reduces systemic amyloidosis severity
A one-two combination consisting of a drug to deplete amyloid fibrils from circulation and a monoclonal antibody to mop up residual amyloid protein appears to be safe and shows promising activity against systemic amyloidosis in an early clinical trial.
Pairing the investigational small molecule agent miridesap and the experimental monoclonal antibody dezamizumab resulted in clearance or reductions in amyloid deposits in the livers, spleens, and kidneys of adults with systemic amyloidosis, reported Prof. Sir Mark B. Pepys of University College, London, and his colleagues.

Systemic amyloidosis is caused by extracellular deposition of amyloid fibrils coated with serum amyloid P component (SAP), a normal plasma protein. Miridesap has been shown to deplete levels of circulating SAP, but fails to clear SAP lingering in amyloid deposits. Dezamizumab is a fully humanized immunoglobulin G1 antibody that is directed against SAP and provokes immune system clearance of residual protein.
The investigators enrolled 23 adults with systemic amyloidosis into an open-label, nonrandomized trial of safety, pharmacokinetics, and dose responses to up to three cycles of miridesap followed by dezamizumab. They used scintigraphy with radiolabeling to measure amyloid burden, equilibrium MRI to measure organ extracellular volume, and transient elastography to evaluate liver stiffness.
They found that a 2,000-mg dose of dezamizumab reduced amyloid load in the liver and/or spleen in five of seven patients, and that liver stiffness, a sensitive marker for hepatic amyloid load, initially increased in some patients, but then fell “substantially,” suggesting amyloid clearance and resolution of cellular infiltrates. Progressive dose-related clearance of amyloid in the liver was also associated with improvements in liver function tests.
In addition, 7 of 11 patients had reductions in renal amyloid burden, with the greatest benefit seen in patients treated with higher doses of the antibody.
The trial cohort also included six patients with clinical cardiac amyloidosis: three with monoclonal immunoglobulin light-chain amyloidosis (AL), and three with ATTR (transthyretin) amyloidosis. Although the investigators had excluded patients with cardiac amyloidosis in the first part of the study out of safety concerns, there were no new arrhythmias and no increases in cardiac troponin T or creatine kinase concentrations. One patient had a 17% reduction in left ventricular mass, suggesting a reduction in cardiac amyloid burden.
Patients tolerated the treatment, with self-limiting, early-onset rashes after higher antibody doses being the most frequent adverse event.
“However, the identified and potential risks of the intervention are considered manageable, and thus acceptable, in relation to the demonstrable clinical benefits of removing amyloid from vital organs,” the investigators wrote.
GlaxoSmithKline funded the study. Three of the coauthors are GSK employees and stockholders. Prof. Pepys is the inventor on patents for miridesap and miridesap plus anti-SAP antibody.
Source: Richards D et al. Sci. Transl. Med. 2018. doi: 10.1126/scitranslmed.aan3128.
A one-two combination consisting of a drug to deplete amyloid fibrils from circulation and a monoclonal antibody to mop up residual amyloid protein appears to be safe and shows promising activity against systemic amyloidosis in an early clinical trial.
Pairing the investigational small molecule agent miridesap and the experimental monoclonal antibody dezamizumab resulted in clearance or reductions in amyloid deposits in the livers, spleens, and kidneys of adults with systemic amyloidosis, reported Prof. Sir Mark B. Pepys of University College, London, and his colleagues.
Systemic amyloidosis is caused by extracellular deposition of amyloid fibrils coated with serum amyloid P component (SAP), a normal plasma protein. Miridesap has been shown to deplete levels of circulating SAP, but fails to clear SAP lingering in amyloid deposits. Dezamizumab is a fully humanized immunoglobulin G1 antibody that is directed against SAP and provokes immune system clearance of residual protein.
The investigators enrolled 23 adults with systemic amyloidosis into an open-label, nonrandomized trial of safety, pharmacokinetics, and dose responses to up to three cycles of miridesap followed by dezamizumab. They used scintigraphy with radiolabeling to measure amyloid burden, equilibrium MRI to measure organ extracellular volume, and transient elastography to evaluate liver stiffness.
They found that a 2,000-mg dose of dezamizumab reduced amyloid load in the liver and/or spleen in five of seven patients, and that liver stiffness, a sensitive marker for hepatic amyloid load, initially increased in some patients, but then fell “substantially,” suggesting amyloid clearance and resolution of cellular infiltrates. Progressive dose-related clearance of amyloid in the liver was also associated with improvements in liver function tests.
In addition, 7 of 11 patients had reductions in renal amyloid burden, with the greatest benefit seen in patients treated with higher doses of the antibody.
The trial cohort also included six patients with clinical cardiac amyloidosis: three with monoclonal immunoglobulin light-chain amyloidosis (AL), and three with ATTR (transthyretin) amyloidosis. Although the investigators had excluded patients with cardiac amyloidosis in the first part of the study out of safety concerns, there were no new arrhythmias and no increases in cardiac troponin T or creatine kinase concentrations. One patient had a 17% reduction in left ventricular mass, suggesting a reduction in cardiac amyloid burden.
Patients tolerated the treatment, with self-limiting, early-onset rashes after higher antibody doses being the most frequent adverse event.
“However, the identified and potential risks of the intervention are considered manageable, and thus acceptable, in relation to the demonstrable clinical benefits of removing amyloid from vital organs,” the investigators wrote.
GlaxoSmithKline funded the study. Three of the coauthors are GSK employees and stockholders. Prof. Pepys is the inventor on patents for miridesap and miridesap plus anti-SAP antibody.
Source: Richards D et al. Sci. Transl. Med. 2018. doi: 10.1126/scitranslmed.aan3128.
FROM SCIENCE TRANSLATIONAL MEDICINE
Key clinical point: A combination of an amyloid-depleting agent and immunotherapeutic antibody appears effective and safe in patients with systemic amyloidosis.
Major finding: A 2,000-mg dose of dezamizumab reduced amyloid load in the liver and/or spleen in five of seven patients.
Data source: Open-label, nonrandomized clinical trial of 23 adults with various subtypes of systemic amyloidosis.
Disclosures: GlaxoSmithKline funded the study. Three of the coauthors are GSK employees and stockholders. Prof. Pepys is the inventor on patents for miridesap and miridesap plus anti-SAP antibody.
Source: Richards D et al. Sci. Transl. Med. 2018;10:eaan3128.