User login
Surgical anatomy and steps of the uterosacral ligament colpopexy

Visit the Society of Gynecologic Surgeons online: sgsonline.org
Additional videos from SGS are available here, including these recent offerings:
Visit the Society of Gynecologic Surgeons online: sgsonline.org
Additional videos from SGS are available here, including these recent offerings:
Visit the Society of Gynecologic Surgeons online: sgsonline.org
Additional videos from SGS are available here, including these recent offerings:
This video is brought to you by![]()

Mercury vapor from skin cream caused neurotoxicity in toddler
researchers at the University of Arizona, Tucson, found in the case of a toddler who presented with puzzling symptoms.
“Although mercury toxicity is rare and has variable symptoms, it is valuable for clinicians to consider this diagnosis in cases of unexplained hypertension and neurologic findings,” Michael R. Ori, MD, and his associates wrote in the Journal of Pediatrics.
U.S. federal law has prohibited mercury in cosmetics beyond trace amounts (1 mg/kg) since 1973 because of toxicity concerns, but mercury-containing skin creams remain a public health problem in the United States.
A 17-month-old previously healthy girl was seen by her pediatrician because of a 3-week history of fussiness, constipation, decreased appetite, and temperature to 37.7° C. A chest radiograph was normal, as was a urinalysis. Two days later, the child was taken to the emergency department with symptoms of rhinorrhea, congestion, fussiness, and a fever of 38.3° C. She was sent home with a presumptive diagnosis of a viral syndrome. Her symptoms had not resolved 1 week later, and she returned to the pediatrician, having developed a limp with tenderness in the right knee. A radiograph of the knee was unremarkable, repeat urinalysis showed no evidence of a urinary tract infection, and an abdominal x-ray showed a large stool burden. She had a 0.5-kg weight loss and new hypertension, and was afebrile.
The child was admitted to the hospital the next day for an endocrine work-up, but no noticeable abnormalities were found. She became increasingly fussy with a poor appetite and continued weight loss, persistent hypertension, and an inability to walk. Heavy metal screening on day 18 revealed an elevated whole blood mercury level of 26 mcg/L (normal is less than 10 mcg/L), with a random spot urine mercury level of 243 mcg/g creatinine (normal is less than 35 mcg/g creatinine). Repeated chelation with succimer was provided. On day 61, she had significant delay in receptive language and fine motor skills on a Bayley scale. On the most recent evaluation on day 222, she was shy and had stereotypical hand-flapping behavior when stressed, the investigators reported.
Multiple conversations with the patient’s mother eventually identified the source of mercury as a skin-lightening facial cream she had been using for 4 months, which she stored in the refrigerator. The cream was produced and purchased in a beauty salon in Mexico. Several containers of the cream were sent to an Arizona state laboratory; they were found to have mercury levels between 27,000 and 34,000 mg/kg. The mother and the grandmother had no symptoms or findings on physical exam, but had markedly elevated first-void urine mercury levels of 197 mcg/g creatinine for the mother and 222 mcg/g creatinine for the grandmother, the researchers reported.
Testing of the home the family rented found ambient air mercury vapor levels ranged from 1,900 to 2,800 ng/m3 for most areas. Federal agencies recommend remediation for levels greater than 1,000 ng/m3; remediation was performed in the home, with some household items disposed of in a hazardous waste landfill.
This toddler’s exposure to mercury was from contact with contaminated people, objects, and vapor, although the mercury-containing cream was not directly put on her skin. Of these sources of contact, vapor may have contributed the most. There likely was incidental dermal contact through contaminated bed linens, and she also likely had incidental oral contact from contaminated objects that she put in her mouth, Dr. Ori and his associates reported.
Over time, central nervous system penetration occurs with neurologic dysfunction; “this was the dominant feature of this patient’s presentation, with debilitating leg pain, anorexia, constipation, neurasthenia, and hypertension. Acrodynia, meaning extremity pain, is an idiosyncratic reaction to mercury exposure seen in childhood. Symptoms include irritability,weakness, paresthesias, a pink papular rash, and desquamation of the palms and soles. Our patient did not have the characteristic dermal findings but did have other symptoms consistent with acrodynia,” they noted.
The authors declared no conflicts of interest.
SOURCE: Ori MR et al. J Pediatr. 2018. doi: 10.1016/j.jpeds.2017.12.0.23.
FROM THE JOURNAL OF PEDIATRICS
Multigene test panel helps diagnose fetal skeletal abnormalities
DALLAS – A multigene skeletal dysplasia panel detected pathogenic variants in 55% of fetal tissue samples with abnormal ultrasound findings and correctly predicted fetal lethality or viability in 75% of these.
The prenatal skeletal dysplasia panel tests 23 genes implicated in 29 different clinical syndromes, Lisa M. Vincent, PhD, said at the meeting sponsored by the Society for Maternal-Fetal Medicine. The panel’s performance in a validation cohort of 280 fetal tissue specimens, said Dr. Vincent, “underscores the clinical utility of a comprehensive, multigene sequencing tool that can aid in the diagnosis of prenatal skeletal dysplasias, allowing physicians to better manage these pregnancies.”
Up to 5 pregnancies per 1,000 are affected by some form of skeletal dysplasia, said Dr. Vincent, a clinical molecular geneticist at GeneDx, which manufactures the test. Early findings are typically picked up on ultrasound; the most frequent include limb shortening, long bone angulation, bowing, or fracture; abnormal bone echogenicity; facial dysmorphism; platyspondyly; chest narrowing and abnormal ribs; and frontal bossing of the fetal skull. However, she noted, it’s not always easy to assign a firm diagnosis based on imaging alone.
“In the prenatal period, clinical diagnosis remains challenging because of lack of availability of high-resolution imaging and lack of experience in interpreting the imaging results. Additionally, these are a genetically heterogeneous group of disorders with overlapping clinical features.”
The testing cohort for this panel comprised 280 specimens. Most (84%) were obtained from amniocentesis; 5% were from chorionic villi sampling, and the remainder were derived from other sources. The median gestational age was 20 weeks and 5 days, but the samples ranged from 5 to 36 weeks’ gestation.
The most common imaging indication for testing was short limbs (87%). Other indications included abnormal ribs or small chest circumference (47%); bowed or fractured bones (28%); leg bowing (27%); upper limb deformity (12%); poly- or syndactyly (5%); and other findings, including facial dysmorphism (23%). About 5% of the samples had a family history of skeletal dysplasia.
The panel returned a positive clinical diagnosis for 55% of the specimens. It could not determine a genetic cause for the observed clinical phenotype in 28%, and the test returned uncertain results in 17%, Dr. Vincent said.
“In these cases, we were uncertain whether the variants we identified caused the clinical features.”
Of the 153 positive cases, 42% were affected by pathogenic variants in the collagen genes of COL1A1, COL1A2, and COL1A3. Variants in the FGFR3 gene (39%) were next most common. FGFR3 is associated with achondroplasia, hypochondroplasia, thanatophoric dysplasia types 1 and 2, SADDAN (severe achondroplasia with developmental delay and acanthosis nigricans), and platyspondylic lethal skeletal dysplasia. Mutations of the SOX-9 gene, responsible for campomelic dysplasia, accounted for 5%. The test also identified nine other genetic variants in small numbers of samples.
“About 90% of the genes were autosomal dominant, indicating they are typically de novo or sporadic,” Dr. Vincent said. “About 10% were autosomal recessive, and just 1% were linked to an X-linked mutation.”
The clinical syndromes identified through these genes included osteogenesis imperfecta and thanatophoric dysplasia (33% each); achondrogenesis and spondyloepiphyseal dysplasia (11%); asphyxiating thoracic dystrophy/short rib polydactyly syndrome and campomelic dysplasia (5% each). The remaining cases were atelosteogenesis, Apert syndrome, Crouzon syndrome, chondrodysplasia punctata, hypochondroplasia, and Ellis-van Creveld syndrome.
The test predicted that 64% of the cases would be lethal. In 26%, viability was uncertain, but 10% – including 5% of the osteogenesis imperfecta cases – could be viable.
“Most lethal cases tended to have several characteristics, including short limbs, abnormal ribs, and bowed or fracture bones,” Dr. Vincent said. “Short limbs were almost five times more common in the lethal cases than in those with variable severity. Abnormal ribs and small chest were five times more frequent in the lethal cases, and bowed or fractured bones were four times more common.”
Among the nonpositive cases, 32% had additional testing. Of these, 8% had cytogenetic or large-array abnormalities, and another 8% were positive for a skeletal dysplasia that was not caused by any of the genes on the test panel.
Dr. Vincent noted that the turnaround time for the test is generally 2-3 weeks.
SOURCE: Vincent L et al. Am J Obstet Gynecol. 2018;18:S57-8.
REPORTING FROM THE PREGNANCY MEETING
Key clinical point: A 23-gene panel can identify 29 fetal skeletal dysplasias.
Major finding: The test identified a clinical diagnosis for 55% of samples and predicted fetal lethality or viability in 75% of these.
Study details: The validation cohort comprised 280 fetal samples.
Disclosures: GeneDx manufactures the test. Dr. Vincent is an employee of the company.
Source: Vincent L et al. Am J Obstet Gynecol. 2018;218:S57-8.
Unscheduled visits for pain after hernia surgery common, costly
And although these calls and visits are costly in health care resources, many patients do not receive an actionable diagnosis, according to a study published in The American Journal of Surgery.
Colin G. DeLong, MD, and his colleagues reviewed health records of patients who underwent an open procedure for complex ventral hernia repair (cVHR) at Penn State Milton S. Hershey Medical Center in Hershey, Penn., between January 2013 and August 2015 using the American College of Surgeons National Surgery Quality Improvement Project (NSQIP) data available at the institution. They identified a cohort of 177 patients, 79% of whom were reviewed for pain issues at 1 year.
The study focused on postoperative pain during the first year following open cVHR. The investigators looked at how patients registered postoperative discomfort, risk factors that predicted greater utilization of the health system for pain-related complaints, and how often complaints of chronic pain resulted in an actionable diagnosis.
All postop encounters in the year after surgery were documented, including the sequence of events in response to pain complaints. In addition, the investigators recorded “instances in which a diagnosis resulted from such actions and whether the diagnosis was actionable, meaning it led to a specific intervention that was expected to alleviate the pain.”
Of the 177 patients, 91 patients made an unsolicited call, clinic visit, or ED visit for pain issues. For 38 patients in this group, action was taken (additional prescription, imaging ordered, ED workup recommended or undertaken). For the other 53, no action was taken. From each group, some cases resolved because of further intervention, and some cases resolved without further action. Mesh use and preoperative pain scores were predictors of postop pain, but not age, ethnicity, sex, or other comorbidities. But 38 (21%) patients continued to have pain that was not resolved at 1 year, 32 of which had no actionable diagnosis.
The study was retrospective and limited by inclusion of visits and calls only to the surgical services and not to other medical services or physicians. Pain complaints were subjective and levels of severity were not recorded.
The investigators concluded that estimates of the number of patients who have chronic pain after cVHR do not capture the level of health care resource utilization for this problem. Patients experiencing postop pain make unscheduled calls or visits to the clinic or ED, and many do so repeatedly without receiving an actionable diagnosis. “A cost analysis specific to treating postoperative pain for 1 year would provide a better understanding of the magnitude of the problem. Subjective complaints of pain in the year following cVHR are frequent and represent a hidden driver of resource utilization which must be better understood to achieve optimal, cost effective care.”
The authors declared no conflicts of interest.
SOURCE: DeLong CG et al. Am J Surg. 2018. doi: 10.1016/j.amjsurg.2018.01.030.
FROM THE AMERICAN JOURNAL OF SURGERY
Key clinical point: Chronic pain has a significant effect on resource utilization following complex ventral hernia repair.
Major finding: Of patients who made unscheduled calls or visits to the clinic or ED for postop pain, 21% did not receive an actionable diagnosis.
Study details: Records from the ACS NSQIP of 177 patients undergoing cVHR were reviewed for postop pain visits and follow-up.
Disclosures: The authors declared no conflicts of interest.
Source: DeLong CG et al. Am J Surg. 2018. doi: 10.1016/j.amjsurg.2018.01.030.
MDedge Daily News: Could bimekizumab reshape psoriasis treatment?
The video associated with this article is no longer available on this site. Please view all of our videos on the MDedge YouTube channel
Could bimekizumab reshape psoriasis treatment? Next-day discharge after TAVR shows promise. Are fewer ultrasounds safe in high-risk pregnancies? And Medicare’s readmissions penalties are working – or not.
Listen to the MDedge Daily News podcast for all the details on today’s top news.

Treating Cancer Fatigue With Placebo
Cancer-related fatigue can linger long after treatments are ended, making daily activities harder and diminishing quality of life (QOL). But researchers from University of Alabama in Birmingham and Harvard Medical School in Boston suggest a nonpharmaceutical way to help patients feel better: placebo.
They compared an open-label placebo with treatment as usual in patients with cancer-related fatigue in a 21-day controlled trial. The patients had completed cancer treatment 6 months to 10 years prior to enrollment. Of 74 patients, 28 reported a moderate level of fatigue and 46 reported a severe level. The mean fatigue scores at baseline were similar for both groups.
The participants randomly assigned to placebo took 2 placebo pills twice a day. At 21 days, the average difference in scores was statistically significant. The placebo group reported a 29% improvement in fatigue severity and a 39% improvement in fatigue-disrupted QOL. Put another way, 76% of the placebo group had a change score above the mean change score of the usual-treatment group. The results were clinically meaningful, the researchers say. Moreover, there were no reported adverse events or adverse effects.
After that main study, the researchers also conducted a 21-day exploratory crossover extension, which began 1 week later. Their findings supported the main study results, with the same magnitude of improvement. The usual-treatment patients who chose to try the placebo also reported a similar magnitude of reductions in fatigue severity (23%) and fatigue-disrupted QOL (35%).
Interestingly, the effects seemed to be sustained, the researchers say. At day 48, there was no significant change in fatigue scores compared with day 21, an “exciting” preliminary finding they say that needs further exploration.
Source:
Hoenemeyer TW, Kaptchuk TJ, Mehta TS, Fontaine KR. Scientific Reports. 2018;8:2784.
doi:10.1038/s41598-018-20993-y.
New C. difficile guidelines recommend fecal microbiota transplants
.
The updated Clinical Practice Guidelines for Clostridium difficile Infection in Adults and Children, published in the Feb. 15 edition of Clinical Infectious Diseases (doi: 10.1093/cid/cix1085), address changes in management and diagnosis of the infection, and include recommendations for pediatric infection. The guidelines from the Infectious Diseases Society of America and the Society for Healthcare Epidemiology of America were lasted published in 2010.
One of the strongest recommendations was on the use of FMTs to treat recurrent C. difficile infection after the failure of antibiotic therapy.
“Anecdotal treatment success rates of fecal microbiota transplantation for recurrent CDI [C. difficile infection] have been high regardless of route of instillation of feces, and have ranged between 77% and 94% with administration via the proximal small bowel; the highest success rates (80%-100%) have been associated with instillation of feces via the colon,” they wrote.
The guidelines also addressed what the authors described as the “evolving controversy” over the best methods for diagnosis, pointing out that there is little consensus about the best laboratory testing method.
“Given these various conundrums and the paucity of large prospective studies, the recommendations, while strong in some instances, are based upon a very low to low quality of evidence,” the authors said.
That aside, they advised that patients with unexplained and new-onset diarrhea (three or more unformed stools in 24 hours) were the preferred target population for testing for C. difficile infection. The most sensitive method of diagnosis in patients with clinical symptoms likely to be C. difficile infection was a nucleic acid amplification test, or a multistep algorithm, rather than a toxin test alone.
The guidelines committee also strongly advised against repeat testing within 7 days during the same episode of diarrhea, and against testing stool from asymptomatic patients, except for the purpose of epidemiologic study. They also noted there was insufficient evidence for the use of biologic markers such as fecal lactoferrin as an adjunct to testing.
The guidelines’ authors found there was not enough evidence to recommend discontinuing proton pump inhibitors to reduce the incidence of C. difficile infection, despite epidemiologic evidence of an association between proton pump inhibitor use and C. difficile infection. Similarly, there was a lack of evidence for the use of probiotics for primary prevention, but the authors noted that meta-analyses suggest probiotics may help prevent C. difficile infection in patients on antibiotics without a history of C. difficile infection.
With respect to antibiotic treatment, they recommended that patients diagnosed with C. difficile infection should first discontinue the inciting antibiotic treatment and then begin therapy with either vancomycin or fidaxomicin. For recurrent infection, they advised a tapered and pulsed regimen of oral vancomycin or a 10-day course of fidaxomicin. If patients had received metronidazole for the primary episode, they should be given a standard 10-day course of vancomycin for recurrent infection, the authors said.
In terms of diagnosis and management of pediatric C. difficile, the guidelines advised against routinely testing infants under 2 years of age with diarrhea, as the rate of C. difficile colonization even among asymptomatic infants can be higher than 40%. Even in children older than age 2, there was only a “weak” recommendation for C. difficile testing in patients with prolonged or worsening diarrhea and other risk factors such as inflammatory bowel disease or recent antibiotic exposure.
Children with a first episode or first recurrence of nonsevere C. difficile should be treated with either metronidazole or vancomycin, the authors wrote, but in the case of more severe illness or second recurrence, oral vancomycin was preferred over metronidazole.
The authors also suggested clinicians consider FMTs for children with recurrent infection that had failed to respond to antibiotics, but noted the quality of evidence for this was very low.
The guidelines were funded by the Infectious Diseases Society of America and the Society for Healthcare Epidemiology of America. Six authors declared grants, consultancies, board positions, and other payments from the pharmaceutical industry outside the submitted work. One author also held patents relating to the treatment and prevention of C. difficile infection.
SOURCE: McDonald CL et al. Clin Infect Dis. 2018 Feb 15. doi: 10.1093/cid/cix1085.
FROM CLINICAL INFECTIOUS DISEASES
Key clinical point: Fecal microbiota transplants should be considered for use in patients with recurrent Clostridium difficile infection that has not responded to antibiotic therapy.
Major finding: One of the strongest recommendations in the new guidelines on C. difficile infection is to consider use of fecal microbiota transplants in patients with recurrent infection.
Data source: Clinical practice guidelines.
Disclosures: The guidelines were funded by the Infectious Diseases Society of America and the Society for Healthcare Epidemiology of America. Six authors declared grants, consultancies, board positions, and other payments from the pharmaceutical industry outside the submitted work. One author also held patents relating to the treatment and prevention of C. difficile infection.
Source: McDonald CL et al. Clin Infect Dis. 2018 Feb 15. doi: 10.1093/cid/cix1085.

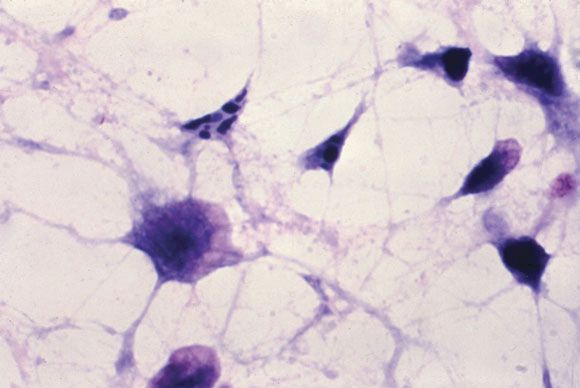
Antibody has ‘very promising activity’ in rel/ref CTCL

LA JOLLA, CA—An antibody targeting KIR3DL2 has “very promising activity” in relapsed/refractory cutaneous T-cell lymphoma (CTCL), according to a speaker at the 10th Annual T-cell Lymphoma Forum.
The antibody, IPH4102, produced an overall response rate (ORR) of 44% in a phase 1 trial of CTCL patients, with an ORR of 50% in patients with Sézary syndrome (SS).
There were 2 serious adverse events (AEs) that were considered possibly related to IPH4102, and 1 of these was fatal.
Youn H. Kim, MD, of Stanford Cancer Institute in Palo Alto, California, presented these results at this year’s T-cell Lymphoma Forum. The research was sponsored by Innate Pharma, the company developing IPH4102.
“KIR3DL2 is a target that’s a member of the killer immunoglobulin-like receptor [KIR] family, and it’s also very specifically expressed in CTCL,” Dr Kim explained. “The antibody [IPH4102] is Fc-modified to enhance the antibody-dependent cell cytotoxicity and also works by antibody-dependent cell phagocytosis. It binds and, with the immunologic effect, kills the cancer cells.”
“[IPH4102] is specific for cancer cells because [KIR3DL2] is only minimally expressed in normal T cells as well as natural killer [NK] cells. About a third of NK cells that do express [KIR3DL2] don’t get affected [by IPH4102]. So it looks like the killer cells don’t kill each other, and they specifically target the neoplastic cells.”
Patients
Dr Kim and her colleagues have tested IPH4102 in 25 patients with relapsed/refractory CTCL—20 with SS, 4 with mycosis fungoides (MF), and 1 with CD4+ CTCL not otherwise specified. At baseline, patients had a median age of 71 (range, 42-90).
The patients had received a median of 4 prior systemic regimens (range, 2-10). Among the MF and SS patients, 1 patient had stage IB disease, 3 had stage IIB, and 20 had stage IVA disease.
Treatment
This study has a dose-escalation portion (accelerated 3+3 design) and an expansion portion. Dr Kim presented results for the 25 patients in the dose-escalation portion, which was completed in May 2017.
Patients received IPH4102 at 10 dose levels, ranging from 0.0001 mg/kg to 10 mg/kg. They received the drug once weekly for 4 doses, every 2 weeks for 10 doses, and every 4 weeks thereafter. They were treated until progression or unacceptable toxicity.
The expansion cohorts (which include SS and transformed MF patients) started enrolling in July 2017, with patients receiving IPH4102 at the recommended phase 2 dose—750 mg.
Safety
There were no dose-limiting toxicities with IPH4102. So the equivalent of 10 mg/kg—a 750 mg flat dose—was deemed the recommended phase 2 (and expansion) dose.
The incidence of AEs was 92% (n=23), and the incidence of treatment-related AEs was 52% (n=13).
Treatment-related AEs included lymphopenia (16%, n=4), asthenia (12%, n=3), nausea (8%, n=2), chills (8%, n=2), pyrexia (8%, n=2), arthralgia (8%, n=2), and muscle spasms (8%, n=2).
Eight patients had serious AEs, and 2 had serious AEs that were considered possibly related to treatment.
One patient had grade 2 atrial flutter diagnosed 1 hour after the first dose of IPH4102. The patient had a history of cardiac arrhythmia. She was hospitalized after the atrial flutter, received amiodarone, and the arrhythmia resolved. She went on to receive 15 more doses of IPH4102 without recurrence.
The other patient with a serious AE considered possibly related to treatment had hepatitis that occurred 6 weeks after the last dose of IPH4102. The patient had discontinued treatment due to progression after receiving IPH4102 for a year and achieving a partial response (PR).
This patient ultimately died of the hepatitis. Another fatal AE, considered unrelated to treatment, was Staphylococcus aureus sepsis.
“The safety looks very solid,” Dr Kim said, “[with] very low numbers of any significant severe adverse effects.”
Efficacy
The best global ORR was 44%, with 10 PRs and 1 complete response (CR). Twelve patients had stable disease, and 2 progressed.
In patients with SS, the best global ORR was 50%. One patient had a CR, 9 had PRs, and 8 had stable disease. The ORR was 60% in the skin and a 65% in the blood compartment for patients with SS.
Four responses were ongoing at last follow-up. The median follow-up was 15 months.
The median duration of response for the entire cohort was 8.2 months (range, 64 days to 519+ days). For SS patients, the median duration of response was 9.9 months (range, 64 days to 519+ days).
The median progression-free survival was 9.8 months overall (range, 28 days to 610+ days). For SS patients, the median progression-free survival was 10.8 months (range, 28 days to 610+ days).
“So with the efficacy and the safety profile, we are really hoping to get this drug to the phase 2 level and are excited to move forward,” Dr Kim concluded.
ASCO, NCCN release guidelines on checkpoint inhibitors
Two cancer organizations have released guidelines for managing the side effects of immune checkpoint inhibitors.
The American Society of Clinical Oncology (ASCO) and National Comprehensive Cancer Network® (NCCN) developed these guidelines because patients who receive immune checkpoint inhibitors experience unique side effects that can be severe, irreversible, and life-threatening.
Given that checkpoint inhibitors have entered the clinic fairly recently, clinicians may need guidance in recognizing and treating these side effects.
“With rapidly increasing use of immune checkpoint inhibitors, it is imperative that clinicians are knowledgeable about their unique toxicity profiles,” said ASCO Chief Executive Officer Clifford A. Hudis, MD.
“These new guidelines from ASCO and NCCN will help our community continue to provide the highest quality of care to all patients as they incorporate these agents into routine care.”
To the develop their guidelines, ASCO and NCCN convened multidisciplinary panels with representation from hematology, oncology, dermatology, gastroenterology, rheumatology, pulmonology, endocrinology, urology, neurology, emergency medicine, and nursing, as well as patient advocacy experts.
The clinical recommendations are based on a systematic review of the literature and an informal consensus process. The recommendations pertain only to checkpoint inhibitors currently approved in the US—pembrolizumab, nivolumab, atezolizumab, avelumab, ipilimumab, and durvalumab.
Key recommendations from the guidelines include:
- In general, checkpoint inhibitors can be continued with close monitoring if patients experience grade 1 toxicities, with the exception of some neurologic, cardiac, and hematologic toxicities.
- For grade 2 toxicities, checkpoint inhibitors should be held until symptoms and/or lab values revert to grade 1 levels or lower. Corticosteroids may be offered.
- For grade 3 toxicities, patients should receive high-dose corticosteroids for at least 6 weeks. Extreme caution is recommended when restarting immunotherapy after grade 3 toxicity, if it is restarted at all.
- In general, grade 4 toxicities necessitate stopping checkpoint inhibitor therapy permanently.
Consult the guidelines for specific recommendations.
ASCO’s guidelines, “Management of Immune-Related Adverse Events in Patients Treated With Immune Checkpoint Inhibitor Therapy: American Society of Clinical Oncology Clinical Practice Guideline,” have been published in the Journal of Clinical Oncology.
NCCN’s guidelines, “Management of Immunotherapy-Related Toxicities (Immune Checkpoint Inhibitor-Related Toxicities),” are available on the NCCN website.
Product seems effective for ITI in severe hemophilia A

Results of a retrospective study suggest a recombinant factor VIII Fc fusion protein (rFVIIIFc) can be effective for immune tolerance induction (ITI) in patients with severe hemophilia A and inhibitors.
Four of 7 first-time ITI patients achieved tolerization with rFVIIIFc at a median of 7.8 months.
Of 12 patients who had previously received treatment for ITI, 7 achieved a negative inhibitor level with rFVIIIFc. However, only 3 of these patients were still negative at the time of analysis.
In all, 16 of the 19 patients studied remained on rFVIIIFc for prophylaxis or ITI, and researchers said longer follow-up was needed.
No adverse events were reported in this study.
Manuel Carcao, MD, of The Hospital for Sick Children in Toronto, Ontario, Canada, and his colleagues conducted this study and published the results in Haemophilia.
The research was sponsored by Bioverativ Therapeutics, Inc. Bioverativ markets rFVIIIFc as Eloctate in some countries. Sobi markets rFVIIIFc (or efmoroctocog alfa) as Elocta in other countries.
The study included 19 patients—7 first-time ITI patients and 12 rescue patients—with severe hemophilia A and FVIII inhibitors.
First-timer results
Four of the 7 first-timers were tolerized and had transitioned to rFVIIIFc prophylaxis at the time of analysis.
Three patients met the definition of tolerization at 5 months, 7 months, and 9 months, respectively. All were all on a daily rFVIIIFc (85-200 IU/kg) regimen.
The fourth patient, who had been on a 3-times-per-week (50 IU/kg) ITI regimen, was considered tolerized at 14.8 months.
Of the 3 remaining patients, 2 had a decrease in Bethesda titer. The first patient had a decrease from 32 Bethesda units (BU) to 18 BU after 18 weeks of ITI. The second patient had a decrease from 378 BU to 23 BU after 58 weeks of ITI.
The third patient had an initial increase in titer from 3 BU to 16 BU after 15 weeks of rFVIIIFc. He went on to receive ITI with a different factor but did not respond. He resumed rFVIIIFc ITI after 27 weeks and had been receiving it for 7 weeks at the time of analysis. His most recent Bethesda titer had fallen. The researchers said this patient had been poorly compliant with ITI.
All 7 first-time ITI patients were still receiving rFVIIIFc—4 as prophylaxis and 3 for ITI—at the time of analysis.
Rescue results
Twelve patients had previously failed ITI. Seven of them achieved negative inhibitor levels with rFVIIIFc ITI. The median time to negativity was 14.1 weeks (range, 3 weeks to 67.6 weeks).
Three of the patients were still negative at the time of analysis. Two of them were still on rFVIIIFc ITI, and 1 was on rFVIIIFc prophylaxis.
Four patients who initially achieved negativity later developed a titer greater than 0.6 BU. Two of these patients were still on rFVIIIFc ITI at analysis, and 2 switched to other factors.
There were 5 patients who did not achieve negative inhibitor levels. One of these patients had a decrease in titer from 36 BU to 22 BU after 10 weeks. For the other 4 patients, titer was either unchanged or increased while on ITI.
Four of the 5 patients who did not achieve negative inhibitor levels remained on rFVIIIFc ITI at analysis, and 1 was placed on bypass therapy.
In total, 9 of the 12 rescue patients were still on rFVIIIFc at analysis—9 for ITI and 1 as prophylaxis.
“The development of inhibitors is a tremendous challenge and significant burden for people with severe hemophilia A, and the goal of treatment should be eradication of inhibitors,” said Maha Radhakrishnan, MD, of Bioverativ.
“The results of this analysis are encouraging and support the need for additional and ongoing scientific research on [rFVIIIFc ] in ITI to determine whether an Fc-based recombinant factor VIII therapy can rapidly tolerize patients with inhibitors.”
Bioverativ and Sobi have initiated 2 prospective studies designed to further evaluate the use of rFVIIIFc for ITI in patients with severe hemophilia A and inhibitors (NCT03093480 and NCT03103542).