User login
Questions, documentation, and lab tests are crucial in alopecia areata
LAS VEGAS – according to Maria Hordinsky, MD, professor and chair of the department of dermatology at the University of Minnesota, Minneapolis.

Other important steps in the work-up of a patient include extensive documentation of AA – including use of the Severity of Alopecia Tool (SALT) score or photography – and laboratory testing, Dr. Hordinsky said at the Skin Disease Education Foundation’s annual Las Vegas Dermatology Seminar.
AA affects an estimated 1.7%-2.1% of the population and is sporadic in 50%-80% of cases. AA targets follicles in the anagen phase, which makes up 90% of hair follicles and normally lasts for 2-7 years. The condition has been linked to vitiligo, thyroid disease, and atopy (allergic rhinitis, asthma, and atopic dermatitis). AA has also been linked to autoimmune disorders, such as lupus erythematosus, psoriasis, rheumatoid arthritis, celiac disease, and type 1 diabetes mellitus. In addition, Dr. Hordinsky said, genetic research has linked alopecia to the latter three conditions.
It’s important to ask how much the hair loss bothers the patient, regardless of his or her age, Dr. Hordinsky said. “You need to figure out what’s making them all anxious and depressed. Is it shedding hair every single day?” she said. “Figure out what bothers that patient and go after that issue after you’ve answered his or her questions.”
In some cases, she said, “patients who’ve had extensive disease for a very long time are really coming in for a social visit to talk about what’s new, what’s emerging, whether they’d be interested in participating in a clinical trial.”
Dr. Hordinsky provided this list of questions to help in evaluating these patients:
- Is scalp hair loss the biggest problem? Eyebrow loss? Eyelash loss? Nail issues? All of these?
- How bothersome is it to experience hair shedding every day? Does this make the patient depressed and anxious?
Dr. Hordinsky added that asking patients about the following topics can also be appropriate:
- Hair care habits. Is the patient no longer shampooing because of hair loss?
- Medications.
- Symptoms, such as pain, itch, and burning.
- Body hair. Does the patient feel there’s too little or too much?
- Nail abnormalities.
- Menstrual cycle and pregnancies.
- Diet and supplements.
- Family history. Patients – who are often very curious about the disease – often mention relatives when they hear about a genetic role in AA, she said. They’ll say “My aunt has rheumatoid arthritis” or “My cousin has autoimmune disease.”
- Excess androgen levels and autoimmune/endocrine diseases.
The patient examination should include documentation of the presence of vellus hair or indeterminate and terminal fibers; the presence or absence of scale, erythema, folliculitis, and atrophy; eyebrow, eyelash, or body hair loss; and nail damage, such as pitting.
Photography and/or the SALT score may be used for documentation, she said. The SALT score is the only standardized method of assessment for AA, she said. The score is produced by a calculation that takes into account the amount of hair loss in the quadrants (right, left, front, back) of the scalp (J Am Acad Dermatol. 2018 Sep;79[3]:470-478.e3).
Laboratory tests are important, but there is no standard list, Dr. Hordinsky said. They are selected based on history and physical examination and can include thyroid function studies; heme and iron profiles, including serum ferritin and hemoglobin; and measurements of vitamin D, thiamine, zinc, and total protein. “We check nutrition labs particularly if a patient has been taking a lot of supplements, and we’re not sure where we’re at,” Dr. Hordinsky said.
Dermatologists may also order tests to measure non-cycle dependent hormones such as dehydroepiandrosterone sulfate (DHEAS), total/free testosterone, and antinuclear antibodies and other autoantibodies.
SDEF and this news organization are owned by the same parent company.
Dr. Hordinsky disclosed consulting work with Procter & Gamble, Concert, and Cassiopea and grant/research support from Aclaris, National Alopecia Areata Foundation, Allergan.
LAS VEGAS – according to Maria Hordinsky, MD, professor and chair of the department of dermatology at the University of Minnesota, Minneapolis.
Other important steps in the work-up of a patient include extensive documentation of AA – including use of the Severity of Alopecia Tool (SALT) score or photography – and laboratory testing, Dr. Hordinsky said at the Skin Disease Education Foundation’s annual Las Vegas Dermatology Seminar.
AA affects an estimated 1.7%-2.1% of the population and is sporadic in 50%-80% of cases. AA targets follicles in the anagen phase, which makes up 90% of hair follicles and normally lasts for 2-7 years. The condition has been linked to vitiligo, thyroid disease, and atopy (allergic rhinitis, asthma, and atopic dermatitis). AA has also been linked to autoimmune disorders, such as lupus erythematosus, psoriasis, rheumatoid arthritis, celiac disease, and type 1 diabetes mellitus. In addition, Dr. Hordinsky said, genetic research has linked alopecia to the latter three conditions.
It’s important to ask how much the hair loss bothers the patient, regardless of his or her age, Dr. Hordinsky said. “You need to figure out what’s making them all anxious and depressed. Is it shedding hair every single day?” she said. “Figure out what bothers that patient and go after that issue after you’ve answered his or her questions.”
In some cases, she said, “patients who’ve had extensive disease for a very long time are really coming in for a social visit to talk about what’s new, what’s emerging, whether they’d be interested in participating in a clinical trial.”
Dr. Hordinsky provided this list of questions to help in evaluating these patients:
- Is scalp hair loss the biggest problem? Eyebrow loss? Eyelash loss? Nail issues? All of these?
- How bothersome is it to experience hair shedding every day? Does this make the patient depressed and anxious?
Dr. Hordinsky added that asking patients about the following topics can also be appropriate:
- Hair care habits. Is the patient no longer shampooing because of hair loss?
- Medications.
- Symptoms, such as pain, itch, and burning.
- Body hair. Does the patient feel there’s too little or too much?
- Nail abnormalities.
- Menstrual cycle and pregnancies.
- Diet and supplements.
- Family history. Patients – who are often very curious about the disease – often mention relatives when they hear about a genetic role in AA, she said. They’ll say “My aunt has rheumatoid arthritis” or “My cousin has autoimmune disease.”
- Excess androgen levels and autoimmune/endocrine diseases.
The patient examination should include documentation of the presence of vellus hair or indeterminate and terminal fibers; the presence or absence of scale, erythema, folliculitis, and atrophy; eyebrow, eyelash, or body hair loss; and nail damage, such as pitting.
Photography and/or the SALT score may be used for documentation, she said. The SALT score is the only standardized method of assessment for AA, she said. The score is produced by a calculation that takes into account the amount of hair loss in the quadrants (right, left, front, back) of the scalp (J Am Acad Dermatol. 2018 Sep;79[3]:470-478.e3).
Laboratory tests are important, but there is no standard list, Dr. Hordinsky said. They are selected based on history and physical examination and can include thyroid function studies; heme and iron profiles, including serum ferritin and hemoglobin; and measurements of vitamin D, thiamine, zinc, and total protein. “We check nutrition labs particularly if a patient has been taking a lot of supplements, and we’re not sure where we’re at,” Dr. Hordinsky said.
Dermatologists may also order tests to measure non-cycle dependent hormones such as dehydroepiandrosterone sulfate (DHEAS), total/free testosterone, and antinuclear antibodies and other autoantibodies.
SDEF and this news organization are owned by the same parent company.
Dr. Hordinsky disclosed consulting work with Procter & Gamble, Concert, and Cassiopea and grant/research support from Aclaris, National Alopecia Areata Foundation, Allergan.
EXPERT ANALYSIS FROM SDEF LAS VEGAS DERMATOLOGY SEMINAR
CT opens extended window for stroke thrombolysis
MONTREAL – An extended time window for thrombolytic treatment of acute ischemic stroke patients using tissue plasminogen activator out to 9 hours from stroke onset was safe and effective using CT perfusion imaging and automated imaging processing software to select suitable patients in the EXTEND trial. This result matches the groundbreaking finding reported earlier in 2018 that used MRI to select patients for extended thrombolysis.

“To reproduce our results you need to set up CT perfusion” as well as the RAPID software for automated image processing to identify patients with a small infarct core and a large area of salvageable brain, said Henry Ma, MD, a stroke neurologist at Monash University, Melbourne, as he reported results from the trial at the World Stroke Congress. “EXTEND is the first positive thrombolysis trial in an extended time window using automated penumbral imaging.”
The new finding, from a trial with 225 randomized stroke patients, was especially notable because, by showing the validity of CT imaging for patient selection, it makes applying the extended time window for thrombolytic therapy more feasible for U.S. and Canadian stroke centers where CT imaging is much more common than MRI. A report from European investigators published in August 2018 from the WAKE-UP trial showed that thrombolysis with tissue plasminogen activator (tPA) was safe and effective when administered to patients who woke up with an acute ischemic stroke that had occurred more than 4.5 hours before treatment, but this study exclusively used MRI for patient selection (N Engl J Med. 2018 Aug 16;379[7]:611-22).
“In North America, our systems are more equipped for using CT,” commented Ashfaq Shuaib, MD, a professor of medicine and neurologist at the University of Alberta, Edmonton. Based on the WAKE-UP results, “MR would be preferred, but what we’ve been doing [since the WAKE-UP report] is if we see a CT scan that’s good we go ahead” with thrombolysis.

“Biologically, it doesn’t matter whether you use MR or CT; they both index the same underlying pathology. We’ve been hesitant to go beyond the MR finding from WAKE-UP, where there were data, but the findings from EXTEND were right in line with the WAKE-UP results, and that’s all we need to be reassured” that CT perfusion imaging also works for patient selection, commented Jeffrey L. Saver, MD, professor of medicine and director of the Comprehensive Stroke Center at the University of California, Los Angeles.
CT perfusion imaging and automated image processing “worked to select stroke patients” for an extended time window for treatment with mechanical thrombectomy in the DAWN (N Engl J Med. 2018 Jan 4;378[1]:11-21) and DEFUSE 3 (N Engl J Med. 2018 Feb 22;378[8]:308-18) trials, a history that makes the new finding of successfully using CT imaging to select patients who qualify for extended use of thrombolysis “a convincing result,” Dr. Saver said in an interview. The new EXTEND findings “will have a major impact” on using an extended time window for thrombolysis in U.S. practice, he predicted.
The EXTEND trial (Int J Stroke. 2012 Jan 1;7[1]:74-80) ran at 22 sites in Australia, 11 sites in Taiwan, and 1 center in New Zealand. Recruitment of patients into the study stopped early, after enrolling 225 patients, in June 2018, when results from WAKE-UP came out.
The EXTEND investigators enrolled patients who were either 4.5-9 hours out from the onset of their stroke or patients with a wake-up stroke with an uncertain onset. Participating centers could use either CT perfusion or MRI to identify candidates for treatment, and all used the RAPID software for image processing to identify patients with a perfusion lesion of at least 10 mL and an ischemic core volume no greater than 70 mL. Dr. Ma did not report what percentage of patients underwent imaging with each of these methods, but hinted that clinicians had used CT for a majority of the cases. The study randomized patients to receive either 0.9 mg/kg tPA or placebo, and by the trial protocol none of the enrolled patients received treatment with mechanical thrombectomy.
The trial’s primary endpoint was the percentage of patients with a modified Rankin Scale score of 0 or 1 at 90 days after their stroke, which was achieved by 44% more patients in the tPA group relative to the placebo arm after adjustment for age and baseline stroke severity, a statistically significant difference. The results were also positive for several secondary endpoints, such as recanalization 24 hours after treatment, which occurred in 67% of patients treated with tPA and 37% of the control patients, a statistically significant 68% relative improvement with thrombolysis.
Mortality at 90 days was similar in the two arms – 9% among the placebo patients and 12% among those who received tPA. The rate of symptomatic intracranial hemorrhage 36 hours after treatment was significantly higher among patients treated with tPA at 6%, compared with 1% in the placebo group, but the magnitude of this adverse effect was consistent with rates of intracranial hemorrhages previously reported in other studies of thrombolytic treatment for acute ischemic stroke, Dr. Ma said. The small number of increased intracranial hemorrhages “was not associated with increased mortality, and did not negate the positive result of an improved rate of excellent functional outcomes.”
These findings will likely spur further adoption of imaging processing software of the type used in EXTEND by U.S. stroke centers, Dr. Saver predicted.
“More and more centers have been getting this [software], and now they have two reasons to have it: to identify patients for an extended window for mechanical thrombectomy and to identify patients for an extended window for thrombolysis. It is a compelling case to have the imaging software as widely disseminated as possible. Centers that want to do the best for patients should have this imaging-processing software,” Dr. Saver said.
Dr. Ma and Dr. Shuaib reported no disclosures. Dr. Saver has received research funding and personal fees from Medtronic-Abbott and Neuravia.
SOURCE: Ma H et al. Int J. Stroke. 2018 Oct;13(2S):235, Abstract 1014.
Ever since results from the WAKE-UP trial came out earlier in 2018, we at the University of Cincinnati have been imaging acute ischemic stroke patients who presented outside the standard 4.5-hour time limit for thrombolysis with MRI to see if they qualify for an extended window for thrombolysis. But this has been a cumbersome and redundant process because our default imaging method is CT, so we have been imaging potential candidates for an extended thrombolytic window twice, first with CT and then later with MRI.
The EXTEND findings also provide a further reason for U.S. stroke centers to purchase and use some type of imaging processing software if they don’t already have it, either the RAPID software that was used in EXTEND or one of the several similar software packages that are now available. Several primary stroke centers in my area still do not currently use this software, although its use has been quickly spreading and it will now be increasingly hard for these centers to hold off acquiring it. Fortunately the increased competition among software vendors who sell this type of software has meant that the price has been dropping.
Pooja Khatri, MD , is a professor of neurology and director of acute stroke at the University of Cincinnati. She has been a consultant to Biogen, Greenwich, and PTC Therapeutics. She made these comments in an interview.
MONTREAL – An extended time window for thrombolytic treatment of acute ischemic stroke patients using tissue plasminogen activator out to 9 hours from stroke onset was safe and effective using CT perfusion imaging and automated imaging processing software to select suitable patients in the EXTEND trial. This result matches the groundbreaking finding reported earlier in 2018 that used MRI to select patients for extended thrombolysis.
“To reproduce our results you need to set up CT perfusion” as well as the RAPID software for automated image processing to identify patients with a small infarct core and a large area of salvageable brain, said Henry Ma, MD, a stroke neurologist at Monash University, Melbourne, as he reported results from the trial at the World Stroke Congress. “EXTEND is the first positive thrombolysis trial in an extended time window using automated penumbral imaging.”
The new finding, from a trial with 225 randomized stroke patients, was especially notable because, by showing the validity of CT imaging for patient selection, it makes applying the extended time window for thrombolytic therapy more feasible for U.S. and Canadian stroke centers where CT imaging is much more common than MRI. A report from European investigators published in August 2018 from the WAKE-UP trial showed that thrombolysis with tissue plasminogen activator (tPA) was safe and effective when administered to patients who woke up with an acute ischemic stroke that had occurred more than 4.5 hours before treatment, but this study exclusively used MRI for patient selection (N Engl J Med. 2018 Aug 16;379[7]:611-22).
“In North America, our systems are more equipped for using CT,” commented Ashfaq Shuaib, MD, a professor of medicine and neurologist at the University of Alberta, Edmonton. Based on the WAKE-UP results, “MR would be preferred, but what we’ve been doing [since the WAKE-UP report] is if we see a CT scan that’s good we go ahead” with thrombolysis.
“Biologically, it doesn’t matter whether you use MR or CT; they both index the same underlying pathology. We’ve been hesitant to go beyond the MR finding from WAKE-UP, where there were data, but the findings from EXTEND were right in line with the WAKE-UP results, and that’s all we need to be reassured” that CT perfusion imaging also works for patient selection, commented Jeffrey L. Saver, MD, professor of medicine and director of the Comprehensive Stroke Center at the University of California, Los Angeles.
CT perfusion imaging and automated image processing “worked to select stroke patients” for an extended time window for treatment with mechanical thrombectomy in the DAWN (N Engl J Med. 2018 Jan 4;378[1]:11-21) and DEFUSE 3 (N Engl J Med. 2018 Feb 22;378[8]:308-18) trials, a history that makes the new finding of successfully using CT imaging to select patients who qualify for extended use of thrombolysis “a convincing result,” Dr. Saver said in an interview. The new EXTEND findings “will have a major impact” on using an extended time window for thrombolysis in U.S. practice, he predicted.
The EXTEND trial (Int J Stroke. 2012 Jan 1;7[1]:74-80) ran at 22 sites in Australia, 11 sites in Taiwan, and 1 center in New Zealand. Recruitment of patients into the study stopped early, after enrolling 225 patients, in June 2018, when results from WAKE-UP came out.
The EXTEND investigators enrolled patients who were either 4.5-9 hours out from the onset of their stroke or patients with a wake-up stroke with an uncertain onset. Participating centers could use either CT perfusion or MRI to identify candidates for treatment, and all used the RAPID software for image processing to identify patients with a perfusion lesion of at least 10 mL and an ischemic core volume no greater than 70 mL. Dr. Ma did not report what percentage of patients underwent imaging with each of these methods, but hinted that clinicians had used CT for a majority of the cases. The study randomized patients to receive either 0.9 mg/kg tPA or placebo, and by the trial protocol none of the enrolled patients received treatment with mechanical thrombectomy.
The trial’s primary endpoint was the percentage of patients with a modified Rankin Scale score of 0 or 1 at 90 days after their stroke, which was achieved by 44% more patients in the tPA group relative to the placebo arm after adjustment for age and baseline stroke severity, a statistically significant difference. The results were also positive for several secondary endpoints, such as recanalization 24 hours after treatment, which occurred in 67% of patients treated with tPA and 37% of the control patients, a statistically significant 68% relative improvement with thrombolysis.
Mortality at 90 days was similar in the two arms – 9% among the placebo patients and 12% among those who received tPA. The rate of symptomatic intracranial hemorrhage 36 hours after treatment was significantly higher among patients treated with tPA at 6%, compared with 1% in the placebo group, but the magnitude of this adverse effect was consistent with rates of intracranial hemorrhages previously reported in other studies of thrombolytic treatment for acute ischemic stroke, Dr. Ma said. The small number of increased intracranial hemorrhages “was not associated with increased mortality, and did not negate the positive result of an improved rate of excellent functional outcomes.”
These findings will likely spur further adoption of imaging processing software of the type used in EXTEND by U.S. stroke centers, Dr. Saver predicted.
“More and more centers have been getting this [software], and now they have two reasons to have it: to identify patients for an extended window for mechanical thrombectomy and to identify patients for an extended window for thrombolysis. It is a compelling case to have the imaging software as widely disseminated as possible. Centers that want to do the best for patients should have this imaging-processing software,” Dr. Saver said.
Dr. Ma and Dr. Shuaib reported no disclosures. Dr. Saver has received research funding and personal fees from Medtronic-Abbott and Neuravia.
SOURCE: Ma H et al. Int J. Stroke. 2018 Oct;13(2S):235, Abstract 1014.
REPORTING FROM THE WORLD STROKE CONGRESS
Key clinical point:
Major finding: Patients who received thrombolysis 4.5-9 hours after stroke onset had a 44% increased rate of good outcomes, compared with controls.
Study details: EXTEND, a multicenter, controlled trial with 225 patients.
Disclosures: Dr. Ma and Dr. Shuaib had no disclosures. Dr. Saver has received research funding and personal fees from Medtronic-Abbott and Neuravia.
Source: Ma H et al. Int J. Stroke. 2018 Oct;13(2S):235, Abstract 1014.
Maintaining virologic response predicted long-term survival in HBV patients with decompensated cirrhosis
according to the results of a multicenter observational study published in the December issue of Clinical Gastroenterology and Hepatology.

Survival times were “excellent” if patients survived the first 6 months of antiviral therapy and did not develop hepatocellular carcinoma, said Jeong Won Jang, MD, of the Catholic University of Korea College of Medicine in Seoul, South Korea, and his associates. Patients who developed hepatocellular carcinoma had persistent declines in survival over time, they said. Predictors of short-term mortality included a baseline Model for End-Stage Liver Disease score above 20 and multiple complications.
Chronic hepatitis B virus (HBV) infection is the most common cause of liver-related disease and death in Asia, and complications such as decompensated cirrhosis affect up to 40% of chronically infected persons. Five-year survival rates are as low as 14% if patients develop decompensated cirrhosis.
To explore whether virologic suppression with oral nucleoside or nucleotide analog therapy improves outcomes in these decompensated patients, the researchers studied 295 such individuals from the Epidemiology and Natural History of Liver Cirrhosis in Korea Study. At baseline, these patients did not have documented chronic hepatitis C virus infection, hepatocellular carcinoma, other cancers, autoimmune hepatitis, or alcohol use disorders. All patients initiated entecavir or lamivudine therapy immediately after their cirrhosis became decompensated. The primary outcome was transplant-free survival.
A total of 60.1% of patients survived 5 years and 45.7% survived 10 years without undergoing transplantation, for a median transplant-free survival time of 7.7 years. The 116 patients (39%) who consistently had undetectable HBV DNA levels (less than 20 IU/mL) throughout treatment had significantly longer transplant-free survival than did patients who did not maintain a virologic response (P less than .001). In addition, a maintained virologic response (MVR) was the strongest predictor of long-term transplant-free survival, the researchers said.
A significantly greater proportion of patients who received entecavir survived 10 years compared with patients who received lamivudine. However, there was no significant difference in long-term survival among patients with MVRs to either drug. “Importantly, it appears that improvement in patient survival is attained by antiviral response, not by the type of nucleos(t)ide analogue per se,” the researchers wrote.
Patients who achieved MVR also showed significant improvements in hepatic function, but “the preventive effects of MVR on the incidence of hepatocellular carcinoma appeared only modest,” the investigators said. “Survival of patients without hepatocellular carcinoma who survived the first 6 months after initiation of antiviral therapy was excellent, with only a 25.3% mortality rate occurring between 6 months and 10 years.”
Based on their findings, Dr. Jang and his associates recommended aiming for an HBV DNA load less than 20 IU/mL in patients with decompensated cirrhosis to significantly improve the chances of long-term survival. Survival curves were similar regardless of whether patients had HBV DNA levels less than 10 IU/mL or between and 10 and 20 IU/mL, they noted.
Funders included Korea Healthcare Technology R&D Project and the Catholic Research Coordinating Center of the Korea Health 21 R&D Project, both of the Ministry of Health and Welfare, Republic of Korea. Dr. Jang disclosed ties to Bristol-Myers Squibb, Gilead, and Merck Sharp & Dohme. Three coinvestigators also disclosed ties to Gilead, MSD, and several other pharmaceutical companies.
SOURCE: Jang JW et al. Clin Gastroenterol Hepatol. 2018 May 18. doi: 10.1016/j.cgh.2018.04.063
according to the results of a multicenter observational study published in the December issue of Clinical Gastroenterology and Hepatology.
Survival times were “excellent” if patients survived the first 6 months of antiviral therapy and did not develop hepatocellular carcinoma, said Jeong Won Jang, MD, of the Catholic University of Korea College of Medicine in Seoul, South Korea, and his associates. Patients who developed hepatocellular carcinoma had persistent declines in survival over time, they said. Predictors of short-term mortality included a baseline Model for End-Stage Liver Disease score above 20 and multiple complications.
Chronic hepatitis B virus (HBV) infection is the most common cause of liver-related disease and death in Asia, and complications such as decompensated cirrhosis affect up to 40% of chronically infected persons. Five-year survival rates are as low as 14% if patients develop decompensated cirrhosis.
To explore whether virologic suppression with oral nucleoside or nucleotide analog therapy improves outcomes in these decompensated patients, the researchers studied 295 such individuals from the Epidemiology and Natural History of Liver Cirrhosis in Korea Study. At baseline, these patients did not have documented chronic hepatitis C virus infection, hepatocellular carcinoma, other cancers, autoimmune hepatitis, or alcohol use disorders. All patients initiated entecavir or lamivudine therapy immediately after their cirrhosis became decompensated. The primary outcome was transplant-free survival.
A total of 60.1% of patients survived 5 years and 45.7% survived 10 years without undergoing transplantation, for a median transplant-free survival time of 7.7 years. The 116 patients (39%) who consistently had undetectable HBV DNA levels (less than 20 IU/mL) throughout treatment had significantly longer transplant-free survival than did patients who did not maintain a virologic response (P less than .001). In addition, a maintained virologic response (MVR) was the strongest predictor of long-term transplant-free survival, the researchers said.
A significantly greater proportion of patients who received entecavir survived 10 years compared with patients who received lamivudine. However, there was no significant difference in long-term survival among patients with MVRs to either drug. “Importantly, it appears that improvement in patient survival is attained by antiviral response, not by the type of nucleos(t)ide analogue per se,” the researchers wrote.
Patients who achieved MVR also showed significant improvements in hepatic function, but “the preventive effects of MVR on the incidence of hepatocellular carcinoma appeared only modest,” the investigators said. “Survival of patients without hepatocellular carcinoma who survived the first 6 months after initiation of antiviral therapy was excellent, with only a 25.3% mortality rate occurring between 6 months and 10 years.”
Based on their findings, Dr. Jang and his associates recommended aiming for an HBV DNA load less than 20 IU/mL in patients with decompensated cirrhosis to significantly improve the chances of long-term survival. Survival curves were similar regardless of whether patients had HBV DNA levels less than 10 IU/mL or between and 10 and 20 IU/mL, they noted.
Funders included Korea Healthcare Technology R&D Project and the Catholic Research Coordinating Center of the Korea Health 21 R&D Project, both of the Ministry of Health and Welfare, Republic of Korea. Dr. Jang disclosed ties to Bristol-Myers Squibb, Gilead, and Merck Sharp & Dohme. Three coinvestigators also disclosed ties to Gilead, MSD, and several other pharmaceutical companies.
SOURCE: Jang JW et al. Clin Gastroenterol Hepatol. 2018 May 18. doi: 10.1016/j.cgh.2018.04.063
FROM CLINICAL GASTROENTEROLOGY AND HEPATOLOGY
Key clinical point: For patients with decompensated cirrhosis, long-term hepatitis B virus suppression was associated with significantly improved transplant-free survival.
Major finding: Lack of virologic response was associated with a more than twofold increase in hazard of long-term mortality in the multivariate analysis (HR, 2.30; 95% confidence interval, 1.60-3.29; P less than .001).
Study details: Ten-year multicenter observational study of 295 patients who began entecavir or lamivudine therapy immediately after their cirrhosis became decompensated.
Disclosures: Funders included Korea Healthcare Technology R&D Project and the Catholic Research Coordinating Center of the Korea Health 21 R&D Project, both of the Ministry of Health and Welfare, Republic of Korea. Dr. Jang disclosed ties to Bristol-Myers Squibb, Gilead, and Merck Sharp & Dohme. Three coinvestigators also disclosed ties to Gilead, MSD, and several other pharmaceutical companies.
Source: Jang JW et al. Clin Gastroenterol Hepatol. 2018 May 18. doi: 10.1016/j.cgh.2018.04.063
November 2018 Question 1
Rationale
This patient’s symptoms are most concerning for Whipple’s disease in light of the diarrhea, weight loss, arthralgias, and CNS symptoms. This diagnosis requires identification of periodic acid-Schiff staining macrophages in the duodenal lamina propria. Further PCR analysis can also be used to identify RNA of the causative pathogen, Tropheryma whipplei. Congo Red staining is indicated if amyloidosis is suspected. Sudan staining is used to test stool for fat. Birefringence is used to detect crystals, most typically in synovial fluid. Immunohistochemistry has many applications and is commonly employed to evaluate for Helicobacter pylori.
Reference
1. Moos V., Schneider T. Changing paradigms in Whipple’s disease and infection with Tropheryma whipplei. Eur J Clin Microbiol Infect Dis. 2011;30(10):1151-8.
A 52-year-old man is referred because of diarrhea, with up to 6 loose bowel movements per day for the past 7 months. His stool has been nonbloody. He denies rashes or eye problems, but he has had significant arthralgias. He has lost 15 pounds and also reports having newly developed headaches over this time. A colonoscopy performed 1 year ago for routine screening was unremarkable. Celiac serologies checked last month were negative. Stool cultures, ova and parasite evaluation, and Clostridium difficile toxin assay were all negative.
An upper endoscopy reveals grossly unremarkable mucosa throughout and duodenal biopsies are performed.
Quality programs drive improvements in colorectal surgery outcomes
BOSTON – Rates of (ACS NSQIP), a recent analysis shows.

Reoperation rates have also decreased, while early-discharge rates have steadily increased, according to results of the analysis, presented at the annual clinical congress of the American College of Surgeons.
The findings underline the value of such ACS-led initiatives in improving patient care and surgical quality, said Ahmed M. Al-Mazrou, MD, a general surgery resident at New York-Presbyterian Hospital/Weill Cornell Medical Center in New York.
“Over its first decade of introduction, ACS NSQIP was associated with improved outcomes after colorectal surgery, and also introduction of colectomy-targeted data was also associated with improved outcomes,” Dr. Al-Mazrou said in his presentation describing the results.
Prior to this study, the question of whether the introduction of ACS NSQIP has improved outcomes over time had not been well characterized, according to Dr. Al-Mazrou and his colleagues.
To evaluate the impact, the investigators looked at more than 310,000 nonemergency colorectal resections in ACS NSQIP, of which about 58% were done after the introduction of colectomy-targeted variables in 2013.
They found that, over time, incidence of most complications fell, including surgical site infections, urinary tract infections, sepsis and septic shock, and venous thromboembolism, while rates of early discharge increased.
For example, surgical site infections decreased from 13.7% to 4.7% over the 10-year period, while the number of patients discharged within 5 days or fewer increased from about 8% to 47%.
Introduction of colectomy-targeted data was associated with fewer surgical site infections (odds ratio, 0.78; 95% confidence interval, 0.77-0.80), multivariable analysis showed. Likewise, there were lower rates of systemic infections (OR, 0.94; 95% CI, 0.91-0.98) and urinary tract infections (OR, 0.70; 95% CI, 0.67-0.74) after introduction of the data.
Rates of reoperation also decreased (OR, 0.88; 95% CI, 0.85-0.91) while early-discharge rates increased (OR, 1.60; 95% CI, 1.57-1.63) after colectomy data was introduced, the multivariable analysis further showed.
Principal investigator P. Ravi Kiran, MD, FACS, professor of surgery at Columbia University and chief of the medical center’s division of colorectal surgery, said the improved outcomes were attributable to a few different factors.
First, the NSQIP national data allows participants to benchmark with peer hospitals and find areas for improvement, Dr. Kiran said in an ACS press release.
That benchmarking encourages participating centers to follow evidence-based recommendations, including ACS guidelines for preventing surgical site infections, he added.
The introduction of procedure-targeted datasets in NSQIP was done in response to user requests for more clinically detailed information, according to Clifford Y. Ko, MD, FACS, director of the ACS division of research and optimal patient care.
While the NSQIP data are important in improving surgical outcomes, credit also goes to the organizations that are leading the quality improvement efforts by effectively using the data, Dr. Ko said in the press release.
Dr. Ko was not involved in the study. Dr. Al-Mazrou and Dr. Kiran reported no disclosures relevant to the study.
SOURCE: Al-Mazrou AM et al. ACS Clinical Congress. Abstract SF330.
BOSTON – Rates of (ACS NSQIP), a recent analysis shows.
Reoperation rates have also decreased, while early-discharge rates have steadily increased, according to results of the analysis, presented at the annual clinical congress of the American College of Surgeons.
The findings underline the value of such ACS-led initiatives in improving patient care and surgical quality, said Ahmed M. Al-Mazrou, MD, a general surgery resident at New York-Presbyterian Hospital/Weill Cornell Medical Center in New York.
“Over its first decade of introduction, ACS NSQIP was associated with improved outcomes after colorectal surgery, and also introduction of colectomy-targeted data was also associated with improved outcomes,” Dr. Al-Mazrou said in his presentation describing the results.
Prior to this study, the question of whether the introduction of ACS NSQIP has improved outcomes over time had not been well characterized, according to Dr. Al-Mazrou and his colleagues.
To evaluate the impact, the investigators looked at more than 310,000 nonemergency colorectal resections in ACS NSQIP, of which about 58% were done after the introduction of colectomy-targeted variables in 2013.
They found that, over time, incidence of most complications fell, including surgical site infections, urinary tract infections, sepsis and septic shock, and venous thromboembolism, while rates of early discharge increased.
For example, surgical site infections decreased from 13.7% to 4.7% over the 10-year period, while the number of patients discharged within 5 days or fewer increased from about 8% to 47%.
Introduction of colectomy-targeted data was associated with fewer surgical site infections (odds ratio, 0.78; 95% confidence interval, 0.77-0.80), multivariable analysis showed. Likewise, there were lower rates of systemic infections (OR, 0.94; 95% CI, 0.91-0.98) and urinary tract infections (OR, 0.70; 95% CI, 0.67-0.74) after introduction of the data.
Rates of reoperation also decreased (OR, 0.88; 95% CI, 0.85-0.91) while early-discharge rates increased (OR, 1.60; 95% CI, 1.57-1.63) after colectomy data was introduced, the multivariable analysis further showed.
Principal investigator P. Ravi Kiran, MD, FACS, professor of surgery at Columbia University and chief of the medical center’s division of colorectal surgery, said the improved outcomes were attributable to a few different factors.
First, the NSQIP national data allows participants to benchmark with peer hospitals and find areas for improvement, Dr. Kiran said in an ACS press release.
That benchmarking encourages participating centers to follow evidence-based recommendations, including ACS guidelines for preventing surgical site infections, he added.
The introduction of procedure-targeted datasets in NSQIP was done in response to user requests for more clinically detailed information, according to Clifford Y. Ko, MD, FACS, director of the ACS division of research and optimal patient care.
While the NSQIP data are important in improving surgical outcomes, credit also goes to the organizations that are leading the quality improvement efforts by effectively using the data, Dr. Ko said in the press release.
Dr. Ko was not involved in the study. Dr. Al-Mazrou and Dr. Kiran reported no disclosures relevant to the study.
SOURCE: Al-Mazrou AM et al. ACS Clinical Congress. Abstract SF330.
REPORTING FROM THE ACS CLINICAL CONGRESS
Key clinical point: Rates of colorectal procedure complications have steadily decreased since the introduction of the American College of Surgeons National Surgical Quality Improvement Program.
Major finding: Surgical site infections decreased from 13.7% to 4.7% over the 10-year period, while the number of patients discharged within 5 days or fewer increased from about 8% to 47%.
Study details: Retrospective review of more than 310,000 nonemergency colorectal resections in ACS NSQIP from 2007 to 2016.
Disclosures: Study authors reported no conflicts of interest.
Source: Al-Mazrou AM et al. ACS Clinical Congress, Abstract SF330.
Management of Lewy body dementia remains complex
ATLANTA – In the not-so-distant past, neurologists viewed dementia with Lewy bodies as a disorder primarily of the brain, but it turned out to be far more complex than that.

At the annual meeting of the American Neurological Association, Bradley F. Boeve, MD, described dementia with Lewy bodies (DLB) as a systemic neurologic disorder affecting the brain, including brain stem, spinal cord, and peripheral nervous system, especially the autonomic nervous system. “This leads to the complex array of clinical manifestations, which are quite different from patient to patient cross-sectionally and longitudinally,” said Dr. Boeve, the Little Family Foundation Professor of Lewy Body Dementia in the department of neurology at the Mayo Clinic, Rochester, Minn.
, he said. The four core clinical features are Parkinsonism unrelated to medications; recurrent, fully-formed visual hallucinations; fluctuations in cognition and/or arousal; and rapid eye movement (REM) sleep behavior disorder. “This is the most predictive of all four features,” Dr. Boeve said. He described REM sleep behavior disorder as a parasomnia manifested by the tendency to repeatedly “act out one’s dreams.” The dreams tend to contain a chasing/attacking theme, and behaviors mirror dream content. Injuries to the patient and bed partner can occur.
Typically, patients will present with REM sleep behavior disorder in their 50s and 60s, and sometimes in their 30s and 40s, “decades before cognitive changes begin,” he said. “This is usually followed by Parkinsonism and visual hallucinations. That’s the prototypical DLB [case], but there are many examples where this is not followed. Prominent neuropsychiatric features can also begin before any cognitive changes.”
Neuropsychological features of DLB often include impairment of executive functions and visuospatial functions. “Early in the course of Alzheimer’s disease, typically performance on memory measures – especially delayed recall – are down and the other measures are borderline or mildly impaired,” Dr. Boeve noted. “By contrast, in DLB, attention, executive function, and visuospatial measures are down, but memory is often pretty good. What’s remarkable is that in the office setting, when you take a history the person often says, ‘I’m very forgetful,’ yet in the testing environment people tend to rise to the occasion pretty well.”
Imaging isn’t always helpful in establishing a diagnosis of DLB. MRI scans, for example, “can look pretty normal, including the hippocampi,” he said. “This is really the norm in DLB and it seems to be a disconnect. The person can have significant symptoms yet their MRI scan can be pretty normal.”
In Alzheimer’s disease, 18F-fluorodeoxyglucose-PET (FDG-PET) shows temporal, parietal, and frontal hypometabolism, sparing of the sensory-motor strip and sparing of the primary occipital cortex, while in DLB, FDG-PET shows marked deficits in the occipital regions with relative sparing of the frontal and temporal lobes. Another key neuroimaging sign of DLB is the posterior cingulate island sign, which is characterized by sparing of the posterior cingulate cortex relative to the precuneus plus cuneus on FDG-PET.
In 2017, the Dementia with Lewy Bodies Consortium published updated recommendations on the diagnosis and management of the disease (Neurology. 2017;89[1]:88-100). In its consensus report, the consortium defines probable DLB as dementia plus two or more clinical features or one core clinical feature plus one or more indicative biomarker. These biomarkers include reduced dopamine transport uptake in basal ganglia by SPECT or PET; abnormal (low uptake) meta-iodobenzylguanidine (MIBG) myocardial scintigraphy, and/or polysomnographic confirmation of REM sleep without atonia.
“Neuropathologically, limbic with or without neocortical Lewy bodies and Lewy neurites are the defining characteristics of pathologically-proven DLB,” added Dr. Boeve, a member of the DLB consortium. “The classic DLB phenotype can occur in limbic-predominant DLB. Lewy bodies in the neocortex are not necessary to cause a dementia syndrome.”
He characterized management of DLB as “very complicated. Consider symptoms as they relate to cognitive impairment, neuropsychiatric features, motor features, sleep disorders, and autonomic dysfunction.” He often asks the patient/family to prioritize the three most troublesome issues they seek to change, and develops a plan based on their input.
There is no Food and Drug Administration–approved medication for DLB, but the standard of care is an acetylcholinesterase inhibitor such as donepezil. “There is evidence that memantine can provide a modest benefit,” Dr. Boeve said. “Hypersomnia is quite prominent in DLB and worthy of assessing and treating.” Clinicians must weigh the pros and cons of pharmacotherapy with each patient. “For example, in the atypical neuroleptic class [of drugs], there may be a benefit to the hallucinations and delusions in DLB but hypersomnia can worsen,” he said. “Selecting agents is challenging but worth the effort.”
Survival is lower and more rapid with DLB, compared with Alzheimer’s. Most people pass away from primary DLB-related features or failure to thrive. The second most common is pneumonia or aspiration. Median survival was 4 years after diagnosis in one study, and end-of life discussions occurred in less than half of all patients. “This is a frustrating reminder that we as clinicians are not very good at discussing important topics such as end-of-life care with patients and their families,” Dr. Boeve said. Resources that he recommends for education and support include the Lewy Body Dementia Association and The Lewy Body Society.
At the 2016 Alzheimer’s Disease-Related Dementias Summit, clinicians formed a list of DLB research priorities (Neurology 2017;89[23]:2381-91). Among them were recommendations to “initiate clinical trials in diverse populations using therapies that address symptoms that have the greatest effect on patient function and caregiver burden” and “identify novel common and rare genetic variants, epigenetic changes, and environmental influences that affect the risk for and clinical features of” the disease.
Meanwhile, several research protocols are under way, including the development of a DLB module by the U.S. Alzheimer’s Research Disease Centers and a number of DLB-focused projects from the National Institute of Neurological Disorders and Stroke (NINDS) Parkinson’s Disease Biomarkers Program. In addition, the Lewy Body Dementia Association Research Centers of Excellence program is focused on optimizing clinical care and setting up the infrastructure for clinical trials, while the North American Prodromal Synucleinopathy Consortium is conducting longitudinal studies in those with REM sleep behavior disorder.
Dr. Boeve disclosed that he has been an investigator for clinical trials sponsored by GE Healthcare, Axovant, and Biogen. He is a member of the scientific advisory board for the Tau Consortium and has received research support from the National Institute on Aging, the NINDS, the Mangurian Foundation, and the Little Family Foundation.
ATLANTA – In the not-so-distant past, neurologists viewed dementia with Lewy bodies as a disorder primarily of the brain, but it turned out to be far more complex than that.
At the annual meeting of the American Neurological Association, Bradley F. Boeve, MD, described dementia with Lewy bodies (DLB) as a systemic neurologic disorder affecting the brain, including brain stem, spinal cord, and peripheral nervous system, especially the autonomic nervous system. “This leads to the complex array of clinical manifestations, which are quite different from patient to patient cross-sectionally and longitudinally,” said Dr. Boeve, the Little Family Foundation Professor of Lewy Body Dementia in the department of neurology at the Mayo Clinic, Rochester, Minn.
, he said. The four core clinical features are Parkinsonism unrelated to medications; recurrent, fully-formed visual hallucinations; fluctuations in cognition and/or arousal; and rapid eye movement (REM) sleep behavior disorder. “This is the most predictive of all four features,” Dr. Boeve said. He described REM sleep behavior disorder as a parasomnia manifested by the tendency to repeatedly “act out one’s dreams.” The dreams tend to contain a chasing/attacking theme, and behaviors mirror dream content. Injuries to the patient and bed partner can occur.
Typically, patients will present with REM sleep behavior disorder in their 50s and 60s, and sometimes in their 30s and 40s, “decades before cognitive changes begin,” he said. “This is usually followed by Parkinsonism and visual hallucinations. That’s the prototypical DLB [case], but there are many examples where this is not followed. Prominent neuropsychiatric features can also begin before any cognitive changes.”
Neuropsychological features of DLB often include impairment of executive functions and visuospatial functions. “Early in the course of Alzheimer’s disease, typically performance on memory measures – especially delayed recall – are down and the other measures are borderline or mildly impaired,” Dr. Boeve noted. “By contrast, in DLB, attention, executive function, and visuospatial measures are down, but memory is often pretty good. What’s remarkable is that in the office setting, when you take a history the person often says, ‘I’m very forgetful,’ yet in the testing environment people tend to rise to the occasion pretty well.”
Imaging isn’t always helpful in establishing a diagnosis of DLB. MRI scans, for example, “can look pretty normal, including the hippocampi,” he said. “This is really the norm in DLB and it seems to be a disconnect. The person can have significant symptoms yet their MRI scan can be pretty normal.”
In Alzheimer’s disease, 18F-fluorodeoxyglucose-PET (FDG-PET) shows temporal, parietal, and frontal hypometabolism, sparing of the sensory-motor strip and sparing of the primary occipital cortex, while in DLB, FDG-PET shows marked deficits in the occipital regions with relative sparing of the frontal and temporal lobes. Another key neuroimaging sign of DLB is the posterior cingulate island sign, which is characterized by sparing of the posterior cingulate cortex relative to the precuneus plus cuneus on FDG-PET.
In 2017, the Dementia with Lewy Bodies Consortium published updated recommendations on the diagnosis and management of the disease (Neurology. 2017;89[1]:88-100). In its consensus report, the consortium defines probable DLB as dementia plus two or more clinical features or one core clinical feature plus one or more indicative biomarker. These biomarkers include reduced dopamine transport uptake in basal ganglia by SPECT or PET; abnormal (low uptake) meta-iodobenzylguanidine (MIBG) myocardial scintigraphy, and/or polysomnographic confirmation of REM sleep without atonia.
“Neuropathologically, limbic with or without neocortical Lewy bodies and Lewy neurites are the defining characteristics of pathologically-proven DLB,” added Dr. Boeve, a member of the DLB consortium. “The classic DLB phenotype can occur in limbic-predominant DLB. Lewy bodies in the neocortex are not necessary to cause a dementia syndrome.”
He characterized management of DLB as “very complicated. Consider symptoms as they relate to cognitive impairment, neuropsychiatric features, motor features, sleep disorders, and autonomic dysfunction.” He often asks the patient/family to prioritize the three most troublesome issues they seek to change, and develops a plan based on their input.
There is no Food and Drug Administration–approved medication for DLB, but the standard of care is an acetylcholinesterase inhibitor such as donepezil. “There is evidence that memantine can provide a modest benefit,” Dr. Boeve said. “Hypersomnia is quite prominent in DLB and worthy of assessing and treating.” Clinicians must weigh the pros and cons of pharmacotherapy with each patient. “For example, in the atypical neuroleptic class [of drugs], there may be a benefit to the hallucinations and delusions in DLB but hypersomnia can worsen,” he said. “Selecting agents is challenging but worth the effort.”
Survival is lower and more rapid with DLB, compared with Alzheimer’s. Most people pass away from primary DLB-related features or failure to thrive. The second most common is pneumonia or aspiration. Median survival was 4 years after diagnosis in one study, and end-of life discussions occurred in less than half of all patients. “This is a frustrating reminder that we as clinicians are not very good at discussing important topics such as end-of-life care with patients and their families,” Dr. Boeve said. Resources that he recommends for education and support include the Lewy Body Dementia Association and The Lewy Body Society.
At the 2016 Alzheimer’s Disease-Related Dementias Summit, clinicians formed a list of DLB research priorities (Neurology 2017;89[23]:2381-91). Among them were recommendations to “initiate clinical trials in diverse populations using therapies that address symptoms that have the greatest effect on patient function and caregiver burden” and “identify novel common and rare genetic variants, epigenetic changes, and environmental influences that affect the risk for and clinical features of” the disease.
Meanwhile, several research protocols are under way, including the development of a DLB module by the U.S. Alzheimer’s Research Disease Centers and a number of DLB-focused projects from the National Institute of Neurological Disorders and Stroke (NINDS) Parkinson’s Disease Biomarkers Program. In addition, the Lewy Body Dementia Association Research Centers of Excellence program is focused on optimizing clinical care and setting up the infrastructure for clinical trials, while the North American Prodromal Synucleinopathy Consortium is conducting longitudinal studies in those with REM sleep behavior disorder.
Dr. Boeve disclosed that he has been an investigator for clinical trials sponsored by GE Healthcare, Axovant, and Biogen. He is a member of the scientific advisory board for the Tau Consortium and has received research support from the National Institute on Aging, the NINDS, the Mangurian Foundation, and the Little Family Foundation.
EXPERT ANALYSIS FROM ANA 2018
Norfloxacin might benefit patients with advanced cirrhosis and low ascites fluid protein levels
Six months of once-daily norfloxacin therapy did not reduce 6-month mortality among patients with Child-Pugh class C cirrhosis who had not recently received fluoroquinolone therapy.
Mortality based on the Kaplan-Meier method was 14.8% in the norfloxacin group versus 19.7% for patients receiving placebo (P = .21). “Norfloxacin, however, appear[ed] to increase survival of patients with low ascites fluid protein concentrations,” wrote Richard Moreau, MD, of Hôpital Beaujon, Paris, and his associates. The results of the multicenter, double-blind trial of 291 patients were published in the December issue of Gastroenterology.
Patients with advanced cirrhosis often develop spontaneous bacterial peritonitis and other severe bacterial infections, with potentially grave outcomes. These are often enteric gram-negative bacteria that cross the intestinal barrier, enter the systemic circulation, and travel to the site of infection.
Long-term fluoroquinolone therapy (typically with norfloxacin) might help prevent these bacterial infections, the translocation of bacterial products, systemic inflammation, and consequent end-organ dysfunction, such as acute kidney disease. However, long-term antibiotic therapy also raises the specter of multidrug resistance, which is especially concerning when it involves a crucial antibiotic class such as fluoroquinolones, the researchers noted. “[In] patients receiving prolonged fluoroquinolone therapy, the development of infections by multidrug resistant bacteria might obscure the beneficial effect of fluoroquinolones on survival,” they added.
Four previous blinded and placebo-controlled trials have investigated fluoroquinolone therapy and mortality patients with cirrhosis, but they were small, usually included mortality only as a secondary outcome, and yielded mixed results. Hence, the researchers enrolled 291 patients with advanced (Child-Pugh class C) cirrhosis from 18 clinical sites in France and randomly assigned them to receive either norfloxacin (400 mg once daily) or placebo for 6 months. Patients were evaluated monthly during treatment and then at 9 months and 12 months. The primary outcome was survival at 6 months.
In a post hoc analysis, the researchers examined cumulative death rates at 6 months after accounting for liver transplantation as a competing risk of death and including survival data for patients who developed spontaneous bacterial peritonitis. Taking this approach, the estimated cumulative rate of death at 6 months was 15.5% (95% confidence interval, 10.1-21.9) in the norfloxacin group and 24.8% (95% CI, 18.1-32.1) in the placebo group, for a hazard ratio of 0.59 (95% CI, 0.35-0.99). Among patients whose ascites fluid levels were less than 15 g/L, the hazard ratio for death at 6 months was 65% lower in the norfloxacin group than in the placebo group (HR, 0.35; 95% CI, 0.13-0.93). Norfloxacin showed no such benefit for patients with ascites fluid protein levels above 15 g/L.
Norfloxacin therapy “could reduce the incidence of death among patients with ascitic fluid protein concentrations of less than 15 g/L but not among those with ascitic fluid protein concentration of 15 g/L or more,” the researchers concluded. “Norfloxacin may prevent some infections, especially gram-negative bacterial infections, but not the development of [spontaneous bacterial peritonitis] and other noninfectious, liver-related complications.”
The study was funded by Programme Hospitalier de Recherche Clinique National 2008 of the French Ministry of Health. Dr. Moreau reported having no conflicts of interest. Two coinvestigators disclosed ties to Gore Norgine, Exalenz, and Conatus.
SOURCE: Moreau R et al. Gastroenterology. 2018 Aug 22. doi: 10.1053/j.gastro.2018.08.026.
Prolonged antimicrobial use in patients with decompensated cirrhosis is an area of unclear mortality benefit and may actually increase risk in some patients given antimicrobial resistance. This randomized double-blind, placebo-controlled trial by Moreau et al. evaluates the mortality associated with long-term fluoroquinolone therapy in patients without indications for primary or secondary prophylaxis. Although the study had limited statistical power to detect clear benefit, the authors found that 6-month mortality was not reduced in patients with Child-Pugh class C cirrhosis who received treatment with daily oral fluoroquinolone therapy for 6 months. Subgroup analysis of individuals with ascites fluid total protein levels lower than 15 g/L showed a survival benefit at 6 months.
Determining quantifiable risk for known factors associated with liver disease mortality is a pressing issue, especially in the pretransplant setting where infectious risk is compounded post transplant with changes in gut flora, addition of potent immunosuppressants, and increased metabolic demands. Biologic measurements that correlate with increased complications and mortality, like low protein ascites, are helpful in complex clinical settings.Studying patients with advanced and decompensated liver disease in a systematic, longitudinal manner with any pharmacologic intervention is a particular challenge given the unpredictable nature of decompensation events and variable outcomes from those events. However, attempts to quantify risk and benefit even in this unpredictable patient population is worthwhile to stratify patients for interventions and minimize risk of liver-related and overall mortality – as well as peritransplant complications and posttransplant survival.
Julia J. Wattacheril, MD, MPH, is a physician- scientist and director of the Nonalcoholic Fatty Liver Disease Program in the Center for Liver Disease and Transplantation at Columbia University Irving Medical Center–New York Presbyterian Hospital, New York; an assistant professor, department of medicine, division of digestive and liver diseases at the Columbia University Vagelos College of Physicians and Surgeons. She has no conflicts.
Six months of once-daily norfloxacin therapy did not reduce 6-month mortality among patients with Child-Pugh class C cirrhosis who had not recently received fluoroquinolone therapy.
Mortality based on the Kaplan-Meier method was 14.8% in the norfloxacin group versus 19.7% for patients receiving placebo (P = .21). “Norfloxacin, however, appear[ed] to increase survival of patients with low ascites fluid protein concentrations,” wrote Richard Moreau, MD, of Hôpital Beaujon, Paris, and his associates. The results of the multicenter, double-blind trial of 291 patients were published in the December issue of Gastroenterology.
Patients with advanced cirrhosis often develop spontaneous bacterial peritonitis and other severe bacterial infections, with potentially grave outcomes. These are often enteric gram-negative bacteria that cross the intestinal barrier, enter the systemic circulation, and travel to the site of infection.
Long-term fluoroquinolone therapy (typically with norfloxacin) might help prevent these bacterial infections, the translocation of bacterial products, systemic inflammation, and consequent end-organ dysfunction, such as acute kidney disease. However, long-term antibiotic therapy also raises the specter of multidrug resistance, which is especially concerning when it involves a crucial antibiotic class such as fluoroquinolones, the researchers noted. “[In] patients receiving prolonged fluoroquinolone therapy, the development of infections by multidrug resistant bacteria might obscure the beneficial effect of fluoroquinolones on survival,” they added.
Four previous blinded and placebo-controlled trials have investigated fluoroquinolone therapy and mortality patients with cirrhosis, but they were small, usually included mortality only as a secondary outcome, and yielded mixed results. Hence, the researchers enrolled 291 patients with advanced (Child-Pugh class C) cirrhosis from 18 clinical sites in France and randomly assigned them to receive either norfloxacin (400 mg once daily) or placebo for 6 months. Patients were evaluated monthly during treatment and then at 9 months and 12 months. The primary outcome was survival at 6 months.
In a post hoc analysis, the researchers examined cumulative death rates at 6 months after accounting for liver transplantation as a competing risk of death and including survival data for patients who developed spontaneous bacterial peritonitis. Taking this approach, the estimated cumulative rate of death at 6 months was 15.5% (95% confidence interval, 10.1-21.9) in the norfloxacin group and 24.8% (95% CI, 18.1-32.1) in the placebo group, for a hazard ratio of 0.59 (95% CI, 0.35-0.99). Among patients whose ascites fluid levels were less than 15 g/L, the hazard ratio for death at 6 months was 65% lower in the norfloxacin group than in the placebo group (HR, 0.35; 95% CI, 0.13-0.93). Norfloxacin showed no such benefit for patients with ascites fluid protein levels above 15 g/L.
Norfloxacin therapy “could reduce the incidence of death among patients with ascitic fluid protein concentrations of less than 15 g/L but not among those with ascitic fluid protein concentration of 15 g/L or more,” the researchers concluded. “Norfloxacin may prevent some infections, especially gram-negative bacterial infections, but not the development of [spontaneous bacterial peritonitis] and other noninfectious, liver-related complications.”
The study was funded by Programme Hospitalier de Recherche Clinique National 2008 of the French Ministry of Health. Dr. Moreau reported having no conflicts of interest. Two coinvestigators disclosed ties to Gore Norgine, Exalenz, and Conatus.
SOURCE: Moreau R et al. Gastroenterology. 2018 Aug 22. doi: 10.1053/j.gastro.2018.08.026.
FROM GASTROENTEROLOGY
Key clinical point: Six months of once-daily norfloxacin therapy did not reduce 6-month mortality among patients with Child-Pugh class C cirrhosis who had not recently received fluoroquinolone therapy, but norfloxacin did appear to benefit a subgroup of patients with low ascites fluid protein levels.
Major finding: Mortality based on the Kaplan-Meier method was 14.8% in the norfloxacin group versus 19.7% for patients receiving placebo (P = .21). Among patients whose ascites fluid levels were less than 15 g/L, the hazard ratio for death at 6 months was 65% lower in the norfloxacin group than in the placebo group (HR, 0.35; 95% CI, 0.13-0.93).
Study details: Multicenter double-blind trial of 291 patients with Child-Pugh class C cirrhosis who had not received recent fluoroquinolone therapy.
Disclosures: The study was funded by Programme Hospitalier de Recherche Clinique National 2008 of the French Ministry of Health. Dr. Moreau reported having no conflicts of interest. Two coinvestigators disclosed ties to Gore Norgine, Exalenz, and Conatus.
Source: Moreau R et al. Gastroenterology. 2018 Aug 22. doi: 10.1053/j.gastro.2018.08.026.
Ecstasy for PTSD, cockroach-tough C. diff, cardio-friendly queso
Rolling in ecstasy
Treating post-traumatic stress disorder could now be as simple as hitting the club. Not really, but in the longest and largest study of its kind, researchers looked at the effects of MDMA on patients with chronic PTSD.

After three sessions of taking MDMA (in a controlled environment, not in a warehouse in Brooklyn), 76% of study participants no longer met the criteria for PTSD. This is excellent news for those who suffer from PTSD – and the latest breakthrough in a significant shift toward accepting hallucinogenic drugs as possible treatments for mental health issues. Who knows, perhaps medicinal molly cards could soon be appearing.
And what next after that? Ketamine? Oh wait.
Infection is its own reward
Cockroaches are tough. Really tough. Survive compression forces of 300 times their body weight tough. Live without a head for a week tough. Laugh off a nuclear Armageddon tough. Can anything be tougher than that? Researchers at De Montfort University in Leicester, England, have a possible candidate, and it’s not Chuck Norris (Infect Control Hosp Epidemiol. 2018 Oct 16:1-6. doi: 10.1017/ice.2018.255).

They took cotton bed sheets contaminated with Clostridium difficile and put them “through a simulated washer extractor cycle using an industrial bleach detergent with sodium hypochlorite 15% and peracetic acid sour 14%.” Other contaminated sheets went to a commercial laundry service, “where they were washed in a washer extractor (infected linen wash) with industrial detergent, pressed, dried, and finished according to the current National Health Service in the United Kingdom’s health care laundry policy,” they said in a separate written statement. The result of all that effort? The average C. difficile spore load was reduced by 40%. In other words, most of the spores survived.
That not-so-comforting outcome does, however, leave us with a slightly comforting bit of conjecture: Those super tough cockroaches – the ones that survive the apocalypse that wipes out humans – will probably have diarrhea.
More cheese, please
The healing powers of cheese are now backed with science. A study from the University of Eastern Finland examined the incidence of coronary heart disease in men who ate a lot of fermented dairy (cheese, yogurt, kefir) and men who did not.

Researchers divided 2,000 men into four groups based on fermented dairy consumption and found that the men in the highest-consumption group had a 26% lower risk of incident coronary heart disease. Unfortunately for the “Got Milk?” ad campaign, researchers also discovered that men who consumed high levels of non-fermented dairy had a higher risk of coronary heart disease.
Next time your doctor asks about your cheese consumption, you can show them this study as proof that cheese helps the heart and the soul.
The new math, health care edition
You may think that 2 plus 2 always equals 4, but health care billing has taken another route. Here’s a seemingly simple equation, as reported by Kaiser Health News: One patient with a rash that got worse when she used her antifungal cream plus one allergy skin-patch test (okay, so it involved 119 allergens – we’ll give you that) at Stanford (Calif.) Health Care equals one bill … for $48,329.

The patient, Janet Winston of Eureka, Calif., said, “I was grateful I had such wonderful care at Stanford, but I was pretty outraged they could charge that. … No one cut into me. No one gave me anesthesia.” Her insurer paid its negotiated share of $11,376.47, and Ms. Winston’s 20% share of that came to $3,103.73, which she bargained down to $1,561.86.
For insurers, large health systems like Stanford may be too big to fight, suggested Harvard University health care economist Leemore Dafny, who told KHN that “everyone wants to point fingers at the providers, but … a lot of times [insurers] roll over and pay the rates.”
In the end, though, Stanford received less than $13,000 of its original charge, so maybe 2 plus 2 only equals 3. A tough pill to swallow, perhaps, but the whole situation has a kind of chilling Donnie-and-Marie quality to it: a little bit new math, and a little bit “1984.”
Rolling in ecstasy
Treating post-traumatic stress disorder could now be as simple as hitting the club. Not really, but in the longest and largest study of its kind, researchers looked at the effects of MDMA on patients with chronic PTSD.
After three sessions of taking MDMA (in a controlled environment, not in a warehouse in Brooklyn), 76% of study participants no longer met the criteria for PTSD. This is excellent news for those who suffer from PTSD – and the latest breakthrough in a significant shift toward accepting hallucinogenic drugs as possible treatments for mental health issues. Who knows, perhaps medicinal molly cards could soon be appearing.
And what next after that? Ketamine? Oh wait.
Infection is its own reward
Cockroaches are tough. Really tough. Survive compression forces of 300 times their body weight tough. Live without a head for a week tough. Laugh off a nuclear Armageddon tough. Can anything be tougher than that? Researchers at De Montfort University in Leicester, England, have a possible candidate, and it’s not Chuck Norris (Infect Control Hosp Epidemiol. 2018 Oct 16:1-6. doi: 10.1017/ice.2018.255).
They took cotton bed sheets contaminated with Clostridium difficile and put them “through a simulated washer extractor cycle using an industrial bleach detergent with sodium hypochlorite 15% and peracetic acid sour 14%.” Other contaminated sheets went to a commercial laundry service, “where they were washed in a washer extractor (infected linen wash) with industrial detergent, pressed, dried, and finished according to the current National Health Service in the United Kingdom’s health care laundry policy,” they said in a separate written statement. The result of all that effort? The average C. difficile spore load was reduced by 40%. In other words, most of the spores survived.
That not-so-comforting outcome does, however, leave us with a slightly comforting bit of conjecture: Those super tough cockroaches – the ones that survive the apocalypse that wipes out humans – will probably have diarrhea.
More cheese, please
The healing powers of cheese are now backed with science. A study from the University of Eastern Finland examined the incidence of coronary heart disease in men who ate a lot of fermented dairy (cheese, yogurt, kefir) and men who did not.
Researchers divided 2,000 men into four groups based on fermented dairy consumption and found that the men in the highest-consumption group had a 26% lower risk of incident coronary heart disease. Unfortunately for the “Got Milk?” ad campaign, researchers also discovered that men who consumed high levels of non-fermented dairy had a higher risk of coronary heart disease.
Next time your doctor asks about your cheese consumption, you can show them this study as proof that cheese helps the heart and the soul.
The new math, health care edition
You may think that 2 plus 2 always equals 4, but health care billing has taken another route. Here’s a seemingly simple equation, as reported by Kaiser Health News: One patient with a rash that got worse when she used her antifungal cream plus one allergy skin-patch test (okay, so it involved 119 allergens – we’ll give you that) at Stanford (Calif.) Health Care equals one bill … for $48,329.
The patient, Janet Winston of Eureka, Calif., said, “I was grateful I had such wonderful care at Stanford, but I was pretty outraged they could charge that. … No one cut into me. No one gave me anesthesia.” Her insurer paid its negotiated share of $11,376.47, and Ms. Winston’s 20% share of that came to $3,103.73, which she bargained down to $1,561.86.
For insurers, large health systems like Stanford may be too big to fight, suggested Harvard University health care economist Leemore Dafny, who told KHN that “everyone wants to point fingers at the providers, but … a lot of times [insurers] roll over and pay the rates.”
In the end, though, Stanford received less than $13,000 of its original charge, so maybe 2 plus 2 only equals 3. A tough pill to swallow, perhaps, but the whole situation has a kind of chilling Donnie-and-Marie quality to it: a little bit new math, and a little bit “1984.”
Parkinson’s prevalence varies significantly from state to state
ATLANTA – The prevalence of Parkinson’s disease and associated health care spending on the condition vary significantly from state to state, an analysis of Medicare data showed.
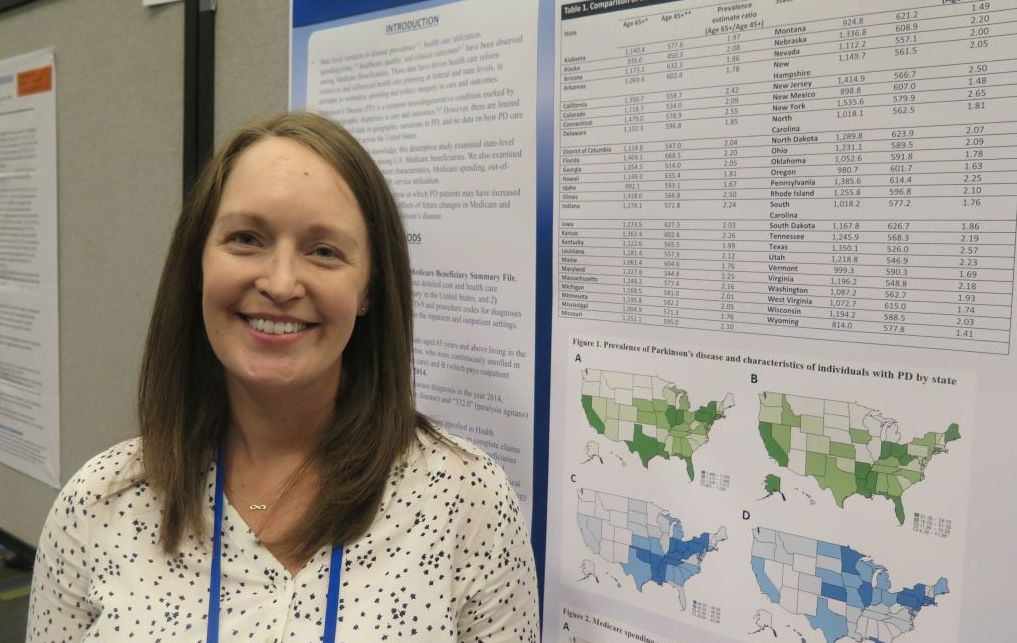
“There is a big variation in not only the prevalence of Parkinson’s disease but also in spending and in health care utilization” among Medicare beneficiaries diagnosed with the condition, lead study author Michelle E. Fullard, MD, said in an interview at the annual meeting of the American Neurological Association. “As neurologists, we should be aware of this. We can use this information to identify and target areas in which Parkinson’s patients may have increased need and require more resources. It can also inform planning at the state and federal levels.”
Dr. Fullard, formerly of the department of neurology at the University of Pennsylvania, Philadelphia, and her colleagues evaluated data from Medicare Beneficiary Summary and Medicare Carrier Files for 27,538,023 individuals aged 65 years and older who were continuously enrolled in Medicare parts A and B during 2014. They calculated state-level differences in Parkinson’s disease prevalence, demographic and eligibility characteristics, costs, and health care use, including number of emergency room visits, number of outpatient clinic visits, and inpatient hospitalizations. The researchers used reimbursement data to calculate the mean out-of-pocket and Medicare cost per individual in each state, and compared direct costs and health service utilization for individuals with and without Parkinson’s disease.
Of all Medicare beneficiaries studied, 392,214 (1.42%) had a diagnosis of Parkinson’s disease. Nearly half (46%) were women and 26% were aged 85 years and older. States with the highest prevalence of Parkinson’s disease included New York (1,720/100,000), Illinois (1,566/100,000), Connecticut (1,560/100,000), Florida (1,551/100,000), Pennsylvania (1,549/100,000), Rhode Island (1,543/100,000), New Jersey (1,541/100,000), Texas (1,522/100,000), California (1,520/100,000) and Louisiana (1,519/100,000). Minnesota had the lowest prevalence (803/100,000).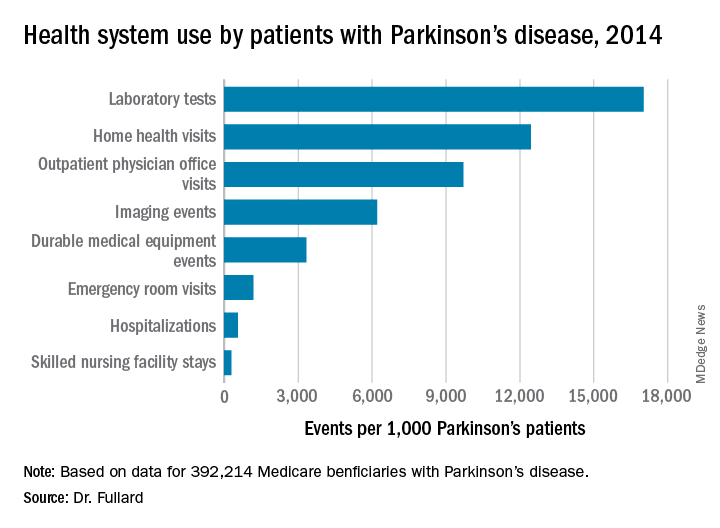
Among the national sample of patients with Parkinson’s disease, there were 219,049 hospitalizations (which represented 558/1,000 Parkinson’s patients), 37,839 readmissions (172/1,000 hospitalizations), 9,740,609 outpatient physician office visits (9,700/1,000 patients), 34,159 hospice stays (87/1,000 patients), 113,027 skilled nursing facility stays (288/1,000 patients), 466,160 emergency room visits (1,188/1,000 patients, 39% of which resulted in hospital admission). In addition, there were 1,308,934 durable medical equipment events (3,337/1,000 patients), 6,676,119 laboratory tests (17,021/1,000 patients), 2,435,654 imaging events (6,210/1,000 patients), and 4,879,538 home health visits (12,441/1,000 patients). The costliest services were inpatient care ($2.1 billion), skilled nursing facility care ($1.4 billion), prescription drugs used by those with prescription coverage ($974.8 million), hospital outpatient care ($881 million), and home health care ($776.5 million).
“States with a higher prevalence of Parkinson’s disease may have a larger proportion of high-risk factor patient groups, a higher concentration of providers who recognize and document Parkinson’s disease, increased public awareness of symptoms, or increased health care–seeking behaviors among people living in the state,” the researchers wrote in their abstract. “Among our top Parkinson’s disease prevalence states, Florida and New York also rank high in terms of absolute number of Medicare beneficiaries and have large supplies of health care providers.”
They also noted that Medicare beneficiaries with Parkinson’s had increased use of health care and spending, compared with their counterparts without the disease. “This was true across all sectors of care (inpatient, outpatient, skilled nursing, and ancillary services) and is in line with data demonstrating that PD, its complications, and the shift away from comorbid disease care and prevention that occurs after a Parkinson’s disease diagnosis drive health care spending and utilization among these individuals,” they wrote.
The study was supported by the Parkinson’s Foundation. Dr. Fullard, who now holds a faculty position at the University of Colorado, Aurora, reported having no financial disclosures.
SOURCE: Ann Neurol. 2018;84[S22]:S89-90, Abstract S215.
ATLANTA – The prevalence of Parkinson’s disease and associated health care spending on the condition vary significantly from state to state, an analysis of Medicare data showed.
“There is a big variation in not only the prevalence of Parkinson’s disease but also in spending and in health care utilization” among Medicare beneficiaries diagnosed with the condition, lead study author Michelle E. Fullard, MD, said in an interview at the annual meeting of the American Neurological Association. “As neurologists, we should be aware of this. We can use this information to identify and target areas in which Parkinson’s patients may have increased need and require more resources. It can also inform planning at the state and federal levels.”
Dr. Fullard, formerly of the department of neurology at the University of Pennsylvania, Philadelphia, and her colleagues evaluated data from Medicare Beneficiary Summary and Medicare Carrier Files for 27,538,023 individuals aged 65 years and older who were continuously enrolled in Medicare parts A and B during 2014. They calculated state-level differences in Parkinson’s disease prevalence, demographic and eligibility characteristics, costs, and health care use, including number of emergency room visits, number of outpatient clinic visits, and inpatient hospitalizations. The researchers used reimbursement data to calculate the mean out-of-pocket and Medicare cost per individual in each state, and compared direct costs and health service utilization for individuals with and without Parkinson’s disease.
Of all Medicare beneficiaries studied, 392,214 (1.42%) had a diagnosis of Parkinson’s disease. Nearly half (46%) were women and 26% were aged 85 years and older. States with the highest prevalence of Parkinson’s disease included New York (1,720/100,000), Illinois (1,566/100,000), Connecticut (1,560/100,000), Florida (1,551/100,000), Pennsylvania (1,549/100,000), Rhode Island (1,543/100,000), New Jersey (1,541/100,000), Texas (1,522/100,000), California (1,520/100,000) and Louisiana (1,519/100,000). Minnesota had the lowest prevalence (803/100,000).
Among the national sample of patients with Parkinson’s disease, there were 219,049 hospitalizations (which represented 558/1,000 Parkinson’s patients), 37,839 readmissions (172/1,000 hospitalizations), 9,740,609 outpatient physician office visits (9,700/1,000 patients), 34,159 hospice stays (87/1,000 patients), 113,027 skilled nursing facility stays (288/1,000 patients), 466,160 emergency room visits (1,188/1,000 patients, 39% of which resulted in hospital admission). In addition, there were 1,308,934 durable medical equipment events (3,337/1,000 patients), 6,676,119 laboratory tests (17,021/1,000 patients), 2,435,654 imaging events (6,210/1,000 patients), and 4,879,538 home health visits (12,441/1,000 patients). The costliest services were inpatient care ($2.1 billion), skilled nursing facility care ($1.4 billion), prescription drugs used by those with prescription coverage ($974.8 million), hospital outpatient care ($881 million), and home health care ($776.5 million).
“States with a higher prevalence of Parkinson’s disease may have a larger proportion of high-risk factor patient groups, a higher concentration of providers who recognize and document Parkinson’s disease, increased public awareness of symptoms, or increased health care–seeking behaviors among people living in the state,” the researchers wrote in their abstract. “Among our top Parkinson’s disease prevalence states, Florida and New York also rank high in terms of absolute number of Medicare beneficiaries and have large supplies of health care providers.”
They also noted that Medicare beneficiaries with Parkinson’s had increased use of health care and spending, compared with their counterparts without the disease. “This was true across all sectors of care (inpatient, outpatient, skilled nursing, and ancillary services) and is in line with data demonstrating that PD, its complications, and the shift away from comorbid disease care and prevention that occurs after a Parkinson’s disease diagnosis drive health care spending and utilization among these individuals,” they wrote.
The study was supported by the Parkinson’s Foundation. Dr. Fullard, who now holds a faculty position at the University of Colorado, Aurora, reported having no financial disclosures.
SOURCE: Ann Neurol. 2018;84[S22]:S89-90, Abstract S215.
REPORTING FROM ANA 2018
Key clinical point:
Major finding: States with the highest prevalence of Parkinson’s disease included New York (1,720/100,000), Illinois (1,566/100,000), and Connecticut (1,560/100,000), while Minnesota had the lowest prevalence (803/100,000).
Study details: An analysis of 392,214 Medicare beneficiaries who carried a diagnosis of Parkinson’s disease.
Disclosures: The study was supported by the Parkinson’s Foundation. Dr. Fullard reported having no financial disclosures.
Source: Ann Neurol. 2018;84[S22]:S89-90. Abstract S215.
Estetrol safely limited menopause symptoms in a phase 2b study
Estetrol (Donesta) relieved vasomotor menopausal symptoms without stimulating breast tenderness or raising triglyceride levels in a dose-finding study of the investigational drug presented at the annual meeting of the North American Menopause Society.

Estetrol (E4), an estrogen produced by the fetal liver, is the first native estrogen acting selectively in tissues. Since it crosses the placenta, estetrol is present in maternal urine at about 9 weeks’ gestation. In fetal plasma, it circulates at concentrations about 12 times higher than maternal estetrol levels. The hormone has a half-life of 28-32 hours, longer than the half-life of most other estrogens.
E4 “has been shown to have a remarkably safe profile and I like to describe it as the first natural oral estrogen with the safety profile of a transdermal estrogen,” said Wulf H. Utian, MD, the Arthur H. Bill Professor of Obstetrics & Gynecology at Case Western Reserve University, Cleveland. Estetrol uniquely activates nuclear estrogen receptor–alpha, while antagonizing membrane estrogen receptor-alpha. These properties give E4 selective tissue action, with low breast stimulation meaning less breast tenderness and “low carcinogenic impact.”
Additionally, triglyceride levels are minimally affected, and serum markers for venous thromboembolism generally remain unchanged with E4 exposure, he said.
In a phase 2b dose-finding study, a variety of estetrol doses were compared with placebo to treat vasomotor symptoms in postmenopausal women aged 40-65 years with at least 7 moderate to severe hot flashes daily, or at least 50 moderate to severe hot flashes in the week before randomization. The multicenter, double-blind randomized controlled trial took place in five European countries, with 200 women overall completing the study. The study design excluded women with personal histories of malignancy, thromboembolism, or coagulopathy, and women with diabetes and poor glycemic control. Women with a uterus who had current or past endometrial hyperplasia, polyps, or an abnormal cervical smear were also excluded.
Women who had an intact uterus were included if transvaginal ultrasound showed endometrial thickness of 5 mm or less. Participants were randomized 1:1:1:1 to receive four different E4 doses: 2.5 mg, 5 mg, 10 mg, or 15 mg.
At the highest dose of 15 mg, E4 significantly reduced the frequency of vasomotor symptoms compared with placebo by study week 4 and throughout the 12-week study period (P less than .05).
This high dose also resulted in a 28% reduction in vasomotor symptom severity, compared with placebo by study week 12, with a significant separation from placebo by week 12.
In terms of the number of women who experienced at least a 50% drop in severe vasomotor symptoms, the 15-mg E4 dose also bested placebo (P less than .01). Among the group taking the 15 mg dose, significantly more also saw at least a 75% drop in frequency of severe vasomotor symptom (P less than .001).
Vaginal cytology showed that by week 12 all doses of E4 significantly increased the vaginal maturation index from baseline, a finding that corresponds with less thinning of vaginal tissues (P less than .001, compared with placebo for all doses).
The safety profile of E4 was good, Dr. Utian said. Coagulation markers were unaffected, and most lipid and blood glucose markers were also unchanged. There were “small but potentially beneficial changes in HDL-C [HDL cholesterol levels] and HbA1c values [hemoglobin A1c]” in groups taking the two highest doses of E4.
Also, C-telopeptide of type 1 collagen and osteocalcin values were reduced, “suggesting reduction in bone resorption,” he said.
According to Dr. Utian, those taking the two highest doses also saw a “slight though significant increase” from baseline in sex hormone–binding globulin levels, “indicating that the E4 estrogenic effect was mild and dose dependent.”
Endometrial biopsies showed no hyperplasia. In those taking the 15-mg E4 dose, mean endometrial thickness did increase from a mean 2 mm at baseline to 6 mm at 12 weeks. However, endometrial thickness returned to baseline after progestin therapy, said Dr. Utian. There were no unexpected adverse events during the study.
Dr. Utian reported consultant relationships with Mithra, the maker of estetrol; AMAG; Pharmavite; and Endoceutics. The study was funded by Mithra.
SOURCE: Utian W. NAMS 2018, Friday concurrent session 1.
Estetrol (Donesta) relieved vasomotor menopausal symptoms without stimulating breast tenderness or raising triglyceride levels in a dose-finding study of the investigational drug presented at the annual meeting of the North American Menopause Society.
Estetrol (E4), an estrogen produced by the fetal liver, is the first native estrogen acting selectively in tissues. Since it crosses the placenta, estetrol is present in maternal urine at about 9 weeks’ gestation. In fetal plasma, it circulates at concentrations about 12 times higher than maternal estetrol levels. The hormone has a half-life of 28-32 hours, longer than the half-life of most other estrogens.
E4 “has been shown to have a remarkably safe profile and I like to describe it as the first natural oral estrogen with the safety profile of a transdermal estrogen,” said Wulf H. Utian, MD, the Arthur H. Bill Professor of Obstetrics & Gynecology at Case Western Reserve University, Cleveland. Estetrol uniquely activates nuclear estrogen receptor–alpha, while antagonizing membrane estrogen receptor-alpha. These properties give E4 selective tissue action, with low breast stimulation meaning less breast tenderness and “low carcinogenic impact.”
Additionally, triglyceride levels are minimally affected, and serum markers for venous thromboembolism generally remain unchanged with E4 exposure, he said.
In a phase 2b dose-finding study, a variety of estetrol doses were compared with placebo to treat vasomotor symptoms in postmenopausal women aged 40-65 years with at least 7 moderate to severe hot flashes daily, or at least 50 moderate to severe hot flashes in the week before randomization. The multicenter, double-blind randomized controlled trial took place in five European countries, with 200 women overall completing the study. The study design excluded women with personal histories of malignancy, thromboembolism, or coagulopathy, and women with diabetes and poor glycemic control. Women with a uterus who had current or past endometrial hyperplasia, polyps, or an abnormal cervical smear were also excluded.
Women who had an intact uterus were included if transvaginal ultrasound showed endometrial thickness of 5 mm or less. Participants were randomized 1:1:1:1 to receive four different E4 doses: 2.5 mg, 5 mg, 10 mg, or 15 mg.
At the highest dose of 15 mg, E4 significantly reduced the frequency of vasomotor symptoms compared with placebo by study week 4 and throughout the 12-week study period (P less than .05).
This high dose also resulted in a 28% reduction in vasomotor symptom severity, compared with placebo by study week 12, with a significant separation from placebo by week 12.
In terms of the number of women who experienced at least a 50% drop in severe vasomotor symptoms, the 15-mg E4 dose also bested placebo (P less than .01). Among the group taking the 15 mg dose, significantly more also saw at least a 75% drop in frequency of severe vasomotor symptom (P less than .001).
Vaginal cytology showed that by week 12 all doses of E4 significantly increased the vaginal maturation index from baseline, a finding that corresponds with less thinning of vaginal tissues (P less than .001, compared with placebo for all doses).
The safety profile of E4 was good, Dr. Utian said. Coagulation markers were unaffected, and most lipid and blood glucose markers were also unchanged. There were “small but potentially beneficial changes in HDL-C [HDL cholesterol levels] and HbA1c values [hemoglobin A1c]” in groups taking the two highest doses of E4.
Also, C-telopeptide of type 1 collagen and osteocalcin values were reduced, “suggesting reduction in bone resorption,” he said.
According to Dr. Utian, those taking the two highest doses also saw a “slight though significant increase” from baseline in sex hormone–binding globulin levels, “indicating that the E4 estrogenic effect was mild and dose dependent.”
Endometrial biopsies showed no hyperplasia. In those taking the 15-mg E4 dose, mean endometrial thickness did increase from a mean 2 mm at baseline to 6 mm at 12 weeks. However, endometrial thickness returned to baseline after progestin therapy, said Dr. Utian. There were no unexpected adverse events during the study.
Dr. Utian reported consultant relationships with Mithra, the maker of estetrol; AMAG; Pharmavite; and Endoceutics. The study was funded by Mithra.
SOURCE: Utian W. NAMS 2018, Friday concurrent session 1.
FROM NAMS 2018
Key clinical point: Estetrol relieved hot flashes without adversely affecting lipid markers.
Major finding: Estetrol 15 mg reduced vasomotor symptom severity by 28%.
Study details: Randomized, double-blind, placebo-controlled phase 2b dose-finding study of 200 women.
Disclosures: Dr. Utian reported financial relationships with several pharmaceutical companies, including Mithra, the sponsor of the study.
Source: Utian WH. NAMS 2018, Friday concurrent session 1.