User login
Platelet transfusion threshold matters for preterm infants
A lower threshold for platelet transfusions in preterm infants with severe thrombocytopenia is associated with significantly lower incidence of death and major bleeding, compared with a higher threshold, a new study suggests.

A new major bleeding episode or death occurred in 26% of infants in the high-threshold group, compared with 19% in the low-threshold group, representing a 57% higher risk of poor outcomes even after researchers adjusted for gestational age and intrauterine growth restriction (odds ratio, 1.57; P = .02).
Researchers reported the results of a trial in 660 infants with a mean gestational age of 26.6 weeks, who were randomized to a platelet infusion either at a high platelet–count threshold of 50,000/mm3 or a low threshold of 25,000/mm3.
“Although retrospective studies have suggested that platelet transfusions may cause harm in neonates independently of the disease process, data from randomized controlled trials to support this are lacking,” Anna Curley, MD, of the National Maternity Hospital in Dublin and her coauthors reported in the New England Journal of Medicine.
The rates of minor or worse bleeding were similar between the two groups, and the percentage of infants surviving with bronchopulmonary dysplasia at 36 weeks of corrected age was higher in the high-threshold group (63% vs. 54%; OR, 1.54).
The rates of serious adverse events, not including major bleeding, were similar between the high- and low-threshold groups.
The outcomes of transfusions were not influenced by other factors such as intrauterine growth restriction, gestational age, or postnatal age at randomization.
“Our trial highlights the importance of trials of platelet transfusion involving patients with conditions other than haematological malignancies,” the authors wrote.
However they acknowledged that the reasons for the differences in mortality and outcomes between the two study groups were unknown.
“Platelets have recognized immunological and inflammatory effects, outside of effects on hemostasis,” they wrote. “The effect of transfusing adult platelets to a delicately balance neonatal hemostatic system with relatively hypofunctional platelets is also poorly understood.”
The study was supported by the National Health Service Blood and Transplant Research and Development Committee and other foundations. Authors reported financial disclosures related to Sanquin and Cerus.
SOURCE: Curley A et al. N Engl J Med. 2018 Nov 2. doi: 10.1056/NEJMoa1807320.
A lower threshold for platelet transfusions in preterm infants with severe thrombocytopenia is associated with significantly lower incidence of death and major bleeding, compared with a higher threshold, a new study suggests.
A new major bleeding episode or death occurred in 26% of infants in the high-threshold group, compared with 19% in the low-threshold group, representing a 57% higher risk of poor outcomes even after researchers adjusted for gestational age and intrauterine growth restriction (odds ratio, 1.57; P = .02).
Researchers reported the results of a trial in 660 infants with a mean gestational age of 26.6 weeks, who were randomized to a platelet infusion either at a high platelet–count threshold of 50,000/mm3 or a low threshold of 25,000/mm3.
“Although retrospective studies have suggested that platelet transfusions may cause harm in neonates independently of the disease process, data from randomized controlled trials to support this are lacking,” Anna Curley, MD, of the National Maternity Hospital in Dublin and her coauthors reported in the New England Journal of Medicine.
The rates of minor or worse bleeding were similar between the two groups, and the percentage of infants surviving with bronchopulmonary dysplasia at 36 weeks of corrected age was higher in the high-threshold group (63% vs. 54%; OR, 1.54).
The rates of serious adverse events, not including major bleeding, were similar between the high- and low-threshold groups.
The outcomes of transfusions were not influenced by other factors such as intrauterine growth restriction, gestational age, or postnatal age at randomization.
“Our trial highlights the importance of trials of platelet transfusion involving patients with conditions other than haematological malignancies,” the authors wrote.
However they acknowledged that the reasons for the differences in mortality and outcomes between the two study groups were unknown.
“Platelets have recognized immunological and inflammatory effects, outside of effects on hemostasis,” they wrote. “The effect of transfusing adult platelets to a delicately balance neonatal hemostatic system with relatively hypofunctional platelets is also poorly understood.”
The study was supported by the National Health Service Blood and Transplant Research and Development Committee and other foundations. Authors reported financial disclosures related to Sanquin and Cerus.
SOURCE: Curley A et al. N Engl J Med. 2018 Nov 2. doi: 10.1056/NEJMoa1807320.
FROM THE NEW ENGLAND JOURNAL OF MEDICINE
Key clinical point:
Major finding: The odds of new major bleeding or death were 57% higher in preterm infants who received a platelet transfusion at a higher threshold of 50,000 per mm3 than at a lower threshold of 25,000 mm3 (P = .02).Study details: Randomized study in 660 preterm infants with severe thrombocytopenia.
Disclosures: The study was supported by the National Health Service Blood and Transplant Research and Development Committee, and other foundations. Authors reported financial disclosures related to Sanquin and Cerus.
Source: Curley A et al. N Engl J Med. 2018 Nov 2. doi: 10.1056/NEJMoa1807320.
Rate of sling removal 9 years after MUS for SUI over 3%
a British study found.
Ipek Gurol-Urganci, PhD, of the London School of Hygiene and Tropical Medicine, and her coauthors said their study comes as a result of safety concerns around the procedure, which resulted in a suspension of the operation in the United Kingdom.
“There is concern about problems that some women experience following MUS insertion, including pain, dyspareunia, persistent urinary incontinence, and exposure or erosion. However, there is little randomized, clinical trial evidence on these longer-term outcomes,” they wrote in JAMA, noting that an estimated 250,000 MUS operations were performed in 2010 in the United States.
The current study involved 95,057 women in England who underwent an MUS insertion procedure for SUI for the first time in a National Health Service hospital between 2006 and 2015. Overall, 60,194 of the women had a retropubic insertion and 34,863 had a transobturator insertion.
At 9 years after the initial insertion, the mesh was removed in 3.3% of women. The risk of removal was higher for women who had a retropubic insertion (3.6%), compared with those who had a transobturator insertion (2.7%).
“The risk of a removal was about 30% lower if the mesh sling had been inserted via the transobturator route, which may be explained by the removal of transobturator sling being a more complicated procedure,” Dr. Gurol-Urganci and her associates noted.
Mesh sling removal risk decreased with age, with the risk at 4.4% for women aged 18-39 years, compared with 2.1% in women aged 70 years and older at 9 years after insertion.
The authors wrote that the risks of removal and any reoperation (mesh removal and/or reoperation for SUI) were higher among women from a white racial/ethnic background. However, it was not possible to “disentangle explanations” for these possible differences in risk seen with patient characteristics, which ranged from higher morbidity to differences in the reasons for surgery.
Results also showed that the risk of reoperation was 4.5% at 9 years after the initial insertion, and was slightly higher for a transobturator insertion at 5.3%, compared with 4.1% for a retropubic insertion.
The risk of any reoperation, including mesh removal and/or reoperation for SUI, following the initial MUS insertion was 6.9% at 9 years (95% confidence interval, 6.7%-7.1%), but no statistically significant difference was observed between retropubic and transobturator insertion.
“The present results demonstrate that removal and reoperation risks were associated with the insertion route and patient factors,” Dr. Gurol-Urganci and her associates wrote.
“These findings may guide women and their surgeons when making decisions about surgical treatment of stress urinary incontinence,” they concluded.
The study was supported by a grant from the National Institute for Health Research Health Services and Delivery Research Programme and several of the authors reported receiving National Institute for Health Research research grants. One author reported providing consultancy services to Cambridge Medical Robotics, Femeda, and Astellas.
SOURCE: Gurol-Urganci I et al. JAMA. 2018 Oct 23. doi:10.1001/jama.2018.14997.
FROM JAMA
Key clinical point: The findings of this study may inform decision making when choosing treatment for stress urinary incontinence.
Major finding: Within 9 years of a mesh insertion for stress urinary incontinence, the rate of sling removal was 3.3% and the rate of reoperation was 4.5%.
Study details: A prospective, observational study examining long-term mesh removal and reoperations in over 95,000 women who underwent midurethral mesh operations for stress urinary incontinence between 2006 and 2015.
Disclosures: The study was supported by a grant from the National Institute for Health Research Health Services and Delivery Research Programme and several of the authors reported receiving National Institute for Health Research research grants. One author reported providing consultancy services to Cambridge Medical Robotics, Femeda, and Astellas Pharma.
Source: Gurol-Urganci I et al. JAMA. 2018 Oct 23. doi:10.1001/jama.2018.14997.
Novel risk factors for febrile neutropenia in NHL, solid tumors
A retrospective study has revealed new potential risk factors for chemotherapy-induced febrile neutropenia in patients with solid tumors and non-Hodgkin lymphoma (NHL).

Researchers found the timing and duration of corticosteroid use were both associated with febrile neutropenia. The team also observed “marginal” associations between febrile neutropenia and certain dermatologic and mucosal conditions, as well as the use of intravenous antibiotics before chemotherapy.
However, there was no association found between oral antibiotic use and febrile neutropenia or between radiation therapy and febrile neutropenia.
Chun Rebecca Chao, PhD, of the Kaiser Permanente Southern California in Pasadena, and her colleagues reported these findings in the Journal of the National Comprehensive Cancer Network.
“Febrile neutropenia is life threatening and often requires hospitalization,” Dr. Chao said in a statement. “Furthermore, [febrile neutropenia] can lead to chemotherapy dose delay and dose reduction, which, in turn, negatively impacts antitumor efficacy. However, it can be prevented if high-risk individuals are identified and treated prophylactically.”
With this in mind, Dr. Chao and her colleagues set out to identify novel risk factors for febrile neutropenia by analyzing 15,971 patients who were treated with myelosuppressive chemotherapy at Kaiser Permanente Southern California between 2000 and 2009.
Patients had been diagnosed with NHL (n = 1,617) or breast (n = 6,323), lung (n = 3,584), colorectal (n = 3,062), ovarian (n = 924), or gastric (n = 461) cancers. In all, 4.3% of patients developed febrile neutropenia during their first cycle of chemotherapy.
The researchers found that corticosteroid use was associated with an increased risk of febrile neutropenia in a propensity score–adjusted (PSA) model. The hazard ratio was 1.53 (95% confidence interval, 1.17-1.98; P less than .01) for patients who received corticosteroids.
A longer duration of corticosteroid use was associated with a greater risk of febrile neutropenia. The adjusted HR, compared with no corticosteroid use, was 1.78 for corticosteroid treatment lasting less than 15 days and rose to 2.86 for treatment lasting 45-90 days.
“One way to reduce the incidence rate for [febrile neutropenia] could be to schedule prior corticosteroid use and subsequent chemotherapy with at least 2 weeks between them, given the magnitude of the risk increase and prevalence of this risk factor,” Dr. Chao said.
The researchers found a “marginally” increased risk of febrile neutropenia in patients with certain dermatologic conditions (dermatitis, psoriasis, pruritus) and mucosal conditions (gastritis, stomatitis, mucositis). In the PSA model, the HR was 1.40 (95% CI, 0.98-1.93; P = 0.05) for patients with these conditions.
Intravenous antibiotic use was also found to be marginally associated with an increased risk of febrile neutropenia in a restricted analysis covering patients treated in 2008 and 2009. In the PSA model, the HR was 1.35 (95% CI, 0.97-1.87; P = .08).
There was no association found between febrile neutropenia and oral antibiotic use in the restricted analysis. In the PSA model, the HR was 1.07 (95% CI, 0.77-1.48; P = .70) for patients who received oral antibiotics.
Dr. Chao and her colleagues wrote that these results suggest intravenous antibiotics may have a more profound impact than oral antibiotics on the balance of bacterial flora and other immune functions. Another possible explanation is that patients who received intravenous antibiotics were generally sicker and more prone to severe infection than patients who received oral antibiotics.
The researchers also found no association between febrile neutropenia and prior surgery, prior radiation therapy, and concurrent radiation therapy in the PSA model.
The study was funded by Amgen. Three of the authors reported being employees and stockholders of Amgen.
[email protected]
SOURCE: Chao CR et al. J Natl Compr Canc Netw. 2018;16(10):1201-8.
A retrospective study has revealed new potential risk factors for chemotherapy-induced febrile neutropenia in patients with solid tumors and non-Hodgkin lymphoma (NHL).
Researchers found the timing and duration of corticosteroid use were both associated with febrile neutropenia. The team also observed “marginal” associations between febrile neutropenia and certain dermatologic and mucosal conditions, as well as the use of intravenous antibiotics before chemotherapy.
However, there was no association found between oral antibiotic use and febrile neutropenia or between radiation therapy and febrile neutropenia.
Chun Rebecca Chao, PhD, of the Kaiser Permanente Southern California in Pasadena, and her colleagues reported these findings in the Journal of the National Comprehensive Cancer Network.
“Febrile neutropenia is life threatening and often requires hospitalization,” Dr. Chao said in a statement. “Furthermore, [febrile neutropenia] can lead to chemotherapy dose delay and dose reduction, which, in turn, negatively impacts antitumor efficacy. However, it can be prevented if high-risk individuals are identified and treated prophylactically.”
With this in mind, Dr. Chao and her colleagues set out to identify novel risk factors for febrile neutropenia by analyzing 15,971 patients who were treated with myelosuppressive chemotherapy at Kaiser Permanente Southern California between 2000 and 2009.
Patients had been diagnosed with NHL (n = 1,617) or breast (n = 6,323), lung (n = 3,584), colorectal (n = 3,062), ovarian (n = 924), or gastric (n = 461) cancers. In all, 4.3% of patients developed febrile neutropenia during their first cycle of chemotherapy.
The researchers found that corticosteroid use was associated with an increased risk of febrile neutropenia in a propensity score–adjusted (PSA) model. The hazard ratio was 1.53 (95% confidence interval, 1.17-1.98; P less than .01) for patients who received corticosteroids.
A longer duration of corticosteroid use was associated with a greater risk of febrile neutropenia. The adjusted HR, compared with no corticosteroid use, was 1.78 for corticosteroid treatment lasting less than 15 days and rose to 2.86 for treatment lasting 45-90 days.
“One way to reduce the incidence rate for [febrile neutropenia] could be to schedule prior corticosteroid use and subsequent chemotherapy with at least 2 weeks between them, given the magnitude of the risk increase and prevalence of this risk factor,” Dr. Chao said.
The researchers found a “marginally” increased risk of febrile neutropenia in patients with certain dermatologic conditions (dermatitis, psoriasis, pruritus) and mucosal conditions (gastritis, stomatitis, mucositis). In the PSA model, the HR was 1.40 (95% CI, 0.98-1.93; P = 0.05) for patients with these conditions.
Intravenous antibiotic use was also found to be marginally associated with an increased risk of febrile neutropenia in a restricted analysis covering patients treated in 2008 and 2009. In the PSA model, the HR was 1.35 (95% CI, 0.97-1.87; P = .08).
There was no association found between febrile neutropenia and oral antibiotic use in the restricted analysis. In the PSA model, the HR was 1.07 (95% CI, 0.77-1.48; P = .70) for patients who received oral antibiotics.
Dr. Chao and her colleagues wrote that these results suggest intravenous antibiotics may have a more profound impact than oral antibiotics on the balance of bacterial flora and other immune functions. Another possible explanation is that patients who received intravenous antibiotics were generally sicker and more prone to severe infection than patients who received oral antibiotics.
The researchers also found no association between febrile neutropenia and prior surgery, prior radiation therapy, and concurrent radiation therapy in the PSA model.
The study was funded by Amgen. Three of the authors reported being employees and stockholders of Amgen.
[email protected]
SOURCE: Chao CR et al. J Natl Compr Canc Netw. 2018;16(10):1201-8.
FROM THE JOURNAL OF THE NATIONAL COMPREHENSIVE CANCER NETWORK
Key clinical point:
Major finding: Corticosteroid use was associated with an increased risk of febrile neutropenia, compared with no corticosteroid use (hazard ratio, 1.53; P less than .01).
Study details: This retrospective study included 15,971 patients with non-Hodgkin lymphoma or five solid tumors.
Disclosures: The study was funded by Amgen. Three of the authors reported being employers and stockholders of Amgen.
Source: Chao CR et al. J Natl Compr Canc Netw. 2018;16(10):1201-8.
Interacting with horses helps veterans with PTSD; Identical twin battles anorexia
The things witnessed and actions taken during military service can lead to posttraumatic stress disorder and other debilitating illnesses.

Retired Command Sgt. Maj. Sam Rhodes, a nearly 30-year U.S. Army veteran, says he was scarred by nightmares of his combat experiences in Iraq upon returning home to Georgia. He also had depression, he says. Yet, Mr. Rhodes missed the camaraderie of his squad and felt lost when he returned home. For a time, he says, ending his life seemed the only way out.
Then he began to care for his stepdaughter’s horse. “Cleaning stalls, putting up fences; it made me feel like I had a purpose in life. It’s amazing how it really got me to calm down a little bit,” he relates in an interview with CNN.
Seeking to share the relief he felt, Mr. Rhodes built his own horse ranch and created Warrior Outreach, a nonprofit that, among other things, provides free access to horses for veterans, service members, and their families through its twice yearly Horsemanship Program. For Mr. Rhodes and the other veterans who frequent the ranch, there has been no miracle turnaround. .
“Guys can come out here, especially if they are having a rough go at it, and just kind of forget about what’s going on in the real world,” veteran Michael Christensen says. “The fact that we can network and just say, ‘Anytime you need something, here’s my number, call me’ ... It builds a network of veterans that can help each other.”
Two perspectives on anorexia
Identical twins often share many of the same interests, but they also can experience differences in how they view themselves.

Take the case of Bridget Yard, an identical twin and journalist who, in a CBC radio report, describes her life with an eating disorder and a twin sister who proved to be her savior.
“I sometimes thought I wouldn’t survive my teenage years, or early adulthood, because of my illness. But once I let Brianna in on my secrets, we began to deal with them together. She continues to be my greatest support as I enter recovery and work hard to live a healthy, full life. But we both still struggle with something. Why did I develop an eating disorder, and not Brianna? We were raised in the same environment, by the same loving parents. Our DNA is identical. I want to know what tipped the balance. Why me?”
The clues were there early on. Bridget was insecure and shy as a teen, and she says she was struggling to accept issues that included her feelings of bisexuality. Brianna was confident and outgoing. Hunger became a way for Bridget to quiet the demons of insecurity and establish some control. “I pushed my sexuality further back into the closet than my eating disorder,” she says. “That closet was full up, and it was killing me to continue the charade.”
Howard Steiger, PhD, tells Bridget Yard that the twin with anorexia nervosa often is found to be more perfectionistic and prone to being concerned with making errors and with others judgments. “Now we don’t know, is that a sort of a life experience thing that causes that to become more expressed? Or is that a secondary thing because of starvation and the effects of malnutrition? Or is it maybe a prenatal effect, that meant that one of the twins was programmed to be a little more perfectionistic than the other?” says Dr. Steiger, director of the Douglas Mental Health University Institute’s Eating Disorders Program at McGill University in Montreal.
Genetic changes, even before birth, might have a role. Whatever the causes, personal acceptance and recognition of her strengths and frailties have helped Bridget find a new path.
“Brianna has a phrase that we use a lot: ‘Nothing to it but to get through it.’ I used to hate that. It’s so cold, and things aren’t always so simple,” Bridget says in the interview. “But now, I embrace it. I know I will never have to do this alone. There’s nothing to it but to get through it – honestly, and together.”
Is that phone call real or robo?
In the few minutes it takes to read this column, some 400,000 Americans will have picked up the phone to hear a robotic voice harping a product or cause. If robocalling were a disease, it would be an epidemic.
Some robocalls are positive, reminding us of appointments and coming events. But about 40% are scams.
“Every time my phone rings it interrupts the work I’m doing,” says Hannah Donahue, a media strategist in Los Angeles. “Even if I don’t answer the phone, it’s disruptive.” She receives about six robocalls a day, starting as early as 7 a.m. and continuing into the evening.
And it might not be as easy as simply not answering a call when your business life depends on your phone. Missing a call can mean lost work.
Robocalling has been around for decades. But the frequency of use has skyrocketed in recent years. In 2018, the estimated number of monthly robocalls in the United States has risen from about 2.5 billion to 4.5 billion, as reported by NBC News.
The increased efforts by robo-scammers might reflect changing consumer behaviors. “The [telecommunications carriers] started to identify the bad guys,” says Alex Quilici, CEO of YouMail, a company that provides voicemail and call-blocking services to iPhone and Android users. “Call-blocking apps started to scale up and get publicity. What we figure is that bad guys started having to call more to get through.”
Technology is another driver. Setting up a robocall enterprise is easy and cheap.
The best advice for now is not to answer calls from unfamiliar phone numbers. “We still get a ton of spam, but Google and everyone has gotten so good at filtering email that you don’t notice,” Mr. Quilici says. For now, robocalling remains a frustration of a plugged-in life.
Work, ethics, and the millennials
A few months ago, several Google employees reportedly quit over the company’s involvement in a military project. Their decision might have come with the knowledge that their skills were transferable and that another job would not prove hard to find.
Still, the decision to resign might be a sign of how different generations approach work, according to a BBC article. For millennials, sometimes called the job-hopping generation, switching jobs for ethical reasons might be more common than it is for Generation Xers or Baby Boomers.
Then again, the article says, these ideas about millennials might not hold true for most young workers.
Part of this may be tied to the economics of the present. Research supports the view that gaps in employment, whether deliberate or not, are neither good for the bank account nor the likelihood of future job satisfaction.
“For all the lip service we pay to ‘making a difference,’ evidence shows the primary driver for selecting a job is still the payslip. The most recent Deloitte survey on millennials underlines that 63% of millennials consider the financial reward a very important factor in weighing up a job offer – the highest ranking one,” writes BBC correspondent José Luis Peñarredonda.
As in generations past, the main reason for choosing a job in 2018 remains the wage. Real-life necessities to support a family can blunt youthful passion to change things in a low-paying way. Still, headway is being made, as some companies realize the value of aligning corporate priorities with employees’ desire to have their work better reflect their ethics.
Finding ways to overcome setbacks
The end of a relationship, or loss of a loved one – or a job – are inevitable life events – and there are steps people can take to be resilient and find happiness, writes Arthur B. Markman, PhD.
First, Dr. Markman says, it is important to focus on steps that can be taken to improve a situation.
“As you engage in those actions, you will find that you feel better about your work and will also become more productive,” writes Dr. Markman, professor of psychology and marketing at the University of Texas, Austin.
A second strategy, he writes, is “surrounding yourself with people if you don’t feel like it.” This helps, he says, because sharing challenges with others can help people focus on what they need to do do. Third, Dr. Markman advises, it’s best to focus on small victories rather than long-term projects.
And finally, he says, it helps to interpret the actions of others through a positive lens. Why? Because this approach is more likely to create “positive reactions with others,” he writes.
Find Dr. Markman’s article in Fast Company.
The things witnessed and actions taken during military service can lead to posttraumatic stress disorder and other debilitating illnesses.
Retired Command Sgt. Maj. Sam Rhodes, a nearly 30-year U.S. Army veteran, says he was scarred by nightmares of his combat experiences in Iraq upon returning home to Georgia. He also had depression, he says. Yet, Mr. Rhodes missed the camaraderie of his squad and felt lost when he returned home. For a time, he says, ending his life seemed the only way out.
Then he began to care for his stepdaughter’s horse. “Cleaning stalls, putting up fences; it made me feel like I had a purpose in life. It’s amazing how it really got me to calm down a little bit,” he relates in an interview with CNN.
Seeking to share the relief he felt, Mr. Rhodes built his own horse ranch and created Warrior Outreach, a nonprofit that, among other things, provides free access to horses for veterans, service members, and their families through its twice yearly Horsemanship Program. For Mr. Rhodes and the other veterans who frequent the ranch, there has been no miracle turnaround. .
“Guys can come out here, especially if they are having a rough go at it, and just kind of forget about what’s going on in the real world,” veteran Michael Christensen says. “The fact that we can network and just say, ‘Anytime you need something, here’s my number, call me’ ... It builds a network of veterans that can help each other.”
Two perspectives on anorexia
Identical twins often share many of the same interests, but they also can experience differences in how they view themselves.
Take the case of Bridget Yard, an identical twin and journalist who, in a CBC radio report, describes her life with an eating disorder and a twin sister who proved to be her savior.
“I sometimes thought I wouldn’t survive my teenage years, or early adulthood, because of my illness. But once I let Brianna in on my secrets, we began to deal with them together. She continues to be my greatest support as I enter recovery and work hard to live a healthy, full life. But we both still struggle with something. Why did I develop an eating disorder, and not Brianna? We were raised in the same environment, by the same loving parents. Our DNA is identical. I want to know what tipped the balance. Why me?”
The clues were there early on. Bridget was insecure and shy as a teen, and she says she was struggling to accept issues that included her feelings of bisexuality. Brianna was confident and outgoing. Hunger became a way for Bridget to quiet the demons of insecurity and establish some control. “I pushed my sexuality further back into the closet than my eating disorder,” she says. “That closet was full up, and it was killing me to continue the charade.”
Howard Steiger, PhD, tells Bridget Yard that the twin with anorexia nervosa often is found to be more perfectionistic and prone to being concerned with making errors and with others judgments. “Now we don’t know, is that a sort of a life experience thing that causes that to become more expressed? Or is that a secondary thing because of starvation and the effects of malnutrition? Or is it maybe a prenatal effect, that meant that one of the twins was programmed to be a little more perfectionistic than the other?” says Dr. Steiger, director of the Douglas Mental Health University Institute’s Eating Disorders Program at McGill University in Montreal.
Genetic changes, even before birth, might have a role. Whatever the causes, personal acceptance and recognition of her strengths and frailties have helped Bridget find a new path.
“Brianna has a phrase that we use a lot: ‘Nothing to it but to get through it.’ I used to hate that. It’s so cold, and things aren’t always so simple,” Bridget says in the interview. “But now, I embrace it. I know I will never have to do this alone. There’s nothing to it but to get through it – honestly, and together.”
Is that phone call real or robo?
In the few minutes it takes to read this column, some 400,000 Americans will have picked up the phone to hear a robotic voice harping a product or cause. If robocalling were a disease, it would be an epidemic.
Some robocalls are positive, reminding us of appointments and coming events. But about 40% are scams.
“Every time my phone rings it interrupts the work I’m doing,” says Hannah Donahue, a media strategist in Los Angeles. “Even if I don’t answer the phone, it’s disruptive.” She receives about six robocalls a day, starting as early as 7 a.m. and continuing into the evening.
And it might not be as easy as simply not answering a call when your business life depends on your phone. Missing a call can mean lost work.
Robocalling has been around for decades. But the frequency of use has skyrocketed in recent years. In 2018, the estimated number of monthly robocalls in the United States has risen from about 2.5 billion to 4.5 billion, as reported by NBC News.
The increased efforts by robo-scammers might reflect changing consumer behaviors. “The [telecommunications carriers] started to identify the bad guys,” says Alex Quilici, CEO of YouMail, a company that provides voicemail and call-blocking services to iPhone and Android users. “Call-blocking apps started to scale up and get publicity. What we figure is that bad guys started having to call more to get through.”
Technology is another driver. Setting up a robocall enterprise is easy and cheap.
The best advice for now is not to answer calls from unfamiliar phone numbers. “We still get a ton of spam, but Google and everyone has gotten so good at filtering email that you don’t notice,” Mr. Quilici says. For now, robocalling remains a frustration of a plugged-in life.
Work, ethics, and the millennials
A few months ago, several Google employees reportedly quit over the company’s involvement in a military project. Their decision might have come with the knowledge that their skills were transferable and that another job would not prove hard to find.
Still, the decision to resign might be a sign of how different generations approach work, according to a BBC article. For millennials, sometimes called the job-hopping generation, switching jobs for ethical reasons might be more common than it is for Generation Xers or Baby Boomers.
Then again, the article says, these ideas about millennials might not hold true for most young workers.
Part of this may be tied to the economics of the present. Research supports the view that gaps in employment, whether deliberate or not, are neither good for the bank account nor the likelihood of future job satisfaction.
“For all the lip service we pay to ‘making a difference,’ evidence shows the primary driver for selecting a job is still the payslip. The most recent Deloitte survey on millennials underlines that 63% of millennials consider the financial reward a very important factor in weighing up a job offer – the highest ranking one,” writes BBC correspondent José Luis Peñarredonda.
As in generations past, the main reason for choosing a job in 2018 remains the wage. Real-life necessities to support a family can blunt youthful passion to change things in a low-paying way. Still, headway is being made, as some companies realize the value of aligning corporate priorities with employees’ desire to have their work better reflect their ethics.
Finding ways to overcome setbacks
The end of a relationship, or loss of a loved one – or a job – are inevitable life events – and there are steps people can take to be resilient and find happiness, writes Arthur B. Markman, PhD.
First, Dr. Markman says, it is important to focus on steps that can be taken to improve a situation.
“As you engage in those actions, you will find that you feel better about your work and will also become more productive,” writes Dr. Markman, professor of psychology and marketing at the University of Texas, Austin.
A second strategy, he writes, is “surrounding yourself with people if you don’t feel like it.” This helps, he says, because sharing challenges with others can help people focus on what they need to do do. Third, Dr. Markman advises, it’s best to focus on small victories rather than long-term projects.
And finally, he says, it helps to interpret the actions of others through a positive lens. Why? Because this approach is more likely to create “positive reactions with others,” he writes.
Find Dr. Markman’s article in Fast Company.
Lower threshold for platelet transfusions appears safer
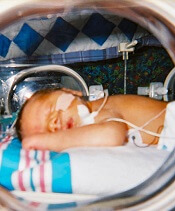
A lower threshold for platelet transfusions may be safer for preterm infants with severe thrombocytopenia, a new study suggests.
Researchers randomized preterm infants with severe thrombocytopenia to receive transfusions at platelet count thresholds of 50,000/mm3 or 25,000/mm3.
The team found that patients in the high-threshold group had a significantly higher risk of major bleeding or death.
Anna Curley, MD, of the National Maternity Hospital in Dublin, Ireland, and her colleagues reported this finding in The New England Journal of Medicine.
The researchers studied 660 infants with a mean gestational age of 26.6 weeks. They were randomized to receive platelet transfusions at a high platelet-count threshold of 50,000/mm3 or a low threshold of 25,000/mm3.
Within 28 days of randomization, a new major bleeding episode or death occurred in 26% of the high-threshold group and 19% of the low-threshold group.
When the researchers adjusted for gestational age, intrauterine growth restriction, and trial site, the odds ratio (OR) for major bleeding or death was 1.57 (95% confidence interval [CI], 1.06-2.32; P=0.02).
The OR for death alone was 1.56 (95% CI, 0.95-2.55), and the hazard ratio for at least one major bleeding episode was 1.32 (95% CI, 1.00-1.74).
The rates of serious adverse events, not including major bleeding, were similar between the high- and low-threshold groups—25% and 22%, respectively (OR=1.14; 95% CI, 0.78-1.67).
The researchers said the results of this trial suggest that reducing the transfusion threshold from 50,000/mm3 to 25,000/mm3 may prevent death or major bleeding in 7 of 100 preterm neonates with severe thrombocytopenia.
However, the team also acknowledged that it isn’t clear why reducing the threshold may reduce the risk of mortality or major bleeding in this patient group.
The researchers said a range of factors might play a role in adverse outcomes of platelet transfusion in preterm neonates, including inflammatory consequences, hemodynamic shifts, fragility of the germinal matrix, disturbances in organ and brain blood flow, preterm lungs with a large capillary bed and abundant immune cells, platelet-derived reactive oxygen species, proangiogenic factors, and vessel occlusion by platelet microthrombi.
This study was supported by the National Health Service Blood and Transplant Research and Development Committee, Sanquin Research, Addenbrooke’s Charitable Trust, the Neonatal Breath of Life Fund, and the National Institute for Health Research Clinical Research Network.
One study author reported consulting for Sanquin Research, and another declared travel funds from Cerus Corporation.
AD update: New insight into pathogenesis, prevention, and treatments
LAS VEGAS – Recent research has provided a rare triple whammy in the world of atopic dermatitis (AD). Over the last few years, Linda F. Stein Gold, MD, said at Skin Disease Education Foundation’s annual Las Vegas Dermatology Seminar.

AD affects an estimated 7% of adults in the United States and 13% of children under aged 18 years, according to the National Eczema Association. An estimated one-third of the affected children (3.2 million) have moderate to severe disease.
New information about AD includes more information pinpointing the genetic link. Dr. Stein Gold, director of clinical research in the department of dermatology at the Henry Ford Health System, Detroit, pointed out that about 70% of patients with AD have a family history of atopic conditions.
Mutations in filaggrin appear to play a role in the development of AD, but a significant proportion of people with AD do not have evidence of filaggrin mutations and about 40% of people with defects never develop AD, she noted.
Emollients may be key to preventing AD. To explore the theory that defects on the skin barrier “might be key initiators of atopic dermatitis and possibly allergic sensitization,” investigators conducted a randomized controlled study of 124 babies at risk of AD in the United States and United Kingdom; parents of 55 babies applied emollients to their whole bodies from shortly after birth until 6 months while a control group used nothing (J Allergy Clin Immunol. 2014 Oct; 134[4]:818-23).
At 6 months, those in the emollient group were half as likely to have developed AD (relative risk, 0.50; P = .017).
Bleach baths have received attention on the AD prevention front. Dr. Stein Gold pointed to a 2017 systematic review and meta-analysis of five studies that found both bleach and water baths reduced AD severity. Bleach baths were effective but not more so than water baths (Ann Allergy Asthma Immunol. 2017 Nov;119[5]:435-40). Also, there was no difference in skin infections or colonization with Staphylococcus aureus between the two.
So are water baths just as good as bleach baths? “I’m not 100% sure I buy into this,” Dr. Stein Gold said. “I’m still a bleach bath believer.”
Topical calcineurin inhibitors (TCIs) can be used as a “proactive,” steroid-sparing treatment to prevent relapses in AD, research suggests. For this purpose, the recommended maintenance dosage is two to three applications per week on areas that tend to flare; the TCI drugs can be used in conjunction with topical corticosteroids (J Am Acad Dermatol. 2014 Jul;71[1]:116-32).
TCIs come with boxed warning because of concerns about such cancers as lymphoma. But recent research has not found a higher risk of lymphoma in patients with AD who are treated with the medication. “We’ve had these drugs for a long time, and they do appear to be safe,” Dr. Stein Gold said.
She referred to a 2015 review of 21 studies of almost 6,000 pediatric patients with AD who were treated with a TCI, which concluded that the drugs are safe and efficacious over the long term (Pediatric Allergy Immunol. 2015 Jun;26[4]:306-15).
“Everyone wants to know which ones are better,” Dr. Stein Gold said in regard to TCIs. But there aren’t head-to-head studies, she said, and it’s difficult to compare the available data on response rates between certain topical treatments because the studies are designed differently.
For example, with crisaborole (Eucrisa), the topical phosphodiesterase-4 (PDE4) inhibitor approved in 2016 for mild to moderate AD in patients aged 2 years and up, clear/almost clear rates are 49%-52%, compared with 30%-40% with placebo, a 10%-20% difference. Rates with OPA-15406, an investigational topical selective PDE4 inhibitor, and with the TCI pimecrolimus (Elidel cream 1%) have been about 20% higher than with controls, but studies are designed differently, and the results cannot be compared, according to Dr. Stein Gold.
Dupilumab (Dupixent), a monoclonal antibody that inhibits signaling of both interleukin-4 and interleukin-13, approved in 2017 for adults with moderate to severe AD, has been a “game changer” for this population, Dr. Stein Gold said. “It looks like this drug has a good, durable effect,” she added (Lancet. 2017 Jun 10;389[10086]:2287-303).
However, she cautioned that up to 10% of patients treated with dupilumab – or more – may develop conjunctivitis. Researchers studying dupilumab in asthma have not seen this side effect, she said, so it may be unique to AD. “It’s something that’s real,” she said, noting that it’s not clear if it’s viral, allergic, or bacterial. Researchers are exploring the use of the drug in children, she added.
Dr. Stein Gold said there are other drugs in development for AD, but she cautioned that “the field is crowded ... and not all of them are going to make it.”
Drugs in development for AD include nemolizumab (a humanized monoclonal antibody that inhibits interleukin-31 signaling), upadacitinib (a JAK1 selective inhibitor), baricitinib (an oral JAK1/2 inhibitor), and topical tapinarof (an agonist of the aryl hydrocarbon receptor).
SDEF and this news organization are owned by the same parent company.
Dr. Stein Gold disclosed relationships with Galderma, Valeant, Ranbaxy, Promius, Actavis, Roche, Dermira, Medimetriks, Pfizer, Sanofi/Regeneron, Otsuka, and Taro.
LAS VEGAS – Recent research has provided a rare triple whammy in the world of atopic dermatitis (AD). Over the last few years, Linda F. Stein Gold, MD, said at Skin Disease Education Foundation’s annual Las Vegas Dermatology Seminar.
AD affects an estimated 7% of adults in the United States and 13% of children under aged 18 years, according to the National Eczema Association. An estimated one-third of the affected children (3.2 million) have moderate to severe disease.
New information about AD includes more information pinpointing the genetic link. Dr. Stein Gold, director of clinical research in the department of dermatology at the Henry Ford Health System, Detroit, pointed out that about 70% of patients with AD have a family history of atopic conditions.
Mutations in filaggrin appear to play a role in the development of AD, but a significant proportion of people with AD do not have evidence of filaggrin mutations and about 40% of people with defects never develop AD, she noted.
Emollients may be key to preventing AD. To explore the theory that defects on the skin barrier “might be key initiators of atopic dermatitis and possibly allergic sensitization,” investigators conducted a randomized controlled study of 124 babies at risk of AD in the United States and United Kingdom; parents of 55 babies applied emollients to their whole bodies from shortly after birth until 6 months while a control group used nothing (J Allergy Clin Immunol. 2014 Oct; 134[4]:818-23).
At 6 months, those in the emollient group were half as likely to have developed AD (relative risk, 0.50; P = .017).
Bleach baths have received attention on the AD prevention front. Dr. Stein Gold pointed to a 2017 systematic review and meta-analysis of five studies that found both bleach and water baths reduced AD severity. Bleach baths were effective but not more so than water baths (Ann Allergy Asthma Immunol. 2017 Nov;119[5]:435-40). Also, there was no difference in skin infections or colonization with Staphylococcus aureus between the two.
So are water baths just as good as bleach baths? “I’m not 100% sure I buy into this,” Dr. Stein Gold said. “I’m still a bleach bath believer.”
Topical calcineurin inhibitors (TCIs) can be used as a “proactive,” steroid-sparing treatment to prevent relapses in AD, research suggests. For this purpose, the recommended maintenance dosage is two to three applications per week on areas that tend to flare; the TCI drugs can be used in conjunction with topical corticosteroids (J Am Acad Dermatol. 2014 Jul;71[1]:116-32).
TCIs come with boxed warning because of concerns about such cancers as lymphoma. But recent research has not found a higher risk of lymphoma in patients with AD who are treated with the medication. “We’ve had these drugs for a long time, and they do appear to be safe,” Dr. Stein Gold said.
She referred to a 2015 review of 21 studies of almost 6,000 pediatric patients with AD who were treated with a TCI, which concluded that the drugs are safe and efficacious over the long term (Pediatric Allergy Immunol. 2015 Jun;26[4]:306-15).
“Everyone wants to know which ones are better,” Dr. Stein Gold said in regard to TCIs. But there aren’t head-to-head studies, she said, and it’s difficult to compare the available data on response rates between certain topical treatments because the studies are designed differently.
For example, with crisaborole (Eucrisa), the topical phosphodiesterase-4 (PDE4) inhibitor approved in 2016 for mild to moderate AD in patients aged 2 years and up, clear/almost clear rates are 49%-52%, compared with 30%-40% with placebo, a 10%-20% difference. Rates with OPA-15406, an investigational topical selective PDE4 inhibitor, and with the TCI pimecrolimus (Elidel cream 1%) have been about 20% higher than with controls, but studies are designed differently, and the results cannot be compared, according to Dr. Stein Gold.
Dupilumab (Dupixent), a monoclonal antibody that inhibits signaling of both interleukin-4 and interleukin-13, approved in 2017 for adults with moderate to severe AD, has been a “game changer” for this population, Dr. Stein Gold said. “It looks like this drug has a good, durable effect,” she added (Lancet. 2017 Jun 10;389[10086]:2287-303).
However, she cautioned that up to 10% of patients treated with dupilumab – or more – may develop conjunctivitis. Researchers studying dupilumab in asthma have not seen this side effect, she said, so it may be unique to AD. “It’s something that’s real,” she said, noting that it’s not clear if it’s viral, allergic, or bacterial. Researchers are exploring the use of the drug in children, she added.
Dr. Stein Gold said there are other drugs in development for AD, but she cautioned that “the field is crowded ... and not all of them are going to make it.”
Drugs in development for AD include nemolizumab (a humanized monoclonal antibody that inhibits interleukin-31 signaling), upadacitinib (a JAK1 selective inhibitor), baricitinib (an oral JAK1/2 inhibitor), and topical tapinarof (an agonist of the aryl hydrocarbon receptor).
SDEF and this news organization are owned by the same parent company.
Dr. Stein Gold disclosed relationships with Galderma, Valeant, Ranbaxy, Promius, Actavis, Roche, Dermira, Medimetriks, Pfizer, Sanofi/Regeneron, Otsuka, and Taro.
REPORTING FROM SDEF LAS VEGAS DERMATOLOGY SEMINAR
Are you an optimist or pessimist?
“I’m fine. How are your kids?”

“They’re doing great, but we miss you. It hasn’t been the same at that group since you retired.”
I thanked her for her kind words. But the truth is that there were certainly physicians remaining at that practice who were at least as skillful and probably more caring than I had been. However, they were being increasingly challenged by an organization that struggled with how to be customer friendly and patient centered although it claimed to be both.
It must have been 8 years since I first met this young woman. She had just delivered her first child and was finishing her last year of family practice residency. In the nearly a decade since I had last spoken to her, she had worked in a couple primary care practices and was now the administrator of a rehabilitation facility. She described the all too common scenario of spending hours at home trying to complete her charting when she was doing primary care. Now she spends a good chunk of her time on the phone arguing with insurance companies trying to get coverage for her aging patients.
As she told me how frustrated she was with her current job and how pessimistic she was about the future of health care in this country, I realized that it wasn’t me that she really missed. I, and my old practice, are just examples of what primary care used to be.

As I walked home from the grocery store after our encounter, I wondered how deeply I shared her pessimism. We mostly talked about how bad things have gotten now. But we didn’t talk much about where we thought the state of health care in the Unite States was headed.
Are you an optimist or a pessimist? To what degree will your answer to be colored by your career trajectory? Would you tell a young person that you think our health care system is so messed up that you would discourage them from becoming a physician because the work environment is becoming increasingly toxic?
Or would you acknowledge that health care in this country is going through a difficult time, but the potential reward of knowing that every day you have helped, or at least tried to help, someone is worth riding out storm?
For a moment, step back from your narrow focus as a health care provider. What would you tell a 40-something father of two children who is worried about what health care is going to look like when he is as old as his parents are now?
If you have come down on the positive side of this coin, where are the solutions going to come from? Is technology going to come up with the answers? Is a nationwide electronic medical record system that allows all providers to communicate seamlessly with each other a realistic possibility? Will physicians and patients eventually adapt to and accept a new reality in which health care providers are primarily technicians following algorithms generated by a team of scientists and payers?
Or will we continue to muddle along and hope that our system will get over the hiccups and arrive at some political solution? I am eager to hear what you think. ... and feel.
Dr. Wilkoff practiced primary care pediatrics in Brunswick, Maine for nearly 40 years. He has authored several books on behavioral pediatrics, including “How to Say No to Your Toddler.” Email him at [email protected].
“I’m fine. How are your kids?”
“They’re doing great, but we miss you. It hasn’t been the same at that group since you retired.”
I thanked her for her kind words. But the truth is that there were certainly physicians remaining at that practice who were at least as skillful and probably more caring than I had been. However, they were being increasingly challenged by an organization that struggled with how to be customer friendly and patient centered although it claimed to be both.
It must have been 8 years since I first met this young woman. She had just delivered her first child and was finishing her last year of family practice residency. In the nearly a decade since I had last spoken to her, she had worked in a couple primary care practices and was now the administrator of a rehabilitation facility. She described the all too common scenario of spending hours at home trying to complete her charting when she was doing primary care. Now she spends a good chunk of her time on the phone arguing with insurance companies trying to get coverage for her aging patients.
As she told me how frustrated she was with her current job and how pessimistic she was about the future of health care in this country, I realized that it wasn’t me that she really missed. I, and my old practice, are just examples of what primary care used to be.
As I walked home from the grocery store after our encounter, I wondered how deeply I shared her pessimism. We mostly talked about how bad things have gotten now. But we didn’t talk much about where we thought the state of health care in the Unite States was headed.
Are you an optimist or a pessimist? To what degree will your answer to be colored by your career trajectory? Would you tell a young person that you think our health care system is so messed up that you would discourage them from becoming a physician because the work environment is becoming increasingly toxic?
Or would you acknowledge that health care in this country is going through a difficult time, but the potential reward of knowing that every day you have helped, or at least tried to help, someone is worth riding out storm?
For a moment, step back from your narrow focus as a health care provider. What would you tell a 40-something father of two children who is worried about what health care is going to look like when he is as old as his parents are now?
If you have come down on the positive side of this coin, where are the solutions going to come from? Is technology going to come up with the answers? Is a nationwide electronic medical record system that allows all providers to communicate seamlessly with each other a realistic possibility? Will physicians and patients eventually adapt to and accept a new reality in which health care providers are primarily technicians following algorithms generated by a team of scientists and payers?
Or will we continue to muddle along and hope that our system will get over the hiccups and arrive at some political solution? I am eager to hear what you think. ... and feel.
Dr. Wilkoff practiced primary care pediatrics in Brunswick, Maine for nearly 40 years. He has authored several books on behavioral pediatrics, including “How to Say No to Your Toddler.” Email him at [email protected].

Is it time to revise ASCVD cardiovascular risk threshold?
Researchers suggest that revising the threshold for high CV risk from 7.5% at 10 years to 10% at 10 years. Also today, psoriasis adds to risk of CV procedures and surgery in hypertension, sickle cell disease gene therapy seen advancing, and early appendectomy is linked with a reduction in risk for developing Parkinson’s later in life.
Amazon Alexa
Apple Podcasts
Spotify

Harm Reduction in Diabetes and Cardiology Care
Click here to access Harm Reduction in Diabetes and Cardiology Care
Table of Contents
- Research News
- Hypoglycemia Safety Initiative: Working With PACT Clinical Pharmacy Specialists to Individualize HbA1c Goals
- Predictors of HbA1c Goal Attainment in Patients Treated With Insulin at a VA Pharmacist-Managed Insulin Clinic
- Heart Failure in Older Adults: A Geriatrician Call for Action
- Limited Use of Outpatient Stress Testing in Young Patients With Atypical Chest Pain
- Open Clinical Trials for Diabetes Mellitus Harm Reduction
‘Flexible’ Intervention Helps Patients Overcome Barriers to HIV Treatment
People living with HIV who inject drugs often encounter multiple obstacles, both personal and system related, to beginning and adhering to treatment. But NIH researchers found that an “integrated and flexible intervention” not only helped patients overcome those barriers, but also cut deaths by 50%.
The study, HPTN 074, took place in Indonesia, Ukraine, and Vietnam—3 countries with HIV epidemics driven by injection drug use. Researchers enrolled 502 adults with HIV who inject drugs, and 806 adults without HIV, who inject drugs with them (their injection partners). At ≥ 1 injection partner of every person in the study enrolled. The HIV participants were assigned either the national standard of care for HIV infection and drug use, or the standard of care plus the intervention designed to facilitate treatment. The participants were followed for 1 to 2 years.
In the intervention group, participants were referred to local health care providers for anti-HIV therapy. They were also each assigned a systems navigator, who helped the patient identify and overcome structural barriers to starting and staying in care, such as unfamiliarity with how to enroll in medical care, or difficulty keeping appointments. Psychosocial counselors helped each participant overcome their unique psychological obstacles, such as lack of interest in therapy or fear of stigma.
At the end of the study, 15% of participants with HIV who received standard care had died, compared with 7% of the intervention patients. About 26% of deaths among HIV participants were “clearly” HIV related; 3% were due to drug overdose. Among the 42% of patients who died of unknown cause, 24% had weak immune systems.
The intervention had a “remarkably positive impact” on the participants, said Protocol Chair William Miller, MD, PhD. After 1 year, 41% of the intervention group had undetectable levels of HIV, compared with 24% of the standard-care group. Moreover, 72% of the intervention group were still in treatment, compared with 43% of the standard-care group. Similarly, 41% of intervention patients were in treatment for substance use, compared with 25% of standard-care patients.
The study is designed to be scalable to other settings. Investigators have offered the intervention to all the study participants living with HIV. They will be followed for a second year to find out whether the positive impact is sustained.
Source:
National Institutes of Health. Novel intervention halves rate of death among people living with HIV who inject drugs. https://www.nih.gov/news-events/news-releases/novel-intervention-halves-rate-death-among-people-living-hiv-who-inject-drugs. Published August 31,2018. Accessed October 25, 2018.