User login
Treat-to-target slowly emerging in axial spondyloarthritis
MADRID – Treating patients with axial spondyloarthritis (axSpA) until a specific target is reached is an emerging concept that has gained a lot of traction in the past few years, Pedro Machado, MD, said at the European Congress of Rheumatology.

“The availability of biologic therapies has improved the clinical outcomes for our patients with axial spondyloarthritis and targeting clinical remission or inactive disease is now an achievable treatment goal in clinical practice,” he observed. “This has trigged the question: Is there a role for ‘treat-to-target’ in axial spondyloarthritis?”
Dr. Machado, an honorary consultant in rheumatology and muscle diseases at University College Hospital and the National Hospital for Neurology and Neurosurgery in London, took a critical look at the treat-to-target approach during a clinical science session at the meeting, organized by the European League Against Rheumatism (EULAR).
The concept of treat-to-target is not new, he acknowledged, having been imported from other chronic conditions where there is a very specific target to achieve – such as lowering glycated hemoglobin in diabetes or hypertension or hyperlipidemia in cardiovascular disease.
“The concept involves changing or escalating therapy according to a predefined target under the assumption that this may lead to a better outcome compared to what we call ‘routine care,’ ” Dr. Machado explained.
Treat-to-target is not only well established in nonrheumatic diseases but also has proved to work in patients with rheumatoid arthritis and psoriatic arthritis with evidence from the TICORA (Tight Control of Rheumatoid Arthritis) and TICOPA (Tight Control in Psoriatic Arthritis) trials.
Whether the approach can also work in axSpA is open to debate, and one of the main arguments against using a treat-to-target in axSpA asks, what exactly is the target? While there is no firm agreement yet, Dr. Machado observed that achieving either clinical remission or inactive disease would be the most likely target.
It could be argued this is already being done to some degree, but “we need to be more ambitious,” Dr. Machado said. Indeed, current Assessment of Spondyloarthritis International Society/EULAR recommendations for the treatment of axSpA (Ann Rheum Dis. 2017;76[6]:978–91) note when patients with high disease activity despite sufficient standard treatment should be escalated to treatment with a biologic disease-modifying antirheumatic drug (bDMARD). High disease activity was defined as an Ankylosing Spondylitis Disease Activity Score (ASDAS) of 2.1 or more or a Bath Ankylosing Spondylitis Disease Activity Index (BASDAI) score of 4 or more.
Another argument against using the approach concerns the evidence base. There are no prospective, randomized trials supporting the use of treat-to-target over routine care. However, there is a lot of observational evidence, Dr. Machado said in an interview. Such studies have shown that achieving inactive disease may improve structural outcomes and stop the development of radiographic damage of the spine. Importantly, these observational studies also show that achieving inactive disease may also help to improve patients’ functional outcomes and quality of life.
Evidence backing a treat-to-target approach in axSpA from a randomized, controlled trial may currently be lacking, but the TiCOSPA (Tight Control in Spondyloarthritis) trial is in progress and should help change that, Dr. Machado said.
“The missing bit is a randomized trial, but I would say that the observational evidence is almost enough to advocate a treat-to-target strategy in axial spondyloarthritis.” This was also the view of an international task force that recently published recommendations and overarching principles for a treat-target strategy in spondyloarthritis, including axSpA (Ann Rheum Dis. 2018;77:3-17).
Of course, a treat-to-target approach may not be without its pitfalls. There are a limited number of drugs currently that could be used to “hit the target” of disease activity, Dr. Machado said in his presentation. The approach might also lead to ‘overtreatment,’ and more treatment is not always better as it could not only lead to more adverse events, but it also may mean the approach is not cost-effective.
Depending on the TiCOSPA study results, which are expected next year, Dr. Machado said that “the feasibility and cost-effectiveness of such a strategy in clinical practice also needs to be tested.”
MADRID – Treating patients with axial spondyloarthritis (axSpA) until a specific target is reached is an emerging concept that has gained a lot of traction in the past few years, Pedro Machado, MD, said at the European Congress of Rheumatology.
“The availability of biologic therapies has improved the clinical outcomes for our patients with axial spondyloarthritis and targeting clinical remission or inactive disease is now an achievable treatment goal in clinical practice,” he observed. “This has trigged the question: Is there a role for ‘treat-to-target’ in axial spondyloarthritis?”
Dr. Machado, an honorary consultant in rheumatology and muscle diseases at University College Hospital and the National Hospital for Neurology and Neurosurgery in London, took a critical look at the treat-to-target approach during a clinical science session at the meeting, organized by the European League Against Rheumatism (EULAR).
The concept of treat-to-target is not new, he acknowledged, having been imported from other chronic conditions where there is a very specific target to achieve – such as lowering glycated hemoglobin in diabetes or hypertension or hyperlipidemia in cardiovascular disease.
“The concept involves changing or escalating therapy according to a predefined target under the assumption that this may lead to a better outcome compared to what we call ‘routine care,’ ” Dr. Machado explained.
Treat-to-target is not only well established in nonrheumatic diseases but also has proved to work in patients with rheumatoid arthritis and psoriatic arthritis with evidence from the TICORA (Tight Control of Rheumatoid Arthritis) and TICOPA (Tight Control in Psoriatic Arthritis) trials.
Whether the approach can also work in axSpA is open to debate, and one of the main arguments against using a treat-to-target in axSpA asks, what exactly is the target? While there is no firm agreement yet, Dr. Machado observed that achieving either clinical remission or inactive disease would be the most likely target.
It could be argued this is already being done to some degree, but “we need to be more ambitious,” Dr. Machado said. Indeed, current Assessment of Spondyloarthritis International Society/EULAR recommendations for the treatment of axSpA (Ann Rheum Dis. 2017;76[6]:978–91) note when patients with high disease activity despite sufficient standard treatment should be escalated to treatment with a biologic disease-modifying antirheumatic drug (bDMARD). High disease activity was defined as an Ankylosing Spondylitis Disease Activity Score (ASDAS) of 2.1 or more or a Bath Ankylosing Spondylitis Disease Activity Index (BASDAI) score of 4 or more.
Another argument against using the approach concerns the evidence base. There are no prospective, randomized trials supporting the use of treat-to-target over routine care. However, there is a lot of observational evidence, Dr. Machado said in an interview. Such studies have shown that achieving inactive disease may improve structural outcomes and stop the development of radiographic damage of the spine. Importantly, these observational studies also show that achieving inactive disease may also help to improve patients’ functional outcomes and quality of life.
Evidence backing a treat-to-target approach in axSpA from a randomized, controlled trial may currently be lacking, but the TiCOSPA (Tight Control in Spondyloarthritis) trial is in progress and should help change that, Dr. Machado said.
“The missing bit is a randomized trial, but I would say that the observational evidence is almost enough to advocate a treat-to-target strategy in axial spondyloarthritis.” This was also the view of an international task force that recently published recommendations and overarching principles for a treat-target strategy in spondyloarthritis, including axSpA (Ann Rheum Dis. 2018;77:3-17).
Of course, a treat-to-target approach may not be without its pitfalls. There are a limited number of drugs currently that could be used to “hit the target” of disease activity, Dr. Machado said in his presentation. The approach might also lead to ‘overtreatment,’ and more treatment is not always better as it could not only lead to more adverse events, but it also may mean the approach is not cost-effective.
Depending on the TiCOSPA study results, which are expected next year, Dr. Machado said that “the feasibility and cost-effectiveness of such a strategy in clinical practice also needs to be tested.”
EXPERT analysis FROM THE EULAR 2019 Congress
Tofacitinib shows safety during real-world RA use
MADRID – The Janus kinase inhibitor tofacitinib had a safety profile mostly similar to that of biologic drugs in a review of more than 8,600 U.S. rheumatoid arthritis patients enrolled in a national registry during 2012-2017, the first 5 years when tofacitinib was on the U.S. market.

The “reassuring” safety performance of tofacitinib (Xeljanz) compared with biologic agents used to treat rheumatoid arthritis (RA) in these registry data notably showed a similar rate of venous thromboembolism (VTE) with tofacitinib treatment compared with biologic drugs, Joel M. Kremer, MD, reported at the European Congress of Rheumatology. It is an important finding because of recent concerns raised about VTE incidence among patients taking tofacitinib or another Janus kinase (JAK) inhibitor, he noted. The registry analysis Dr. Kremer presented showed that patients treated with tofacitinib had slightly more than double the rate of herpes zoster, compared with patients on biologic agents, a finding consistent with prior reports that tofacitinib treatment linked with an almost threefold increased rate of herpes zoster when compared with placebo-treated patients in a series of clinical trials (Arthritis Rheumatol. 2014 Oct;66[10]:2675-84). None of the herpes zoster activations identified in the registry patients on tofacitinib were rated as “serious,” noted Dr. Kremer , professor of medicine at Albany (N.Y.) Medical College.
The analysis he presented used data collected in the Corrona Rheumatoid Arthritis registry during November 2012, the month when tofacitinib received U.S. marketing approval, through December 2017. Data came from RA patients in the registry who began treatment during November 2012–June 2017 with either tofacitinib (1,544 patients) or a biologic agent (7,083 patients). The safety assessment focused on four outcomes: the combined rate of major adverse cardiovascular events (including MI, strokes, and fatal events); the incidence of serious infection; the incidence of any herpes zoster regardless of severity; and VTE. These outcomes were numerous enough to allow for propensity-score matching of patients from the tofacitinib and biologic subgroups to adjust for baseline differences between patients in these two categories, but as of the end of 2017, the cumulative number of VTEs was not high enough to allow for propensity-score adjustment, Dr. Kremer said, so instead he reported the unadjusted numbers. Further data collection should allow an adjusted analysis of VTE within another couple of years, he added. The currently available VTE data were “underpowered” for more rigorous statistical analysis, Dr. Kremer said.
After adjustment, the patients treated with tofacitinib had a 42% lower rate of major cardiovascular events, compared with patients who received a biologic drug, but the difference was not statistically significant, and the two subgroups had virtually identical rates of all serious infections. The incidence of herpes zoster was 2.26-fold more frequent among tofacitinib-treated patients than among those on other biologic agents, a statistically significant difference. The unadjusted VTE analysis showed a rate of 0.19/100 patient-years with tofacitinib treatment, and 0.33/100 patient-years with other biological agents, a difference that was not statistically significant, Dr. Kremer reported. Comparison of the rates of pulmonary embolism and deep vein thrombosis were each not statistically different between the two treatment subgroups.
Concern about possibly increased rates of VTE with the use of tofacitinib or other JAK inhibitors arose recently primarily because of two reports. In February 2019, the Food and Drug Administration released a safety announcement that data from an ongoing, postmarketing study of tofacitinib showed an elevated rate of RA patients with pulmonary embolism when they received an off-label, 10-mg twice-daily dosage of the drug, twice the labeled maximum dosage for this population. (The labeling for tofacitinib allows for a maximum dosage of 10 mg twice daily for patients treated for ulcerative colitis.) In addition, a recent report on another JAK inhibitor approved for U.S. marketing for RA treatment, baricitinib (Olumiant), documented a possible excess of VTE events among patients treated with this drug, compared with those who received placebo (Arthritis Rheumatol. 2019 Jan 21. doi: 10.1002/art.40841).
Regarding the now well-described excess of herpes zoster with tofacitinib treatment, Dr. Kremer said that perhaps the best way to address this in a patient who seems to be at risk is to prophylactically vaccinate the patient with the recombinant, adjuvanted zoster vaccine (Shingrix). However, this means withdrawing disease-modifying treatment from the RA patient for 3 weeks at the time of each of two vaccinations, with the possibility of flare induced by the adjuvant, he explained in an interview. The risks and benefits of this approach have not been investigated, he noted, and the Corrona data he studied came almost entirely from the period before Shingrix came onto the U.S. market following its approval in late 2017.
Dr. Kremer has been a consultant to and has received research funding from Pfizer, the company that markets tofacitinib. He has been a consultant to AbbVie, Amgen, Bristol-Myers Squibb, Genentech, and Regeneron/Sanofi, and has received research funding from AbbVie, Eli Lilly, Genentech, and Novartis. One of the coauthors on the report is a Pfizer employee.
SOURCE: Kremer JM et al. Ann Rheum Dis. Jun 2019;78(Suppl 2):82-3; Abstract OP0028. doi: 10.1136/annrheumdis-2019-eular.621.
MADRID – The Janus kinase inhibitor tofacitinib had a safety profile mostly similar to that of biologic drugs in a review of more than 8,600 U.S. rheumatoid arthritis patients enrolled in a national registry during 2012-2017, the first 5 years when tofacitinib was on the U.S. market.
The “reassuring” safety performance of tofacitinib (Xeljanz) compared with biologic agents used to treat rheumatoid arthritis (RA) in these registry data notably showed a similar rate of venous thromboembolism (VTE) with tofacitinib treatment compared with biologic drugs, Joel M. Kremer, MD, reported at the European Congress of Rheumatology. It is an important finding because of recent concerns raised about VTE incidence among patients taking tofacitinib or another Janus kinase (JAK) inhibitor, he noted. The registry analysis Dr. Kremer presented showed that patients treated with tofacitinib had slightly more than double the rate of herpes zoster, compared with patients on biologic agents, a finding consistent with prior reports that tofacitinib treatment linked with an almost threefold increased rate of herpes zoster when compared with placebo-treated patients in a series of clinical trials (Arthritis Rheumatol. 2014 Oct;66[10]:2675-84). None of the herpes zoster activations identified in the registry patients on tofacitinib were rated as “serious,” noted Dr. Kremer , professor of medicine at Albany (N.Y.) Medical College.
The analysis he presented used data collected in the Corrona Rheumatoid Arthritis registry during November 2012, the month when tofacitinib received U.S. marketing approval, through December 2017. Data came from RA patients in the registry who began treatment during November 2012–June 2017 with either tofacitinib (1,544 patients) or a biologic agent (7,083 patients). The safety assessment focused on four outcomes: the combined rate of major adverse cardiovascular events (including MI, strokes, and fatal events); the incidence of serious infection; the incidence of any herpes zoster regardless of severity; and VTE. These outcomes were numerous enough to allow for propensity-score matching of patients from the tofacitinib and biologic subgroups to adjust for baseline differences between patients in these two categories, but as of the end of 2017, the cumulative number of VTEs was not high enough to allow for propensity-score adjustment, Dr. Kremer said, so instead he reported the unadjusted numbers. Further data collection should allow an adjusted analysis of VTE within another couple of years, he added. The currently available VTE data were “underpowered” for more rigorous statistical analysis, Dr. Kremer said.
After adjustment, the patients treated with tofacitinib had a 42% lower rate of major cardiovascular events, compared with patients who received a biologic drug, but the difference was not statistically significant, and the two subgroups had virtually identical rates of all serious infections. The incidence of herpes zoster was 2.26-fold more frequent among tofacitinib-treated patients than among those on other biologic agents, a statistically significant difference. The unadjusted VTE analysis showed a rate of 0.19/100 patient-years with tofacitinib treatment, and 0.33/100 patient-years with other biological agents, a difference that was not statistically significant, Dr. Kremer reported. Comparison of the rates of pulmonary embolism and deep vein thrombosis were each not statistically different between the two treatment subgroups.
Concern about possibly increased rates of VTE with the use of tofacitinib or other JAK inhibitors arose recently primarily because of two reports. In February 2019, the Food and Drug Administration released a safety announcement that data from an ongoing, postmarketing study of tofacitinib showed an elevated rate of RA patients with pulmonary embolism when they received an off-label, 10-mg twice-daily dosage of the drug, twice the labeled maximum dosage for this population. (The labeling for tofacitinib allows for a maximum dosage of 10 mg twice daily for patients treated for ulcerative colitis.) In addition, a recent report on another JAK inhibitor approved for U.S. marketing for RA treatment, baricitinib (Olumiant), documented a possible excess of VTE events among patients treated with this drug, compared with those who received placebo (Arthritis Rheumatol. 2019 Jan 21. doi: 10.1002/art.40841).
Regarding the now well-described excess of herpes zoster with tofacitinib treatment, Dr. Kremer said that perhaps the best way to address this in a patient who seems to be at risk is to prophylactically vaccinate the patient with the recombinant, adjuvanted zoster vaccine (Shingrix). However, this means withdrawing disease-modifying treatment from the RA patient for 3 weeks at the time of each of two vaccinations, with the possibility of flare induced by the adjuvant, he explained in an interview. The risks and benefits of this approach have not been investigated, he noted, and the Corrona data he studied came almost entirely from the period before Shingrix came onto the U.S. market following its approval in late 2017.
Dr. Kremer has been a consultant to and has received research funding from Pfizer, the company that markets tofacitinib. He has been a consultant to AbbVie, Amgen, Bristol-Myers Squibb, Genentech, and Regeneron/Sanofi, and has received research funding from AbbVie, Eli Lilly, Genentech, and Novartis. One of the coauthors on the report is a Pfizer employee.
SOURCE: Kremer JM et al. Ann Rheum Dis. Jun 2019;78(Suppl 2):82-3; Abstract OP0028. doi: 10.1136/annrheumdis-2019-eular.621.
REPORTING FROM THE EULAR 2019 CONGRESS
CDC activates Emergency Operations Center for Congo Ebola outbreak
in the Democratic Republic of the Congo (DRC). With over 2,000 confirmed cases, the outbreak is the second largest ever recorded.
It recently spread to neighboring Uganda, by a family who crossed the border from the DRC.
As of June 11, 187 CDC staff have completed 278 deployments to the DRC, Uganda, and other neighboring countries, as well as to the World Health Organization in Geneva.

“We are activating the Emergency Operations Center at CDC headquarters to provide enhanced operational support to our” Ebola response team in the Congo. The level 3 activation – the lowest level – “allows the agency to provide increased operational support” and “logistics planning for a longer term, sustained effort,” CDC said in a press release.
Activation “does not mean that the threat of Ebola to the United States has increased.” The risk of global spread remains low, CDC said.
The outbreak is occurring in an area of armed conflict and other problems that complicate public health efforts and increase the risk of disease spread.
in the Democratic Republic of the Congo (DRC). With over 2,000 confirmed cases, the outbreak is the second largest ever recorded.
It recently spread to neighboring Uganda, by a family who crossed the border from the DRC.
As of June 11, 187 CDC staff have completed 278 deployments to the DRC, Uganda, and other neighboring countries, as well as to the World Health Organization in Geneva.
“We are activating the Emergency Operations Center at CDC headquarters to provide enhanced operational support to our” Ebola response team in the Congo. The level 3 activation – the lowest level – “allows the agency to provide increased operational support” and “logistics planning for a longer term, sustained effort,” CDC said in a press release.
Activation “does not mean that the threat of Ebola to the United States has increased.” The risk of global spread remains low, CDC said.
The outbreak is occurring in an area of armed conflict and other problems that complicate public health efforts and increase the risk of disease spread.
CGMs on the rise: New goals set time in range
SAN FRANCISCO – Most patients with diabetes should aim to spend at least 17 hours a day – more than 70% of their time – in a blood glucose range of 70-180 mg/dL, according to
Time spent below 70 mg/dL should be less than 1 hour a day, under 4% of the time in other words, and time spent below 54 mg/dL – the cut point for potentially serious hypoglycemia – less than 15 minutes (1%). Time spent at or above 180 mg/dL should be less than 6 hours (25%) a day, and above 250 mg/dL – the cut point for potentially serious hyperglycemia – less than 1 hour and 15 minutes (5%).
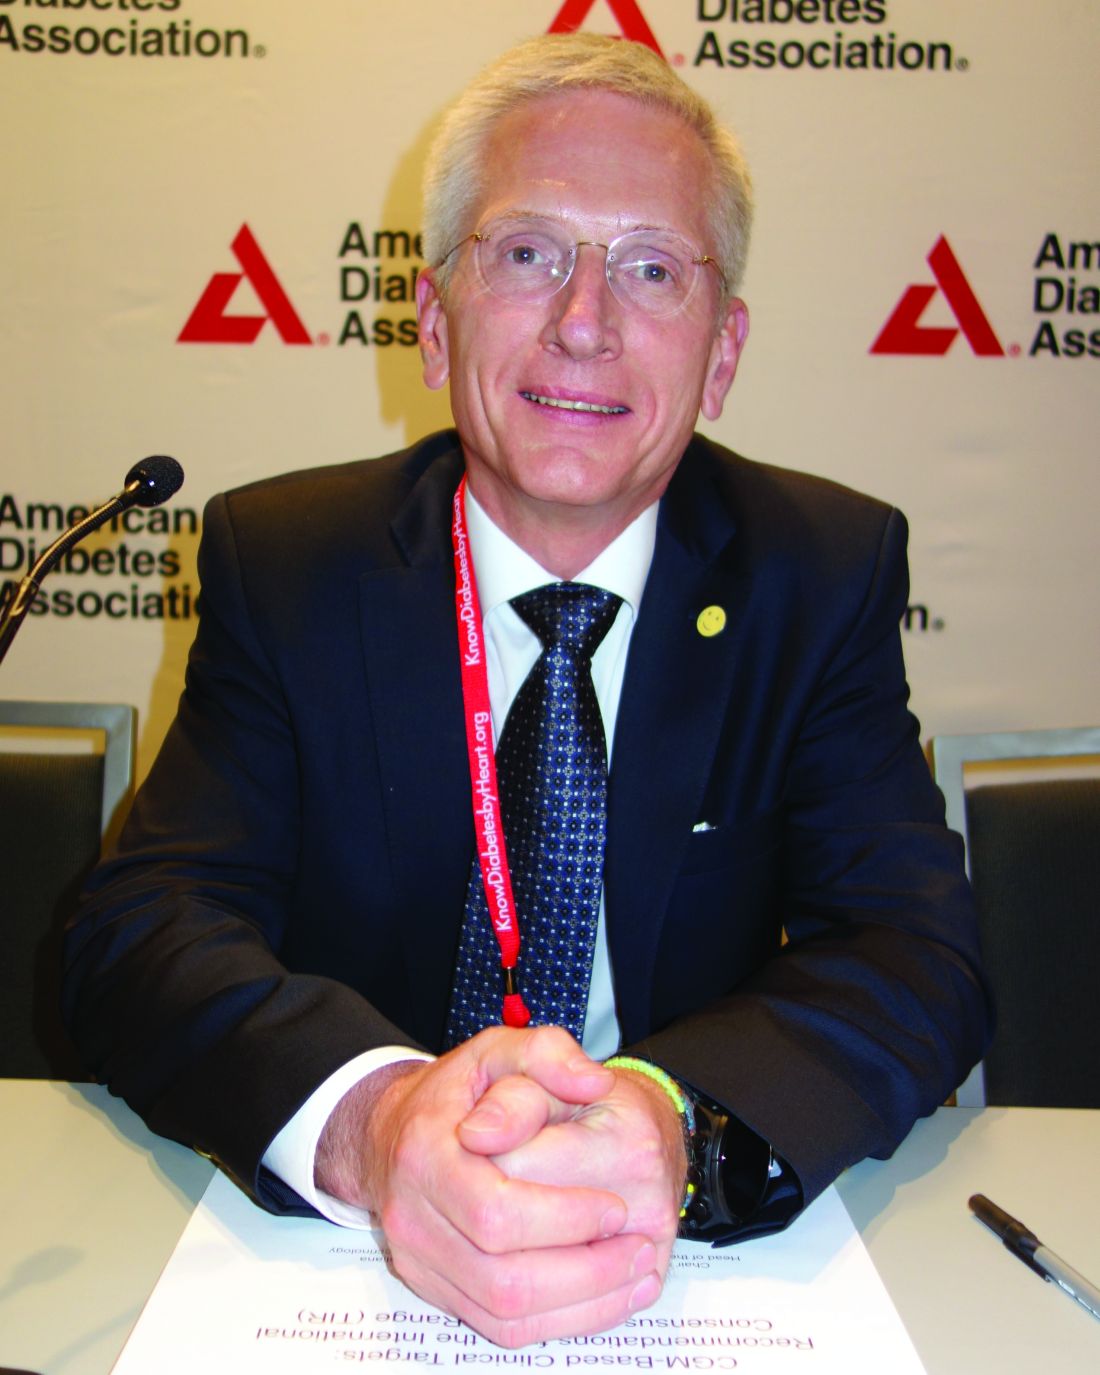
The advice comes from an international panel of diabetologists, researchers, and patients convened at the Advanced Technologies and Treatments for Diabetes Congress in Berlin earlier this year.
The goal was to give clinicians and patients handy treatment targets for continuous glucose monitors (CGMs), something that has been missing until now. The targets “should be considered an integral component of CGM data analysis and day-to-day treatment decision making,” said lead author Tadej Battelino, MD, PhD, head of the department of pediatric and adolescent endocrinology at Ljubljana (Slovenia) University, who presented the guidelines at the meeting.
The ADA, the European Association for the Study of Diabetes, and other leading diabetes groups have endorsed them.
CGMs have always offered the promise of tighter glycemic control, and their use is expanding, but they still have not led to a robust improvement in diabetes management, and in at least one study, they actually deteriorated control. There has been doubt about how to use them.
Dr. Battelino and associates thought that the main problem was a lack of clear, easy-to-understand treatment goals. The ADA and others previously recommended a CGM target of 70-180 mg/dL, but stopped short of saying how long people should be in that and other ranges. The new guidelines close the gap by adding the key element of duration.
“We ... pretty much defined what we believe is a safe way to live with diabetes,” Dr. Battelino said at the meeting. The work was based on literature review and expert opinion.
He and his colleagues noted in their journal write-up that for many the goals will be aspirational, but patients and doctors should not give up. The important thing is incremental change, with the hope of eventually meeting the targets. Even a small time-in-range increase reduces the risk of retinopathy and nephropathy, and improves hemoglobin A1c levels.

“You don’t have to get there all at once. Everyone needs to know that, whether they’re 14 or 44,” said coauthor Irl B. Hirsch, MD, chair of diabetes treatment and teaching at the University of Washington, Seattle, who moderated Dr. Battelino’s presentation.
To make the guidelines operational, the team created a simple, intuitive version of the ambulatory glucose profile they hope will be accepted as the new standard by CGM makers and included in device software. It reports the percentage of time in the 70-180 mg/dL range in green, the percentage below range in red, and the percentage above range in yellow. With a glance, both patients and doctors will know what is going on day by day, and what, if anything, needs to change.
The time-in-range bar was set at 50% for older and sicker patients, but their time-below-range goal was reduced from 4% to 1%, to emphasize the need to prevent hypoglycemia.
The target range was lowered for pregnant women to 63-140 mg/dL at least 70% of the time, because blood glucose levels are lower in pregnancy. However, “greater emphasis should be placed on getting to goal as soon as possible” with pregnant women and those planning to get pregnant, the panel said.
The work was funded by a number of companies, including Abbott, AstraZeneca, Dexcom, Eli Lilly, Medtronic, and Novo Nordisk. Dr. Battelino, Dr. Hirsch, and their coauthors reported various ties to those and other companies.
SOURCE: Battelino T et al. Diabetes Care. 2019 Jun 8. doi: 10.2337/dci19-0028.
SAN FRANCISCO – Most patients with diabetes should aim to spend at least 17 hours a day – more than 70% of their time – in a blood glucose range of 70-180 mg/dL, according to
Time spent below 70 mg/dL should be less than 1 hour a day, under 4% of the time in other words, and time spent below 54 mg/dL – the cut point for potentially serious hypoglycemia – less than 15 minutes (1%). Time spent at or above 180 mg/dL should be less than 6 hours (25%) a day, and above 250 mg/dL – the cut point for potentially serious hyperglycemia – less than 1 hour and 15 minutes (5%).
The advice comes from an international panel of diabetologists, researchers, and patients convened at the Advanced Technologies and Treatments for Diabetes Congress in Berlin earlier this year.
The goal was to give clinicians and patients handy treatment targets for continuous glucose monitors (CGMs), something that has been missing until now. The targets “should be considered an integral component of CGM data analysis and day-to-day treatment decision making,” said lead author Tadej Battelino, MD, PhD, head of the department of pediatric and adolescent endocrinology at Ljubljana (Slovenia) University, who presented the guidelines at the meeting.
The ADA, the European Association for the Study of Diabetes, and other leading diabetes groups have endorsed them.
CGMs have always offered the promise of tighter glycemic control, and their use is expanding, but they still have not led to a robust improvement in diabetes management, and in at least one study, they actually deteriorated control. There has been doubt about how to use them.
Dr. Battelino and associates thought that the main problem was a lack of clear, easy-to-understand treatment goals. The ADA and others previously recommended a CGM target of 70-180 mg/dL, but stopped short of saying how long people should be in that and other ranges. The new guidelines close the gap by adding the key element of duration.
“We ... pretty much defined what we believe is a safe way to live with diabetes,” Dr. Battelino said at the meeting. The work was based on literature review and expert opinion.
He and his colleagues noted in their journal write-up that for many the goals will be aspirational, but patients and doctors should not give up. The important thing is incremental change, with the hope of eventually meeting the targets. Even a small time-in-range increase reduces the risk of retinopathy and nephropathy, and improves hemoglobin A1c levels.
“You don’t have to get there all at once. Everyone needs to know that, whether they’re 14 or 44,” said coauthor Irl B. Hirsch, MD, chair of diabetes treatment and teaching at the University of Washington, Seattle, who moderated Dr. Battelino’s presentation.
To make the guidelines operational, the team created a simple, intuitive version of the ambulatory glucose profile they hope will be accepted as the new standard by CGM makers and included in device software. It reports the percentage of time in the 70-180 mg/dL range in green, the percentage below range in red, and the percentage above range in yellow. With a glance, both patients and doctors will know what is going on day by day, and what, if anything, needs to change.
The time-in-range bar was set at 50% for older and sicker patients, but their time-below-range goal was reduced from 4% to 1%, to emphasize the need to prevent hypoglycemia.
The target range was lowered for pregnant women to 63-140 mg/dL at least 70% of the time, because blood glucose levels are lower in pregnancy. However, “greater emphasis should be placed on getting to goal as soon as possible” with pregnant women and those planning to get pregnant, the panel said.
The work was funded by a number of companies, including Abbott, AstraZeneca, Dexcom, Eli Lilly, Medtronic, and Novo Nordisk. Dr. Battelino, Dr. Hirsch, and their coauthors reported various ties to those and other companies.
SOURCE: Battelino T et al. Diabetes Care. 2019 Jun 8. doi: 10.2337/dci19-0028.
REPORTING FROM ADA 2019
Breast cancer linked to 23% higher risk for new diabetes
SAN FRANCISCO – a new Danish study finds.
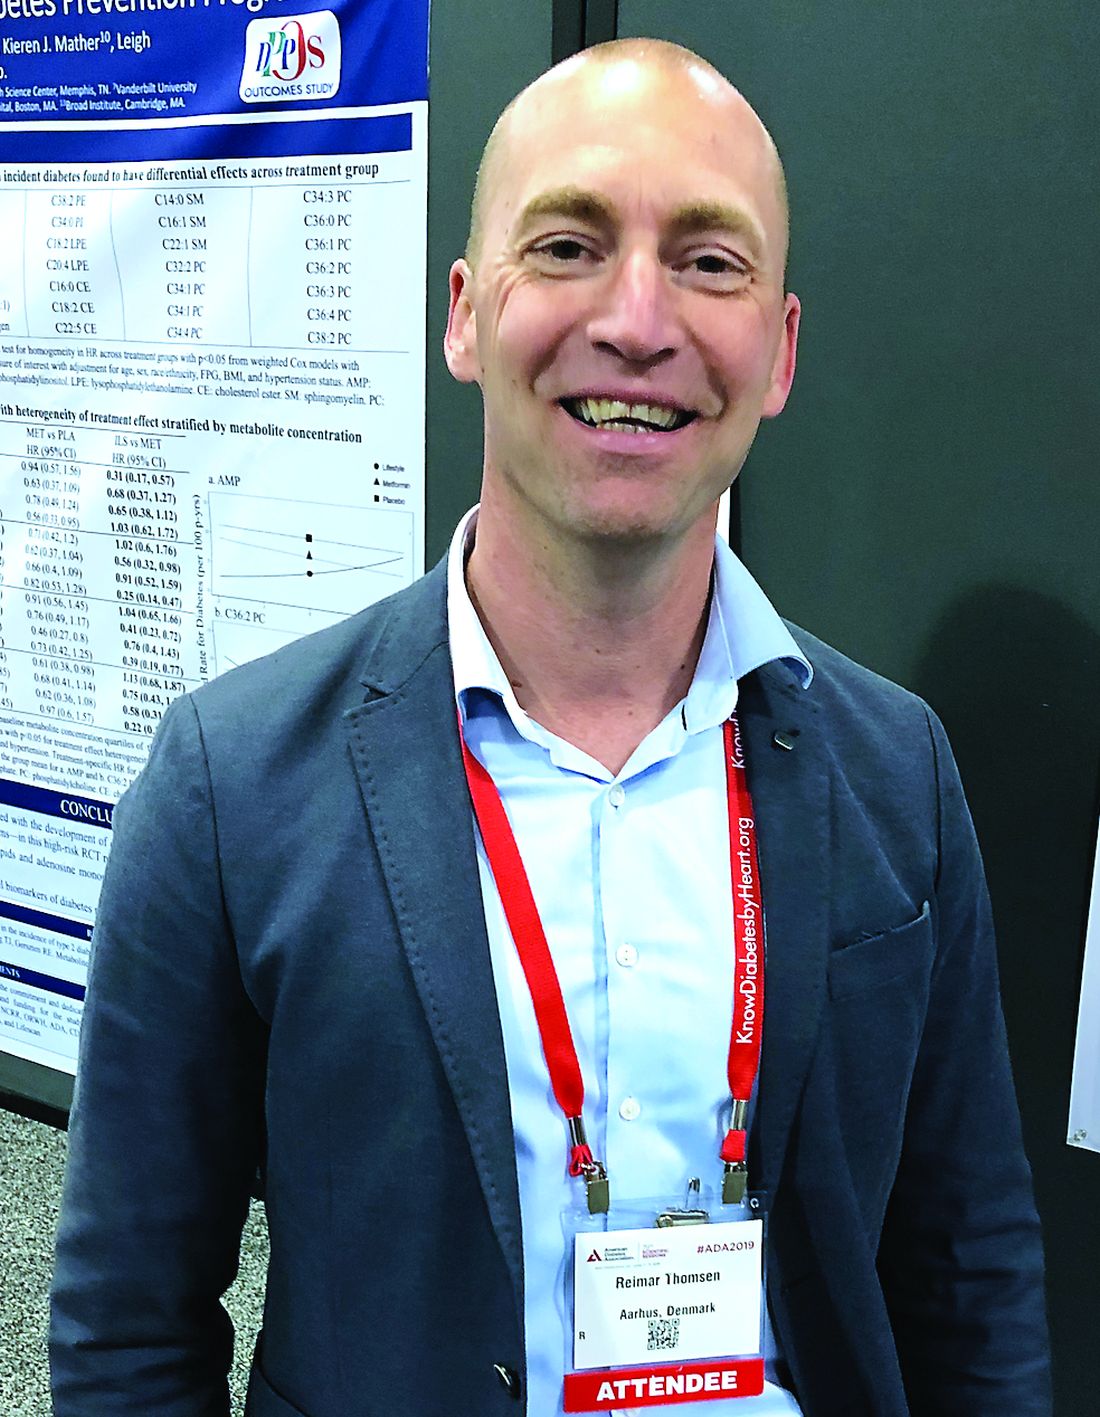
The findings are “quite a clear signal of increased diabetes following breast cancer,” said epidemiologist and study coauthor Reimar W. Thomsen, MD, PhD, of Aarhus (Denmark) University Hospital, in an interview. “It’s very important to tell [patients with breast cancer] what they may expect in the long term.”
He spoke at the annual scientific sessions of the American Diabetes Association, where he presented the study findings.
Much of the research into links between breast cancer and diabetes has focused on whether diabetes is a risk factor for breast cancer, and not the other way around. A 2018 meta-analysis of 18 studies found a slightly higher risk of breast cancer in women with diabetes (summary relative risk, 1.13; 95% confidence interval, 1.04-1.24). However, the researchers found evidence that the risk factor might be adiposity, and not diabetes itself (Diabetes. 2018 Jul;67[Supplement 1]. doi: 10.2337/db18-180-OR).
For the new study, researchers used health registries to track women in Denmark for up to 12 years, during 2005-2016. They compared 33,909 women who were older than 50 years and who had new-onset breast cancer with 313,998 women without breast cancer in a matched comparison cohort. The average age in both groups was 66 years; obesity was rare (4% vs. 3%, respectively), but statin therapy (21% in both groups) and hormone replacement therapy (36% vs. 32%) were more prevalent.
In the first year after a breast cancer diagnosis, the women in the breast cancer group were 15% more likely to develop diabetes (per use of diabetes medication or hospital-diagnosed diabetes) than those in the comparison group (adjusted hazard ratio, 1.15; 95% CI, 1.01-1.30) with adjustments for factors such as age, marital status, residence, medical history, medications, and comorbidity.
Over a median follow-up period of 5.2 years, the risk of diabetes was 23% higher in the breast cancer group, at 8.4 new cases per 1,000 women, compared with 6.8 new cases per 1,000 women in the comparison group (aHR, 1.23; 95% CI, 1.16-1.30). Unadjusted hazard ratios were similar.
Women in the breast cancer group who developed diabetes were more likely to use insulin-based therapy, suggesting they had more severe diabetes, compared with those in the control group (5% vs. 2%, respectively; P less than .00001). They were also more likely to be treated with insulin only (4% vs. 1%, P less than .00001).
It is not clear why patients with breast cancer face a higher risk of diabetes. Dr. Thomsen speculated that cancer drugs might play a role and he noted that cancer itself can cause inflammation and “lead to consequences.”
A 2018 study linked usage of hormone therapies, including tamoxifen (HR, 2.25; 95% CI, 1.19-4.26; P = .013) and aromatase inhibitors (HR, 4.27;95% CI, 1.42-12.84), in patients with breast cancer to higher levels of diabetes, compared with patients who did not use hormone therapy (J Clin Oncol. 2018;36[20]:2061-9).
Dr. Thomsen emphasized that physicians should monitor patients with breast cancer for diabetes. “It develops over time, and the risk is increasing, so you need to be aware of that.”
No study funding was reported. One of the researchers reported numerous ties to a range of drug companies. Dr. Thomsen and the other researchers reported no relevant disclosures.
SAN FRANCISCO – a new Danish study finds.
The findings are “quite a clear signal of increased diabetes following breast cancer,” said epidemiologist and study coauthor Reimar W. Thomsen, MD, PhD, of Aarhus (Denmark) University Hospital, in an interview. “It’s very important to tell [patients with breast cancer] what they may expect in the long term.”
He spoke at the annual scientific sessions of the American Diabetes Association, where he presented the study findings.
Much of the research into links between breast cancer and diabetes has focused on whether diabetes is a risk factor for breast cancer, and not the other way around. A 2018 meta-analysis of 18 studies found a slightly higher risk of breast cancer in women with diabetes (summary relative risk, 1.13; 95% confidence interval, 1.04-1.24). However, the researchers found evidence that the risk factor might be adiposity, and not diabetes itself (Diabetes. 2018 Jul;67[Supplement 1]. doi: 10.2337/db18-180-OR).
For the new study, researchers used health registries to track women in Denmark for up to 12 years, during 2005-2016. They compared 33,909 women who were older than 50 years and who had new-onset breast cancer with 313,998 women without breast cancer in a matched comparison cohort. The average age in both groups was 66 years; obesity was rare (4% vs. 3%, respectively), but statin therapy (21% in both groups) and hormone replacement therapy (36% vs. 32%) were more prevalent.
In the first year after a breast cancer diagnosis, the women in the breast cancer group were 15% more likely to develop diabetes (per use of diabetes medication or hospital-diagnosed diabetes) than those in the comparison group (adjusted hazard ratio, 1.15; 95% CI, 1.01-1.30) with adjustments for factors such as age, marital status, residence, medical history, medications, and comorbidity.
Over a median follow-up period of 5.2 years, the risk of diabetes was 23% higher in the breast cancer group, at 8.4 new cases per 1,000 women, compared with 6.8 new cases per 1,000 women in the comparison group (aHR, 1.23; 95% CI, 1.16-1.30). Unadjusted hazard ratios were similar.
Women in the breast cancer group who developed diabetes were more likely to use insulin-based therapy, suggesting they had more severe diabetes, compared with those in the control group (5% vs. 2%, respectively; P less than .00001). They were also more likely to be treated with insulin only (4% vs. 1%, P less than .00001).
It is not clear why patients with breast cancer face a higher risk of diabetes. Dr. Thomsen speculated that cancer drugs might play a role and he noted that cancer itself can cause inflammation and “lead to consequences.”
A 2018 study linked usage of hormone therapies, including tamoxifen (HR, 2.25; 95% CI, 1.19-4.26; P = .013) and aromatase inhibitors (HR, 4.27;95% CI, 1.42-12.84), in patients with breast cancer to higher levels of diabetes, compared with patients who did not use hormone therapy (J Clin Oncol. 2018;36[20]:2061-9).
Dr. Thomsen emphasized that physicians should monitor patients with breast cancer for diabetes. “It develops over time, and the risk is increasing, so you need to be aware of that.”
No study funding was reported. One of the researchers reported numerous ties to a range of drug companies. Dr. Thomsen and the other researchers reported no relevant disclosures.
REPORTING FROM ADA 2019
In MS, children aren’t just little adults
SEATTLE – Multiple sclerosis (MS) presents quite differently in children than adults, a neurologist told colleagues, but many treatments are the same.
“We need to treat them when they’re young, perhaps, to prevent disability later on,” said Jennifer Graves, MD, PhD, director of neuroimmunology research at the University of California, San Diego, and director of the Rady Children’s Pediatric MS Clinic.
Fortunately, “they tend to respond to any DMT [disease-modifying therapy] you give them,” said Dr. Graves, who spoke at the annual meeting of the Consortium of Multiple Sclerosis Centers.
Unlike the adult version, pediatric MS is almost never progressive, she said, and the relapsing form affects 85%-99% of those with the condition.
And children with MS suffer from high relapse rates. “In some of the more recent studies, the annual relapse rates have been two to even five to six times higher than in adults,” she related.
For acute relapses, Dr. Graves recommends IV methylprednisolone as a first-line treatment. High-dose oral steroids can be appropriate in teenagers, and plasma exchange is a second-line option.
DMT does work in children. “They’re just so inflammatory, having so much activity, that they tend to respond to anything,” she noted.
With few exceptions, DMTs have been tested in children, she said. But the trials in children have tended to be small, and only fingolimod (Gilenya) is Food and Drug Administration–approved for pediatric patients (aged 10-18 years).
What’s the best DMT for kids? “There is evidence that the higher-potency drugs may work better in some patients,” Dr. Graves said. “I diagnosed a 4 year old with MS. With an annual relapse rate of 6, I had no hesitancy about jumping to the highest-potency agent I had available.”
She cautioned, however, that there may never be deep insight into the best choices because of it is not feasible to study all the available DMTs in children.
Dr. Graves offered these tips about treating children with MS:
- Be prepared to spend long periods educating children and their parents. “You think you spend a long time with your adult patients? Double it,” she said. “Most new patient appointments will be 90 minutes at least. Negotiate that time for the patients in your clinic who are very young.”
- Don’t separate kids from parents. “I discourage parents from asking their children to leave the room. Everyone should know what the choices are as much as possible and having the children on the same page can help with compliance,” Dr. Graves said.
- Consider unique safety considerations. “Children are less likely to be JC [John Cunningham] virus antibody-positive than adults, and we can feel more confident with agents that cause PML [progressive multifocal leukoencephalopathy],” she said. “But they’re more likely to convert on our watch.”
- Consider mentioning sexual function to teens. As adolescents, “they’re unsure of sexual function to begin with, and they often don’t know if they’re normal in terms of sexual function.” Don’t forget that contraceptives may be appropriate because some MS drugs are teratogenic. “Have a lengthy and realistic conversation about birth control,” Dr. Graves said, “and maybe ask the parents to leave the room.”
Dr. Graves disclosed receiving speaking honoraria from Novartis and Sanofi Genzyme, and grants from Biogen and Genentech.
EXPERT ANALYSIS FROM CMSC 2019
Painful ulcers on forehead

Based on the areas of necrosis, the FP suspected that a brown recluse spider bite caused the lesions. He suspected that the whole area of swelling and erythema was the bite reaction, and the 3 ulcerated areas were the regions of necrosis (often there is only 1 central area). The FP considered cellulitis as part of the differential diagnosis and debated whether to prescribe an antibiotic.
While the patient and FP believed that the most likely diagnosis was a spider bite, they were not completely certain of this diagnosis because the patient never saw the spider. Therefore, the patient requested an antibiotic in case this was a bacterial infection. A bacterial culture of the ulcer was performed and the patient was given a 5-day course of oral cephalexin 500 mg 4 times a day.
The FP recommended over-the-counter oral diphenhydramine to be taken around the clock as tolerated along with ibuprofen at mealtimes. The FP kept in contact with the patient by phone and improvement was noted daily. The bacterial culture came back negative, and the lesions all healed with time.
Spider bites can be difficult to diagnose as many lesions are blamed on spiders without evidence of a bite or spider. Conversely, spider bites may be missed as the spider is not typically available for easy identification. To this day, the FP and patient believe these lesions were the work of a brown recluse spider.
Photos and text for Photo Rounds Friday courtesy of Richard P. Usatine, MD. This case was adapted from: Mayeaux, EJ, Usatine R. Pyoderma gangrenosum. In: Usatine R, Smith M, Mayeaux EJ, et al. Color Atlas and Synopsis of Family Medicine. 3rd ed. New York, NY: McGraw-Hill; 2019:1147-1152.
To learn more about the newest 3rd edition of the Color Atlas and Synopsis of Family Medicine, see: https://www.amazon.com/Color-Atlas-Synopsis-Family-Medicine/dp/1259862046/
You can get the Color Atlas of Family Medicine app by clicking on this link: usatinemedia.com

Cardiothoracic & Vascular Surgeons Providing Alternative Perspectives
Cardiothoracic and vascular surgeons will – together – head for the top during the Aortic Summit, from 2 to 4:30 p.m. Saturday.
The event is presented in collaboration with the Society of Thoracic Surgeons. A similar summit at the 2017 VAM attracted hundreds of surgeons.
Several topics important to both groups of surgeons will be examined from both the cardiothoracic and vascular perspectives, said Ali Azizzadeh, MD, co-moderator with Keith Allen, MD, a member of both SVS and the STS. The session is recommended by the Society for Vascular Nursing.
“We do look at issues in different ways,” said Dr. Azizzadeh said of vascular and cardiothoracic surgeons. “We all have different tools and skill sets. That’s why it’s good to look at an issue from both perspectives and also look at the devices that apply to the other’s field.”
Speakers will cover the latest indications for procedures in patients with aortic dissection, which will segue into discussion of access complications and other issues that can occur with devices. Topics also will include alternative and newer methods of access.
Speakers and attendees also will discuss the newest technology currently in trials, recently approved, or in investigation, worldwide, he said.
The two groups will collaborate, for what Dr. Azizzadeh believes is the first time, on pulmonary embolism. “This is a hot area for innovation,” he said. “There are lots of new techniques and procedures to address currently unmet needs. Medical centers around the country are assembling multidisciplinary teams, referred to as Pulmonary Embolism Response Team or PERT – to be able to take care of these sick patients. It’s a trend for the future.”
Tickets are required and are available at the registration counter. An additional fee applies: $75 for SVS Candidate members-in-training, nonmember medical students and vascular and general surgery residents, and allied health professionals; $100 for SVS Candidate members; $150 for SVS members and $200 for nonmember physicians.
Topics and speakers include:
• Optimal Management of Uncomplicated Acute Type B Aortic Dissection, Faisal Bakaeen, MD.
• Optimal Management of Chronic Type B Aortic Dissection, Adam Beck, MD.
• Alternate Non-Femoral Vascular Access for Large Endovascular Devices, Keith Allen, MD.
• Managing Vascular Access Complications, Ross Milner, MD.
• Innovative Devices: Cardiothoracic, by Grayson Wheatly III, MD.
• Innovative Devices: Vascular, by Ali Azizzadeh, MD.
• Pulmonary Embolism Teams: Cardiothoracic perspective, by Lishan Aklog, MD.
• Pulmonary Embolism Teams: Vascular perspective, by Naveed Saqib, MD.
A discussion period will follow each set of presentations.
“It’s going to be a great session to review the latest topics that apply to both cardiothoracic and vascular surgery,” said Dr. Azizzadeh.
Saturday, June 15
2-4:30 p.m.
Gaylord National, National Harbor 2
Aortic Summit

Annual Business Meeting, for Members Only
Electing Secretary, Welcoming President, Presenting Awards
The SVS Annual Business Meeting serves a vital, mandated function, with members conducting important Society business. This year, not only will President Michel S. Makaroun, MD, hands his gavel over to President-Elect Kim Hodgson, MD, members also will elect a new secretary from among three candidates and will affirm the Nominating Committee’s selection of the candidate for vice president.
The meeting is from 12 to 1:30 p.m. Saturday, in Potomac C. Members also will receive updates from officers and select committees and recognize outstanding achievements and awards from the Journal of Vascular Surgery, SVS Foundation, and SVS.
Only Active and Senior members may vote, which will be accomplished with Audience Response System devices. Staff will be on hand to double-check membership status for those unsure of their voting status.
The following people will receive awards during the luncheon:
SVS Presidential Citation Award: Marie Rossi, RN, BS, for her leadership of the Society for Vascular Nursing and tireless work in achieving a close relationship between the SVN and the SVS; Benjamin Pearce, MD, and Tej Singh, MD, for their dedication to improve and upgrade SVS patient education materials; Sean P. Roddy, MD and Matthew Sideman, MD, for their tireless work in advocating for and protecting the interests of our specialty; Michael S. Conte, MD, John White, MD, and Joe L. Mills, MD, for their dedicated effort to complete the Global Vascular Guidelines Project; and Dawn M. Coleman, MD, and Malachi G. Sheahan III, MD, for their dedication to improving the well-being of our members and all vascular surgeons.
SVS Awards
Women’s Leadership Training Grants: Rachel Danczyk, MD, Lori Pounds, MD, and Jessica Simons, MD.
SVS Vascular Surgery Trainee Advocacy Travel Scholarship: Ian Schlieder, MD.
SVS Foundation Awards
SVS Foundation and American College of Surgeons Mentored Clinical Scientist Research Career Development Award (K08): Jean Marie Ruddy, MD.
SVS Foundation and ACS Mentored Patient-Oriented Research Career Development Award (K23): Misty D. Humphries, MD.
Bridge Grant: Wei Zhou, MD.
E.J. Wylie Traveling Fellowship: Douglas W. Jones, MD.
Clinical Research Seed Grant: Sikandar Khan, MD, Shirling Tsai, MD; and Efthymios Avgerinos, MD (winner of the Seed Grant Challenge Wednesday at VAM).
Resident Research Award: Frank Davis, MD.
Research Career Development Travel Award: Young Erben, MD, and Claire Griffin, MD.
Vascular Cures/SVS Foundation Wylie Scholar Award: Andrea Obi, MD.
Community Awareness and Prevention Project Practice Grant: Soma Brahmanandam MD, Leigh Ann O’Banion, MD, and Uwe Fisher, PhD.

Is Surveillance Futile for Small AAAs in the Very Elderly?
To determine the necessity of permanent monitoring of small aortic aneurysms in the elderly, Mark Rockley, MD, of the Ottawa Hospital and his colleagues investigated the yield of ultrasound surveillance for small abdominal aortic aneurysms (AAAs) in octogenarians, as compared with a younger population. Their goal was to detect the frequency of AAA growth reaching the threshold size for repair. Secondary objectives included analysis of the incidence of AAA repair, and the cost-effectiveness of surveillance.
In Saturday’s Scientific Session 8, Dr. Rockley will report on their retrospective cohort study performed on all patients undergoing AAA surveillance in Ottawa during 2007-2017. The patients were split into two groups by enrollment age (those younger and those equal to or older than 80 years of age) with cross-over to prevent lead-time bias, and stratification by enrollment AAA size.
The two cohorts were cross-referenced with the Ottawa Surgical Database, leveraging the common health region to assure complete data capture, according to Dr. Rockley.
The threshold size for repair was sex specific (women at 5.0cm, men at 5.5 cm) and the factors influencing AAA growth rate were assessed using multiple linear regression. Analyses with Cox proportional hazards and multiple regression models adjusted for sex and enrollment aneurysm size, and cost-effectiveness were analyzed by referencing Ontario billing codes.
The researchers found that 1,231 patients underwent serial ultrasound surveillance, of which 460 (37.4%) were octogenarians at the time of enrollment. Multiple linear regression demonstrated that old age, male sex, and smaller enrollment aneurysm size were significantly protective against AAA growth.
Overall, 355 (28.8%) subjects reached the AAA size threshold for repair, and 313 (25.4%) underwent AAA repair. Octogenarians were half as likely to reach the AAA threshold size for repair when compared with their younger counterparts, and of the 355 subjects whose AAA reached the threshold size for repair, octogenarians were half as likely to undergo elective AAA repair).
Repair of ruptured AAA was rare (0.94%) and age differences were insignificant. The cost of ultrasound surveillance alone to identify one patient who ultimately received elective AAA repair was more than four times more expensive for octogenarians with 3.0-3.9–cm enrollment aneurysms, when compared with the rest of the study sample ($12,080 vs. $2,915, in Canadian dollars, respectively), said Dr. Rockley.
“Our study showed that octogenarians are half as likely as their younger counterparts to experience aortic growth reaching th.e repair threshold size Furthermore, in the event of reaching the size threshold, octogenarians are half as likely to undergo repair, without a significantly increased risk of requiring repair for AAA rupture. In the context of patient-specific factors and wishes, surveillance of AAA less than 4cm in octogenarians is costly and unlikely to be beneficial.” Dr. Rockley concluded.
Saturday, June 15
8-9:30 a.m.
Gaylord National, Potomac A/B
S8: Scientific Session 8: SS29