User login
A bumpy virtual #ASCO20; Returning to Chicago in 2021?
Called ‘incredibly boring,’ Praised as ‘special’
CYBERSPACE – Hope Rugo, MD, was one of the would-be attendees of the American Society of Clinical Oncology annual meeting who could not access the online event on its first day, Friday, May 29.
“Such a shame – virtual ASCO is nonexistent,” tweeted Rugo, who is from the University of California, San Francisco.
The breast cancer specialist tried for more than hour before finally gaining entry in the late morning.
Not everyone was as successful.
That same day, Arjun Balar, MD, of NYU Langone Health in New York announced on Twitter that he’d quit for the day. “I give up @ASCO. Time for a cocktail.”
Don Dizon, MD, of Brown University in Providence, Rhode Island, tried repeatedly to join the meeting as a live broadcast, using his desktop and laptop computers as well as an iPad. Nothing worked. Limited to seeing data and discussions “after the fact,” Dizon looked to next year, tweeting hopefully: “... fingers crossed for an inperson #ASCO21.”
ASCO did not respond to a request for further information about the technical difficulties of the meeting’s first day.
This year’s meeting, which involved 40,000-plus attendees, was shortened to 3 days and limited to scientific presentations because of the COVID-19 pandemic. Education sessions will be held online August 8-10.
Despite those technical glitches, dozens of virtual meeting attendees praised the online effort, which was assembled in just a few months, and called out virtues such as the quick availability of video transcripts as well as the obvious benefits of low cost, zero travel, and overall convenience. But one sentiment was nearly universal: there’s nothing like the real thing.
At the same time, a Medscape Oncology online meeting poll indicated that nearly half (48%) of the 335 respondents said “no,” they do not envision themselves in person at the real thing in Chicago in 2021. About one fifth (21%) said, “yes, if there is a vaccine.” Roughly 15% said “yes,” and another 15% said “not sure right now.”
What did oncologists miss most with virtual ASCO?
Many said face-to-face (F2F) interactions. Collaboration, networking, and catching up with old friends were some of the stock F2F moments cited as losses.
Others described more idiosyncratic disappointments, including Riyaz Shah, MD, of the Kent Oncology Centre in the UK, who dismissed a future with exclusively virtual meetings.
He tweeted: “Not sustainable. We need to meet F2F. Oncology is an odd one. Exposed to human distress daily (if not hourly). [Very] few people understand what we do, fewer would do it. There aren’t many people we can talk to. I love chewing the cud with my colleagues who are close friends.”
The virtual meeting inspired more social media engagement, but fewer oncologists participated, according to data from social media analytics firm Symplur. This year, 1K users identified as oncologists generated 17.75K tweets. In 2019, 1.3K oncologists put out 15.2K tweets.
Virtual meeting ‘like homework’
George Sledge, MD, of Stanford University, California, asked his 1700 Twitter followers to discuss the virtual ASCO experience, including the spotty functionality of presenter videos (a con) and eating dinner between talks (a pro).
One of his criticisms struck a nerve – that the online meeting was “like homework.”
“ ‘Feels like homework’ is the best expression I [have] read so far!” tweeted Gustavo Gössling, MD, from the Kaplan Oncology Institute in Porto Alegre, Brazil.
Yes, it feels “like studying alone,” agreed Stanford’s Lidia Schapira, MD, in a tweet.
“It’s incredibly boring – let’s bring back F2F next year,” tweeted Ioannis Gounaris, MD, Merck Group, Cambridge, UK, in response to Sledge’s request.
Sledge joined many others in saying that, ultimately, the future should include – and will demand – both virtual and in-person meetings.
What will happen with ASCO next year?
Medscape Medical News asked some virtual attendees whether they envisioned going in person to the ASCO meeting next year in Chicago.
“Counting on it,” said Harold Burstein, MD, PhD, Dana-Farber Cancer Institute, Boston. “But I also recognize that it fully depends on what happens between now and then. Vaccines. Safety of travel. Safety of large, indoor, crowded spaces.”
Despite acknowledging the uncertainty of how things will “play out,” Burstein advised: “Put it on your calendar and make reservations, and make sure the reservations are fully refundable.”
Ahmad Tarhini, MD, from the Moffitt Cancer Center in Tampa, Florida, sounded similarly optimistic: “Hopefully we will have a vaccine by then. I expect the ASCO annual meeting will happen in person in 2021.”
Moffitt colleague Michelle Echevarria Colon, MD, said, “I could see myself attending ... in Chicago in 2021.” And she added: “I think we’ll get to a point where it could happen.”
Others were uncertain.
Ishwaria Subbiah, MD, University of Texas MD Anderson Cancer Center, Houston, said: “If someone told us 6 months ago that our ‘new normal’ would be in this near-total virtual existence, most of us would not have believed them. So it is hard to imagine what our reality will be in a year from now at ASCO 2021.”
Jack West, MD, from City of Hope Comprehensive Cancer Center in Duarte, California, thinks the meeting will be changed for a long time, even if 2021 is a live event.
“While I think that there MIGHT be a live conference, I think it will be many years, if ever, before we see it return to its prior magnitude,” he wrote in an email, echoing remarks previously made by other healthcare professionals about medical meetings in any post–COVID-19 world.
A year from now, said West, “I strongly suspect that we will still be contending with risk of exposure” and that means clinician attendees might, in turn, expose their cancer patients back home.
Despite his wistful “fingers crossed” tweet during ASCO 2020, Brown’s Dizon also recently commented on Medscape that “I wonder whether I will ever sit in a crowded auditorium at an ASCO annual meeting again.”
Sagar Sardesai, MBBS, Ohio State Comprehensive Cancer Center, Columbus, responded: “Unless we have a vaccine that is successful or we can demonstrate enough herd immunity in the United States, I can’t imagine that such large gatherings are a real possibility. We need to protect our vulnerable populations.”
City of Hope’s Cary Presant, MD, acknowledged he is one of those vulnerable people. “In 2021, if the environment is safe for oncologists of my age, I will be in Chicago,” he said. “But with COVID-19 still a threat, I might have to attend only virtually.”
“This year was special”
On social media, MD Anderson’s Vivek Subbiah, MD, did not speculate about next year’s meeting but observed the uniqueness of the current moment.
He tweeted: “The last 8 years of @asco are a blur in my memory. This year #ASCO was special, and I’m sure we will all remember where we were for this year’s meeting.”
Other oncologists praised the accessibility of the virtual meeting.
“The power of a virtual meeting is it creates an unlimited number of seats at the oncology research table. Anyone globally can be involved and that is really special,” said Suneel Kamath, MD, Cleveland Clinic, Ohio.
“Virtual ASCO levels the playing field for oncologists everywhere,” says Bishal Gyawali, MD, PhD, from Queen’s University, Kingston, Canada. In a Medscape Commentary, he notes that “attending a typical ASCO meeting is astonishingly cost-prohibitive, especially for colleagues from low- and middle-income countries ... now everybody has the same access to the meeting.”
ASCO made the best out of a bad situation with the expanded virtual meeting, suggested David Henry, MD, Pennsylvania Hospital, Philadelphia, host of MDEdge’s Blood and Cancer podcast, part of the Medscape Professional Network. In an interview with ASCO president Skip Burris, MD, before the meeting, Henry said: “Making lemonade out of lemons. It’ll give us something new and different. What an amazing turn of events.”
With additional reporting by Zosia Chustecka , Liz Neporent, Neil Osterweil, and Jennifer Smith. This article first appeared on Medscape.com.
Called ‘incredibly boring,’ Praised as ‘special’
Called ‘incredibly boring,’ Praised as ‘special’
CYBERSPACE – Hope Rugo, MD, was one of the would-be attendees of the American Society of Clinical Oncology annual meeting who could not access the online event on its first day, Friday, May 29.
“Such a shame – virtual ASCO is nonexistent,” tweeted Rugo, who is from the University of California, San Francisco.
The breast cancer specialist tried for more than hour before finally gaining entry in the late morning.
Not everyone was as successful.
That same day, Arjun Balar, MD, of NYU Langone Health in New York announced on Twitter that he’d quit for the day. “I give up @ASCO. Time for a cocktail.”
Don Dizon, MD, of Brown University in Providence, Rhode Island, tried repeatedly to join the meeting as a live broadcast, using his desktop and laptop computers as well as an iPad. Nothing worked. Limited to seeing data and discussions “after the fact,” Dizon looked to next year, tweeting hopefully: “... fingers crossed for an inperson #ASCO21.”
ASCO did not respond to a request for further information about the technical difficulties of the meeting’s first day.
This year’s meeting, which involved 40,000-plus attendees, was shortened to 3 days and limited to scientific presentations because of the COVID-19 pandemic. Education sessions will be held online August 8-10.
Despite those technical glitches, dozens of virtual meeting attendees praised the online effort, which was assembled in just a few months, and called out virtues such as the quick availability of video transcripts as well as the obvious benefits of low cost, zero travel, and overall convenience. But one sentiment was nearly universal: there’s nothing like the real thing.
At the same time, a Medscape Oncology online meeting poll indicated that nearly half (48%) of the 335 respondents said “no,” they do not envision themselves in person at the real thing in Chicago in 2021. About one fifth (21%) said, “yes, if there is a vaccine.” Roughly 15% said “yes,” and another 15% said “not sure right now.”
What did oncologists miss most with virtual ASCO?
Many said face-to-face (F2F) interactions. Collaboration, networking, and catching up with old friends were some of the stock F2F moments cited as losses.
Others described more idiosyncratic disappointments, including Riyaz Shah, MD, of the Kent Oncology Centre in the UK, who dismissed a future with exclusively virtual meetings.
He tweeted: “Not sustainable. We need to meet F2F. Oncology is an odd one. Exposed to human distress daily (if not hourly). [Very] few people understand what we do, fewer would do it. There aren’t many people we can talk to. I love chewing the cud with my colleagues who are close friends.”
The virtual meeting inspired more social media engagement, but fewer oncologists participated, according to data from social media analytics firm Symplur. This year, 1K users identified as oncologists generated 17.75K tweets. In 2019, 1.3K oncologists put out 15.2K tweets.
Virtual meeting ‘like homework’
George Sledge, MD, of Stanford University, California, asked his 1700 Twitter followers to discuss the virtual ASCO experience, including the spotty functionality of presenter videos (a con) and eating dinner between talks (a pro).
One of his criticisms struck a nerve – that the online meeting was “like homework.”
“ ‘Feels like homework’ is the best expression I [have] read so far!” tweeted Gustavo Gössling, MD, from the Kaplan Oncology Institute in Porto Alegre, Brazil.
Yes, it feels “like studying alone,” agreed Stanford’s Lidia Schapira, MD, in a tweet.
“It’s incredibly boring – let’s bring back F2F next year,” tweeted Ioannis Gounaris, MD, Merck Group, Cambridge, UK, in response to Sledge’s request.
Sledge joined many others in saying that, ultimately, the future should include – and will demand – both virtual and in-person meetings.
What will happen with ASCO next year?
Medscape Medical News asked some virtual attendees whether they envisioned going in person to the ASCO meeting next year in Chicago.
“Counting on it,” said Harold Burstein, MD, PhD, Dana-Farber Cancer Institute, Boston. “But I also recognize that it fully depends on what happens between now and then. Vaccines. Safety of travel. Safety of large, indoor, crowded spaces.”
Despite acknowledging the uncertainty of how things will “play out,” Burstein advised: “Put it on your calendar and make reservations, and make sure the reservations are fully refundable.”
Ahmad Tarhini, MD, from the Moffitt Cancer Center in Tampa, Florida, sounded similarly optimistic: “Hopefully we will have a vaccine by then. I expect the ASCO annual meeting will happen in person in 2021.”
Moffitt colleague Michelle Echevarria Colon, MD, said, “I could see myself attending ... in Chicago in 2021.” And she added: “I think we’ll get to a point where it could happen.”
Others were uncertain.
Ishwaria Subbiah, MD, University of Texas MD Anderson Cancer Center, Houston, said: “If someone told us 6 months ago that our ‘new normal’ would be in this near-total virtual existence, most of us would not have believed them. So it is hard to imagine what our reality will be in a year from now at ASCO 2021.”
Jack West, MD, from City of Hope Comprehensive Cancer Center in Duarte, California, thinks the meeting will be changed for a long time, even if 2021 is a live event.
“While I think that there MIGHT be a live conference, I think it will be many years, if ever, before we see it return to its prior magnitude,” he wrote in an email, echoing remarks previously made by other healthcare professionals about medical meetings in any post–COVID-19 world.
A year from now, said West, “I strongly suspect that we will still be contending with risk of exposure” and that means clinician attendees might, in turn, expose their cancer patients back home.
Despite his wistful “fingers crossed” tweet during ASCO 2020, Brown’s Dizon also recently commented on Medscape that “I wonder whether I will ever sit in a crowded auditorium at an ASCO annual meeting again.”
Sagar Sardesai, MBBS, Ohio State Comprehensive Cancer Center, Columbus, responded: “Unless we have a vaccine that is successful or we can demonstrate enough herd immunity in the United States, I can’t imagine that such large gatherings are a real possibility. We need to protect our vulnerable populations.”
City of Hope’s Cary Presant, MD, acknowledged he is one of those vulnerable people. “In 2021, if the environment is safe for oncologists of my age, I will be in Chicago,” he said. “But with COVID-19 still a threat, I might have to attend only virtually.”
“This year was special”
On social media, MD Anderson’s Vivek Subbiah, MD, did not speculate about next year’s meeting but observed the uniqueness of the current moment.
He tweeted: “The last 8 years of @asco are a blur in my memory. This year #ASCO was special, and I’m sure we will all remember where we were for this year’s meeting.”
Other oncologists praised the accessibility of the virtual meeting.
“The power of a virtual meeting is it creates an unlimited number of seats at the oncology research table. Anyone globally can be involved and that is really special,” said Suneel Kamath, MD, Cleveland Clinic, Ohio.
“Virtual ASCO levels the playing field for oncologists everywhere,” says Bishal Gyawali, MD, PhD, from Queen’s University, Kingston, Canada. In a Medscape Commentary, he notes that “attending a typical ASCO meeting is astonishingly cost-prohibitive, especially for colleagues from low- and middle-income countries ... now everybody has the same access to the meeting.”
ASCO made the best out of a bad situation with the expanded virtual meeting, suggested David Henry, MD, Pennsylvania Hospital, Philadelphia, host of MDEdge’s Blood and Cancer podcast, part of the Medscape Professional Network. In an interview with ASCO president Skip Burris, MD, before the meeting, Henry said: “Making lemonade out of lemons. It’ll give us something new and different. What an amazing turn of events.”
With additional reporting by Zosia Chustecka , Liz Neporent, Neil Osterweil, and Jennifer Smith. This article first appeared on Medscape.com.
FROM ASCO 2020
Telemedicine: Common hurdles and proper coding for ObGyns
Since the COVID-19 pandemic began, many significant changes have occurred that have made the implementation of telemedicine easier and more attractive for gynecologic practices. In the first article in this series, we discussed the benefits of telemedicine to physicians and patients, how to get started using telemedicine, and implementing a workflow. This article will discuss the common hurdles in the process and the proper coding to use to insure reimbursement for services rendered.
Barriers to implementing telemedicine
Incorrect assumptions
Latecomers to telemedicine often assume that patients prefer face-to-face visits when, in fact, many may prefer the convenience of virtual visits. More than 50% of patients who are surveyed about their experience with telemedicine say that online tools have helped improve their relationship with their providers.1 Telemedicine has grown astronomically during the COVID-19 pandemic to the point where many patients now expect their health care providers to be able to conduct virtual visits. Practices that do not offer telemedicine may find their patients seeking services elsewhere. Nearly two-thirds of health care professionals expect their commitment to telemedicine to increase significantly in the next 3 years.2 Of those providers who have not yet adopted the practice, nearly 85% expect to implement telemedicine in the near future.3 COVID-19 has motivated the increased use of telemedicine to enhance the communication with patients, making it possible for patients to have enhanced access to health care during this pandemic while minimizing infectious transmission of COVID-19 to physicians and their staff.4
Admittedly, telemedicine is not appropriate for all patients. In general, situations that do not lend themselves to telemedicine are those for which an in-person visit is required to evaluate the patient via a physical examination, to perform a protocol-driven procedure, or provide an aggressive intervention. Additional patients for whom telemedicine may be inappropriate include those with cognitive disorders, those with language barriers, those with emergency situations that warrant an office visit or a visit to the emergency department, and patients who do not have access to the technology to conduct a virtual visit.
Cost and complexity
The process of implementing electronic health records (EHRs) left a bitter taste in the mouths of many health care professionals. But EHRs are complicated and expensive. Implementation often resulted in lost productivity. Because the learning curve was so steep, many physicians had to decrease the number of patients they saw before becoming comfortable with the conversion from paper charts to an EHR.
Telemedicine implementation is much less onerous and expensive. Telemedicine is available as a cloud-based platform, which requires less information technology (IT) support and less hardware and software. The technology required for patients to participate in telemedicine is nearly ubiquitous. According to the Pew Research Center, 96% of Americans own a cell phone (81% have a smart phone), and more than half (52%) own a tablet, so the basic equipment to connect patients to providers is already in place.5
On the provider side, the basic equipment required for a telemedicine program is a computer with video and audio capabilities and a broadband connection that is fast enough to show video in real time and to provide high-quality viewing of any images to be reviewed.
The growth in telemedicine means that telemedicine options are now more diverse, with many more affordable solutions. However, most telemedicine programs do require the purchase and set-up of new technology and equipment and the training of staff—some of which may be outside the budgets of health care providers in smaller independent practices. Many gynecologists have technology budgets that are already stretched thin. And for patients who do not have access to a smartphone or computer with Internet access, real-time telemedicine may be out of reach.
But with new guidelines put forth by the Centers for Medicare and Medicaid Services (CMS) in March 2020, connectivity can take place inexpensively using free platforms such as Google Hangouts, Skype, Facetime, and Facebook Messenger. If a non‒HIPAA-compliant platform is used initially, conversion to a HIPAA-compliant platform is recommended.6 These platforms do not require the purchase of, or subscription to, any expensive hardware or software. The disadvantages of these programs are the lack of documentation, the failure to be Health Insurance Portability and Accountability Act (HIPAA)-compliant, and the lack of encryption; however, these disadvantages are no longer an issue after the new CMS guidelines.
Depending on the magnitude of the program, IT assistance may be needed to get started. It is imperative that the telemedicine program is interoperable with the EHR and the billing program. Otherwise, double and triple entry will erase the efficiency provided by conducting a virtual visit.
Continue to: Licensing...
Licensing
Another concern or barrier is a license to participate in telemedicine. The March 15, 2020, approval of telemedicine states that physicians who are licensed in the state where the patient is located do not require any additional license or permission to conduct virtual visits.7 CMS has temporarily waived the requirement that out-of-state providers be licensed in the state where they are providing services when they are licensed in another state. For questions regarding licensure, contact your State Board of Medicine or Department of Health for information on requirements for licenses across state lines (see “Resources,” at the end of the article).
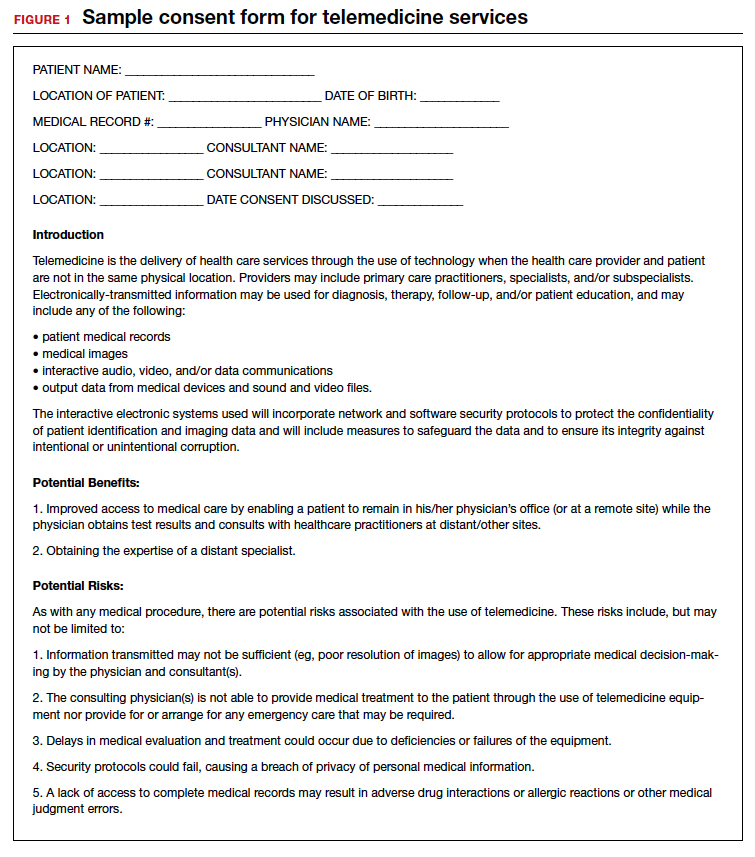
Informed consent
Just like with any other aspect of providing care for patients, obtaining informed consent is paramount. Not only is getting informed patient consent a recommended best practice of the American Telemedicine Association (ATA), but it is actually a legal requirement in many states and could be a condition of getting paid, depending on the payer. To check the requirements regarding patient consent in your state, look at The National Telehealth Policy Resource Center’s state map (see “Resources.")
Some states do not have any requirements regarding consent for a virtual visit. Others require verbal consent. Even if it is not a legal requirement in your state, consider making it a part of your practice’s policy to obtain written or verbal consent and to document in the patient’s record that consent was obtained prior to the virtual visit so that you are protected when using this new technology.
Because telemedicine is a new way of receiving care for many patients, it is important to let them know how it works including how patient confidentiality and privacy are handled, what technical equipment is required, and what they should expect in terms of scheduling, cancellations, and billing policies. A sample consent form for telemedicine use is shown in FIGURE 1.
Liability insurance
Another hurdle that must be considered is liability insurance for conducting virtual visits with patients. Gynecologists who are going to offer telemedicine care to patients should request proof in writing that their liability insurance policy covers telemedicine malpractice and that the coverage extends to other states should the patient be in another state from the state in which the gynecologist holds a license. Additionally, gynecologists who provide telemedicine care should check with liability insurers regarding any requirements or limitations to conducting a virtual visit with their patients and should document them. For example, the policy may require that the physician keep a written or recorded record of the visit in the EHR. If that is the case, then using Skype, Facebook, or Google for the virtual visit, which do not include documentation, would be less desirable.
Privacy
Certainly, there is concern about privacy, and HIPAA compliance is critical to telemedicine success. Because of the COVID-19 emergency, as of March 1, 2020, physicians may now communicate with patients, and provide telehealth services, through remote communications without penalties.8 With these changes in the HIPAA requirements, physicians may use applications that allow for video chats, including Apple FaceTime, Facebook Messenger video chat, Google Hangouts video, and Skype, to provide telehealth without risk that the Office for Civil Rights will impose a penalty for noncompliance with HIPAA rules. The consent for patients should mention that these “public” applications potentially introduce privacy risks. This is a motivation for gynecologists to consider one of the programs that promises encryption, privacy, and HIPAA compliance, such as Updox, Doxy.me, and Amazon Chime. It is also important to recognize that a virtual visit could result in colleagues (if the patient is in an office setting) or family members (if the patient is in the home environment) overhearing conversations between the health care professional and the patient. Therefore, we suggest that patients conduct virtual visits in locations in which they feel assured of some semblance of privacy.
Continue to: Compensation for telemedicine...
Compensation for telemedicine
Perhaps the biggest barrier to virtual health adoption has been compensation for telemedicine visits. Both commercial payers and CMS have been slow to enact formal policies for telemedicine reimbursement. Because of this, the common misconceptions (that providers cannot be reimbursed for telemedicine appointments or that compensation occurs at a reduced rate) have persisted, making telemedicine economically unappealing.
The good news is that this is changing; legislation in most states is quickly embracing virtual health visits as a result of the COVID-19 pandemic.9 In fact, as of January 1, 2020, telemedicine services are no longer considered “optional” coverage in Medicare Advantage plans.10 Nor are they required to have an additional fee. Instead, CMS now allows telemedicine as a standard, covered benefit in all plans, enabling beneficiaries to seek care from their homes rather than requiring them to go to a health care facility.11 In the past, telemedicine was restricted for use in rural areas or when patients resided a great distance from their health care providers. Starting March 6, 2020, and for the duration of the COVID-19 public health emergency, Medicare will make payment for professional services furnished to beneficiaries in all areas of the country in all settings regardless of location or distance between the patient and the health care provider.12
In addition, since March 15, 2020, CMS has expanded access to telemedicine services for all Medicare beneficiaries—not just those who have been diagnosed with COVID-19.13 The expanded access also applies to pre-COVID-19 coverage from physician offices, skilled nursing facilities, and hospitals. This means that Medicare will now make payments to physicians for telemedicine services provided in any health care facility or in a patient’s home, so that patients do not need to go to the physician’s office.
The facts are that there are parity laws and that commercial payers and CMS are required by state law to reimburse for telemedicine—often at the same rate as that for a comparable in-person visit. On the commercial side, there has been an increase in commercial parity legislation that requires health plans to cover virtual visits in the same way they cover face-to-face services. With the new guidelines for reimbursement, every state and Washington DC has parity laws in place. (To stay abreast of state-by-state changes in virtual health reimbursement, the Center for Connected Health Policy and the Advisory Board Primer are valuable resources. See “Resources.”) As long as the provider performs and documents the elements of history and decision-making, including the time spent counseling, and documents the visit as if a face-to-face visit occurred, then clinicians have a billable evaluation and management (E&M) visit.
Continue to: Virtual services for Medicare patients...
Virtual services for Medicare patients
There are 3 main types of virtual services gynecologists can provide to Medicare patients: Medicare telehealth visits, virtual check-ins, and e-visits.
Medicare telehealth visits. Largely because of the COVID-19 pandemic, Medicare patients may now use telecommunication technology for any services that previously occurred in an in-person communication. The gynecologist must use an interactive audio and video telecommunications system that permits real-time communication between the physician and the patient, and the patient should have a prior established relationship with the gynecologist with whom the telemedicine visit is taking place. The new guidelines indicate that the US Department of Health and Human Services (HHS) will not conduct audits to ensure that such a prior relationship exists for claims submitted during this public health emergency.14
The Current Procedural Terminology (CPT) codes for virtual visits using synchronous audio/visual communication are:
- 99201-99295, Office visit for a new patient
- 99211-99215, Office visit for an established patient.
Important modifiers for telemedicine visits include:
- modifier 02 for POS (place of service) for telehealth Medicare
- modifier 95 for commercial payers.
(A list of all available CPT codes for telehealth services from CMS can be found in “Resources.”)
Virtual check-ins. Established Medicare patients may have a brief communication with gynecologists the traditional way using a telephone or via live video. These brief virtual services, usually 5 to 10 minutes in duration, are initiated by the patient. The purpose of the virtual check-in is to determine if an office visit or a test or procedure is indicated.
Medicare pays for these “virtual check-ins” (or brief communication technology-based services) for patients to communicate with their physicians and avoid unnecessary trips to the office. These brief virtual check-ins are only for established patients. If an existing patient contacts the gynecologist’s office to ask a question or determine if an office visit is necessary, the gynecologist may bill for it using code G2012.
E-visits. Established Medicare patients may have non–face-to-face patient-initiated communications with their gynecologists without going to the physician’s office. These services can be billed only when the physician has an established relationship with the patient. The services may be billed using CPT codes 99421 to 99423. Coding for these visits is determined by the length of time the gynecologist spends online with the patient:
- 99421: Online digital evaluation and management service, for an established patient 5 to 10 minutes spent on the virtual visit
- 99422: 11 to 20 minutes
- 99423: ≥ 21 minutes.
Many clinicians want to immediately start the communication process with their patients. Many will avail themselves of the free video communication offered by Google Hangouts, Skype, Facetime, and Facebook Messenger. Since the March 15, 2020, relaxation of the HIPAA restrictions for telemedicine, it is now possible to have a virtual visit with a patient using one of the free, non–HIPAA-compliant connections. This type of visit is no different than a telephone call but with an added video component. Using these free technologies, a gynecologist can have an asynchronous visit with a patient (referred to as the store and forward method of sending information or medical images), which means that the service takes place in one direction with no opportunity for interaction with the patient. Asynchronous visits are akin to video text messages left for the patient. By contrast, a synchronous or real-time video visit with a patient is a 2-way communication that provides medical care without examining the patient.
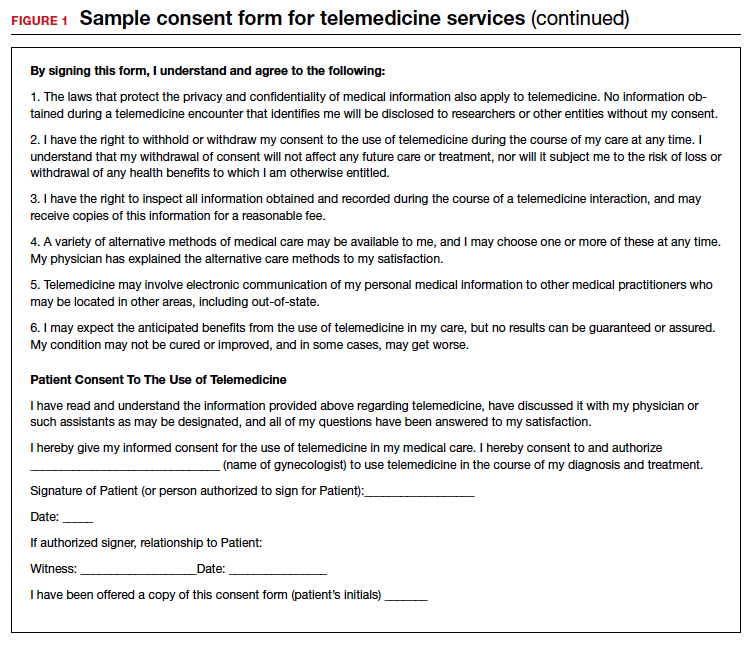
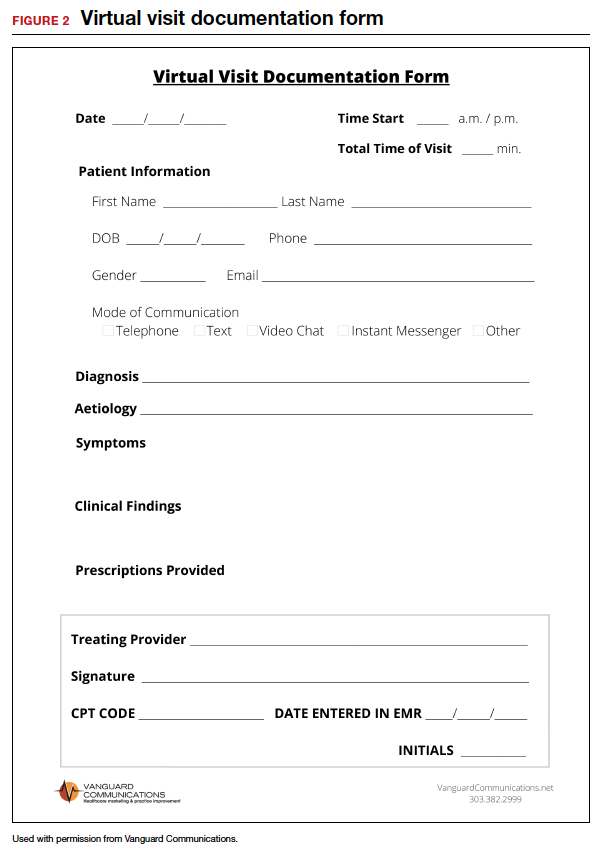
Using triangulation
There are some downsides to telemedicine visits. First, virtual visits on Skype, FaceTime, and other non–HIPAA-compliant methods are not conducted on an encrypted website. Second, no documentation is created for the doctor-patient encounter. Finally, unless the physician keeps a record of these virtual visits and submits the interactions to the practice coders, there will be no billing and no reimbursement for the visits. In this scenario, physicians are legally responsible for their decision-making, prescription writing, and medical advice, but do not receive compensation for their efforts.
This can be remedied by using “triangulation,” which involves: 1. the physician, 2. the patient, and 3. a scribe or medical assistant who will record the visit. Before initiating the virtual visit using triangulation, it is imperative to ask the patient for permission if your medical assistant (or any other person in the office who functions as a scribe) will be listening to the conversation. It is important to explain that the person is there to take accurate notes and ascertain that the notes are entered into the EHR. Also, the scribe or assistant will record the time, date, and duration of the visit, which is a requirement for billing purposes. The scribe may also ascertain that the visit is properly coded and entered into the practice management system, and that a bill is submitted to the insurance company. By using triangulation, you have documentation that consent was obtained, that the visit took place, that notes were taken, and that the patient’s insurance company will be billed for the visit (see FIGURE 2 for a sample documentation form).
Continue to: Which CPT codes should I use?...
Which CPT codes should I use?
The answer depends on a number of factors, but a good rule of thumb is to use the same codes that you would use for an in-person appointment (CPT codes 99211-99215 for an established patient visit and 99201-99205 for a new patient visit). These are the most common CPT codes for outpatient gynecologic office visits whether they take place face-to-face or as a synchronous virtual visit (via a real-time interactive audio and video telecommunications system).
For example, the reimbursement for code 99213 has a range from $73 to $100. You may wonder how you can achieve the complexity requirements for a level-3 office visit without a physical examination. Whether as a face-to-face or virtual visit, documentation for these encounters requires 2 of 3 of the following components:
- expanded problem-focused history
- expanded problem-focused exam (not accomplished with telemedicine)
- low-complexity medical decision-making OR
- at least 15 minutes spent face to face with the patient if coding is based on time.
If a gynecologist reviews the results of a recent lab test for an estrogen-deficient patient and adjusts the estrogen dosage, writes a prescription, and spends 15 minutes communicating with the patient, he/she has met the complexity requirements for a code 99213. Because Level 3 and 4 visits (99214 and 99215) require a comprehensive physical examination, it is necessary to document the time spent with the patient (code 99214 requires 25 to 39 minutes of consultation and code 99215 requires ≥ 40 minutes).
Some final billing and coding advice
Always confirm telemedicine billing guidelines before beginning to conduct telemedicine visits. Consider starting a phone call to a payer armed with the fact that the payer is required by law to offer parity between telemedicine and face-to-face visits. Then ask which specific billing codes should be used.
Until you and your practice become comfortable with the process of, and the coding and billing for, telemedicine, consider using a telemedicine platform that has a built-in rules engine that offers recommendations for each telemedicine visit based on past claims data. These systems help gynecologists determine which CPT code to use and which modifiers are appropriate for the various insurance companies. In other words, the rules engine helps you submit a clean claim that is less likely to be denied and very likely to be paid. There are some vendors who are so confident that their rules engine will match the service with the proper CPT code and modifier that they guarantee full private payer reimbursement for telemedicine visits, or the vendor will reimburse the claim.
Watch for the third and final installment in this series, which was written with the assistance of 2 attorneys. It will review the legal guidelines for implementing telemedicine in a gynecologic practice and discuss the future of the technology. ●
- COVID-19 and Telehealth Coding Options as of March 20, 2020. https://www.ismanet.org/pdf/COVID-19andTelehealthcodes3-20-2020Updates.pdf.
- Federation of State Medical Boards. US States and Territories Modifying Licensure Requirements for Physicians in Response to COVID-19. Last updated May 26, 2020. https://www.fsmb.org/siteassets/advocacy/pdf/state-emergency-declarations-licensures-requirementscovid-19.pdf.
- Center for Connected Health Policy. Current State Laws and Reimbursement Policies https://www.cchpca.org/telehealth-policy/current-state-laws-and-reimbursement-policies.
- Centers for Medicare and Medicaid Services. List of Telehealth Services. Updated April 30, 2020. https://www.cms.gov/Medicare/Medicare-General-Information/Telehealth/Telehealth-Codes.
- American Medical Association. AMA quick guide to telemedicinein practice. Updated May 22, 2020. https://www.ama-assn.org/practice-management/digital/ama-quick-guide-telemedicine-practice.
- Eddy N. Patients increasingly trusting of remote care technology. Healthcare IT News. October 22, 2019. https://www.healthcareitnews.com/news/patients-increasingly-trusting-remote-care-technology-says-new-report. Accessed May 26, 2020.
- Welch BM, Harvey J, O’Connell NS, et al. Patient preferences for direct-to-consumer telemedicine services: a nationwide survey. BMC Health Serv Res. 2017;17:784.
- Tsai JM, Cheng MJ, Tsai HH, et al. Acceptance and resistance of telehealth: the perspective of dual-factor concepts in technology adoption. Int J Inform Manag. 2019;49:34-44.
- Hollander J, Carr BG. Virtually perfect? Telemedicine for COVID-19. N Engl J Med. 2020;382:1679-1681.
- Pew Research Center. Internet and Technology. Mobile Fact Sheet. June 12, 2019. https://www.pewresearch.org /internet/fact-sheet/mobile/. Accessed May 18, 2020.
- American Medical Association. AMA quick guide to telemedicine in practice. https://www.ama-assn.org/ practice-management/digital/ama-quick-guide-telemedicine- practice. Accessed March 20, 2020.
- Center for Connected Health Policy. Federal and state regulation updates. https://www.cchpca.org. Accessed March 20, 2020.
- The White House. Proclamation on declaring a national emergency concerning the novel coronavirus disease (Covid-19) outbreak. March 13, 2020. https://www.whitehouse.gov/presidential-actions/proclamation-declaring-national-emergency-concerning-novel-coronavirus-disease-covid-19-outbreak/. Accessed May 18, 2020.
- Center for Connected Health Policy. Quick glance state telehealth actions in response to COVID-19. https://www.cchpca.org/sites/default/files/2020-05/STATE%20TELEHEALTH%20ACTIONS%20IN%20RESPONSE%20TO%20COVID%20
OVERVIEW%205.5.2020_0.pdf. AccessedMay 13, 2020. - Medicare.gov. https://www.medicare.gov/sign-up-change -plans/types-of-medicare-health-plans/medicare-advantage-plans/how-do-medicare-advantage-plans-work. Accessed May 13, 2020.
- Centers for Medicare and Medicaid Services. CMS finalizes policies to bring innovative telehealth benefit to Medicare Advantage. April 5, 2019. https://www.cms.gov/newsroom /press-releases/cms-finalizes-policies-bring-innovative-telehealth-benefit-medicare-advantage. Accessed May 18,2020.
- Centers for Medicare & Medicaid Services. Medicare telemedicine health care provider fact sheet. https://www.cms.gov/newsroom/fact-sheets/medicare-telemedicine-health-care-provider-fact-sheet. Accessed May 30, 2020.
- Centers for Medicare & Medicaid Services. Medicare telehealth frequently asked questions. https://www.cms.gov/files/document/medicare-telehealth-frequently-asked-questions-faqs-31720.pdf.
- American Hospital Association. Coronavirus update: CMS broadens access to telehealth during Covid-19 public health emergency. https://www.aha.org/advisory/2020-03-17-coronavirus-update-cms-broadens-access-telehealth-during-covid-19-public-health. Accessed May 18, 2020.

Dr. Karram is Clinical Professor of Obstetrics and Gynecology, University of Cincinnati, and Director of Urogynecology, The Christ Hospital, Cincinnati, Ohio.

Dr. Baum is Professor of Clinical Urology, Tulane Medical School, New Orleans, Louisiana.
The authors report no financial relationships relevant to this article.
Dr. Karram is Clinical Professor of Obstetrics and Gynecology, University of Cincinnati, and Director of Urogynecology, The Christ Hospital, Cincinnati, Ohio.
Dr. Baum is Professor of Clinical Urology, Tulane Medical School, New Orleans, Louisiana.
The authors report no financial relationships relevant to this article.
Since the COVID-19 pandemic began, many significant changes have occurred that have made the implementation of telemedicine easier and more attractive for gynecologic practices. In the first article in this series, we discussed the benefits of telemedicine to physicians and patients, how to get started using telemedicine, and implementing a workflow. This article will discuss the common hurdles in the process and the proper coding to use to insure reimbursement for services rendered.
Barriers to implementing telemedicine
Incorrect assumptions
Latecomers to telemedicine often assume that patients prefer face-to-face visits when, in fact, many may prefer the convenience of virtual visits. More than 50% of patients who are surveyed about their experience with telemedicine say that online tools have helped improve their relationship with their providers.1 Telemedicine has grown astronomically during the COVID-19 pandemic to the point where many patients now expect their health care providers to be able to conduct virtual visits. Practices that do not offer telemedicine may find their patients seeking services elsewhere. Nearly two-thirds of health care professionals expect their commitment to telemedicine to increase significantly in the next 3 years.2 Of those providers who have not yet adopted the practice, nearly 85% expect to implement telemedicine in the near future.3 COVID-19 has motivated the increased use of telemedicine to enhance the communication with patients, making it possible for patients to have enhanced access to health care during this pandemic while minimizing infectious transmission of COVID-19 to physicians and their staff.4
Admittedly, telemedicine is not appropriate for all patients. In general, situations that do not lend themselves to telemedicine are those for which an in-person visit is required to evaluate the patient via a physical examination, to perform a protocol-driven procedure, or provide an aggressive intervention. Additional patients for whom telemedicine may be inappropriate include those with cognitive disorders, those with language barriers, those with emergency situations that warrant an office visit or a visit to the emergency department, and patients who do not have access to the technology to conduct a virtual visit.
Cost and complexity
The process of implementing electronic health records (EHRs) left a bitter taste in the mouths of many health care professionals. But EHRs are complicated and expensive. Implementation often resulted in lost productivity. Because the learning curve was so steep, many physicians had to decrease the number of patients they saw before becoming comfortable with the conversion from paper charts to an EHR.
Telemedicine implementation is much less onerous and expensive. Telemedicine is available as a cloud-based platform, which requires less information technology (IT) support and less hardware and software. The technology required for patients to participate in telemedicine is nearly ubiquitous. According to the Pew Research Center, 96% of Americans own a cell phone (81% have a smart phone), and more than half (52%) own a tablet, so the basic equipment to connect patients to providers is already in place.5
On the provider side, the basic equipment required for a telemedicine program is a computer with video and audio capabilities and a broadband connection that is fast enough to show video in real time and to provide high-quality viewing of any images to be reviewed.
The growth in telemedicine means that telemedicine options are now more diverse, with many more affordable solutions. However, most telemedicine programs do require the purchase and set-up of new technology and equipment and the training of staff—some of which may be outside the budgets of health care providers in smaller independent practices. Many gynecologists have technology budgets that are already stretched thin. And for patients who do not have access to a smartphone or computer with Internet access, real-time telemedicine may be out of reach.
But with new guidelines put forth by the Centers for Medicare and Medicaid Services (CMS) in March 2020, connectivity can take place inexpensively using free platforms such as Google Hangouts, Skype, Facetime, and Facebook Messenger. If a non‒HIPAA-compliant platform is used initially, conversion to a HIPAA-compliant platform is recommended.6 These platforms do not require the purchase of, or subscription to, any expensive hardware or software. The disadvantages of these programs are the lack of documentation, the failure to be Health Insurance Portability and Accountability Act (HIPAA)-compliant, and the lack of encryption; however, these disadvantages are no longer an issue after the new CMS guidelines.
Depending on the magnitude of the program, IT assistance may be needed to get started. It is imperative that the telemedicine program is interoperable with the EHR and the billing program. Otherwise, double and triple entry will erase the efficiency provided by conducting a virtual visit.
Continue to: Licensing...
Licensing
Another concern or barrier is a license to participate in telemedicine. The March 15, 2020, approval of telemedicine states that physicians who are licensed in the state where the patient is located do not require any additional license or permission to conduct virtual visits.7 CMS has temporarily waived the requirement that out-of-state providers be licensed in the state where they are providing services when they are licensed in another state. For questions regarding licensure, contact your State Board of Medicine or Department of Health for information on requirements for licenses across state lines (see “Resources,” at the end of the article).
Informed consent
Just like with any other aspect of providing care for patients, obtaining informed consent is paramount. Not only is getting informed patient consent a recommended best practice of the American Telemedicine Association (ATA), but it is actually a legal requirement in many states and could be a condition of getting paid, depending on the payer. To check the requirements regarding patient consent in your state, look at The National Telehealth Policy Resource Center’s state map (see “Resources.")
Some states do not have any requirements regarding consent for a virtual visit. Others require verbal consent. Even if it is not a legal requirement in your state, consider making it a part of your practice’s policy to obtain written or verbal consent and to document in the patient’s record that consent was obtained prior to the virtual visit so that you are protected when using this new technology.
Because telemedicine is a new way of receiving care for many patients, it is important to let them know how it works including how patient confidentiality and privacy are handled, what technical equipment is required, and what they should expect in terms of scheduling, cancellations, and billing policies. A sample consent form for telemedicine use is shown in FIGURE 1.
Liability insurance
Another hurdle that must be considered is liability insurance for conducting virtual visits with patients. Gynecologists who are going to offer telemedicine care to patients should request proof in writing that their liability insurance policy covers telemedicine malpractice and that the coverage extends to other states should the patient be in another state from the state in which the gynecologist holds a license. Additionally, gynecologists who provide telemedicine care should check with liability insurers regarding any requirements or limitations to conducting a virtual visit with their patients and should document them. For example, the policy may require that the physician keep a written or recorded record of the visit in the EHR. If that is the case, then using Skype, Facebook, or Google for the virtual visit, which do not include documentation, would be less desirable.
Privacy
Certainly, there is concern about privacy, and HIPAA compliance is critical to telemedicine success. Because of the COVID-19 emergency, as of March 1, 2020, physicians may now communicate with patients, and provide telehealth services, through remote communications without penalties.8 With these changes in the HIPAA requirements, physicians may use applications that allow for video chats, including Apple FaceTime, Facebook Messenger video chat, Google Hangouts video, and Skype, to provide telehealth without risk that the Office for Civil Rights will impose a penalty for noncompliance with HIPAA rules. The consent for patients should mention that these “public” applications potentially introduce privacy risks. This is a motivation for gynecologists to consider one of the programs that promises encryption, privacy, and HIPAA compliance, such as Updox, Doxy.me, and Amazon Chime. It is also important to recognize that a virtual visit could result in colleagues (if the patient is in an office setting) or family members (if the patient is in the home environment) overhearing conversations between the health care professional and the patient. Therefore, we suggest that patients conduct virtual visits in locations in which they feel assured of some semblance of privacy.
Continue to: Compensation for telemedicine...
Compensation for telemedicine
Perhaps the biggest barrier to virtual health adoption has been compensation for telemedicine visits. Both commercial payers and CMS have been slow to enact formal policies for telemedicine reimbursement. Because of this, the common misconceptions (that providers cannot be reimbursed for telemedicine appointments or that compensation occurs at a reduced rate) have persisted, making telemedicine economically unappealing.
The good news is that this is changing; legislation in most states is quickly embracing virtual health visits as a result of the COVID-19 pandemic.9 In fact, as of January 1, 2020, telemedicine services are no longer considered “optional” coverage in Medicare Advantage plans.10 Nor are they required to have an additional fee. Instead, CMS now allows telemedicine as a standard, covered benefit in all plans, enabling beneficiaries to seek care from their homes rather than requiring them to go to a health care facility.11 In the past, telemedicine was restricted for use in rural areas or when patients resided a great distance from their health care providers. Starting March 6, 2020, and for the duration of the COVID-19 public health emergency, Medicare will make payment for professional services furnished to beneficiaries in all areas of the country in all settings regardless of location or distance between the patient and the health care provider.12
In addition, since March 15, 2020, CMS has expanded access to telemedicine services for all Medicare beneficiaries—not just those who have been diagnosed with COVID-19.13 The expanded access also applies to pre-COVID-19 coverage from physician offices, skilled nursing facilities, and hospitals. This means that Medicare will now make payments to physicians for telemedicine services provided in any health care facility or in a patient’s home, so that patients do not need to go to the physician’s office.
The facts are that there are parity laws and that commercial payers and CMS are required by state law to reimburse for telemedicine—often at the same rate as that for a comparable in-person visit. On the commercial side, there has been an increase in commercial parity legislation that requires health plans to cover virtual visits in the same way they cover face-to-face services. With the new guidelines for reimbursement, every state and Washington DC has parity laws in place. (To stay abreast of state-by-state changes in virtual health reimbursement, the Center for Connected Health Policy and the Advisory Board Primer are valuable resources. See “Resources.”) As long as the provider performs and documents the elements of history and decision-making, including the time spent counseling, and documents the visit as if a face-to-face visit occurred, then clinicians have a billable evaluation and management (E&M) visit.
Continue to: Virtual services for Medicare patients...
Virtual services for Medicare patients
There are 3 main types of virtual services gynecologists can provide to Medicare patients: Medicare telehealth visits, virtual check-ins, and e-visits.
Medicare telehealth visits. Largely because of the COVID-19 pandemic, Medicare patients may now use telecommunication technology for any services that previously occurred in an in-person communication. The gynecologist must use an interactive audio and video telecommunications system that permits real-time communication between the physician and the patient, and the patient should have a prior established relationship with the gynecologist with whom the telemedicine visit is taking place. The new guidelines indicate that the US Department of Health and Human Services (HHS) will not conduct audits to ensure that such a prior relationship exists for claims submitted during this public health emergency.14
The Current Procedural Terminology (CPT) codes for virtual visits using synchronous audio/visual communication are:
- 99201-99295, Office visit for a new patient
- 99211-99215, Office visit for an established patient.
Important modifiers for telemedicine visits include:
- modifier 02 for POS (place of service) for telehealth Medicare
- modifier 95 for commercial payers.
(A list of all available CPT codes for telehealth services from CMS can be found in “Resources.”)
Virtual check-ins. Established Medicare patients may have a brief communication with gynecologists the traditional way using a telephone or via live video. These brief virtual services, usually 5 to 10 minutes in duration, are initiated by the patient. The purpose of the virtual check-in is to determine if an office visit or a test or procedure is indicated.
Medicare pays for these “virtual check-ins” (or brief communication technology-based services) for patients to communicate with their physicians and avoid unnecessary trips to the office. These brief virtual check-ins are only for established patients. If an existing patient contacts the gynecologist’s office to ask a question or determine if an office visit is necessary, the gynecologist may bill for it using code G2012.
E-visits. Established Medicare patients may have non–face-to-face patient-initiated communications with their gynecologists without going to the physician’s office. These services can be billed only when the physician has an established relationship with the patient. The services may be billed using CPT codes 99421 to 99423. Coding for these visits is determined by the length of time the gynecologist spends online with the patient:
- 99421: Online digital evaluation and management service, for an established patient 5 to 10 minutes spent on the virtual visit
- 99422: 11 to 20 minutes
- 99423: ≥ 21 minutes.
Many clinicians want to immediately start the communication process with their patients. Many will avail themselves of the free video communication offered by Google Hangouts, Skype, Facetime, and Facebook Messenger. Since the March 15, 2020, relaxation of the HIPAA restrictions for telemedicine, it is now possible to have a virtual visit with a patient using one of the free, non–HIPAA-compliant connections. This type of visit is no different than a telephone call but with an added video component. Using these free technologies, a gynecologist can have an asynchronous visit with a patient (referred to as the store and forward method of sending information or medical images), which means that the service takes place in one direction with no opportunity for interaction with the patient. Asynchronous visits are akin to video text messages left for the patient. By contrast, a synchronous or real-time video visit with a patient is a 2-way communication that provides medical care without examining the patient.
Using triangulation
There are some downsides to telemedicine visits. First, virtual visits on Skype, FaceTime, and other non–HIPAA-compliant methods are not conducted on an encrypted website. Second, no documentation is created for the doctor-patient encounter. Finally, unless the physician keeps a record of these virtual visits and submits the interactions to the practice coders, there will be no billing and no reimbursement for the visits. In this scenario, physicians are legally responsible for their decision-making, prescription writing, and medical advice, but do not receive compensation for their efforts.
This can be remedied by using “triangulation,” which involves: 1. the physician, 2. the patient, and 3. a scribe or medical assistant who will record the visit. Before initiating the virtual visit using triangulation, it is imperative to ask the patient for permission if your medical assistant (or any other person in the office who functions as a scribe) will be listening to the conversation. It is important to explain that the person is there to take accurate notes and ascertain that the notes are entered into the EHR. Also, the scribe or assistant will record the time, date, and duration of the visit, which is a requirement for billing purposes. The scribe may also ascertain that the visit is properly coded and entered into the practice management system, and that a bill is submitted to the insurance company. By using triangulation, you have documentation that consent was obtained, that the visit took place, that notes were taken, and that the patient’s insurance company will be billed for the visit (see FIGURE 2 for a sample documentation form).
Continue to: Which CPT codes should I use?...
Which CPT codes should I use?
The answer depends on a number of factors, but a good rule of thumb is to use the same codes that you would use for an in-person appointment (CPT codes 99211-99215 for an established patient visit and 99201-99205 for a new patient visit). These are the most common CPT codes for outpatient gynecologic office visits whether they take place face-to-face or as a synchronous virtual visit (via a real-time interactive audio and video telecommunications system).
For example, the reimbursement for code 99213 has a range from $73 to $100. You may wonder how you can achieve the complexity requirements for a level-3 office visit without a physical examination. Whether as a face-to-face or virtual visit, documentation for these encounters requires 2 of 3 of the following components:
- expanded problem-focused history
- expanded problem-focused exam (not accomplished with telemedicine)
- low-complexity medical decision-making OR
- at least 15 minutes spent face to face with the patient if coding is based on time.
If a gynecologist reviews the results of a recent lab test for an estrogen-deficient patient and adjusts the estrogen dosage, writes a prescription, and spends 15 minutes communicating with the patient, he/she has met the complexity requirements for a code 99213. Because Level 3 and 4 visits (99214 and 99215) require a comprehensive physical examination, it is necessary to document the time spent with the patient (code 99214 requires 25 to 39 minutes of consultation and code 99215 requires ≥ 40 minutes).
Some final billing and coding advice
Always confirm telemedicine billing guidelines before beginning to conduct telemedicine visits. Consider starting a phone call to a payer armed with the fact that the payer is required by law to offer parity between telemedicine and face-to-face visits. Then ask which specific billing codes should be used.
Until you and your practice become comfortable with the process of, and the coding and billing for, telemedicine, consider using a telemedicine platform that has a built-in rules engine that offers recommendations for each telemedicine visit based on past claims data. These systems help gynecologists determine which CPT code to use and which modifiers are appropriate for the various insurance companies. In other words, the rules engine helps you submit a clean claim that is less likely to be denied and very likely to be paid. There are some vendors who are so confident that their rules engine will match the service with the proper CPT code and modifier that they guarantee full private payer reimbursement for telemedicine visits, or the vendor will reimburse the claim.
Watch for the third and final installment in this series, which was written with the assistance of 2 attorneys. It will review the legal guidelines for implementing telemedicine in a gynecologic practice and discuss the future of the technology. ●
- COVID-19 and Telehealth Coding Options as of March 20, 2020. https://www.ismanet.org/pdf/COVID-19andTelehealthcodes3-20-2020Updates.pdf.
- Federation of State Medical Boards. US States and Territories Modifying Licensure Requirements for Physicians in Response to COVID-19. Last updated May 26, 2020. https://www.fsmb.org/siteassets/advocacy/pdf/state-emergency-declarations-licensures-requirementscovid-19.pdf.
- Center for Connected Health Policy. Current State Laws and Reimbursement Policies https://www.cchpca.org/telehealth-policy/current-state-laws-and-reimbursement-policies.
- Centers for Medicare and Medicaid Services. List of Telehealth Services. Updated April 30, 2020. https://www.cms.gov/Medicare/Medicare-General-Information/Telehealth/Telehealth-Codes.
- American Medical Association. AMA quick guide to telemedicinein practice. Updated May 22, 2020. https://www.ama-assn.org/practice-management/digital/ama-quick-guide-telemedicine-practice.
- Eddy N. Patients increasingly trusting of remote care technology. Healthcare IT News. October 22, 2019. https://www.healthcareitnews.com/news/patients-increasingly-trusting-remote-care-technology-says-new-report. Accessed May 26, 2020.
- Welch BM, Harvey J, O’Connell NS, et al. Patient preferences for direct-to-consumer telemedicine services: a nationwide survey. BMC Health Serv Res. 2017;17:784.
- Tsai JM, Cheng MJ, Tsai HH, et al. Acceptance and resistance of telehealth: the perspective of dual-factor concepts in technology adoption. Int J Inform Manag. 2019;49:34-44.
- Hollander J, Carr BG. Virtually perfect? Telemedicine for COVID-19. N Engl J Med. 2020;382:1679-1681.
- Pew Research Center. Internet and Technology. Mobile Fact Sheet. June 12, 2019. https://www.pewresearch.org /internet/fact-sheet/mobile/. Accessed May 18, 2020.
- American Medical Association. AMA quick guide to telemedicine in practice. https://www.ama-assn.org/ practice-management/digital/ama-quick-guide-telemedicine- practice. Accessed March 20, 2020.
- Center for Connected Health Policy. Federal and state regulation updates. https://www.cchpca.org. Accessed March 20, 2020.
- The White House. Proclamation on declaring a national emergency concerning the novel coronavirus disease (Covid-19) outbreak. March 13, 2020. https://www.whitehouse.gov/presidential-actions/proclamation-declaring-national-emergency-concerning-novel-coronavirus-disease-covid-19-outbreak/. Accessed May 18, 2020.
- Center for Connected Health Policy. Quick glance state telehealth actions in response to COVID-19. https://www.cchpca.org/sites/default/files/2020-05/STATE%20TELEHEALTH%20ACTIONS%20IN%20RESPONSE%20TO%20COVID%20
OVERVIEW%205.5.2020_0.pdf. AccessedMay 13, 2020. - Medicare.gov. https://www.medicare.gov/sign-up-change -plans/types-of-medicare-health-plans/medicare-advantage-plans/how-do-medicare-advantage-plans-work. Accessed May 13, 2020.
- Centers for Medicare and Medicaid Services. CMS finalizes policies to bring innovative telehealth benefit to Medicare Advantage. April 5, 2019. https://www.cms.gov/newsroom /press-releases/cms-finalizes-policies-bring-innovative-telehealth-benefit-medicare-advantage. Accessed May 18,2020.
- Centers for Medicare & Medicaid Services. Medicare telemedicine health care provider fact sheet. https://www.cms.gov/newsroom/fact-sheets/medicare-telemedicine-health-care-provider-fact-sheet. Accessed May 30, 2020.
- Centers for Medicare & Medicaid Services. Medicare telehealth frequently asked questions. https://www.cms.gov/files/document/medicare-telehealth-frequently-asked-questions-faqs-31720.pdf.
- American Hospital Association. Coronavirus update: CMS broadens access to telehealth during Covid-19 public health emergency. https://www.aha.org/advisory/2020-03-17-coronavirus-update-cms-broadens-access-telehealth-during-covid-19-public-health. Accessed May 18, 2020.

‘I didn’t train for this’: Take cues from elite athletes to maintain stamina during the COVID-19 crisis
I am not an elite athlete. Never have been, never will be. But as I contemplated how to support my colleagues at my hospital during the COVID-19 pandemic—knowing that we face more weeks of social distancing, probable virus outbreaks as business opens up, and myriad changes in how we will practice medicine—I wondered how Olympic athletes focus their mental and physical stamina to respond to the challenges of competition.
In this article, I offer some pointers, gleaned from techniques used by exceptional athletes, on how we can maintain our stamina during the COVID-19 marathon.

Train your mind
Elite athletes understand that what will take them to the top of their sport is less about their physical gifts (all elite athletes have superior athletic talent) and more about how they train their minds to achieve their goals. As basketball great Kareem Abdul-Jabbar said, “Your mind is what makes everything else work.” Not surprisingly, athletes who train to be mentally “tough” have a better chance to reach the podium.
One definition of mental toughness is the “ability to perform toward the upper range of your talent and skill” regardless of external circumstances.1 Mental toughness involves an unshakable self-belief, resilience, motivation, focus, and ability to perform under pressure and manage physical and emotional pain.
Like me, most of you probably are not elite athletes, but you can train your mind to be tougher and increase your stamina using some of the following techniques.
Think positively
Do you find yourself dealing with an inner monologue of fear, self-doubt, and feelings of worthlessness? That is the Obnoxious Roommate in your head as described in a HuffPost article and based on the pioneering work of psychiatrist Aaron Beck, MD, the father of cognitive-behavioral therapy.2,3 Such thoughts negatively affect one’s sense of self-efficacy, which is the mental state of believing that you can meet the challenges you face. Elite athletes pay particular attention to their self-talk and replace negative thoughts with positive ones. These may include affirmations of your strengths or cue words that pump you up or help you manage your nerves.
To begin this practice, first observe what you are telling yourself. You may be saying, “I can’t do this. This is too hard.” This is an important step because you may have lived with the Obnoxious Roommate for so long that these thoughts are automatic and seem like a part of you. If, however, you first observe the thought and acknowledge it, you can begin to replace negative thoughts with supportive ones: “This is hard, but I can do this. I am intelligent, strong, capable, and ready.” While practice and repetition are required, thinking positively eventually will become a habit of self-support. Elite athletes know that to reach the top, they need to become their own best friend.4
Continue to: Use visualization...
Use visualization
Elite athletes visualize their events in such meticulous detail that they can actually feel their feet on the track, their muscles tensing, the starter pistol going off, the roar of the crowd. Research shows that the part of the brain that is activated in a race is also activated when one visualizes the race. It is as though the race is happening in real time.5 Physicians could use this approach to visualize the day ahead, picturing the procedures in detail and the clinical encounters going well.
In the current crisis, we frequently need a way to calm down quickly. One suggestion is to find a quiet space and sit for a few minutes, allowing the chair to support you. Then imagine a beautiful, calm, soothing place. Relax there and take in that feeling. Or, imagine a past achievement when you felt good about yourself. See yourself in that moment, remember how you felt, and take it in.
Plan for setbacks
All elite athletes have setbacks: Marathon runners hit a wall, golfers hit into the rough. But they don’t spin out of control at setbacks. They expect them, and they have practiced skills to restore their confidence and re-center themselves.6 For example, some athletes calm themselves by performing a ritualized series of movements. Others use a specific phrase (that positive self-talk again!) that reminds them of their goals or skills, while others play specific songs on their media player, or in their head, to return to their center.
Another technique is to use deep, rhythmic, diaphragmatic breathing for about 30 seconds to bring yourself back to your body.
The point is to have a plan in place to respond to setbacks in a positive manner and get back on track. Don’t waste time on self-criticism.
Continue to: Manage stress...
Manage stress
Not all stress is negative. Everyone has a “sweet spot,” a level of activation from which we operate best.1 If we go too far over that level, though, we can panic. If we aren’t stressed enough, it is hard to get going at all.
If you need to be pumped up to function at your best, try playing music that energizes you. If you work best when you are calm, take deep breaths and attend to the exhalation while you engage in positive self-talk.
Another way to manage stress levels during the COVID-19 pandemic is to employ the ESCAPE mnemonic:
- Exercise. Research shows that regular aerobic exercise is a potent stress reliever; it raises endorphin levels, provides a general sense of well-being, and improves immune function.7 If you exercise regularly, do everything possible to keep doing so. If you do not have an exercise routine, try taking walks. Get out into the fresh air, pay attention to your surroundings, and work to be present in your body as you move.
- Sleep. Getting adequate sleep, 7 to 9 hours a night for most people, is important for maintaining physical and emotional health.8 Elite athletes pay particular attention to sleep because they know that their bodies need to recharge. The COVID-19 crisis has affected sleep for many, and we need to consciously attend to sleep hygiene. This includes limiting use of screen time to no more than 2 hours before bed. As well, limit your intake of the news and definitely avoid it right before bedtime. Take a warm shower, drink a cup of herbal tea, or read a less-than-stimulating journal article. Make sure your bedroom is cool and dark. Keep a regular bedtime and wake up at a regular time.
- Connect. Despite the current need for physical distancing, do not neglect your need to connect to those you love and care about. Whatever modality works for you—telephone, e-mail, video conferencing—if you feel lonely, reach out. Friends and families are concerned about us, and it makes them feel useful to support us. Allow that.
- Appreciate/cultivate gratitude. Look for causes for celebration in your life, whether that is your family, friends, or that you have a job and a home. Perhaps it is the cleaner air or the beauty of nature. Whatever you are grateful for, acknowledge it, perhaps by writing it down in a journal. Remembering these things can serve as an antidote to the stress created by the COVID-19 crisis.
- Play. Seek out things that make you laugh.9 Find your inner goofiness. Get creative and paint, sing, garden, golf, play an instrument, dance, do puzzles, or play games. We need to remember the pleasures in life when times are dark. Find whatever feels like joy.
- Exhale. If you have a meditation practice continue to do it. If not, consider starting. Try yoga as a way to center yourself in your body. Elite athletes use meditation and yoga to harness their minds and bodies to feel more in control.10 When so many things feel out of our control and unpredictable, it can be immensely soothing to connect to yourself in this way and realize you can reliably relax.
Self-care is a necessity
While we are in a marathon not of our choosing, we can use the techniques of elite athletes to think positively, visualize scenarios to achieve our goals or to simply relax, plan for setbacks so that we can bounce back, and manage stress productively. Self-care is paramount as we continue to care for others. Let’s not neglect ourselves, and we will cross the finish line together. ●
- Jones G. What is this thing called mental toughness? An investigation of elite sport performers. J Applied Sport Psych. 2002;14:205-218.
- Gregoire C. The brain-training secrets of Olympic athletes. HuffPost. February 11, 2014. https://www.huffpost.com/entry/mind-hacks-from-olympic-a_n_4747755. Accessed May 27, 2020.
- Beck AT. A 60-year evolution of cognitive theory and therapy. Perspect Psychol Sci. 2019;14:16-20.
- Afremow J. The Champion’s Mind: How Great Athletes Think, Train, and Thrive. New York, NY: Rodale Inc; 2014.
- Ranganathan VK, Siemionow V, Liu JZ, et al. From mental power to muscle power—gaining strength by using the mind. Neuropsychologia. 2004;42:944-956.
- Morgan Griffin R. 5 tips for building mental stamina. July 8, 2013. WebMD. https://www.webmd.com/fitness-exercise/features/mental-stamina#1. Accessed May 27, 2020.
- Hackney AC. Stress and the neuroendocrine system: the role of exercise as a stressor and modifier of stress. Expert Rev Endocrinol Metab. 2006;1:783-792.
- Hirschkowitz M, Whiton K, Albert SM, et al. National Sleep Foundation’s sleep time duration recommendations: methodology and results summary. Sleep Health. 2015;1:40-43.
- Saper B. The therapeutic use of humor for psychiatric disturbances of adolescents and adults. Psychiatr Q. 1990;61:261-272.
- Zeidan F, Johnson SK, Diamond BJ, et al. Mindfulness meditation improves cognition: evidence of brief mental training. Conscious Cogn. 2012;19:597-605.

Mary K. McCarthy, MD
Director
Faculty/Trainee Mental Health Program
Brigham and Women’s Hospital
Boston, Massachusetts
Assistant Professor of Psychiatry
Harvard Medical School
The author reports no financial relationships relevant to this article.
Mary K. McCarthy, MD
Director
Faculty/Trainee Mental Health Program
Brigham and Women’s Hospital
Boston, Massachusetts
Assistant Professor of Psychiatry
Harvard Medical School
The author reports no financial relationships relevant to this article.
Mary K. McCarthy, MD
Director
Faculty/Trainee Mental Health Program
Brigham and Women’s Hospital
Boston, Massachusetts
Assistant Professor of Psychiatry
Harvard Medical School
The author reports no financial relationships relevant to this article.
I am not an elite athlete. Never have been, never will be. But as I contemplated how to support my colleagues at my hospital during the COVID-19 pandemic—knowing that we face more weeks of social distancing, probable virus outbreaks as business opens up, and myriad changes in how we will practice medicine—I wondered how Olympic athletes focus their mental and physical stamina to respond to the challenges of competition.
In this article, I offer some pointers, gleaned from techniques used by exceptional athletes, on how we can maintain our stamina during the COVID-19 marathon.
Train your mind
Elite athletes understand that what will take them to the top of their sport is less about their physical gifts (all elite athletes have superior athletic talent) and more about how they train their minds to achieve their goals. As basketball great Kareem Abdul-Jabbar said, “Your mind is what makes everything else work.” Not surprisingly, athletes who train to be mentally “tough” have a better chance to reach the podium.
One definition of mental toughness is the “ability to perform toward the upper range of your talent and skill” regardless of external circumstances.1 Mental toughness involves an unshakable self-belief, resilience, motivation, focus, and ability to perform under pressure and manage physical and emotional pain.
Like me, most of you probably are not elite athletes, but you can train your mind to be tougher and increase your stamina using some of the following techniques.
Think positively
Do you find yourself dealing with an inner monologue of fear, self-doubt, and feelings of worthlessness? That is the Obnoxious Roommate in your head as described in a HuffPost article and based on the pioneering work of psychiatrist Aaron Beck, MD, the father of cognitive-behavioral therapy.2,3 Such thoughts negatively affect one’s sense of self-efficacy, which is the mental state of believing that you can meet the challenges you face. Elite athletes pay particular attention to their self-talk and replace negative thoughts with positive ones. These may include affirmations of your strengths or cue words that pump you up or help you manage your nerves.
To begin this practice, first observe what you are telling yourself. You may be saying, “I can’t do this. This is too hard.” This is an important step because you may have lived with the Obnoxious Roommate for so long that these thoughts are automatic and seem like a part of you. If, however, you first observe the thought and acknowledge it, you can begin to replace negative thoughts with supportive ones: “This is hard, but I can do this. I am intelligent, strong, capable, and ready.” While practice and repetition are required, thinking positively eventually will become a habit of self-support. Elite athletes know that to reach the top, they need to become their own best friend.4
Continue to: Use visualization...
Use visualization
Elite athletes visualize their events in such meticulous detail that they can actually feel their feet on the track, their muscles tensing, the starter pistol going off, the roar of the crowd. Research shows that the part of the brain that is activated in a race is also activated when one visualizes the race. It is as though the race is happening in real time.5 Physicians could use this approach to visualize the day ahead, picturing the procedures in detail and the clinical encounters going well.
In the current crisis, we frequently need a way to calm down quickly. One suggestion is to find a quiet space and sit for a few minutes, allowing the chair to support you. Then imagine a beautiful, calm, soothing place. Relax there and take in that feeling. Or, imagine a past achievement when you felt good about yourself. See yourself in that moment, remember how you felt, and take it in.
Plan for setbacks
All elite athletes have setbacks: Marathon runners hit a wall, golfers hit into the rough. But they don’t spin out of control at setbacks. They expect them, and they have practiced skills to restore their confidence and re-center themselves.6 For example, some athletes calm themselves by performing a ritualized series of movements. Others use a specific phrase (that positive self-talk again!) that reminds them of their goals or skills, while others play specific songs on their media player, or in their head, to return to their center.
Another technique is to use deep, rhythmic, diaphragmatic breathing for about 30 seconds to bring yourself back to your body.
The point is to have a plan in place to respond to setbacks in a positive manner and get back on track. Don’t waste time on self-criticism.
Continue to: Manage stress...
Manage stress
Not all stress is negative. Everyone has a “sweet spot,” a level of activation from which we operate best.1 If we go too far over that level, though, we can panic. If we aren’t stressed enough, it is hard to get going at all.
If you need to be pumped up to function at your best, try playing music that energizes you. If you work best when you are calm, take deep breaths and attend to the exhalation while you engage in positive self-talk.
Another way to manage stress levels during the COVID-19 pandemic is to employ the ESCAPE mnemonic:
- Exercise. Research shows that regular aerobic exercise is a potent stress reliever; it raises endorphin levels, provides a general sense of well-being, and improves immune function.7 If you exercise regularly, do everything possible to keep doing so. If you do not have an exercise routine, try taking walks. Get out into the fresh air, pay attention to your surroundings, and work to be present in your body as you move.
- Sleep. Getting adequate sleep, 7 to 9 hours a night for most people, is important for maintaining physical and emotional health.8 Elite athletes pay particular attention to sleep because they know that their bodies need to recharge. The COVID-19 crisis has affected sleep for many, and we need to consciously attend to sleep hygiene. This includes limiting use of screen time to no more than 2 hours before bed. As well, limit your intake of the news and definitely avoid it right before bedtime. Take a warm shower, drink a cup of herbal tea, or read a less-than-stimulating journal article. Make sure your bedroom is cool and dark. Keep a regular bedtime and wake up at a regular time.
- Connect. Despite the current need for physical distancing, do not neglect your need to connect to those you love and care about. Whatever modality works for you—telephone, e-mail, video conferencing—if you feel lonely, reach out. Friends and families are concerned about us, and it makes them feel useful to support us. Allow that.
- Appreciate/cultivate gratitude. Look for causes for celebration in your life, whether that is your family, friends, or that you have a job and a home. Perhaps it is the cleaner air or the beauty of nature. Whatever you are grateful for, acknowledge it, perhaps by writing it down in a journal. Remembering these things can serve as an antidote to the stress created by the COVID-19 crisis.
- Play. Seek out things that make you laugh.9 Find your inner goofiness. Get creative and paint, sing, garden, golf, play an instrument, dance, do puzzles, or play games. We need to remember the pleasures in life when times are dark. Find whatever feels like joy.
- Exhale. If you have a meditation practice continue to do it. If not, consider starting. Try yoga as a way to center yourself in your body. Elite athletes use meditation and yoga to harness their minds and bodies to feel more in control.10 When so many things feel out of our control and unpredictable, it can be immensely soothing to connect to yourself in this way and realize you can reliably relax.
Self-care is a necessity
While we are in a marathon not of our choosing, we can use the techniques of elite athletes to think positively, visualize scenarios to achieve our goals or to simply relax, plan for setbacks so that we can bounce back, and manage stress productively. Self-care is paramount as we continue to care for others. Let’s not neglect ourselves, and we will cross the finish line together. ●
- Jones G. What is this thing called mental toughness? An investigation of elite sport performers. J Applied Sport Psych. 2002;14:205-218.
- Gregoire C. The brain-training secrets of Olympic athletes. HuffPost. February 11, 2014. https://www.huffpost.com/entry/mind-hacks-from-olympic-a_n_4747755. Accessed May 27, 2020.
- Beck AT. A 60-year evolution of cognitive theory and therapy. Perspect Psychol Sci. 2019;14:16-20.
- Afremow J. The Champion’s Mind: How Great Athletes Think, Train, and Thrive. New York, NY: Rodale Inc; 2014.
- Ranganathan VK, Siemionow V, Liu JZ, et al. From mental power to muscle power—gaining strength by using the mind. Neuropsychologia. 2004;42:944-956.
- Morgan Griffin R. 5 tips for building mental stamina. July 8, 2013. WebMD. https://www.webmd.com/fitness-exercise/features/mental-stamina#1. Accessed May 27, 2020.
- Hackney AC. Stress and the neuroendocrine system: the role of exercise as a stressor and modifier of stress. Expert Rev Endocrinol Metab. 2006;1:783-792.
- Hirschkowitz M, Whiton K, Albert SM, et al. National Sleep Foundation’s sleep time duration recommendations: methodology and results summary. Sleep Health. 2015;1:40-43.
- Saper B. The therapeutic use of humor for psychiatric disturbances of adolescents and adults. Psychiatr Q. 1990;61:261-272.
- Zeidan F, Johnson SK, Diamond BJ, et al. Mindfulness meditation improves cognition: evidence of brief mental training. Conscious Cogn. 2012;19:597-605.

Multiethnic Training in Residency: A Survey of Dermatology Residents
Dermatologic treatment of patients with skin of color offers specific challenges. Studies have reported structural, morphologic, and physiologic distinctions among different ethnic groups,1 which may account for distinct clinical presentations of skin disease seen in patients with skin of color. Patients with skin of color are at increased risk for specific dermatologic conditions, such as postinflammatory hyperpigmentation, keloid development, and central centrifugal cicatricial alopecia.2,3 Furthermore, although skin cancer is less prevalent in patients with skin of color, it often presents at a more advanced stage and with a worse prognosis compared to white patients.4
Prior studies have demonstrated the need for increased exposure, education, and training in diseases pertaining to skin of color in US dermatology residency programs.6-8 The aim of this study was to assess if dermatologists in-training feel that their residency curriculum sufficiently educates them on the needs of patients with skin of color.
Methods
A 10-question anonymous survey was emailed to 109 dermatology residency programs to evaluate the attitudes of dermatology residents about their exposure to patients with skin of color and their skin-of-color curriculum. The study included individuals 18 years or older who were current residents in a dermatology program accredited by the Accreditation Council for Graduate Medical Education.
Results
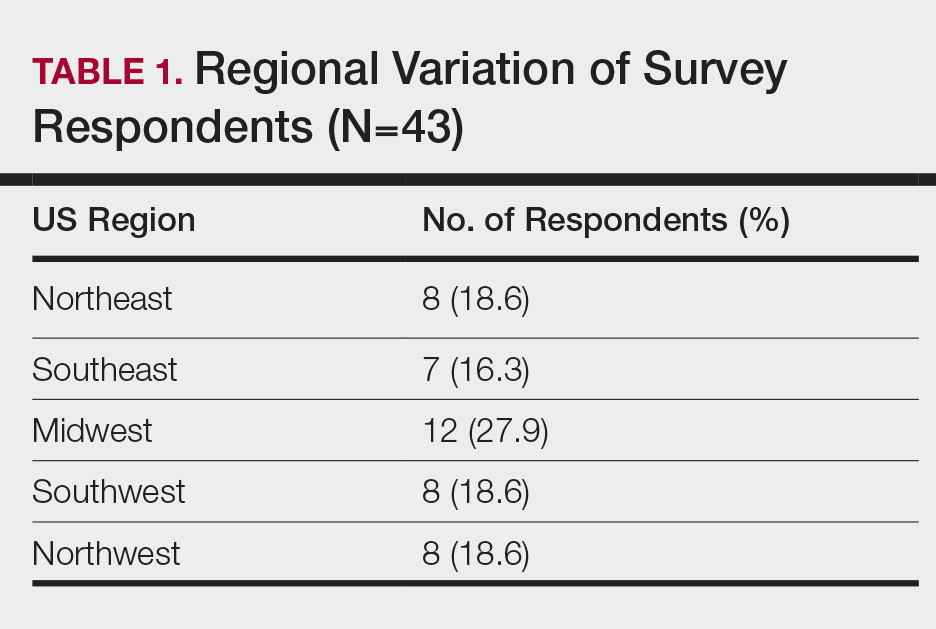
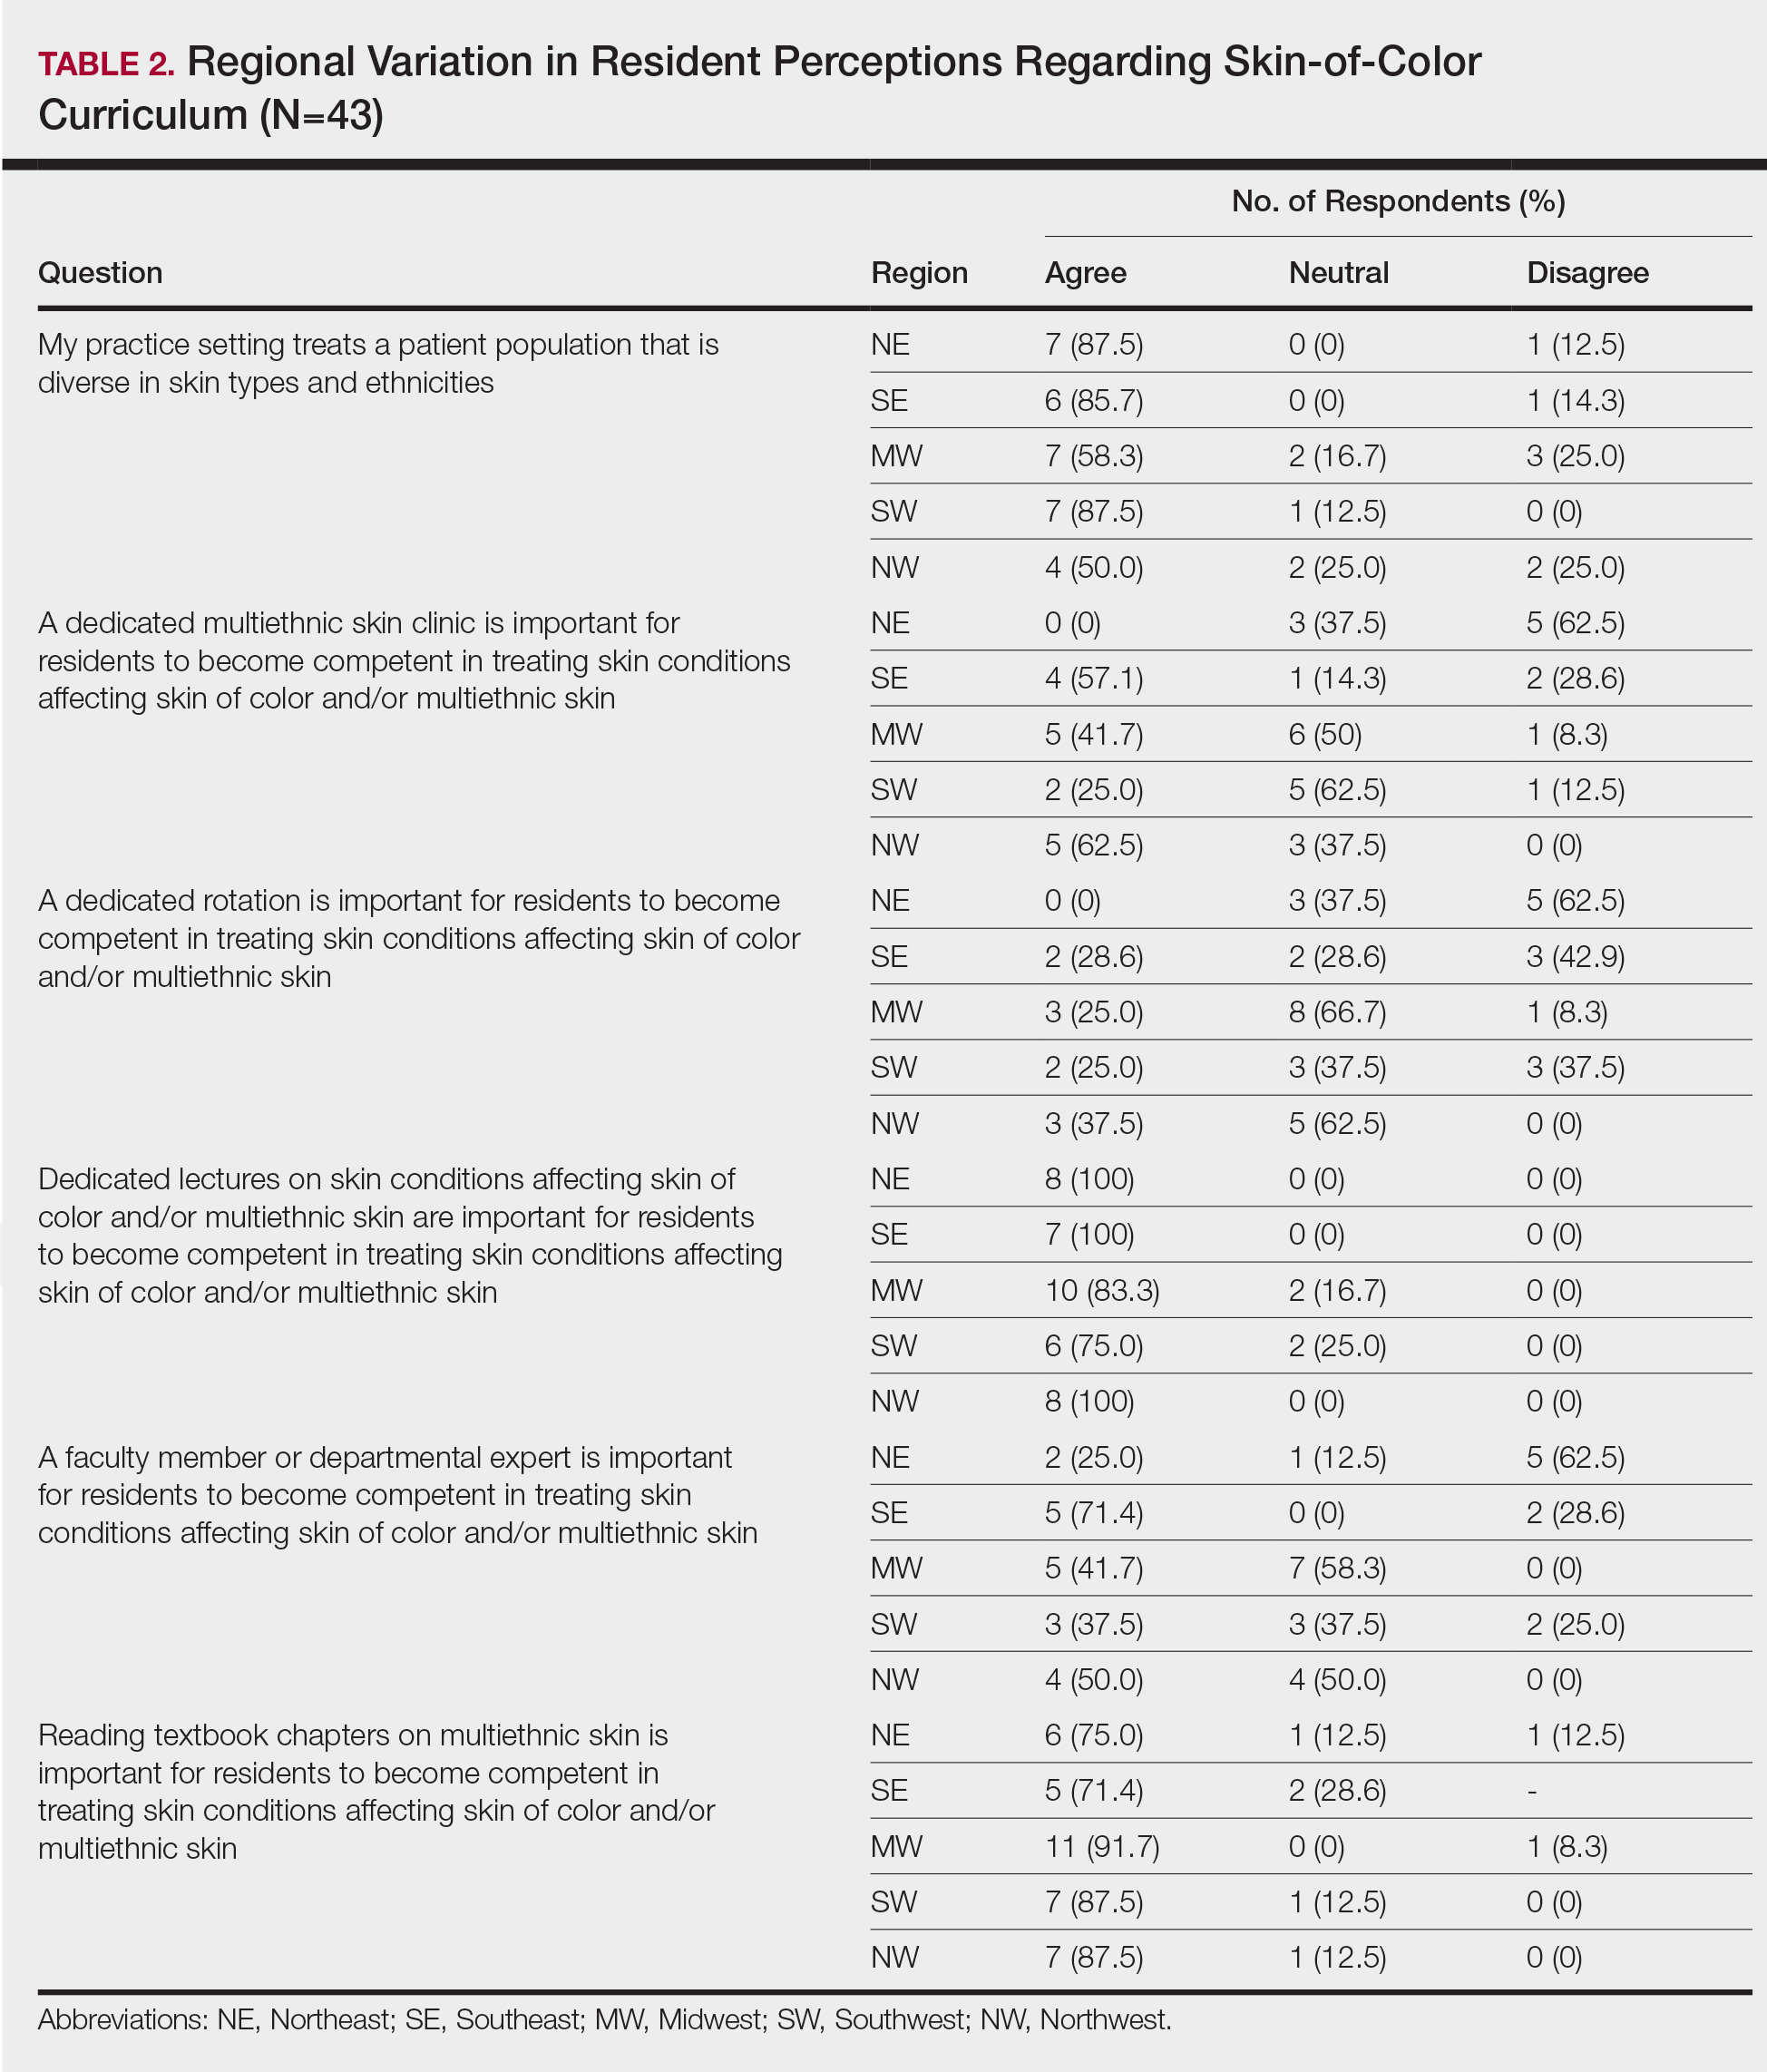
When asked the number of hours of lecture per month necessary to gain competence in conditions affecting patients with skin of color, 67% agreed that 1 to 5 hours was sufficient (Table 3). There were significant differences in the responses between the NE and SE (P=.024) and the SE and MW (P=.007). Of all respondents, 53% reported 1 to 5 months of clinical training are needed to gain competence in treating conditions affecting patients with skin of color, with significant differences in responses between the NE and MW (P<.001), the NE and SW (P=.019), and the SE and MW (P=.015)(Table 4).
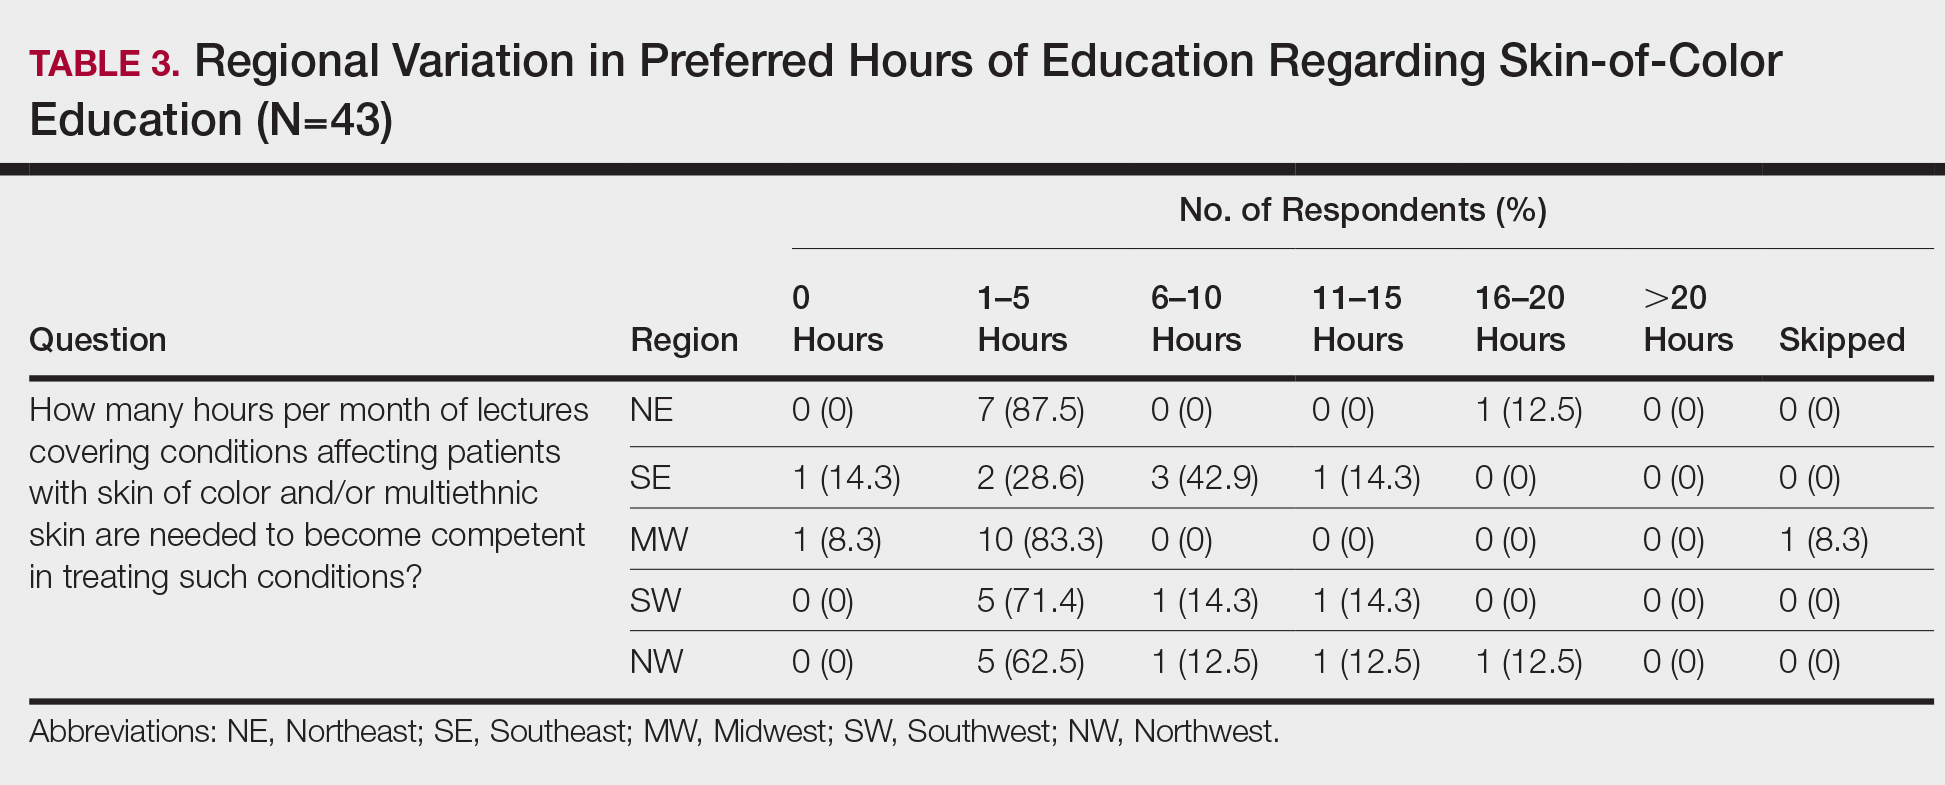
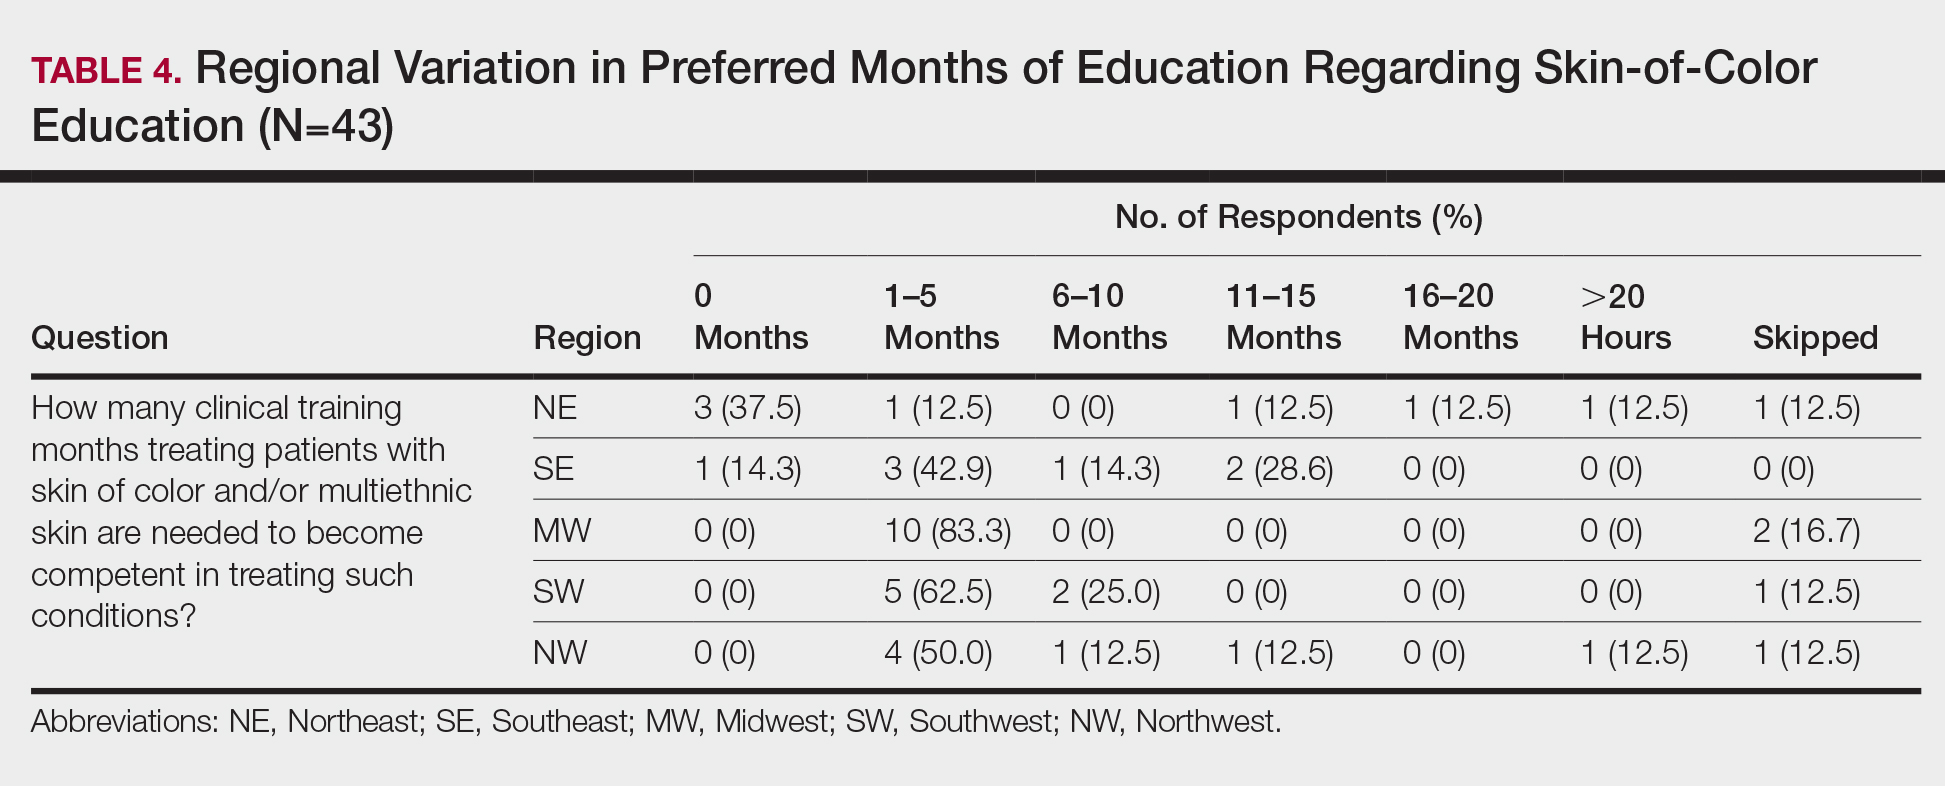
Comment
Responses varied by practicing region
Although interactive lectures and textbook readings are important for obtaining a foundational understanding of dermatologic disease, they cannot substitute for clinical interactions and hands-on experience treating patients with skin of color.9 Not only do clinical interactions encourage independent reading and the study of encountered diagnoses, but intercommunication with patients may have a more profound and lasting impact on residents’ education.
Different regions of the United States have varying distributions of patients with skin of color, and dermatology residency program training reflects these disparities.6 In areas of less diversity, dermatology residents examine, diagnose, and treat substantially fewer patients with skin of color. The desire for more diverse training supports the prior findings of Nijhawan et al6 and is reflected in the responses we received in our study, whereby residents from the less ethnically diversified regions of the MW and NW were more likely to agree that clinics and rotations were necessary for training in preparation to sufficiently address the needs of patients with skin of color.
One way to compensate for the lack of ethnic diversity encountered in areas such as the MW and NW would be to develop educational programs featuring experts on skin of color.6 These specialists would not only train dermatology residents in areas of the country currently lacking ethnic diversity but also expand the expertise for treating patients with skin of color. Additionally, dedicated multiethnic skin clinics and externships devoted solely to treating patients with skin of color could be encouraged for residency training.6 Finally, community outreach through volunteer clinics may provide residents exposure to patients with skin of color seeking dermatologic care.10
This study was limited by the small number of respondents, but we were able to extract important trends and data from the collected responses. It is possible that respondents felt strongly about topics involving patients with skin of color, and the results were skewed to reflect individual bias. Additional limitations included not asking respondents for program names and population density (eg, urban, suburban, rural). Future studies should be directed toward analyzing how the diversity of the local population influences training in patients with skin of color, comparing program directors’ perceptions with residents’ perceptions on training in skin of color, and assessing patient perception of residents’ training in skin of color.
Conclusion
In the last decade it has become increasingly apparent that the US population is diversifying and that patients with skin of color will comprise a substantial proportion of the future population,8,11 which emphasizes the need for dermatology residency programs to ensure that residents receive adequate training and exposure to patients with skin of color as well as the distinct skin diseases seen more commonly in these populations.12
- Luther N, Darvin ME, Sterry W, et al. Ethnic differences in skin physiology, hair follicle morphology and follicular penetration. Skin Pharmacol Physiol. 2012;25:182-191.
- Shokeen D. Postinflammatory hyperpigmentation in patients with skin of color. Cutis. 2016;97:E9-E11.
- Lawson CN, Hollinger J, Sethi S, et al. Updates in the understanding and treatments of skin & hair disorders in women of color. Int J Women’s Dermatol. 2017;3:S21-S37.
- Hu S, Parmet Y, Allen G, et al. Disparity in melanoma: a trend analysis of melanoma incidence and stage at diagnosis among whites, Hispanics, and blacks in Florida. Arch Dermatol. 2009;145:1369-1374.
- Colby SL, Ortman JM; US Census Bureau. Projections of the Size and Composition of the U.S. Population: 2014 to 2060. Washington, DC: US Census Bureau; 2014. Current Population Reports, P25-1143. https://census.gov/content/dam/Census/library/publications/2015/demo/p25-1143.pdf. Published March 2015. Accessed May 13, 2020.
- Nijhawan RI, Jacob SE, Woolery-Lloyd H. Skin of color education in dermatology residency programs: does residency training reflect the changing demographics of the United States? J Am Acad Dermatol. 2008;59:615-618.
- Pritchett EN, Pandya AG, Ferguson NN, et al. Diversity in dermatology: roadmap for improvement. J Am Acad Dermatol. 2018;79:337-341.
- Pandya AG, Alexis AF, Berger TG, et al. Increasing racial and ethnic diversity in dermatology: a call to action. J Am Acad Dermatol. 2016;74:584-587.
- Ernst H, Colthorpe K. The efficacy of interactive lecturing for students with diverse science backgrounds. Adv Physiol Educ. 2007;31:41-44.
- Allday E. UCSF opens ‘skin of color’ dermatology clinic to address disparity in care. San Francisco Chronicle. March 20, 2019. https://www.sfchronicle.com/health/article/UCSF-opens-skin-of-color-dermatology-clinic-13704387.php. Accessed May 13, 2020.
- Van Voorhees AS, Enos CW. Diversity in dermatology residency programs. J Investig Dermatol Symp Proc. 2017;18:S46-S49.
- Enos CW, Harvey VM. From bench to bedside: the Hampton University Skin of Color Research Institute 2015 Skin of Color Symposium. J Investig Dermatol Symp Proc. 2017;18:S29-S30.
Dermatologic treatment of patients with skin of color offers specific challenges. Studies have reported structural, morphologic, and physiologic distinctions among different ethnic groups,1 which may account for distinct clinical presentations of skin disease seen in patients with skin of color. Patients with skin of color are at increased risk for specific dermatologic conditions, such as postinflammatory hyperpigmentation, keloid development, and central centrifugal cicatricial alopecia.2,3 Furthermore, although skin cancer is less prevalent in patients with skin of color, it often presents at a more advanced stage and with a worse prognosis compared to white patients.4
Prior studies have demonstrated the need for increased exposure, education, and training in diseases pertaining to skin of color in US dermatology residency programs.6-8 The aim of this study was to assess if dermatologists in-training feel that their residency curriculum sufficiently educates them on the needs of patients with skin of color.
Methods
A 10-question anonymous survey was emailed to 109 dermatology residency programs to evaluate the attitudes of dermatology residents about their exposure to patients with skin of color and their skin-of-color curriculum. The study included individuals 18 years or older who were current residents in a dermatology program accredited by the Accreditation Council for Graduate Medical Education.
Results
When asked the number of hours of lecture per month necessary to gain competence in conditions affecting patients with skin of color, 67% agreed that 1 to 5 hours was sufficient (Table 3). There were significant differences in the responses between the NE and SE (P=.024) and the SE and MW (P=.007). Of all respondents, 53% reported 1 to 5 months of clinical training are needed to gain competence in treating conditions affecting patients with skin of color, with significant differences in responses between the NE and MW (P<.001), the NE and SW (P=.019), and the SE and MW (P=.015)(Table 4).
Comment
Responses varied by practicing region
Although interactive lectures and textbook readings are important for obtaining a foundational understanding of dermatologic disease, they cannot substitute for clinical interactions and hands-on experience treating patients with skin of color.9 Not only do clinical interactions encourage independent reading and the study of encountered diagnoses, but intercommunication with patients may have a more profound and lasting impact on residents’ education.
Different regions of the United States have varying distributions of patients with skin of color, and dermatology residency program training reflects these disparities.6 In areas of less diversity, dermatology residents examine, diagnose, and treat substantially fewer patients with skin of color. The desire for more diverse training supports the prior findings of Nijhawan et al6 and is reflected in the responses we received in our study, whereby residents from the less ethnically diversified regions of the MW and NW were more likely to agree that clinics and rotations were necessary for training in preparation to sufficiently address the needs of patients with skin of color.
One way to compensate for the lack of ethnic diversity encountered in areas such as the MW and NW would be to develop educational programs featuring experts on skin of color.6 These specialists would not only train dermatology residents in areas of the country currently lacking ethnic diversity but also expand the expertise for treating patients with skin of color. Additionally, dedicated multiethnic skin clinics and externships devoted solely to treating patients with skin of color could be encouraged for residency training.6 Finally, community outreach through volunteer clinics may provide residents exposure to patients with skin of color seeking dermatologic care.10
This study was limited by the small number of respondents, but we were able to extract important trends and data from the collected responses. It is possible that respondents felt strongly about topics involving patients with skin of color, and the results were skewed to reflect individual bias. Additional limitations included not asking respondents for program names and population density (eg, urban, suburban, rural). Future studies should be directed toward analyzing how the diversity of the local population influences training in patients with skin of color, comparing program directors’ perceptions with residents’ perceptions on training in skin of color, and assessing patient perception of residents’ training in skin of color.
Conclusion
In the last decade it has become increasingly apparent that the US population is diversifying and that patients with skin of color will comprise a substantial proportion of the future population,8,11 which emphasizes the need for dermatology residency programs to ensure that residents receive adequate training and exposure to patients with skin of color as well as the distinct skin diseases seen more commonly in these populations.12
- Luther N, Darvin ME, Sterry W, et al. Ethnic differences in skin physiology, hair follicle morphology and follicular penetration. Skin Pharmacol Physiol. 2012;25:182-191.
- Shokeen D. Postinflammatory hyperpigmentation in patients with skin of color. Cutis. 2016;97:E9-E11.
- Lawson CN, Hollinger J, Sethi S, et al. Updates in the understanding and treatments of skin & hair disorders in women of color. Int J Women’s Dermatol. 2017;3:S21-S37.
- Hu S, Parmet Y, Allen G, et al. Disparity in melanoma: a trend analysis of melanoma incidence and stage at diagnosis among whites, Hispanics, and blacks in Florida. Arch Dermatol. 2009;145:1369-1374.
- Colby SL, Ortman JM; US Census Bureau. Projections of the Size and Composition of the U.S. Population: 2014 to 2060. Washington, DC: US Census Bureau; 2014. Current Population Reports, P25-1143. https://census.gov/content/dam/Census/library/publications/2015/demo/p25-1143.pdf. Published March 2015. Accessed May 13, 2020.
- Nijhawan RI, Jacob SE, Woolery-Lloyd H. Skin of color education in dermatology residency programs: does residency training reflect the changing demographics of the United States? J Am Acad Dermatol. 2008;59:615-618.
- Pritchett EN, Pandya AG, Ferguson NN, et al. Diversity in dermatology: roadmap for improvement. J Am Acad Dermatol. 2018;79:337-341.
- Pandya AG, Alexis AF, Berger TG, et al. Increasing racial and ethnic diversity in dermatology: a call to action. J Am Acad Dermatol. 2016;74:584-587.
- Ernst H, Colthorpe K. The efficacy of interactive lecturing for students with diverse science backgrounds. Adv Physiol Educ. 2007;31:41-44.
- Allday E. UCSF opens ‘skin of color’ dermatology clinic to address disparity in care. San Francisco Chronicle. March 20, 2019. https://www.sfchronicle.com/health/article/UCSF-opens-skin-of-color-dermatology-clinic-13704387.php. Accessed May 13, 2020.
- Van Voorhees AS, Enos CW. Diversity in dermatology residency programs. J Investig Dermatol Symp Proc. 2017;18:S46-S49.
- Enos CW, Harvey VM. From bench to bedside: the Hampton University Skin of Color Research Institute 2015 Skin of Color Symposium. J Investig Dermatol Symp Proc. 2017;18:S29-S30.
Practice Points
- To treat the ever-changing demographics of patients in the United States, dermatologists must receive adequate exposure and education regarding dermatologic conditions in patients from various ethnic backgrounds.
- Dermatology residents from less diverse regions are more likely to agree that dedicated clinics and rotations are important to gain competence compared to those from more diverse regions.
- In areas with less diversity, dedicated multiethnic skin clinics and faculty may be more important for assuring an adequate residency experience.
COVID-19: New group stands up for health professionals facing retaliation
Sejal Hathi, MD, and two colleagues had long kicked around the idea of starting a nonprofit group that would center on civic and legal advocacy.

Once the COVID-19 pandemic hit, the three friends – who have a mix of legal, medical, and advocacy backgrounds – began chatting by email and through Zoom video meetings about how to make the plan a reality.
“When COVID came around, we began talking about where we could make a difference and help people where help was needed most,” said Dr. Hathi, an internal medicine resident at Massachusetts General Hospital in Boston. “We decided the PPE issue makes a good first focus.”
The new organization – named Beacon – quickly mobilized, assembled their team, and launched a website. Beacon’s first project now aims to highlight and protect the legal rights of medical professionals who speak out about personal protection equipment (PPE) supply and other matters of public concern related to coronavirus.
In recent months, health care professionals have reported being reprimanded or even terminated for publicly discussing PPE shortages or sharing safety concerns. Other clinicians say they can’t share their experiences for fear of reprisal by their hospitals.

“The centrality of adequate PPE is pretty undeniable at this point,” said John Paul Schnapper-Casteras, JD, an attorney and cofounder of the organization. “In terms of speaking up about matters of workplace safety and public concern, when health care workers share knowledge, correct problems – and in some cases, blow the whistle – it affirmatively benefits medical science, disease control, and the public interest,” he said in an interview. “We have seen in other countries, the disastrous consequences that can stem from silencing medical professionals who try to speak out.”
Letter highlights hospitals’ obligations
As part of their efforts, Beacon leaders drafted a strongly worded letter on behalf of health care workers outlining the legal obligations of hospitals to ensure workplace safety, underscoring the federal protections that bar retaliation against employees who exercise their workplace rights. Whistleblower protections under the Occupational Safety and Health Act, the False Claims Act, and the National Labor Relations Act, for instance, prohibit retaliation against employees for blowing the whistle on unsafe or unlawful conditions.
Beacon’s letter urges hospitals to adopt a uniform policy that recognizes “the importance and legitimacy of doctors, nurses, and medical professionals who research, write, and speak about the use and supply of PPE in addressing coronavirus.”
“We are deeply troubled by reports that medical professionals are being fired, retaliated against, disciplined, or threatened for speaking (or potentially speaking) about PPE shortages and related safety conditions that directly place their and their patients’ lives in danger,” the letter states. “As a matter of law, medical personnel have a wide range of rights that protect their employment status and ability to comment on matters of public concern (and provide a cause of action in court if these rights are violated).”
Dr. Hathi, who over the last decade has founded two social enterprises advancing women’s rights, said organizers have sent the letter to hospitals and health systems that were publicly reported or otherwise known to have threatened, terminated, or retaliated against employees for protesting PPE shortages or speaking up about unsafe working conditions during this crisis. The letter is available on the Beacon website.
“Many letters have been written [recently] criticizing hospitals for retaliating against their workers,” Dr. Hathi said. “Ours amplifies this voice. But it also serves as a tool for self-empowerment, a stark warning to health systems that their actions bear consequences, and an assurance to health workers across the country that we’re listening and we’re here to help them safeguard their rights and their dignity at work.”
Dr. Hathi and her colleagues have also circulated the letter on social media and other platforms as a petition that health care professionals and others can sign in support of fair and safe treatment of employees with respect to PPE. So far, the group has collected signatures from individuals, communities, and organizations representing about 35,000 people, Dr. Hathi said.
Workplace rights, legal options
Beacon leaders have also begun counseling and advising health care workers who have experienced retaliation or discipline associated with PPE issues. Educating medical professionals about their workplace rights and legal options is another key focus of the group, according to its founders.
“There are a flurry of reports coming our way about physicians and nurses, as well as other health care workers, who are for whatever reason being disciplined or retaliated against for simply seeking appropriate safety policies at their workplaces,” Dr. Hathi said. “What we’ve found is that many of them don’t even know what their options look like. Doctors, nurses, health care workers are not the typical type to engage politically, to speak out, [or to] advocate for themselves.”
In one instance, they heard from a physician who wanted to protect nurses at his hospital because they did not have masks and were being coughed on by COVID-19 patients. The doctor requested that his hospital supply masks to the nurses. After making the request, the physician was disciplined by hospital leadership, Dr. Hathi said. In another case, a physician assistant told the group she was terminated because she wanted to wear her own mask in a hospital that was treating COVID patients.
“She was not allowed to, and she was fired for even bringing it up,” said Sheel Tyle, JD, an attorney and Beacon cofounder.
Beacon intends to assist health care workers who face such retaliation and discipline in a number of ways, Mr. Tyle said. For instance, by helping an individual get compensation for what happened, aiding the professional in getting their job back, or helping the worker retain a severance package of some kind, he said.
“And then there is the larger public policy issue of preventing the hospital from being a bad actor,” Mr. Tyle said. “That can be done through state or federal complaints, largely under different statutes related to workplace protection or OSHA. Our group [has] lawyers that could represent clients individually as well as a number of friends who are attorneys in various states who we could partner with, depending on the situation.”
While the organization is positioned to represent health professionals in lawsuits if necessary, Mr. Tyle emphasized that litigation is not the intended goal of the group. Rather, they are seeking to deter hospitals and others from being “bad actors,” through any number of methods, including communication, advocacy, or complaints.
Ultimately, Dr. Hathi said she hopes the organization’s efforts activate health care workers as an organizing body and in the process, spark policy change at the federal level to better protect health care workers.
“The challenges we’re facing now – protecting workplace safety, employee voice, a living wage, adequate sick and family leave – long predate this pandemic,” Dr. Hathi said. “But they’ve deepened and acquired existential significance as, battered by policy failures and the unsparing virus itself, physicians shed their political indifference and join a growing nationwide chorus to restore workers’ rights and to fundamentally reimagine our broken healthcare system. Now, more than ever before, organizations like Beacon are vital for arming health workers in this fight.”
Sejal Hathi, MD, and two colleagues had long kicked around the idea of starting a nonprofit group that would center on civic and legal advocacy.
Once the COVID-19 pandemic hit, the three friends – who have a mix of legal, medical, and advocacy backgrounds – began chatting by email and through Zoom video meetings about how to make the plan a reality.
“When COVID came around, we began talking about where we could make a difference and help people where help was needed most,” said Dr. Hathi, an internal medicine resident at Massachusetts General Hospital in Boston. “We decided the PPE issue makes a good first focus.”
The new organization – named Beacon – quickly mobilized, assembled their team, and launched a website. Beacon’s first project now aims to highlight and protect the legal rights of medical professionals who speak out about personal protection equipment (PPE) supply and other matters of public concern related to coronavirus.
In recent months, health care professionals have reported being reprimanded or even terminated for publicly discussing PPE shortages or sharing safety concerns. Other clinicians say they can’t share their experiences for fear of reprisal by their hospitals.
“The centrality of adequate PPE is pretty undeniable at this point,” said John Paul Schnapper-Casteras, JD, an attorney and cofounder of the organization. “In terms of speaking up about matters of workplace safety and public concern, when health care workers share knowledge, correct problems – and in some cases, blow the whistle – it affirmatively benefits medical science, disease control, and the public interest,” he said in an interview. “We have seen in other countries, the disastrous consequences that can stem from silencing medical professionals who try to speak out.”
Letter highlights hospitals’ obligations
As part of their efforts, Beacon leaders drafted a strongly worded letter on behalf of health care workers outlining the legal obligations of hospitals to ensure workplace safety, underscoring the federal protections that bar retaliation against employees who exercise their workplace rights. Whistleblower protections under the Occupational Safety and Health Act, the False Claims Act, and the National Labor Relations Act, for instance, prohibit retaliation against employees for blowing the whistle on unsafe or unlawful conditions.
Beacon’s letter urges hospitals to adopt a uniform policy that recognizes “the importance and legitimacy of doctors, nurses, and medical professionals who research, write, and speak about the use and supply of PPE in addressing coronavirus.”
“We are deeply troubled by reports that medical professionals are being fired, retaliated against, disciplined, or threatened for speaking (or potentially speaking) about PPE shortages and related safety conditions that directly place their and their patients’ lives in danger,” the letter states. “As a matter of law, medical personnel have a wide range of rights that protect their employment status and ability to comment on matters of public concern (and provide a cause of action in court if these rights are violated).”
Dr. Hathi, who over the last decade has founded two social enterprises advancing women’s rights, said organizers have sent the letter to hospitals and health systems that were publicly reported or otherwise known to have threatened, terminated, or retaliated against employees for protesting PPE shortages or speaking up about unsafe working conditions during this crisis. The letter is available on the Beacon website.
“Many letters have been written [recently] criticizing hospitals for retaliating against their workers,” Dr. Hathi said. “Ours amplifies this voice. But it also serves as a tool for self-empowerment, a stark warning to health systems that their actions bear consequences, and an assurance to health workers across the country that we’re listening and we’re here to help them safeguard their rights and their dignity at work.”
Dr. Hathi and her colleagues have also circulated the letter on social media and other platforms as a petition that health care professionals and others can sign in support of fair and safe treatment of employees with respect to PPE. So far, the group has collected signatures from individuals, communities, and organizations representing about 35,000 people, Dr. Hathi said.
Workplace rights, legal options
Beacon leaders have also begun counseling and advising health care workers who have experienced retaliation or discipline associated with PPE issues. Educating medical professionals about their workplace rights and legal options is another key focus of the group, according to its founders.
“There are a flurry of reports coming our way about physicians and nurses, as well as other health care workers, who are for whatever reason being disciplined or retaliated against for simply seeking appropriate safety policies at their workplaces,” Dr. Hathi said. “What we’ve found is that many of them don’t even know what their options look like. Doctors, nurses, health care workers are not the typical type to engage politically, to speak out, [or to] advocate for themselves.”
In one instance, they heard from a physician who wanted to protect nurses at his hospital because they did not have masks and were being coughed on by COVID-19 patients. The doctor requested that his hospital supply masks to the nurses. After making the request, the physician was disciplined by hospital leadership, Dr. Hathi said. In another case, a physician assistant told the group she was terminated because she wanted to wear her own mask in a hospital that was treating COVID patients.
“She was not allowed to, and she was fired for even bringing it up,” said Sheel Tyle, JD, an attorney and Beacon cofounder.
Beacon intends to assist health care workers who face such retaliation and discipline in a number of ways, Mr. Tyle said. For instance, by helping an individual get compensation for what happened, aiding the professional in getting their job back, or helping the worker retain a severance package of some kind, he said.
“And then there is the larger public policy issue of preventing the hospital from being a bad actor,” Mr. Tyle said. “That can be done through state or federal complaints, largely under different statutes related to workplace protection or OSHA. Our group [has] lawyers that could represent clients individually as well as a number of friends who are attorneys in various states who we could partner with, depending on the situation.”
While the organization is positioned to represent health professionals in lawsuits if necessary, Mr. Tyle emphasized that litigation is not the intended goal of the group. Rather, they are seeking to deter hospitals and others from being “bad actors,” through any number of methods, including communication, advocacy, or complaints.
Ultimately, Dr. Hathi said she hopes the organization’s efforts activate health care workers as an organizing body and in the process, spark policy change at the federal level to better protect health care workers.
“The challenges we’re facing now – protecting workplace safety, employee voice, a living wage, adequate sick and family leave – long predate this pandemic,” Dr. Hathi said. “But they’ve deepened and acquired existential significance as, battered by policy failures and the unsparing virus itself, physicians shed their political indifference and join a growing nationwide chorus to restore workers’ rights and to fundamentally reimagine our broken healthcare system. Now, more than ever before, organizations like Beacon are vital for arming health workers in this fight.”
Testing the limits of medical technology
On March 9 my team was given a directive by the chief medical officer of our health system. It seemed like an impossible task, involving the mobilization of people, processes, and technology at a scale and speed we had never before achieved. It turned out getting this done was impossible. In spite of our best efforts, we failed to meet the deadline – it actually took us 3 days. Still, by March 12, we had opened the doors on the first community testing site in our area and gained the attention of local and national news outlets for our accomplishment.
Now more than 2 months later, I’m quite proud of what our team was able to achieve for the health system, but I’m still quite frustrated at the state of COVID-19 testing nationwide – there’s simply not enough available, and there is tremendous variability in the reliability of the tests. In this column, we’d like to highlight some of the challenges we’ve faced and reflect on how the shortcomings of modern technology have once again proven that medicine is both a science and an art.
Our dangerous lack of preparation
Prior to the coronavirus pandemic, I had never considered surgical masks, face shields, and nasal swabs to be critical components of medical technology. My opinion quickly changed after opening our drive-through COVID-19 site. I now have a much greater appreciation for the importance of personal protective equipment and basic testing supplies.
I was shocked by how difficult obtaining it has been during the past few months. It seems that no one anticipated the possibility of a pandemic on this grand a scale, so stockpiles of equipment were depleted quickly and couldn’t be replenished. Also, most manufacturing occurs outside the United States, which creates additional barriers to controlling the supply chain. One need not look far to find stories of widespread price-gouging, black market racketeering, and even hijackings that have stood in the way of accessing the necessary supplies. Sadly, the lack of equipment is far from the only challenge we’ve faced. In some cases, it has been a mistrust of results that has prevented widespread testing and mitigation.
The risks of flying blind
When President Trump touted the introduction of a rapid COVID-19 test at the end of March, many people were excited. Promising positive results in as few as 5 minutes, the assay was granted an Emergency Use Authorization (EUA) by the Food and Drug Administration in order to expedite its availability in the market. According to the FDA’s website, an EUA allows “unapproved medical products or unapproved uses of approved medical products to be used in an emergency to diagnose, treat, or prevent serious or life-threatening diseases or conditions.” This rapid (though untested) approval was all that many health care providers needed to hear – immediately hospitals and physicians scrambled to get their hands on the testing devices. Unfortunately, on May 14th, the FDA issued a press release that raised concerns about that same test because it seemed to be reporting a high number of false-negative results. Just as quickly as the devices had been adopted, health care providers began backing away from them in favor of other assays, and a serious truth about COVID-19 testing was revealed: In many ways, we’re flying blind.
Laboratory manufacturers have been working overtime to create assays for SARS-CoV-2 (the coronavirus that causes COVID-19) and have used different technologies for detection. The most commonly used are polymerase chain reaction (PCR) tests. In these assays, viral RNA is converted to DNA by reverse transcriptase, then amplified through the addition of primers that enable detection. PCR technology has been available for years and is a reliable method for identifying DNA and RNA, but the required heating and cooling process takes time and results can take several hours to return. To address this and expedite testing, other methods of detection have been tried, such as the loop-mediated isothermal amplification (LAMP) technique employed by the rapid assay mentioned above. Regardless of methodology, all laboratory tests have one thing in common: None of them is perfect.
Every assay has a different level of reliability. When screening for a disease such as COVID-19, we are particularly interested in a test’s sensitivity (that is, it’s ability to detect disease); we’d love such a screening test to be 100% sensitive and thereby not miss a single case. In truth, no test’s sensitivity is 100%, and in this particular case even the best assays only score around 98%. This means that out of every 100 patients with COVID-19 who are evaluated, two might test negative for the virus. In a pandemic this can have dire consequences, so health care providers – unable to fully trust their instruments – must employ clinical acumen and years of experience to navigate these cloudy skies. We are hopeful that additional tools will complement our current methods, but with new assays also come new questions.
Is anyone safe?
We receive regular questions from physicians about the value of antibody testing, but it’s not yet clear how best to respond. While the assays seem to be reliable, the utility of the results are still ill defined. Antibodies to SARS-CoV-2 (both IgG and IgM) appear to peak about 2-3 weeks after symptom onset, but we don’t yet know if the presence of those antibodies confers long-term immunity. Therefore, patients should not use the information to change their masking or social-distancing practices, nor should they presume that they are safe from becoming reinfected with COVID-19. While new research looks promising, there are still too many unknowns to be able to confidently reassure providers or patients of the true value of antibody testing. This underscores our final point: Medicine remains an art.
As we are regularly reminded, we’ll never fully anticipate the challenges or barriers to success, and technology will never replace the value of clinical judgment and human experience. While the situation is unsettling in many ways, we are reassured and encouraged by the role we still get to play in keeping our patients healthy in this health care crisis, and we’ll continue to do so through whatever the future holds.
Dr. Notte is a family physician and chief medical officer of Abington Lansdale (Pa.) Hospital - Jefferson Health. Follow him on Twitter (@doctornotte). Dr. Skolnik is professor of family and community medicine at Sidney Kimmel Medical College, Philadelphia, and associate director of the family medicine residency program at Abington (Pa.) Hospital–Jefferson Health. They have no conflicts related to the content of this piece.
New York City inpatient detox unit keeps running: Here’s how
Substance use disorder and its daily consequences take no breaks even during a pandemic. The stressors created by COVID-19, including deaths of loved ones and the disruptions to normal life from policies aimed at flattening the curve, seem to have increased substance use.
I practice as a hospitalist with an internal medicine background and specialty in addiction medicine at BronxCare Health System’s inpatient detoxification unit, a 24/7, 20-bed medically-supervised unit in South Bronx in New York City. It is one of the comprehensive services provided by the BronxCare’s life recovery center and addiction services, which also includes an outpatient clinic, opioid treatment program, inpatient rehab, and a half-way house. Inpatient detoxification units like ours are designed to treat serious addictions and chemical dependency and prevent and treat life-threatening withdrawal symptoms and signs or complications. Our patients come from all over the city and its adjoining suburbs, including from emergency room referrals, referral clinics, courts and the justice system, walk-ins, and self-referrals.
At a time when many inpatient detoxification units within the city were temporarily closed due to fear of inpatient spread of the virus or to provide extra COVID beds in anticipation for the peak surge, we have been able to provide a needed service. In fact, several other inpatient detoxification programs within the city have been able to refer their patients to our facility.
Individuals with substance use disorder have historically been a vulnerable and underserved population and possess high risk for multiple health problems as well as preexisting conditions. Many have limited life options financially, educationally, and with housing, and encounter barriers to accessing primary health care services, including preventive services. The introduction of the COVID-19 pandemic into these patients’ precarious health situations only made things worse as many of the limited resources for patients with substance use disorder were diverted to battling the pandemic. Numerous inpatient and outpatient addiction services, for example, were temporarily shut down. This has led to an increase in domestic violence, and psychiatric decompensation, including psychosis, suicidal attempts, and worsening of medical comorbidities in these patients.
Our wake-up call came when the first case of COVID-19 was confirmed in New York in early March. Within a short period of time the state became the epicenter for COVID-19. With the projection of millions of cases being positive and the number of new cases doubling every third day at the onset in New York City, we knew we had a battle brewing and needed to radically transform our mode of operation fast.
Our first task was to ensure the safety of our patients and the dedicated health workers attending to them. We streamlined the patient point of entry through one screening site, while also brushing up on our history-taking to intently screen for COVID-19. This included not just focusing on travels from China, but from Europe and other parts of the world.
Yes, we did ask patients about cough, fever, shortness of breath or difficulty breathing, feeling fatigued, severe body ache, and possible contact with someone who is sick or has traveled overseas. But we were also attuned to the increased rate of community spread and the presentation of other symptoms, such as loss of taste and smell, early in the process. Hence we were able to triage patients with suspected cases to the appropriate sections of the hospital for further screening, testing, and evaluation, instead of having those patients admitted to the detox unit.
Early in the process a huddle team was instituted with daily briefing of staff lasting 30 minutes or less. This team consists of physicians, nurses, a physician assistant, a social worker, and a counselor. In addition to discussing treatment plans for the patient, they deliberate on the public health information from the hospital’s COVID-19 command center, New York State Department of Health, the Office of Mental Health, and the Centers for Disease Control and Prevention concerning the latest evidence-based information. These discussions have helped us modify our policies and practices.
We instituted a no visiting rule during a short hospital stay of 5-7 days, and this was initiated weeks in advance of many institutions, including nursing homes with vulnerable populations. Our admitting criteria was reviewed to allow for admission of only those patients who absolutely needed inpatient substance use disorder treatment, including patients with severe withdrawal symptoms and signs, comorbidities, or neuropsychiatric manifestations that made them unsafe for outpatient or home detoxification. Others were triaged to the outpatient services which was amply supported with telemedicine. Rooms and designated areas of the building were earmarked as places for isolation/quarantine if suspected COVID-19 cases were identified pending testing. To assess patients’ risk of COVID-19, we do point-of-care nasopharyngeal swab testing with polymerase chain reaction.
Regarding face masks, patients and staff were fitted with ones early in the process. Additionally, staff were trained on the importance of face mask use and how to ensure you have a tight seal around the mouth and nose and were provided with other appropriate personal protective equipment. Concerning social distancing, we reduced the patient population capacity for the unit down to 50% and offered only single room admissions. Social distancing was encouraged in the unit, including in the television and recreation room and dining room, and during small treatment groups of less than six individuals. Daily temperature checks with noncontact handheld thermometers were enforced for staff and anyone coming into the life recovery center.
Patients are continuously being educated on the presentations of COVID-19 and encouraged to report any symptoms. Any staff feeling sick or having symptoms are encouraged to stay home. Rigorous and continuous cleaning of surfaces, especially of areas subjected to common use, is done frequently by the hospital housekeeping and environmental crew and is the order of the day.
Dr. Fagbemi is a hospitalist at BronxCare Health System, a not-for-profit health and teaching hospital system serving South and Central Bronx in New York. He has no conflicts of interest to disclose.
Private practice to private equity-backed MSO - perspectives from the United Digestive team - Part 1
Author's note: This is the first of a two-part series. In December 2018, Atlanta Gastroenterology Associates partnered with Frazier Healthcare Partners to form the practice management company United Digestive (UD). Since that time, colleagues across the country have evaluated their own private equity prospects and partnerships, as well as monitored the progress of our transition.
Our guiding principle is to provide a best-in-class operational infrastructure, so independent gastroenterologists can focus on delivering the highest quality patient care. Thus, in the first year, significant efforts and capital have been invested into United Digestive’s scalable platform to promote organic growth, as well as facilitate a smooth transition for other groups and physicians joining the team. So how are things going? Enjoy this two-part article where we reached out to several team members from all levels within the organization and asked them to share their personal experiences – both highlights and challenges – during UD’s first year. Here’s what they had to say.
During the COVID-19 crisis, how has UD management responded? How has the UD management services organization model affected partner level physician (PLP) compensation?
Dr. Marc Rosenberg, UD Physician Executive Committee member:
- “Immediately, the entire leadership team recognized the threat of COVID to our community, patients, staff, and business. A multidisciplinary task force including clinical and business leaders utilized our PE partner’s vast resources, local hospital expertise, national societal recommendations and colleagues’ experiences from around the country to focus on protocols and procedures to protect our patients and staff. A few of the team’s timely decisions included: closing the majority of our patient fronting services, transitioning to telehealth, hiring an infection control consultant, allowing physical distancing of our staff with off sight work, instituting symptomatic pathways, donating personal protective gear to local hospitals, covering all benefits as well as provided resources to obtain government benefits to furloughed team members, developing a provider wellness program, and encouraging hospital coverage considerations for high risk providers. I also know the team is focusing on how we re-open at the appropriate time with necessary safety considerations, like investigating testing options and ensuring appropriate PPE is in place. The collaboration between clinical and business leadership has been tremendous through this evolving and challenging period. As for UD physician partner compensation, our model is uniquely organized such that the MSO covers all overhead expenses with partners contributing a fixed percentage of a partner’s collections, while others typically share overhead expenses. During uncertain times, like the COVID-19 crisis, it is reassuring to partners to know that they are not responsible for the cost of infrastructure (i.e. leases, capital equipment, EHR system, consultants, etc.) and staffing, including current and new associates.”
With formation of United Digestive as an MSO, has your day-to-day work life changed or your clinical decision-making been impacted?
Dr. Aja McCutchen, UD Physician Executive Committee Member:
- “With the formation of UD, my daily work life has changed very little; however, with their focus on improving “back-office” functions, my schedule is now fully optimized by reducing gaps from cancellations with same-day/next-day scheduling. In addition, the patient experience has been enhanced with decreased wait times, easier appointment scheduling, and quicker access to support staff. The procurement of business intelligence tools, and, more importantly, the implementation of dashboards, has provided much needed visibility across the organization allowing managerial decisions to be driven by accurate data.
From a clinical decision-making standpoint, Atlanta Gastroenterology was already armed with strong clinical teams and committees. We have been able to build upon our pre-existing committees and optimize their ability to steward best practices and develop clinical pathways. This, in turn, translates to consistency across the organization in the delivery of evidence-based, comprehensive GI care.”
Kimberly Orleck, PA-C, Advanced Practice Provider (APP) Supervisor:
- “The formation of UD has not affected my clinical decision-making abilities. In fact, this new platform is dedicated to empowering and establishing APPs as independent clinicians with appropriate physician oversight. As a result, I have welcomed more administrative responsibilities and have become more involved in business meetings and decision making. We have worked together to better utilize APPs using data to match supply with demand.”
Physician compensation improvement is typically a key concern for physicians who work with private equity MSOs. How has United Digestive performed for its partner-level physicians in year one?
Dr. Marc Rosenberg:
- “The MSO has helped to improve physician income – slowly at first and now on a steeper trajectory. We have been ahead of expected income improvement based on models we reviewed when evaluating the formations of an MSO in potential partnership with Frazier Healthcare Partners. United Digestive’s EBIDTA, of which each partner-level physician owns a significant percentage through shares from rollover proceeds, has grown impressively in one year. This has been achieved mostly through significant organic growth and to a lesser degree through mergers and acquisitions. UD has helped to enhance the bottom line through increased reimbursements from payor negotiated contracts, new revenue-generating service lines, and operational efficiencies.”
Dr. Patel and Dr. Sonnenshine are with Atlanta Gastroenterology Associates in Atlanta, which is part of United Digestive. They have no conflicts.
*This story was updated on 6/1/2020.
Patient-focused precautions, testing help blunt pandemic effects on heme-onc unit
Keeping hematologic oncology patients on their treatment regimens and caring for inpatients with hematologic malignancies remained “manageable” during the first 2 months of the COVID-19 pandemic at Levine Cancer Institute in Charlotte, N.C.

That level of manageability has partly been because a surge in cases so far hasn’t arrived at Levine or in most of the surrounding North Carolina and South Carolina communities it serves. As of May 15, 2020, the total number of confirmed and reported COVID-19 cases had reached about 19,000 in North Carolina, and just under 9,000 in South Carolina, out of a total population in the two states of close to 16 million. What’s happened instead at Levine Cancer Institute (LCI) has been a steady but low drumbeat of cases that, by mid-May 2020, totaled fewer than 10 patients with hematologic malignancies diagnosed with COVID-19.
“For a large system with multiple sites throughout North and South Carolina that saw 17,200 new patients in 2019 – including solid tumor, benign hematology, and malignant hematology patients – with 198,000 total patient visits, it is safe to say that we are off to a good start. However, we remain in the early throes of the pandemic and we will need to remain vigilant going forward,” said Peter Voorhees, MD, professor of medicine and director of Medical Operations and Outreach Services in LCI’s Department of Hematologic Oncology and Blood Disorders.
The limited effects to date of COVID-19 at LCI has been thanks to a regimen of great caution for preventing infections that’s been consistently conveyed to LCI patients from before the pandemic’s onset, liberal testing that started early, a proactive plan to defer and temporarily replace infusion care when medically appropriate, a novel staffing approach designed to minimize and contain potential staff outbreaks, and an early pivot to virtual patient contact when feasible.
COVID-19 has had limited penetration into the LCI case load because patients have, in general, “been very careful,” said Dr. Voorhees.
“My impression is that the incidence has been low partly because our patients, especially those with hematologic malignancies including those on active chemotherapy, were already getting warned to be cautious even before the coronavirus using distancing, masking, and meticulous hand hygiene,” he said in an interview that reviewed the steps LCI took starting in March to confront and manage the effects of the then-nascent pandemic. “Since we started screening asymptomatic patients in the inpatient and outpatient settings we have identified only one patient with COVID-19 infection, which supports the low rate of infection in our patient population thus far.”
Another key step was the launch of “robust” testing for the COVID-19 virus starting on March 9, using an in-house assay from LCI’s parent health system, Atrium Health, that delivered results within 24 hours. Testing became available at LCI “earlier than at many other health systems.” At first, testing was limited to patients or staff presenting with symptoms, but in the following weeks, it expanded to more patients, including those without symptoms who were scheduled for treatment at the apheresis center, cell donors and cell recipients, patients arriving for inpatient chemotherapy or cellular therapy, patients arriving from a skilled nursing facility or similar environments, and more recently, outpatient chemotherapy patients. “We’re now doing a lot of screening,” Dr. Voorhees said. “In general, screening has been well received because patients recognize that it’s for their own safety.”
Another piece of COVID-19 preparedness was a move toward technology as an alternative to face-to-face encounters between patients and staff. “We adopted virtual technology early.” When medically appropriate, they provided either video consultations with more tech-savvy patients or telephone-based virtual visits for patients who preferred a more familiar interface. As LCI starts the process of reentry for patients whose face-to-face encounters were deferred, virtual visits will remain an important facet of maintaining care while limiting exposure for appropriate patients and facilitating adequate space for social distancing in the clinics and infusion centers.
Atrium Health also launched a “virtual hospital” geared to intensified remote management of COVID-19 patients who aren’t sick enough for hospitalization. “People who test positive automatically enter the virtual hospital and have regular interactions with their team of providers,” with LCI providing additional support for their patients who get infected. Patients receive an equipment kit that lets them monitor and transmit their vital signs. The virtual hospital program also helps expedite personal needs like delivery of prescriptions and food. “It helps patients manage at home, and has been incredibly useful,” said Dr. Voorhees.
Perhaps the most challenging step LCI clinicians took to preclude a potential COVID-19 case surge was to review all patients receiving infusional therapy or planned cellular therapy and triage those who could potentially tolerate a temporary change to either an oral, at-home regimen or to a brief hold on their treatment. Some patients on maintenance, outpatient infusion-therapy regimens “expressed concern about coming to the clinic. We looked at the patients scheduled to come for infusions and decided which visits were essential and which were deferrable without disrupting care by briefly using a noninfusional approach,” said Dr. Voorhees. The number of patients who had their regimens modified or held was “relatively small,” and with the recent recognition that a surge of infections has not occurred, “we’re now rolling out cautious reentry of those patients back to their originally prescribed chemotherapy.”
In addition to concerns of exposure at infusion clinics, there are concerns about the heightened susceptibility of immunosuppressed hematologic oncology patients to COVID-19 and their risk for more severe infection. “Our view is that, if patients tested positive, continuing immunosuppressive treatment would likely be detrimental,” so when possible treatment is temporarily suspended and then resumed when the infection has cleared. “When patients test positive for a prolonged period, a decision to resume treatment must be in the best interests of the patient and weigh the benefits of resuming therapy against the risks of incurring a more severe infection by restarting potentially immunosuppressive therapy,” Dr. Voorhees said.
The enhanced risk that cancer patients face if they develop COVID-19 was documented in a recent review of 218 cancer patients hospitalized for COVID-19 during parts of March and April in a large New York health system. The results showed an overall mortality rate of 28%, including a 37% rate among 54 patients with hematologic malignancies and a 25% rate among 164 patients with solid tumors. The mortality rate “may not be quite as high as they reported because that depends on how many patients you test, but there is no question that patients with more comorbidities are at higher risk. Patients with active cancer on chemotherapy are a particularly vulnerable population, and many have expressed concerns about their vulnerability,” he observed.
For the few LCI patients who developed COVID-19 infection, the medical staff has had several therapeutic options they could match to each patient’s needs, with help from the Atrium Health infectious disease team. LCI and Atrium Health are participating in several COVID-19 clinical treatment trials, including an investigational convalescent plasma protocol spearheaded by the Mayo Clinic. They have also opened a randomized, phase 2 trial evaluating the safety and efficacy of selinexor (Xpovio), an oral drug that’s Food and Drug Administration approved for patients with multiple myeloma, for treatment of moderate or severe COVID-19 infection. Additional studies evaluating blockade of granulocyte-macrophage colony-stimulating factor, as well as inhaled antiviral therapy, have recently launched, and several additional studies are poised to open in the coming weeks.
The LCI and Atrium Health team also has a supply of the antiviral agent remdesivir as part of the FDA’s expanded access protocol and emergency use authorization. They also have a supply of and experience administering the interleukin-6 receptor inhibitor tocilizumab (Actemra), which showed some suggestion of efficacy in limited experience treating patients with severe or critical COVID-19 infections. Clinicians at LCI have not used the investigational and unproven agents hydroxychloroquine, chloroquine, and azithromycin to either prevent or treat COVID-19.
LCI also instituted measures to try to minimize the risk that staff members could become infected and transmit the virus while asymptomatic. Following conversations held early on with COVID-19–experienced health authorities in China and Italy, the patient-facing LCI staff split into two teams starting on March 23 that alternated responsibility for direct patient interactions every 2 weeks. When one of these teams was off from direct patient contact they continued to care for patients remotely through virtual technologies. The concept was that, if a staffer became infected while remaining asymptomatic during their contact with patients, their status would either become diagnosable or resolve during their 2 weeks away from seeing any patients. Perhaps in part because of this approach infections among staff members “have not been a big issue. We’ve had an incredibly low infection rate among the LCI staff,” Dr. Voorhees noted.
By mid-May, with the imminent threat of a sudden CODIV-19 surge moderated, heme-onc operations at LCI began to cautiously revert to more normal operations. “We’re continuing patient screening for signs and symptoms of COVID-19 infection, testing for asymptomatic infections, and requiring masking and social distancing in the clinics and hospitals, but we’re starting to slowly restore the number of patients at our clinics [virtual and face to face[ and infusion centers,” and the staff’s division into two teams ended. “The idea was to get past a surge and make sure our system was not overwhelmed. We anticipated a local surge in late April, but then it kept getting pushed back. Current projections are for the infection rate among LCI patients to remain low provided that community spread remains stable or, ideally, decreases.” The LCI infectious disease staff is closely monitoring infection rates for early recognition of an outbreak, with plans to follow any new cases with contact tracing. So far, the COVID-19 pandemic at LCI “has been very manageable,” Dr. Voorhees concluded.
“We’re now better positioned to deal with a case surge if it were to happen. We could resume the two-team approach, hospital-wide plans are now in place for a future surge, and we are now up and running with robust testing and inpatient and outpatient virtual technology. The first time, we were all learning on the fly.”
The LCI biostatistics team has been prospectively collecting the Institutes’s COVID-19 patient data, with plans to report their findings.
Dr. Voorhees has had financial relationships with Bristol-Myers Squibb/Celgene, Janssen, Novartis, and Oncopeptides, none of which are relevant to this article.
Keeping hematologic oncology patients on their treatment regimens and caring for inpatients with hematologic malignancies remained “manageable” during the first 2 months of the COVID-19 pandemic at Levine Cancer Institute in Charlotte, N.C.
That level of manageability has partly been because a surge in cases so far hasn’t arrived at Levine or in most of the surrounding North Carolina and South Carolina communities it serves. As of May 15, 2020, the total number of confirmed and reported COVID-19 cases had reached about 19,000 in North Carolina, and just under 9,000 in South Carolina, out of a total population in the two states of close to 16 million. What’s happened instead at Levine Cancer Institute (LCI) has been a steady but low drumbeat of cases that, by mid-May 2020, totaled fewer than 10 patients with hematologic malignancies diagnosed with COVID-19.
“For a large system with multiple sites throughout North and South Carolina that saw 17,200 new patients in 2019 – including solid tumor, benign hematology, and malignant hematology patients – with 198,000 total patient visits, it is safe to say that we are off to a good start. However, we remain in the early throes of the pandemic and we will need to remain vigilant going forward,” said Peter Voorhees, MD, professor of medicine and director of Medical Operations and Outreach Services in LCI’s Department of Hematologic Oncology and Blood Disorders.
The limited effects to date of COVID-19 at LCI has been thanks to a regimen of great caution for preventing infections that’s been consistently conveyed to LCI patients from before the pandemic’s onset, liberal testing that started early, a proactive plan to defer and temporarily replace infusion care when medically appropriate, a novel staffing approach designed to minimize and contain potential staff outbreaks, and an early pivot to virtual patient contact when feasible.
COVID-19 has had limited penetration into the LCI case load because patients have, in general, “been very careful,” said Dr. Voorhees.
“My impression is that the incidence has been low partly because our patients, especially those with hematologic malignancies including those on active chemotherapy, were already getting warned to be cautious even before the coronavirus using distancing, masking, and meticulous hand hygiene,” he said in an interview that reviewed the steps LCI took starting in March to confront and manage the effects of the then-nascent pandemic. “Since we started screening asymptomatic patients in the inpatient and outpatient settings we have identified only one patient with COVID-19 infection, which supports the low rate of infection in our patient population thus far.”
Another key step was the launch of “robust” testing for the COVID-19 virus starting on March 9, using an in-house assay from LCI’s parent health system, Atrium Health, that delivered results within 24 hours. Testing became available at LCI “earlier than at many other health systems.” At first, testing was limited to patients or staff presenting with symptoms, but in the following weeks, it expanded to more patients, including those without symptoms who were scheduled for treatment at the apheresis center, cell donors and cell recipients, patients arriving for inpatient chemotherapy or cellular therapy, patients arriving from a skilled nursing facility or similar environments, and more recently, outpatient chemotherapy patients. “We’re now doing a lot of screening,” Dr. Voorhees said. “In general, screening has been well received because patients recognize that it’s for their own safety.”
Another piece of COVID-19 preparedness was a move toward technology as an alternative to face-to-face encounters between patients and staff. “We adopted virtual technology early.” When medically appropriate, they provided either video consultations with more tech-savvy patients or telephone-based virtual visits for patients who preferred a more familiar interface. As LCI starts the process of reentry for patients whose face-to-face encounters were deferred, virtual visits will remain an important facet of maintaining care while limiting exposure for appropriate patients and facilitating adequate space for social distancing in the clinics and infusion centers.
Atrium Health also launched a “virtual hospital” geared to intensified remote management of COVID-19 patients who aren’t sick enough for hospitalization. “People who test positive automatically enter the virtual hospital and have regular interactions with their team of providers,” with LCI providing additional support for their patients who get infected. Patients receive an equipment kit that lets them monitor and transmit their vital signs. The virtual hospital program also helps expedite personal needs like delivery of prescriptions and food. “It helps patients manage at home, and has been incredibly useful,” said Dr. Voorhees.
Perhaps the most challenging step LCI clinicians took to preclude a potential COVID-19 case surge was to review all patients receiving infusional therapy or planned cellular therapy and triage those who could potentially tolerate a temporary change to either an oral, at-home regimen or to a brief hold on their treatment. Some patients on maintenance, outpatient infusion-therapy regimens “expressed concern about coming to the clinic. We looked at the patients scheduled to come for infusions and decided which visits were essential and which were deferrable without disrupting care by briefly using a noninfusional approach,” said Dr. Voorhees. The number of patients who had their regimens modified or held was “relatively small,” and with the recent recognition that a surge of infections has not occurred, “we’re now rolling out cautious reentry of those patients back to their originally prescribed chemotherapy.”
In addition to concerns of exposure at infusion clinics, there are concerns about the heightened susceptibility of immunosuppressed hematologic oncology patients to COVID-19 and their risk for more severe infection. “Our view is that, if patients tested positive, continuing immunosuppressive treatment would likely be detrimental,” so when possible treatment is temporarily suspended and then resumed when the infection has cleared. “When patients test positive for a prolonged period, a decision to resume treatment must be in the best interests of the patient and weigh the benefits of resuming therapy against the risks of incurring a more severe infection by restarting potentially immunosuppressive therapy,” Dr. Voorhees said.
The enhanced risk that cancer patients face if they develop COVID-19 was documented in a recent review of 218 cancer patients hospitalized for COVID-19 during parts of March and April in a large New York health system. The results showed an overall mortality rate of 28%, including a 37% rate among 54 patients with hematologic malignancies and a 25% rate among 164 patients with solid tumors. The mortality rate “may not be quite as high as they reported because that depends on how many patients you test, but there is no question that patients with more comorbidities are at higher risk. Patients with active cancer on chemotherapy are a particularly vulnerable population, and many have expressed concerns about their vulnerability,” he observed.
For the few LCI patients who developed COVID-19 infection, the medical staff has had several therapeutic options they could match to each patient’s needs, with help from the Atrium Health infectious disease team. LCI and Atrium Health are participating in several COVID-19 clinical treatment trials, including an investigational convalescent plasma protocol spearheaded by the Mayo Clinic. They have also opened a randomized, phase 2 trial evaluating the safety and efficacy of selinexor (Xpovio), an oral drug that’s Food and Drug Administration approved for patients with multiple myeloma, for treatment of moderate or severe COVID-19 infection. Additional studies evaluating blockade of granulocyte-macrophage colony-stimulating factor, as well as inhaled antiviral therapy, have recently launched, and several additional studies are poised to open in the coming weeks.
The LCI and Atrium Health team also has a supply of the antiviral agent remdesivir as part of the FDA’s expanded access protocol and emergency use authorization. They also have a supply of and experience administering the interleukin-6 receptor inhibitor tocilizumab (Actemra), which showed some suggestion of efficacy in limited experience treating patients with severe or critical COVID-19 infections. Clinicians at LCI have not used the investigational and unproven agents hydroxychloroquine, chloroquine, and azithromycin to either prevent or treat COVID-19.
LCI also instituted measures to try to minimize the risk that staff members could become infected and transmit the virus while asymptomatic. Following conversations held early on with COVID-19–experienced health authorities in China and Italy, the patient-facing LCI staff split into two teams starting on March 23 that alternated responsibility for direct patient interactions every 2 weeks. When one of these teams was off from direct patient contact they continued to care for patients remotely through virtual technologies. The concept was that, if a staffer became infected while remaining asymptomatic during their contact with patients, their status would either become diagnosable or resolve during their 2 weeks away from seeing any patients. Perhaps in part because of this approach infections among staff members “have not been a big issue. We’ve had an incredibly low infection rate among the LCI staff,” Dr. Voorhees noted.
By mid-May, with the imminent threat of a sudden CODIV-19 surge moderated, heme-onc operations at LCI began to cautiously revert to more normal operations. “We’re continuing patient screening for signs and symptoms of COVID-19 infection, testing for asymptomatic infections, and requiring masking and social distancing in the clinics and hospitals, but we’re starting to slowly restore the number of patients at our clinics [virtual and face to face[ and infusion centers,” and the staff’s division into two teams ended. “The idea was to get past a surge and make sure our system was not overwhelmed. We anticipated a local surge in late April, but then it kept getting pushed back. Current projections are for the infection rate among LCI patients to remain low provided that community spread remains stable or, ideally, decreases.” The LCI infectious disease staff is closely monitoring infection rates for early recognition of an outbreak, with plans to follow any new cases with contact tracing. So far, the COVID-19 pandemic at LCI “has been very manageable,” Dr. Voorhees concluded.
“We’re now better positioned to deal with a case surge if it were to happen. We could resume the two-team approach, hospital-wide plans are now in place for a future surge, and we are now up and running with robust testing and inpatient and outpatient virtual technology. The first time, we were all learning on the fly.”
The LCI biostatistics team has been prospectively collecting the Institutes’s COVID-19 patient data, with plans to report their findings.
Dr. Voorhees has had financial relationships with Bristol-Myers Squibb/Celgene, Janssen, Novartis, and Oncopeptides, none of which are relevant to this article.
Implementation of a Patient Blood Management Program in a Large, Diverse Multi-Hospital System
From BJC HealthCare, St. Louis, MO.
Abstract
Background: There is limited literature relating to patient blood management (PBM) programs in large multi-hospital systems or addressing challenges of implementation across diverse systems comprised of community and academic hospitals.
Objective: To establish a PBM program to improve utilization of blood transfusion units at a multi-hospital system in the Midwest (BJC HealthCare).
Methods: High-impact strategies in establishing the PBM program included formation of Clinical Expert Councils (CECs) of providers, establishment of consensus utilization guidelines, and development of a robust reporting tool. CECs enabled collaboration and facilitated standardization across a complex system of academic, private practice, and tertiary facilities with a diverse community of medical providers. Consensus guidelines and the PBM reporting tool were key to creating meaningful reports to drive provider practice change.
Results: Over the 5 years following implementation of the PBM program, there has been a steady decrease in red blood cell (RBC) utilization. Noticeable changes have taken place at individual hospitals in the system, including reductions in transfusions falling outside guideline parameters from 300 per quarter to less than 8 per quarter at 1 of our community hospitals. No negative impact on patient care has been identified.
Conclusion: In response to current transfusion guidelines and the need for optimizing stewardship of blood product resources, this hospital system successfully implemented a robust PBM program that engaged academic and non-academic community providers and decreased utilization of blood transfusion resources in line with consensus guidelines.
Keywords: quality improvement; RBC transfusion; transfusion practices; provider practice change; utilization trends.
Evidence from clinical trials and published clinical guidelines support the adoption of a restrictive blood transfusion approach in hospitalized, stable patients as best practice.1-5 As such, the development and implementation of patient blood management (PBM) programs has become an increasingly important process improvement for reducing variability in transfusion practices and clinical outcomes.
As recently as 2013, BJC HealthCare, a multi-hospital system in the Midwest, had no standardized, system-wide blood management program, and transfusion practices varied widely across providers and between individual hospitals based on size, patient population, and resources. The system consisted of 13 hospitals, ranging from large tertiary to smaller community and academic hospitals. Although adults constituted the vast majority of the patient population, the hospital system also included a pediatric specialty hospital, St. Louis Children’s Hospital. In addition, some sites were staffed by private practice providers and others by university-based providers, including blood bank medical directors. Due to the diversity of settings and populations, efforts to align transfusion and other practices often faced multiple challenges. However, improving the management of blood transfusions was identified as a key resource stewardship priority in 2013, and implementation of a system-wide program began after extensive discussions and consensus approval by senior hospital system and medical leadership. The primary aim of the program was to optimize overall blood product resource stewardship. Specifically, we sought to control or reduce costs per patient-care episode using strategies that would not negatively impact patient care and could potentially even improve patient outcomes (eg, by avoiding unnecessary transfusions and their attendant risks).
There is a plethora of literature related to the implemention of PBM programs in individual hospitals,6-18 but few reports specifically relate to large multi-hospital health systems,19-21 or directly address the unique challenges of implementation across a diverse system of community and academic hospitals and providers.19 Here, we discuss our experience with establishing a PBM program in a large, diverse, multi-hospital health system, provide examples of innovative strategies, and address challenges faced and lessons learned. Future endeavors of the PBM program at BJC HealthCare are also described.
Setting
BJC HealthCare is one of the largest nonprofit health care organizations in the United States, delivering services to the greater St. Louis, southern Illinois, and mid-Missouri regions, and addressing the health care needs of urban, suburban, and rural communities. As of 2018, the system included 15 hospitals and multiple community health locations comprising more than 3400 staffed beds, 31,500 employees, and 4300 physicians with privileges. The system annually has more than 151,000 hospital admissions, 81,000 outpatient surgery visits, and 537,000 emergency department visits. In addition to inpatient and outpatient care, services include primary care, community health and wellness, workplace health, home health, community mental health, rehabilitation, long-term care, and hospice. As a nonprofit system, BJC is the largest provider of charity care, unreimbursed care, and community benefit in Missouri, highlighting the fact that resource stewardship is a critical issue across the entire system and the communities served.22
PBM Project
Preparation for large-scale change across several hospitals began with creating a framework for the initiative, which consisted of a “burning platform,” a guiding vision, and a coalition. The burning platform identifies the importance and urgency of a change and helps to establish commitment. Between 2012 and 2014, the American Association of Blood Banks (AABB) released new evidence-based guidelines and recommendations calling for more restrictive transfusion practices pertaining to red blood cells (RBCs; ie, a hemoglobin threshold of 7 to 8 g/dL) in both inpatient and outpatient care.2 In addition, use of single-unit transfusions was recognized as best practice by the AABB in the Choosing Wisely campaign.23 Historically, adult patients requiring transfusions were given 2 units in succession. The new recommendations provided a strong basis for changing transfusion practices at BJC. It was believed that aligning transfusion practices with the new guidelines was consistent with the mission and vision of the work: that these changes could lead to optimization of resources, cost control, reductions in unnecessary blood transfusions, and potentially improved care (eg, fewer transfusion-related complications). We used the national guidelines to initiate discussions and to identify clinical conditions and associated laboratory parameters for transfusion therapy.
Once this burning platform was established, a team comprised of physicians, blood bank experts, quality consultants, data analysts, and supply managers, referred to as the Outcomes Team, was formed to lead the change efforts across the system. Initial projects for the team included developing system-wide consensus-based transfusion guidelines, providing education to providers on the new evidence in transfusion practice, and sharing BJC-specific historical utilization data. The guiding principle for the group was that “blood is a valuable resource, but not without risk, and less is more.” In order to disseminate the vision of the initiative across the system, campaign signs with the slogans “7 is the new 10” (referring to the g/dL transfusion threshold) and “1 is the new 2” (referring to the new practice of the preferential transfusion of single units rather than 2 at a time) were displayed in system hospitals.
Last, a guiding coalition of system leaders was needed to help push the initiative forward and sustain the program once fully implemented. Thus, a multidisciplinary PBM Clinical Expert Counciel (CEC) was formed to assist with implementation and maintenance of the program.
Role of PBM Clinical Expert Council
The PBM CEC was designed to improve overall physician and expert engagement and provide a forum where stakeholders from across the system could participate to voice their expert opinion. CECs (which BJC formed in other clinical areas as well) are multidisciplinary teams consisting of clinical, administrative, and technical staff. The open, multidisciplinary structure of the councils allows for collaboration that promotes change across a complex multi-hospital system. Each hospital is represented by key physicians and technical leaders, opening opportunity for both horizontal and vertical partnership.
As part of the overall physician engagement strategy, the PBM CEC was launched across BJC in November 2013 as a decision-making body for gaining system consensus on matters relating to blood management. The initial goals for the PBM CEC were to share information and educate providers and others on the latest evidence, to subsequently debate and develop consensus for guidelines to be applied across BJC, and to identify and adopt gold standard practices to drive and sustain compliance across the system. More specifically, we wanted to focus on how to avoid unnecessary blood transfusions known to be associated with increased risk for adverse reactions, other morbidity, mortality, and longer length of stay. Council members met quarterly to address 6 key drivers: patient safety, informatics and data, quality improvement, efficiencies and workflows, education and competency, and communication and engagement. Members then voted to approve guidelines, policies, and procedures. The group continues to assist in updating and standardizing guidelines and providing input on improving the functionality of the PBM reporting tool.
Development of the PBM Reporting Tool
Providing and sharing data on blood utilization and practices with the CEC and hospital leaders was imperative to driving change. The Outcomes Team deliberated on how best to generate and provide such information, conducting comparisons between selected vendor-based tools and potential internal BJC solutions. After investigation, BJC leadership approved the development of an in-house PBM dashboard tool using Tableau Desktop (Tableau Software, Inc.). The tool consists of an executive page with 5 additional tabs for navigating to the appropriate information (Figure 1 and Figure 2); data within the tool are organized by facility, service, provider, ICD diagnosis, transfusion indication, and the Clinical Classifications Software category, as defined by the Agency for Healthcare Research and Quality.
")
The PBM reporting tool was launched on December 31, 2014. The next priority after the launch was to validate the tool’s blood utilization data and implement enhancements to make the tool more effective for users. A super-user group consisting of blood bank supervisors and managers was established. The goals of the user group were to preview any enhancements before presenting the tool to the larger CEC, test and validate data once new information was added, and share and prioritize future enhancements. User group meetings were held monthly to share best practices and discuss individual facilities’ blood utilization data. In addition, each facility’s representative(s) shared how they were driving changes in provider practice and discussed challenges specific to their facility. Enhancements suggested through the user group included: incorporation of additional lab values into the tool to correspond with other blood products (eg, fibrinogen, hematocrit, international normalized ratio, and platelet count), addition of the specific location where the blood product was administered, and standard naming conventions of locations to allow comparisons across facilities (eg, Emergency Department instead of ED, ER, or EU).

All hospital users were given access to a test version of the reporting tool where they could review enhancements, identify what worked well and what could be done better, and suggest corrections. As changes were made to the hospital lab systems, a sample of data was reviewed and validated with affected facilities to confirm the continued accuracy of the data. To ensure its practicality to users, the tool continues to be improved upon with input from council stakeholders and subject-matter experts.
Measurements
To monitor blood utilization across the health system, we tracked the total RBC units administered by hospital, service, and provider and also tracked pre- and post-transfusion hemoglobin values.
Results
Overall, the system has seen a steady decrease in RBC utilization over the 5 years since the PBM program was implemented (Table

In addition to system-wide improvement, noticeable changes have taken place at individual hospitals in the BJC system. For example, Boone Hospital Center in Columbia, Missouri, began critically reviewing all RBC transfusions starting in 2015 and, to raise awareness, communicating with any provider who transfused a patient outside of transfusion guidelines. Since then, Boone Hospital has seen a dramatic reduction in transfusions considered noncompliant (ie, falling outside guideline parameters), from 300 transfusions per quarter, down to less than 8 per quarter. St. Louis Children’s Hospital also began reviewing blood products utilized by providers that fell outside of the standardized guidelines. At this hospital, physician champions discuss any outliers with the providers involved and use multiple methods for disseminating information to providers, including grand rounds, faculty meetings, and new resident orientations.
Another success has been the partnership between Barnes Jewish St. Peters and Progress West Hospitals in providing PBM education. Their joint effort resulted in implementation of education modules in BJC’s internal learning system, and has provided PBM-related education to more than 367 nurses, blood bank staff, and physicians.
Challenges and Lessons Learned
Implementation of the PBM program was generally successful, but it was not without challenges. One of the biggest challenges was addressing the variation in care and practices across the hospital enterprise. Due to the varying sizes and service goals of individual hospitals, lack of standardization was a significant barrier to change. Gaining trust and buy-in was imperative to increasing compliance with new transfusion policies. The primary concern was finding a balance between respecting physician autonomy and emphasizing and aligning practices with new evidence in the literature. Thus, understanding and applying principles of thoughtful change management was imperative to advancing the framework of the PBM program. The CEC venue enabled collaboration among hospitals and staff and was ultimately used to facilitate the necessary standardization process. To gain the trust of hospital and medical staff, the Outcomes Team conducted several site visits, enabling face-to-face interaction with frontline staff and operational leaders. Moreover, the team’s emphasis on the use of the latest evidence-based guidelines in discussions with hospital and medical staff underscored the need for change.
Frank et al19 describes using an approach similar to our Outcomes Team at the Johns Hopkins Health System. A designated multidisciplinary quality improvement team, referred to as the “clinical community,” worked on implementing best practices for blood management across a system of 5 hospitals. The authors reported similar results, with an overall decrease in number of units transfused, as well as substantial cost savings.19 Our project, along with the project implemented by Frank et al, shows how a “consensus-community” approach, involving stakeholders and various experts across the system, can be be used to align practices among multiple hospitals.
Development of a robust PBM reporting tool was key to creating meaningful monthly reports and driving provider practice change. However, this did require several training sessions, site visits, and computer-based training. Members of the Outcomes Team engaged in one-on-one sessions with tool users as a way of addressing specific areas of concern raised by staff at individual blood banks, and also took part in system-wide initiatives. The team also attended blood bank staff meetings and hospital transfusion committee meetings to educate staff on the evidence and initiative, provide demos of the reporting tool, and allow for a more robust discussion of how the data could be used and shared with other departments. These sessions provided opportunities to identify and prioritize future enhancements, as well as opportunities for continued education and discussion at hospitals, which were critical to ongoing improvement of the reporting tool.
Conclusion and Future Directions
Blood products remain extremely valuable and scarce resources, and all health care professionals must work to prevent unnecessary transfusions and improve clinical outcomes by adhering to the latest evidence-based guidelines. In response to current transfusion guidelines and the need to optimize blood product resources, our system successfully implemented a robust PBM program that engaged both academic and non-academic providers and communities. Several elements of the program helped us overcome the challenges relating to standardization of transfusion practices: consensus-based development of guidelines using the latest scientific evidence; formation and utilization of the CEC venue to gain system-wide consensus around both guidelines and approaches to change; development of a trustworthy and accessible PBM reporting tool (as well as continuing education sessions to improve adoption and utilization of the tool); and ongoing multidisciplinary discussions and support of thoughtful change and sustaining activities. We have seen a system-wide decrease in the number of RBC units transfused (absolute and per case mix-adjusted patient day) since implementing the PBM program, and in the following years have noted a trending decrease in transfusion-related safety events. Although there was a slight increase in reported safety events from 2018 to 2019, this was likely due to the systematic implementation of a new electronic medical record system and improved reporting infrastructure.
Upcoming phases of our system-wide PBM program will include looking at opportunities to improve blood utilization in other specific clinical areas. For example, we have begun discussions with hematology and oncology experts across the system to expand their patient population data within the PBM reporting tool, and to identify areas of opportunity for provider practice change within their specialty. We are also reviewing cardiothoracic surgery transfusion data to identify opportunities for reducing blood utilization in specific clinical scenarios. In addition, we are working to incorporate our 2 newest hospital system members (Memorial Hospital East and Memorial Hospital Belleville) into the PBM program. In collaboration with perioperative leaders across the system, the surgical blood ordering process is being reviewed. The goal of this effort is to reduce blood products ordered in preparation for surgical procedures. We are also currently investigating whether an impact on safety events (ie, reduction in transfusion reactions) can yet be detected. Last, our health care system recently launched a system-wide electronic medical record, and we are eager to see how this will provide us with new methods to monitor and analyze blood administration and utilization data. We look forward to reporting on the expansion of our program and on any clinical outcome improvements gained through avoidance of unnecessary transfusions.
Acknowledgment: The authors thank the leadership within the Center for Clinical Excellence and Supply Chain at BJC HealthCare for their support of this manuscript, as well as all system participants who have contributed to these efforts, especially Mohammad Agha, MD, MHA, current physician leader of the PBM CEC, for his thoughtful edits of this manuscript.
Corresponding author: Audrey A. Gronemeyer, MPH, Center for Clinical Excellence, BJC HealthCare, 8300 Eager Road, Suite 400A, St. Louis, MO 63144; [email protected].
Financial disclosures: None.
1. Carson JL, Grossman BJ, Kleinman S, et al. Red blood cell transfusion: A clinical practice guideline from the AABB*. Ann Intern Med. 2012;157:49-58.
2. Goodnough LT, Levy JH, Murphy MF. Concepts of blood transfusion in adults. Lancet. 2013;381:1845-1854.
3. Hébert PC, Carson JL. Transfusion threshold of 7 g per deciliter—The new normal. N Engl J Med. 2014;371:1459-1461.
4. Gani F, Cerullo M, Ejaz A, et al. Implementation of a blood management program at a tertiary care hospital: Effect on transfusion practices and clinical outcomes among patients undergoing surgery. Ann Surg. 2019;269:1073-1079.
5. Podlasek SJ, Thakkar RN, Rotello LC, et al. Implementing a “why give 2 when 1 will do?” Choosing Wisely campaign. Transfusion. 2016;56:2164.
6. Boral LI, Bernard A, Hjorth T, et al. How do I implement a more restrictive transfusion trigger of hemoglobin level of 7 g/dL at my hospital? Transfusion. 2015;55:937-945.
7. Geissler RG, Kosters C, Franz D, et al. Utilization of blood components in trauma surgery: A single-center, retrospective analysis before and after the implementation of an educative PBM initiative. Transfuse Med Hemother. 2015;42:83-89.
8. Goel R, Cushing MM, Tobian AA. Pediatric patient blood management programs: Not just transfusing little adults. Transfus Med Rev. 2016;30:235-241.
9. Gupta PB, DeMario VM, Amin RM, et al. Patient blood management program improves blood use and clinical outcomes in orthopedic surgery. Anesthesiology. 2018;129;1082-1091.
10. Leahy MF, Roberts H, Mukhtar SA, et al. A pragmatic approach to embedding patient blood management in a tertiary hospital. Transfusion. 2014;54:1133-1145.
11. Leahy MF, Hofmann A, Towler S, et al. Improved outcomes and reduced costs associated with a health-system-wide patient blood management program: A retrospective observational study in four major adult tertiary-care hospitals. Transfusion. 2017;57:1347-1358.
12. Meybohm P, Herrmann E, Steinbicker AU, et al. Patient blood management is associated with a substantial reduction of red blood cell utilization and safe for patient’s outcome: A prospective, multicenter cohort study with a noninferiority design. Ann Surg. 2016;264:203-211.
13. Morgan PN, Coleman PL, Martinez-Garduno CM, et al. Implementation of a patient blood management program in an Australian private hospital orthopedic unit. J Blood Med. 2018;9;83-90.
14. Norgaard A, Stensballe J, de Lichtenberg TH, et al. Three-year follow-up of implementation of evidence-based transfusion practice in a tertiary hospital. Vox Sang. 2017;112:229-239.
15. Meuller MM, Van Remoortel H, Meybohm P, et al. Patient blood management: Recommendations from the 2018 Frankfurt Consensus Conference. JAMA. 2019;321:983-997.
16. Oliver JC, Griffin RL, Hannon T, Marques MB. The success of our patient blood management program depended on an institution-wide change in transfusion practices. Transfusion. 2014;54:2617-2624.
17. Thakkar RN, Lee KH, Ness PM, et al. Relative impact of a patient blood management program on utilization of all three major blood components. Transfusion. 2016;56:2212-2220.
18. Yang WW, Thakkar RN, Gehrie EA, et al. Single-unit transfusions and hemoglobin trigger: relative impact on red cell utilization. Transfusion. 2017;57:1163-1170.
19. Frank SM, Thakkar RN, Podlasek SJ, et al. Implementing a health system-wide patient blood management program with a clinical community approach. Anesthesiology. 2017;127;754-764.
20. Verdecchia NM, Wisniewski MK, Waters JH, et al. Changes in blood product utilization in a seven-hospital system after the implementation of a patient blood management program: A 9-year follow-up. Hematology. 2016;21:490-499.
21. Yazer MH, Waters JH. How do I implement a hospital-based blood management program? Transfusion. 2012;52:1640-1645.
22. BJC HealthCare. Facts and Figures.. BJC HealthCare website. www.bjc.org/About-Us/Facts-Figures. Accessed November 18, 2019.
23. Callum JL, Waters JH, Shaz BH, et al. The AABB recommendations for the Choosing Wisely campaign of the American Board of Internal Medicine. Transfusion. 2014;54:2344-2352.
From BJC HealthCare, St. Louis, MO.
Abstract
Background: There is limited literature relating to patient blood management (PBM) programs in large multi-hospital systems or addressing challenges of implementation across diverse systems comprised of community and academic hospitals.
Objective: To establish a PBM program to improve utilization of blood transfusion units at a multi-hospital system in the Midwest (BJC HealthCare).
Methods: High-impact strategies in establishing the PBM program included formation of Clinical Expert Councils (CECs) of providers, establishment of consensus utilization guidelines, and development of a robust reporting tool. CECs enabled collaboration and facilitated standardization across a complex system of academic, private practice, and tertiary facilities with a diverse community of medical providers. Consensus guidelines and the PBM reporting tool were key to creating meaningful reports to drive provider practice change.
Results: Over the 5 years following implementation of the PBM program, there has been a steady decrease in red blood cell (RBC) utilization. Noticeable changes have taken place at individual hospitals in the system, including reductions in transfusions falling outside guideline parameters from 300 per quarter to less than 8 per quarter at 1 of our community hospitals. No negative impact on patient care has been identified.
Conclusion: In response to current transfusion guidelines and the need for optimizing stewardship of blood product resources, this hospital system successfully implemented a robust PBM program that engaged academic and non-academic community providers and decreased utilization of blood transfusion resources in line with consensus guidelines.
Keywords: quality improvement; RBC transfusion; transfusion practices; provider practice change; utilization trends.
Evidence from clinical trials and published clinical guidelines support the adoption of a restrictive blood transfusion approach in hospitalized, stable patients as best practice.1-5 As such, the development and implementation of patient blood management (PBM) programs has become an increasingly important process improvement for reducing variability in transfusion practices and clinical outcomes.
As recently as 2013, BJC HealthCare, a multi-hospital system in the Midwest, had no standardized, system-wide blood management program, and transfusion practices varied widely across providers and between individual hospitals based on size, patient population, and resources. The system consisted of 13 hospitals, ranging from large tertiary to smaller community and academic hospitals. Although adults constituted the vast majority of the patient population, the hospital system also included a pediatric specialty hospital, St. Louis Children’s Hospital. In addition, some sites were staffed by private practice providers and others by university-based providers, including blood bank medical directors. Due to the diversity of settings and populations, efforts to align transfusion and other practices often faced multiple challenges. However, improving the management of blood transfusions was identified as a key resource stewardship priority in 2013, and implementation of a system-wide program began after extensive discussions and consensus approval by senior hospital system and medical leadership. The primary aim of the program was to optimize overall blood product resource stewardship. Specifically, we sought to control or reduce costs per patient-care episode using strategies that would not negatively impact patient care and could potentially even improve patient outcomes (eg, by avoiding unnecessary transfusions and their attendant risks).
There is a plethora of literature related to the implemention of PBM programs in individual hospitals,6-18 but few reports specifically relate to large multi-hospital health systems,19-21 or directly address the unique challenges of implementation across a diverse system of community and academic hospitals and providers.19 Here, we discuss our experience with establishing a PBM program in a large, diverse, multi-hospital health system, provide examples of innovative strategies, and address challenges faced and lessons learned. Future endeavors of the PBM program at BJC HealthCare are also described.
Setting
BJC HealthCare is one of the largest nonprofit health care organizations in the United States, delivering services to the greater St. Louis, southern Illinois, and mid-Missouri regions, and addressing the health care needs of urban, suburban, and rural communities. As of 2018, the system included 15 hospitals and multiple community health locations comprising more than 3400 staffed beds, 31,500 employees, and 4300 physicians with privileges. The system annually has more than 151,000 hospital admissions, 81,000 outpatient surgery visits, and 537,000 emergency department visits. In addition to inpatient and outpatient care, services include primary care, community health and wellness, workplace health, home health, community mental health, rehabilitation, long-term care, and hospice. As a nonprofit system, BJC is the largest provider of charity care, unreimbursed care, and community benefit in Missouri, highlighting the fact that resource stewardship is a critical issue across the entire system and the communities served.22
PBM Project
Preparation for large-scale change across several hospitals began with creating a framework for the initiative, which consisted of a “burning platform,” a guiding vision, and a coalition. The burning platform identifies the importance and urgency of a change and helps to establish commitment. Between 2012 and 2014, the American Association of Blood Banks (AABB) released new evidence-based guidelines and recommendations calling for more restrictive transfusion practices pertaining to red blood cells (RBCs; ie, a hemoglobin threshold of 7 to 8 g/dL) in both inpatient and outpatient care.2 In addition, use of single-unit transfusions was recognized as best practice by the AABB in the Choosing Wisely campaign.23 Historically, adult patients requiring transfusions were given 2 units in succession. The new recommendations provided a strong basis for changing transfusion practices at BJC. It was believed that aligning transfusion practices with the new guidelines was consistent with the mission and vision of the work: that these changes could lead to optimization of resources, cost control, reductions in unnecessary blood transfusions, and potentially improved care (eg, fewer transfusion-related complications). We used the national guidelines to initiate discussions and to identify clinical conditions and associated laboratory parameters for transfusion therapy.
Once this burning platform was established, a team comprised of physicians, blood bank experts, quality consultants, data analysts, and supply managers, referred to as the Outcomes Team, was formed to lead the change efforts across the system. Initial projects for the team included developing system-wide consensus-based transfusion guidelines, providing education to providers on the new evidence in transfusion practice, and sharing BJC-specific historical utilization data. The guiding principle for the group was that “blood is a valuable resource, but not without risk, and less is more.” In order to disseminate the vision of the initiative across the system, campaign signs with the slogans “7 is the new 10” (referring to the g/dL transfusion threshold) and “1 is the new 2” (referring to the new practice of the preferential transfusion of single units rather than 2 at a time) were displayed in system hospitals.
Last, a guiding coalition of system leaders was needed to help push the initiative forward and sustain the program once fully implemented. Thus, a multidisciplinary PBM Clinical Expert Counciel (CEC) was formed to assist with implementation and maintenance of the program.
Role of PBM Clinical Expert Council
The PBM CEC was designed to improve overall physician and expert engagement and provide a forum where stakeholders from across the system could participate to voice their expert opinion. CECs (which BJC formed in other clinical areas as well) are multidisciplinary teams consisting of clinical, administrative, and technical staff. The open, multidisciplinary structure of the councils allows for collaboration that promotes change across a complex multi-hospital system. Each hospital is represented by key physicians and technical leaders, opening opportunity for both horizontal and vertical partnership.
As part of the overall physician engagement strategy, the PBM CEC was launched across BJC in November 2013 as a decision-making body for gaining system consensus on matters relating to blood management. The initial goals for the PBM CEC were to share information and educate providers and others on the latest evidence, to subsequently debate and develop consensus for guidelines to be applied across BJC, and to identify and adopt gold standard practices to drive and sustain compliance across the system. More specifically, we wanted to focus on how to avoid unnecessary blood transfusions known to be associated with increased risk for adverse reactions, other morbidity, mortality, and longer length of stay. Council members met quarterly to address 6 key drivers: patient safety, informatics and data, quality improvement, efficiencies and workflows, education and competency, and communication and engagement. Members then voted to approve guidelines, policies, and procedures. The group continues to assist in updating and standardizing guidelines and providing input on improving the functionality of the PBM reporting tool.
Development of the PBM Reporting Tool
Providing and sharing data on blood utilization and practices with the CEC and hospital leaders was imperative to driving change. The Outcomes Team deliberated on how best to generate and provide such information, conducting comparisons between selected vendor-based tools and potential internal BJC solutions. After investigation, BJC leadership approved the development of an in-house PBM dashboard tool using Tableau Desktop (Tableau Software, Inc.). The tool consists of an executive page with 5 additional tabs for navigating to the appropriate information (Figure 1 and Figure 2); data within the tool are organized by facility, service, provider, ICD diagnosis, transfusion indication, and the Clinical Classifications Software category, as defined by the Agency for Healthcare Research and Quality.
The PBM reporting tool was launched on December 31, 2014. The next priority after the launch was to validate the tool’s blood utilization data and implement enhancements to make the tool more effective for users. A super-user group consisting of blood bank supervisors and managers was established. The goals of the user group were to preview any enhancements before presenting the tool to the larger CEC, test and validate data once new information was added, and share and prioritize future enhancements. User group meetings were held monthly to share best practices and discuss individual facilities’ blood utilization data. In addition, each facility’s representative(s) shared how they were driving changes in provider practice and discussed challenges specific to their facility. Enhancements suggested through the user group included: incorporation of additional lab values into the tool to correspond with other blood products (eg, fibrinogen, hematocrit, international normalized ratio, and platelet count), addition of the specific location where the blood product was administered, and standard naming conventions of locations to allow comparisons across facilities (eg, Emergency Department instead of ED, ER, or EU).
All hospital users were given access to a test version of the reporting tool where they could review enhancements, identify what worked well and what could be done better, and suggest corrections. As changes were made to the hospital lab systems, a sample of data was reviewed and validated with affected facilities to confirm the continued accuracy of the data. To ensure its practicality to users, the tool continues to be improved upon with input from council stakeholders and subject-matter experts.
Measurements
To monitor blood utilization across the health system, we tracked the total RBC units administered by hospital, service, and provider and also tracked pre- and post-transfusion hemoglobin values.
Results
Overall, the system has seen a steady decrease in RBC utilization over the 5 years since the PBM program was implemented (Table
In addition to system-wide improvement, noticeable changes have taken place at individual hospitals in the BJC system. For example, Boone Hospital Center in Columbia, Missouri, began critically reviewing all RBC transfusions starting in 2015 and, to raise awareness, communicating with any provider who transfused a patient outside of transfusion guidelines. Since then, Boone Hospital has seen a dramatic reduction in transfusions considered noncompliant (ie, falling outside guideline parameters), from 300 transfusions per quarter, down to less than 8 per quarter. St. Louis Children’s Hospital also began reviewing blood products utilized by providers that fell outside of the standardized guidelines. At this hospital, physician champions discuss any outliers with the providers involved and use multiple methods for disseminating information to providers, including grand rounds, faculty meetings, and new resident orientations.
Another success has been the partnership between Barnes Jewish St. Peters and Progress West Hospitals in providing PBM education. Their joint effort resulted in implementation of education modules in BJC’s internal learning system, and has provided PBM-related education to more than 367 nurses, blood bank staff, and physicians.
Challenges and Lessons Learned
Implementation of the PBM program was generally successful, but it was not without challenges. One of the biggest challenges was addressing the variation in care and practices across the hospital enterprise. Due to the varying sizes and service goals of individual hospitals, lack of standardization was a significant barrier to change. Gaining trust and buy-in was imperative to increasing compliance with new transfusion policies. The primary concern was finding a balance between respecting physician autonomy and emphasizing and aligning practices with new evidence in the literature. Thus, understanding and applying principles of thoughtful change management was imperative to advancing the framework of the PBM program. The CEC venue enabled collaboration among hospitals and staff and was ultimately used to facilitate the necessary standardization process. To gain the trust of hospital and medical staff, the Outcomes Team conducted several site visits, enabling face-to-face interaction with frontline staff and operational leaders. Moreover, the team’s emphasis on the use of the latest evidence-based guidelines in discussions with hospital and medical staff underscored the need for change.
Frank et al19 describes using an approach similar to our Outcomes Team at the Johns Hopkins Health System. A designated multidisciplinary quality improvement team, referred to as the “clinical community,” worked on implementing best practices for blood management across a system of 5 hospitals. The authors reported similar results, with an overall decrease in number of units transfused, as well as substantial cost savings.19 Our project, along with the project implemented by Frank et al, shows how a “consensus-community” approach, involving stakeholders and various experts across the system, can be be used to align practices among multiple hospitals.
Development of a robust PBM reporting tool was key to creating meaningful monthly reports and driving provider practice change. However, this did require several training sessions, site visits, and computer-based training. Members of the Outcomes Team engaged in one-on-one sessions with tool users as a way of addressing specific areas of concern raised by staff at individual blood banks, and also took part in system-wide initiatives. The team also attended blood bank staff meetings and hospital transfusion committee meetings to educate staff on the evidence and initiative, provide demos of the reporting tool, and allow for a more robust discussion of how the data could be used and shared with other departments. These sessions provided opportunities to identify and prioritize future enhancements, as well as opportunities for continued education and discussion at hospitals, which were critical to ongoing improvement of the reporting tool.
Conclusion and Future Directions
Blood products remain extremely valuable and scarce resources, and all health care professionals must work to prevent unnecessary transfusions and improve clinical outcomes by adhering to the latest evidence-based guidelines. In response to current transfusion guidelines and the need to optimize blood product resources, our system successfully implemented a robust PBM program that engaged both academic and non-academic providers and communities. Several elements of the program helped us overcome the challenges relating to standardization of transfusion practices: consensus-based development of guidelines using the latest scientific evidence; formation and utilization of the CEC venue to gain system-wide consensus around both guidelines and approaches to change; development of a trustworthy and accessible PBM reporting tool (as well as continuing education sessions to improve adoption and utilization of the tool); and ongoing multidisciplinary discussions and support of thoughtful change and sustaining activities. We have seen a system-wide decrease in the number of RBC units transfused (absolute and per case mix-adjusted patient day) since implementing the PBM program, and in the following years have noted a trending decrease in transfusion-related safety events. Although there was a slight increase in reported safety events from 2018 to 2019, this was likely due to the systematic implementation of a new electronic medical record system and improved reporting infrastructure.
Upcoming phases of our system-wide PBM program will include looking at opportunities to improve blood utilization in other specific clinical areas. For example, we have begun discussions with hematology and oncology experts across the system to expand their patient population data within the PBM reporting tool, and to identify areas of opportunity for provider practice change within their specialty. We are also reviewing cardiothoracic surgery transfusion data to identify opportunities for reducing blood utilization in specific clinical scenarios. In addition, we are working to incorporate our 2 newest hospital system members (Memorial Hospital East and Memorial Hospital Belleville) into the PBM program. In collaboration with perioperative leaders across the system, the surgical blood ordering process is being reviewed. The goal of this effort is to reduce blood products ordered in preparation for surgical procedures. We are also currently investigating whether an impact on safety events (ie, reduction in transfusion reactions) can yet be detected. Last, our health care system recently launched a system-wide electronic medical record, and we are eager to see how this will provide us with new methods to monitor and analyze blood administration and utilization data. We look forward to reporting on the expansion of our program and on any clinical outcome improvements gained through avoidance of unnecessary transfusions.
Acknowledgment: The authors thank the leadership within the Center for Clinical Excellence and Supply Chain at BJC HealthCare for their support of this manuscript, as well as all system participants who have contributed to these efforts, especially Mohammad Agha, MD, MHA, current physician leader of the PBM CEC, for his thoughtful edits of this manuscript.
Corresponding author: Audrey A. Gronemeyer, MPH, Center for Clinical Excellence, BJC HealthCare, 8300 Eager Road, Suite 400A, St. Louis, MO 63144; [email protected].
Financial disclosures: None.
1. Carson JL, Grossman BJ, Kleinman S, et al. Red blood cell transfusion: A clinical practice guideline from the AABB*. Ann Intern Med. 2012;157:49-58.
2. Goodnough LT, Levy JH, Murphy MF. Concepts of blood transfusion in adults. Lancet. 2013;381:1845-1854.
3. Hébert PC, Carson JL. Transfusion threshold of 7 g per deciliter—The new normal. N Engl J Med. 2014;371:1459-1461.
4. Gani F, Cerullo M, Ejaz A, et al. Implementation of a blood management program at a tertiary care hospital: Effect on transfusion practices and clinical outcomes among patients undergoing surgery. Ann Surg. 2019;269:1073-1079.
5. Podlasek SJ, Thakkar RN, Rotello LC, et al. Implementing a “why give 2 when 1 will do?” Choosing Wisely campaign. Transfusion. 2016;56:2164.
6. Boral LI, Bernard A, Hjorth T, et al. How do I implement a more restrictive transfusion trigger of hemoglobin level of 7 g/dL at my hospital? Transfusion. 2015;55:937-945.
7. Geissler RG, Kosters C, Franz D, et al. Utilization of blood components in trauma surgery: A single-center, retrospective analysis before and after the implementation of an educative PBM initiative. Transfuse Med Hemother. 2015;42:83-89.
8. Goel R, Cushing MM, Tobian AA. Pediatric patient blood management programs: Not just transfusing little adults. Transfus Med Rev. 2016;30:235-241.
9. Gupta PB, DeMario VM, Amin RM, et al. Patient blood management program improves blood use and clinical outcomes in orthopedic surgery. Anesthesiology. 2018;129;1082-1091.
10. Leahy MF, Roberts H, Mukhtar SA, et al. A pragmatic approach to embedding patient blood management in a tertiary hospital. Transfusion. 2014;54:1133-1145.
11. Leahy MF, Hofmann A, Towler S, et al. Improved outcomes and reduced costs associated with a health-system-wide patient blood management program: A retrospective observational study in four major adult tertiary-care hospitals. Transfusion. 2017;57:1347-1358.
12. Meybohm P, Herrmann E, Steinbicker AU, et al. Patient blood management is associated with a substantial reduction of red blood cell utilization and safe for patient’s outcome: A prospective, multicenter cohort study with a noninferiority design. Ann Surg. 2016;264:203-211.
13. Morgan PN, Coleman PL, Martinez-Garduno CM, et al. Implementation of a patient blood management program in an Australian private hospital orthopedic unit. J Blood Med. 2018;9;83-90.
14. Norgaard A, Stensballe J, de Lichtenberg TH, et al. Three-year follow-up of implementation of evidence-based transfusion practice in a tertiary hospital. Vox Sang. 2017;112:229-239.
15. Meuller MM, Van Remoortel H, Meybohm P, et al. Patient blood management: Recommendations from the 2018 Frankfurt Consensus Conference. JAMA. 2019;321:983-997.
16. Oliver JC, Griffin RL, Hannon T, Marques MB. The success of our patient blood management program depended on an institution-wide change in transfusion practices. Transfusion. 2014;54:2617-2624.
17. Thakkar RN, Lee KH, Ness PM, et al. Relative impact of a patient blood management program on utilization of all three major blood components. Transfusion. 2016;56:2212-2220.
18. Yang WW, Thakkar RN, Gehrie EA, et al. Single-unit transfusions and hemoglobin trigger: relative impact on red cell utilization. Transfusion. 2017;57:1163-1170.
19. Frank SM, Thakkar RN, Podlasek SJ, et al. Implementing a health system-wide patient blood management program with a clinical community approach. Anesthesiology. 2017;127;754-764.
20. Verdecchia NM, Wisniewski MK, Waters JH, et al. Changes in blood product utilization in a seven-hospital system after the implementation of a patient blood management program: A 9-year follow-up. Hematology. 2016;21:490-499.
21. Yazer MH, Waters JH. How do I implement a hospital-based blood management program? Transfusion. 2012;52:1640-1645.
22. BJC HealthCare. Facts and Figures.. BJC HealthCare website. www.bjc.org/About-Us/Facts-Figures. Accessed November 18, 2019.
23. Callum JL, Waters JH, Shaz BH, et al. The AABB recommendations for the Choosing Wisely campaign of the American Board of Internal Medicine. Transfusion. 2014;54:2344-2352.
