User login
Hospitalists Should Expect More HIV Patients
Advances in treatment and ever-growing life expectancies for patients diagnosed with human immunodeficiency virus (HIV) are likely to push more HIV-positive patients into the censuses of HM groups, according to a specialist at Mount Sinai School of Medicine in New York City.
“Hospitalists … are going to be doing more and more of the HIV care because we have a growing population of aging patients who are in care or identify as being HIV-positive, and they’re not coming in with exotic or unusual opportunistic infections,” says Rich MacKay, MD, director of the inpatient HIV service at Mount Sinai Medial Center in New York. “They are coming in with the things that other 50-, 60-, 70-year-olds are coming in with, though they may have more of those.”
Dr. MacKay, who is an assistant professor and splits his time between admitted patients and an outpatient clinic, spoke to more than 100 attendees at the fifth annual Mid-Atlantic Hospital Medicine Symposium last weekend in New York. He says hospitalists who familiarize themselves with HIV indicators could press for earlier identification of HIV in patients.
“If you screen people and you’re testing them on the day of their hospitalization, I think that’s huge,” Dr. MacKay says. “Finding somebody who is early in the disease and linking them in to care, so that they don’t fall off the cliff, so that they don’t come in five years later with PCP [pneumocystis pneumonia] and die from it—I think that’s a huge part for the hospitalist.”
Dr. MacKay further notes that just being aware of HIV symptoms can provide the cognizance necessary to consider alternative diagnoses. That can be particularly relevant for cases in which standard treatments might be effective for a few days (e.g. a steroid regimen) but not actually resolve the underlying problem, he adds.
“Maybe [a patient] is coming in with what looks like an exacerbation of COPD, but they’ve only got 50 T-cells and in fact what you’re seeing is PCP,” he says. “It’s not always clear.”
Advances in treatment and ever-growing life expectancies for patients diagnosed with human immunodeficiency virus (HIV) are likely to push more HIV-positive patients into the censuses of HM groups, according to a specialist at Mount Sinai School of Medicine in New York City.
“Hospitalists … are going to be doing more and more of the HIV care because we have a growing population of aging patients who are in care or identify as being HIV-positive, and they’re not coming in with exotic or unusual opportunistic infections,” says Rich MacKay, MD, director of the inpatient HIV service at Mount Sinai Medial Center in New York. “They are coming in with the things that other 50-, 60-, 70-year-olds are coming in with, though they may have more of those.”
Dr. MacKay, who is an assistant professor and splits his time between admitted patients and an outpatient clinic, spoke to more than 100 attendees at the fifth annual Mid-Atlantic Hospital Medicine Symposium last weekend in New York. He says hospitalists who familiarize themselves with HIV indicators could press for earlier identification of HIV in patients.
“If you screen people and you’re testing them on the day of their hospitalization, I think that’s huge,” Dr. MacKay says. “Finding somebody who is early in the disease and linking them in to care, so that they don’t fall off the cliff, so that they don’t come in five years later with PCP [pneumocystis pneumonia] and die from it—I think that’s a huge part for the hospitalist.”
Dr. MacKay further notes that just being aware of HIV symptoms can provide the cognizance necessary to consider alternative diagnoses. That can be particularly relevant for cases in which standard treatments might be effective for a few days (e.g. a steroid regimen) but not actually resolve the underlying problem, he adds.
“Maybe [a patient] is coming in with what looks like an exacerbation of COPD, but they’ve only got 50 T-cells and in fact what you’re seeing is PCP,” he says. “It’s not always clear.”
Advances in treatment and ever-growing life expectancies for patients diagnosed with human immunodeficiency virus (HIV) are likely to push more HIV-positive patients into the censuses of HM groups, according to a specialist at Mount Sinai School of Medicine in New York City.
“Hospitalists … are going to be doing more and more of the HIV care because we have a growing population of aging patients who are in care or identify as being HIV-positive, and they’re not coming in with exotic or unusual opportunistic infections,” says Rich MacKay, MD, director of the inpatient HIV service at Mount Sinai Medial Center in New York. “They are coming in with the things that other 50-, 60-, 70-year-olds are coming in with, though they may have more of those.”
Dr. MacKay, who is an assistant professor and splits his time between admitted patients and an outpatient clinic, spoke to more than 100 attendees at the fifth annual Mid-Atlantic Hospital Medicine Symposium last weekend in New York. He says hospitalists who familiarize themselves with HIV indicators could press for earlier identification of HIV in patients.
“If you screen people and you’re testing them on the day of their hospitalization, I think that’s huge,” Dr. MacKay says. “Finding somebody who is early in the disease and linking them in to care, so that they don’t fall off the cliff, so that they don’t come in five years later with PCP [pneumocystis pneumonia] and die from it—I think that’s a huge part for the hospitalist.”
Dr. MacKay further notes that just being aware of HIV symptoms can provide the cognizance necessary to consider alternative diagnoses. That can be particularly relevant for cases in which standard treatments might be effective for a few days (e.g. a steroid regimen) but not actually resolve the underlying problem, he adds.
“Maybe [a patient] is coming in with what looks like an exacerbation of COPD, but they’ve only got 50 T-cells and in fact what you’re seeing is PCP,” he says. “It’s not always clear.”
In the Literature: Research You Need to Know
Clinical question: What is the prevalence of silent pulmonary embolism (PE) in patients with DVT?
Background: PE was undiagnosed or unsuspected in approximately 80% to 93% patients antemortem who were found to have a PE at autopsy. The extent to which silent PE explains the undiagnosed or unsuspected pulmonary emboli at autopsy is not certain. Prior studies have demonstrated the association of silent PE in living patients with DVT.
Study design: Systematic review.
Setting: Published trials performed worldwide.
Synopsis: Researchers performed a systematic review of all published trials addressing the prevalence of silent PE in patients with DVT. Studies were included if the methods of PE diagnosis were described, if it was an asymptomatic PE, and if raw data were presented. Twenty-eight studies were identified and were stratified according to how the PE was diagnosed (Tier 1: high-probability VQ scan based on PIOPED criteria, computerized tomographic angiography [CTA], angiography; Tier 2: VQ scans based on non-PIOPED criteria).
Among Tier 1 studies, silent PE was detected in 27% of patients with DVT. Among Tier 2 studies, silent PE was detected among 37% of patients with DVT. Combined, silent PE was diagnosed in 1,665 of 5,233 patients (32%) with DVT.
Further analysis showed that the prevalence of silent PE in patients with proximal DVT was higher in those with distal DVT and that there was a trend toward increased prevalence of silent PE with increased age.
A limitation of this study includes the heterogeneity in the methods used for diagnosis of silent PE.
Bottom line: Silent PE occurs in a third of patients with DVT, and routine screening should be considered.
Citation: Stein PD, Matta F, Musani MH, Diaczok B. Silent pulmonary embolism in patients with deep venous thrombosis: a systematic review. Am J Med. 2010;123(5):426-431.
Reviewed for TH eWireby Alexander R. Carbo, MD, SFHM, Lauren Doctoroff, MD, John Fani Srour, MD, Matthew Hill, MD, Nancy Torres-Finnerty, MD, FHM, and Anita Vanka, MD, Hospital Medicine Program, Beth Israel Deaconess Medical Center, Boston.
For more physician reviews of literature, visit our website.
Clinical question: What is the prevalence of silent pulmonary embolism (PE) in patients with DVT?
Background: PE was undiagnosed or unsuspected in approximately 80% to 93% patients antemortem who were found to have a PE at autopsy. The extent to which silent PE explains the undiagnosed or unsuspected pulmonary emboli at autopsy is not certain. Prior studies have demonstrated the association of silent PE in living patients with DVT.
Study design: Systematic review.
Setting: Published trials performed worldwide.
Synopsis: Researchers performed a systematic review of all published trials addressing the prevalence of silent PE in patients with DVT. Studies were included if the methods of PE diagnosis were described, if it was an asymptomatic PE, and if raw data were presented. Twenty-eight studies were identified and were stratified according to how the PE was diagnosed (Tier 1: high-probability VQ scan based on PIOPED criteria, computerized tomographic angiography [CTA], angiography; Tier 2: VQ scans based on non-PIOPED criteria).
Among Tier 1 studies, silent PE was detected in 27% of patients with DVT. Among Tier 2 studies, silent PE was detected among 37% of patients with DVT. Combined, silent PE was diagnosed in 1,665 of 5,233 patients (32%) with DVT.
Further analysis showed that the prevalence of silent PE in patients with proximal DVT was higher in those with distal DVT and that there was a trend toward increased prevalence of silent PE with increased age.
A limitation of this study includes the heterogeneity in the methods used for diagnosis of silent PE.
Bottom line: Silent PE occurs in a third of patients with DVT, and routine screening should be considered.
Citation: Stein PD, Matta F, Musani MH, Diaczok B. Silent pulmonary embolism in patients with deep venous thrombosis: a systematic review. Am J Med. 2010;123(5):426-431.
Reviewed for TH eWireby Alexander R. Carbo, MD, SFHM, Lauren Doctoroff, MD, John Fani Srour, MD, Matthew Hill, MD, Nancy Torres-Finnerty, MD, FHM, and Anita Vanka, MD, Hospital Medicine Program, Beth Israel Deaconess Medical Center, Boston.
For more physician reviews of literature, visit our website.
Clinical question: What is the prevalence of silent pulmonary embolism (PE) in patients with DVT?
Background: PE was undiagnosed or unsuspected in approximately 80% to 93% patients antemortem who were found to have a PE at autopsy. The extent to which silent PE explains the undiagnosed or unsuspected pulmonary emboli at autopsy is not certain. Prior studies have demonstrated the association of silent PE in living patients with DVT.
Study design: Systematic review.
Setting: Published trials performed worldwide.
Synopsis: Researchers performed a systematic review of all published trials addressing the prevalence of silent PE in patients with DVT. Studies were included if the methods of PE diagnosis were described, if it was an asymptomatic PE, and if raw data were presented. Twenty-eight studies were identified and were stratified according to how the PE was diagnosed (Tier 1: high-probability VQ scan based on PIOPED criteria, computerized tomographic angiography [CTA], angiography; Tier 2: VQ scans based on non-PIOPED criteria).
Among Tier 1 studies, silent PE was detected in 27% of patients with DVT. Among Tier 2 studies, silent PE was detected among 37% of patients with DVT. Combined, silent PE was diagnosed in 1,665 of 5,233 patients (32%) with DVT.
Further analysis showed that the prevalence of silent PE in patients with proximal DVT was higher in those with distal DVT and that there was a trend toward increased prevalence of silent PE with increased age.
A limitation of this study includes the heterogeneity in the methods used for diagnosis of silent PE.
Bottom line: Silent PE occurs in a third of patients with DVT, and routine screening should be considered.
Citation: Stein PD, Matta F, Musani MH, Diaczok B. Silent pulmonary embolism in patients with deep venous thrombosis: a systematic review. Am J Med. 2010;123(5):426-431.
Reviewed for TH eWireby Alexander R. Carbo, MD, SFHM, Lauren Doctoroff, MD, John Fani Srour, MD, Matthew Hill, MD, Nancy Torres-Finnerty, MD, FHM, and Anita Vanka, MD, Hospital Medicine Program, Beth Israel Deaconess Medical Center, Boston.
For more physician reviews of literature, visit our website.
FDA approves dabigatran for AF patients
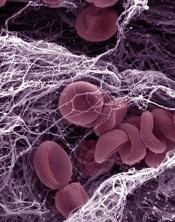
Credit: Kevin MacKenzie
The US Food and Drug Administration (FDA) has approved dabigatran etexilate (Pradaxa) to prevent strokes and thrombosis in patients with atrial fibrillation (AF).
Dabigatran is an oral direct thrombin inhibitor that can be administered at a fixed oral dose, with no need for coagulation monitoring.
“Unlike warfarin, which requires patients to undergo periodic monitoring with blood tests, such monitoring is not necessary for Pradaxa,” said Norman Stockbridge, MD, PhD, director of the Division of Cardiovascular and Renal Products in the FDA’s Center for Drug Evaluation and Research.
The FDA has approved dabigatran based on results of the RE-LY trial, in which investigators compared dabigatran to warfarin in more than 18,000 AF patients.
Results suggested that, overall, dabigatran is noninferior to warfarin for preventing stroke and systemic embolism. And, at a 150 mg dose, dabigatran is actually more effective than warfarin.
Bleeding, including life-threatening and fatal bleeding, was among the most common adverse events observed in patients treated with dabigatran. Gastrointestinal symptoms, including dyspepsia, stomach pain, nausea, heartburn, and bloating were reported as well.
Dabigatran was approved with a medication guide that informs patients of the risk of serious bleeding. The guide will be distributed each time a patient fills a prescription for the medication.
Dabigatran will be marketed as Pradaxa by Boehringer Ingelheim Pharmaceuticals, Inc. It will be available in 75 mg and 150 mg capsules. 
Credit: Kevin MacKenzie
The US Food and Drug Administration (FDA) has approved dabigatran etexilate (Pradaxa) to prevent strokes and thrombosis in patients with atrial fibrillation (AF).
Dabigatran is an oral direct thrombin inhibitor that can be administered at a fixed oral dose, with no need for coagulation monitoring.
“Unlike warfarin, which requires patients to undergo periodic monitoring with blood tests, such monitoring is not necessary for Pradaxa,” said Norman Stockbridge, MD, PhD, director of the Division of Cardiovascular and Renal Products in the FDA’s Center for Drug Evaluation and Research.
The FDA has approved dabigatran based on results of the RE-LY trial, in which investigators compared dabigatran to warfarin in more than 18,000 AF patients.
Results suggested that, overall, dabigatran is noninferior to warfarin for preventing stroke and systemic embolism. And, at a 150 mg dose, dabigatran is actually more effective than warfarin.
Bleeding, including life-threatening and fatal bleeding, was among the most common adverse events observed in patients treated with dabigatran. Gastrointestinal symptoms, including dyspepsia, stomach pain, nausea, heartburn, and bloating were reported as well.
Dabigatran was approved with a medication guide that informs patients of the risk of serious bleeding. The guide will be distributed each time a patient fills a prescription for the medication.
Dabigatran will be marketed as Pradaxa by Boehringer Ingelheim Pharmaceuticals, Inc. It will be available in 75 mg and 150 mg capsules.
Credit: Kevin MacKenzie
The US Food and Drug Administration (FDA) has approved dabigatran etexilate (Pradaxa) to prevent strokes and thrombosis in patients with atrial fibrillation (AF).
Dabigatran is an oral direct thrombin inhibitor that can be administered at a fixed oral dose, with no need for coagulation monitoring.
“Unlike warfarin, which requires patients to undergo periodic monitoring with blood tests, such monitoring is not necessary for Pradaxa,” said Norman Stockbridge, MD, PhD, director of the Division of Cardiovascular and Renal Products in the FDA’s Center for Drug Evaluation and Research.
The FDA has approved dabigatran based on results of the RE-LY trial, in which investigators compared dabigatran to warfarin in more than 18,000 AF patients.
Results suggested that, overall, dabigatran is noninferior to warfarin for preventing stroke and systemic embolism. And, at a 150 mg dose, dabigatran is actually more effective than warfarin.
Bleeding, including life-threatening and fatal bleeding, was among the most common adverse events observed in patients treated with dabigatran. Gastrointestinal symptoms, including dyspepsia, stomach pain, nausea, heartburn, and bloating were reported as well.
Dabigatran was approved with a medication guide that informs patients of the risk of serious bleeding. The guide will be distributed each time a patient fills a prescription for the medication.
Dabigatran will be marketed as Pradaxa by Boehringer Ingelheim Pharmaceuticals, Inc. It will be available in 75 mg and 150 mg capsules.
Stick with What Works
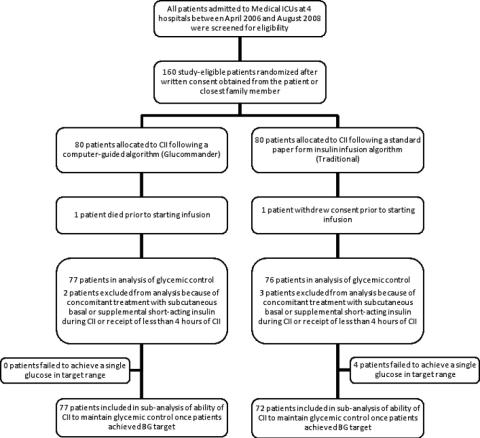
A new study that found tighter glycemic control in ICU patients who received continuous insulin infusion (CII) via computer-guided algorithms versus paper-based protocols might not be enough to ditch paper forms just yet, one of the report's authors says.
While the review in this month's multicenter, randomized trial also reported no differences between groups in length of stay (P=0.704), ICU stay (P=0.145), or in-hospital mortality (P=0.561).
"It leaves it up to the individual physician to decide," Dr. Newton says. "'Is what we're doing working good enough to do what we need to do? Or do we need to make a change?'"
Nationwide, glycemic control is a quality initiative frequently tackled by HM groups. To wit, SHM this year enrolled the first sites into its Glycemic Control Mentored Implementation program. The pilot program addresses subcutaneous insulin protocols, transition from subcutaneous to infusion, care coordination, improving follow-up care, and hypoglycemia management.
And while those institutions and hospitalists focusing on glycemic control will be keen to see the data comparing computer-based and standard column-based algorithms, Dr. Newton says, it will require continued research to determine how each protocol performs in patient safety measures before hospitalists change their habits.
"Honestly, I don't know if [the current research] is [enough]," Dr. Newton says. "If their approach is working … then it's probably not worth making a large investment to cause an upheaval of their whole system at this time."
A new study that found tighter glycemic control in ICU patients who received continuous insulin infusion (CII) via computer-guided algorithms versus paper-based protocols might not be enough to ditch paper forms just yet, one of the report's authors says.
While the review in this month's multicenter, randomized trial also reported no differences between groups in length of stay (P=0.704), ICU stay (P=0.145), or in-hospital mortality (P=0.561).
"It leaves it up to the individual physician to decide," Dr. Newton says. "'Is what we're doing working good enough to do what we need to do? Or do we need to make a change?'"
Nationwide, glycemic control is a quality initiative frequently tackled by HM groups. To wit, SHM this year enrolled the first sites into its Glycemic Control Mentored Implementation program. The pilot program addresses subcutaneous insulin protocols, transition from subcutaneous to infusion, care coordination, improving follow-up care, and hypoglycemia management.
And while those institutions and hospitalists focusing on glycemic control will be keen to see the data comparing computer-based and standard column-based algorithms, Dr. Newton says, it will require continued research to determine how each protocol performs in patient safety measures before hospitalists change their habits.
"Honestly, I don't know if [the current research] is [enough]," Dr. Newton says. "If their approach is working … then it's probably not worth making a large investment to cause an upheaval of their whole system at this time."
A new study that found tighter glycemic control in ICU patients who received continuous insulin infusion (CII) via computer-guided algorithms versus paper-based protocols might not be enough to ditch paper forms just yet, one of the report's authors says.
While the review in this month's multicenter, randomized trial also reported no differences between groups in length of stay (P=0.704), ICU stay (P=0.145), or in-hospital mortality (P=0.561).
"It leaves it up to the individual physician to decide," Dr. Newton says. "'Is what we're doing working good enough to do what we need to do? Or do we need to make a change?'"
Nationwide, glycemic control is a quality initiative frequently tackled by HM groups. To wit, SHM this year enrolled the first sites into its Glycemic Control Mentored Implementation program. The pilot program addresses subcutaneous insulin protocols, transition from subcutaneous to infusion, care coordination, improving follow-up care, and hypoglycemia management.
And while those institutions and hospitalists focusing on glycemic control will be keen to see the data comparing computer-based and standard column-based algorithms, Dr. Newton says, it will require continued research to determine how each protocol performs in patient safety measures before hospitalists change their habits.
"Honestly, I don't know if [the current research] is [enough]," Dr. Newton says. "If their approach is working … then it's probably not worth making a large investment to cause an upheaval of their whole system at this time."
Rethinking Rapid Discharge
A national study of trauma patients transferred from one hospital to another (J Trauma. 2010;69:602-606) has found significant rates of "secondary overtriage," which happens when the patient is discharged home less than a day after the transfer without undergoing a surgical procedure.
Such rapid discharge suggests that the transfer might not have been necessary in the first place, says lead author Hayley Osen, BA, research analyst at the University of California-San Diego Center for Surgical Systems and Public Health. The occurrence of secondary overtriage, which can cost nearly $6,000 ($12,000 for transfer by helicopter), was found to be higher among patients under 18 years of age (19.5%, versus 6.9% overall).
Hospitalists can be at both ends of these transfers, which often are between small or rural hospitals and regional medical centers. They can also play important roles in preventing unnecessary transfers, says Cleo Hardin, MD, SFHM, FAAP, section chief for pediatric hospital medicine and outreach at the University of Arizona in Tucson.
"Phone triage is absolutely vital as a first-line approach," Dr. Hardin says. Telemedicine links and teleradiology, the electronic transmission of X-rays for review by a specialist at the regional center, also help with the triage and management of patients at the referring institution, she adds.
Building good working relationships between the two facilities, establishing rapport between key connections, and knowing the resources within each facility can help, says Monika Gottlieb, MD, SFHM, who just left her job at Hospitalist Specialists in Spokane, Wash., to start a new position. "In these cases, a lot depends on understanding the capacity of the local facility, including nurses," she says.
It might be possible to establish mentorships with key specialists at regional centers, with mechanisms for how to reach them, Dr. Gottlieb explains, but hospitalists need to take responsibility for completing successful transfers and handoffs.
A national study of trauma patients transferred from one hospital to another (J Trauma. 2010;69:602-606) has found significant rates of "secondary overtriage," which happens when the patient is discharged home less than a day after the transfer without undergoing a surgical procedure.
Such rapid discharge suggests that the transfer might not have been necessary in the first place, says lead author Hayley Osen, BA, research analyst at the University of California-San Diego Center for Surgical Systems and Public Health. The occurrence of secondary overtriage, which can cost nearly $6,000 ($12,000 for transfer by helicopter), was found to be higher among patients under 18 years of age (19.5%, versus 6.9% overall).
Hospitalists can be at both ends of these transfers, which often are between small or rural hospitals and regional medical centers. They can also play important roles in preventing unnecessary transfers, says Cleo Hardin, MD, SFHM, FAAP, section chief for pediatric hospital medicine and outreach at the University of Arizona in Tucson.
"Phone triage is absolutely vital as a first-line approach," Dr. Hardin says. Telemedicine links and teleradiology, the electronic transmission of X-rays for review by a specialist at the regional center, also help with the triage and management of patients at the referring institution, she adds.
Building good working relationships between the two facilities, establishing rapport between key connections, and knowing the resources within each facility can help, says Monika Gottlieb, MD, SFHM, who just left her job at Hospitalist Specialists in Spokane, Wash., to start a new position. "In these cases, a lot depends on understanding the capacity of the local facility, including nurses," she says.
It might be possible to establish mentorships with key specialists at regional centers, with mechanisms for how to reach them, Dr. Gottlieb explains, but hospitalists need to take responsibility for completing successful transfers and handoffs.
A national study of trauma patients transferred from one hospital to another (J Trauma. 2010;69:602-606) has found significant rates of "secondary overtriage," which happens when the patient is discharged home less than a day after the transfer without undergoing a surgical procedure.
Such rapid discharge suggests that the transfer might not have been necessary in the first place, says lead author Hayley Osen, BA, research analyst at the University of California-San Diego Center for Surgical Systems and Public Health. The occurrence of secondary overtriage, which can cost nearly $6,000 ($12,000 for transfer by helicopter), was found to be higher among patients under 18 years of age (19.5%, versus 6.9% overall).
Hospitalists can be at both ends of these transfers, which often are between small or rural hospitals and regional medical centers. They can also play important roles in preventing unnecessary transfers, says Cleo Hardin, MD, SFHM, FAAP, section chief for pediatric hospital medicine and outreach at the University of Arizona in Tucson.
"Phone triage is absolutely vital as a first-line approach," Dr. Hardin says. Telemedicine links and teleradiology, the electronic transmission of X-rays for review by a specialist at the regional center, also help with the triage and management of patients at the referring institution, she adds.
Building good working relationships between the two facilities, establishing rapport between key connections, and knowing the resources within each facility can help, says Monika Gottlieb, MD, SFHM, who just left her job at Hospitalist Specialists in Spokane, Wash., to start a new position. "In these cases, a lot depends on understanding the capacity of the local facility, including nurses," she says.
It might be possible to establish mentorships with key specialists at regional centers, with mechanisms for how to reach them, Dr. Gottlieb explains, but hospitalists need to take responsibility for completing successful transfers and handoffs.
Predictors of Recurrent Readmissions
Hospital readmissions are recognized as both a significant contributor to health care costs and a putative indicator of healthcare quality.1, 2 Older medical patients with chronic medical comorbidities are at particularly high risk for hospital readmission3 and attendant risks of hospitalization.4 Many intervention strategies have been used in trials to reduce readmissions in such patients. Single interventions such as case management,5 care coordination,6 and self‐management7 have been disappointing. There is emerging evidence to support complex, multidisciplinary interventions which include outreach and support in the early post‐hospital period, especially in heart failure patients,8 but also in medical patients with a range of conditions.9 However, such interventions are resource intensive and it remains uncertain which patients may benefit most from interventions.
Although there are many studies of risk factors for hospital admission and readmission, few studies have reported predictors of recurrent readmission.1012 Patients with 2 or more recent hospitalizations are readily identifiable and have a substantially increased risk of hospital readmission compared to patients with only 1 recent hospitalization.10, 11, 1315 These patients may have a unique risk factor profile, and may be a group which may particularly benefit from complex interventions,16 but no previous study has specifically examined risk factors in this high‐risk group.
Previous studies of readmission predictors have largely focussed on demographic and disease characteristics which are not amenable to intervention at individual level. The results of such studies may determine a population at increased risk, but do not inform an intervention strategy.14 Psychological and behavioral factors such as depression and anxiety, perceptions of health, and adherence patterns may also contribute to hospitalizations.17, 18 However, the role of these factors in repeated admissions of medical patients has been poorly studied.
The aim of this study was to describe the association of a wider range of biological, functional, and psychosocial variables with the risk of unplanned hospital readmission within 6 months in medical patients with 2 or more recent hospitalizations. There was a particular emphasis on risk factors which might be amenable to intervention.
Methods
Setting and Participants
The study was a prospective longitudinal cohort study. Participant enrolment was undertaken from February 2006 to February 2007. The study setting was the Internal Medicine Department of a tertiary teaching hospital in Brisbane, Australia. The Internal Medicine Department admits approximately 5000 inpatients per annum; more than 95% of these are unplanned admissions (general practitioner referral or self‐referral) via the Emergency Department. Acute and some subacute care are provided by 1 of 5 medical units, each staffed by 2 to 3 consultant general physicians, 2 medical residents (post‐graduate year 3‐4), 2 interns (post‐graduate year 1), and a consistent multidisciplinary team of allied health professionals and senior nursing staff. Descriptions of the inpatient case‐mix and model of care have been published previously.19
Participants were identified by 2 trained research nurses. Daily reports were generated from the hospital admission database to identify all consecutive patients admitted to any general medical unit who had already been hospitalized at the study hospital within the previous six months. The medical record was then screened for eligibility.
Patients were considered for inclusion if they were aged 50 years or older, based on clinical consensus that different factors may be relevant in younger patients, and the demonstrated validity of the selected tools in an older medical population. For logistic reasons, patients were ineligible if they lived outside the greater Brisbane area; came from residential care; had significant language or cognitive difficulties which would preclude participation in interviews; were admitted for end‐of‐life care; or were considered otherwise unsuitable for post‐hospital interviews (eg, no fixed address). Eligible patients were invited to participate in the study. Informed consent was obtained from all participants. The study was approved by the Royal Brisbane and Women's Hospitals and University of Queensland Human Research Ethics Committees.
Outcome and Variables
The primary outcome was 1 or more unplanned readmission to any ward at the study hospital within 6 months of the date of hospital discharge. Information about the frequency and duration of planned and unplanned hospital readmissions in the 6 months after discharge was obtained from the hospital admissions database. Planned readmissions included elective surgical or procedural admissions and scheduled day‐case admissions. Unplanned readmissions included all presentations through the emergency department, except for brief emergency department attendances where the participant was not formally admitted under a consultant.
Information was abstracted from the medical record at the time of discharge using a structured audit tool, including age, sex, primary diagnosis according to the treating clinical team, Charlson comorbidity score, number of medications at discharge, living situation at time of discharge, and the number of hospitalizations in the previous 12 months. Note was made of whether a discharge summary was completed and faxed to the general practitioner within 24 hours of discharge. Weight and height were measured by the research assistant to calculate the body mass index (BMI) which was categorized according to World Health Organization recommended cut‐offs.
Within 5 days of discharge from the index admission, the participant was contacted by telephone to schedule an interview at home within the next week. Posthospital interviews were undertaken using a structured interview tool composed of validated measures of the variables of interest, as described below. Interviews took 45 to 90 minutes to complete, and were performed by one of eight postgraduate clinical psychology students from the University of Queensland, who received training and regular supervision by a senior academic psychologist (NP).
Cognitive status was tested using the 3MS cognitive screening test, a sensitive test for early cognitive impairment.20 The Cambridge Contextual Reading Test (CCRT, short version) was used as a measure of literacy and verbal intelligence, as it may be robust in the presence of early cognitive decline21 Mood disturbances were evaluated using the Geriatric Depression Scale (GDS, short version)22 and the Geriatric Anxiety Inventory (GAI).23 The Social Support Questionnaire short form (SSQ6) was used to identify satisfaction with supports.24 Self‐rated health and income adequacy were rated using a 5 point Likert scale. Compliance with prescribed medication was assessed using the Medication Adherence Rating Scale (MARS) (R Horne, personal communication). Alcohol consumption was evaluated using the alcohol use disorders identification tool (AUDIT).25 Instrumental activities of daily living (IADL: using the telephone, using transport, shopping, housework, meal preparation, medication management, managing money) and basic activities of daily living (BADL: bathing, dressing, eating, mobility, transfers, grooming) were assessed using items from the Older Americans Resources and Services (OARS) questionnaire.26 Relevant permissions were obtained from the developers.
Analysis
Data were analyzed using SPSS 17.0. The distribution of each explanatory and confounding variable was examined and summarized using appropriate statistics (mean, median or proportion). Ordinal and some continuous variables were grouped into categories according to previously validated cut‐offs and clinical meaning. Logarithmic transformation was used in analyses of length of stay due to the highly skewed distribution. ADL and IADL function were grouped into independent in all activities, dependent in IADL function only, and dependent in basic ADL function. Bivariate analysis was undertaken using contingency tables and chi‐square testing for categorical variables and independent samples t‐test or equivalent nonparametric testing for continuous variables, to identify potential associations with the primary outcome.
Dealing with diagnosis posed particular difficulties because of the large number of disease categories. Other authors have restricted the sample to a limited number of diagnoses,27, 28 explored the impact of a limited number of diagnoses compared to all others,13 or grouped diagnoses in a pre‐specified or post hoc manner.3, 15 Considering previous studies and preliminary examination of the data (Table 3), we grouped diagnoses as chronic (heart failure, chronic lung disease, diabetes) vs. other for analysis purposes.
| Follow‐Up Data (n = 142) | No Follow‐Up Data (n = 48) | P | |
|---|---|---|---|
| |||
| Age, years, mean (SD) | 74.0 (10.9) | 76.8 (10.1) | 0.13 |
| Male, % | 52.8 | 56.3 | 0.68 |
| Admissions past 12 months, median (IQR) | 2 (1, 2.25) | 1 (1,2) | 0.38 |
| Comorbidity score, median (IQR) | 2 (1,4) | 2 (1,3) | 0.48 |
| Medications on discharge, mean (SD) | 8.8 (4.0) | 9.0 (4.5) | 0.86 |
| Length of stay, median (IQR) | 6.5 (4,11) | 7 (4,14) | 0.35 |
| Discharged to | 0.30 | ||
| Independent living alone | 38.7 | 47.9 | |
| Independent living with others | 54.2 | 50.0 | |
| Assisted living/residential care | 7.1 | 2.1 | |
| Community services on discharge, % | 42.3 | 56.3 | 0.16 |
| Number (%) with characteristic | % Readmitted | P | |
|---|---|---|---|
| |||
| Age (years) | 0.78 | ||
| <65 | 31 (22) | 39 | |
| 6584.9 | 92 (65) | 40 | |
| 85 or more | 19 (13) | 32 | |
| Male | 75 (53) | 40 | 0.74 |
| Admissions past 12 months | 0.78 | ||
| 1 | 67 (47) | 39 | |
| 2 | 40 (28) | 35 | |
| 3 or more | 35 (25) | 43 | |
| Body mass index | 0.02 | ||
| Underweight | 11 (8) | 72 | |
| Normal | 55 (39) | 27 | |
| Overweight | 43 (30) | 37 | |
| Obese | 32 (23) | 50 | |
| Chronic disease diagnosis | 27 (19) | 67 | 0.001 |
| Functional dependence | 0.16 | ||
| Independent | 27 (19) | 26 | |
| Dependent in IADLs | 48 (34) | 48 | |
| Dependent in BADLs | 66 (47) | 36 | |
| Comorbidity score | 0.15 | ||
| 0 | 19 (13) | 26 | |
| 12 | 62 (44) | 34 | |
| 3 or more | 61 (43) | 48 | |
| Summary sent within 24 hours | 117 (82) | 40 | 0.93 |
| Discharge supports | 0.60 | ||
| community | 72 (51) | 35 | |
| community with supports | 60 (42) | 43 | |
| residential care | 10 (7) | 40 | |
| Poor cognition (3MS 85)* | 80 (58) | 36 | 0.68 |
| Reduced literacy (CCRT<21) | 61 (48) | 41 | 0.55 |
| Depressive symptoms (GDS 5) | 72 (51) | 47 | 0.04 |
| Anxiety symptoms (GAI 9) | 45 (32) | 38 | 0.93 |
| Poor adherence (MARS <24) | 48 (34) | 35 | 0.56 |
| Hazardous drinking (AUDIT >6) | 18 (13) | 39 | 0.98 |
| English as second language | 19 (13) | 32 | 0.50 |
| Self‐rated health fair or poor | 102 (72) | 38 | 0.68 |
| Financial hardship | 46 (32) | 35 | 0.47 |
| Total | 142 | 39 | |
| Diagnosis | Number with diagnosis (%) | % readmitted |
|---|---|---|
| Heart failure | 13 (9) | 69 |
| Diabetes | 6 (4) | 67 |
| Chronic lung disease | 8 (6) | 63 |
| Cellulitis | 8 (6) | 63 |
| Syncope/arrhythmia | 11 (8) | 46 |
| Pneumonia | 10 (7) | 40 |
| Urinary infection | 15 (11) | 33 |
| Fall or fracture | 18 (13) | 33 |
| Gastrointestinal disease | 7 (5) | 29 |
| Ischemic heart disease | 11 (8) | 18 |
| Neurological disease | 7 (5) | 0 |
| Other | 28 (20) | 29 |
| Total | 142 (100) | 39 |
Potentially important variables were chosen based on bivariate analysis (P < 0.2) and previous literature. These variables were then entered into a multiple logistic regression model, and a significant association in the adjusted model was defined as P < 0.05. The performance of the final model was assessed by constructing a receiver operating curve. Given a 40% to 50% anticipated event rate, we estimated that 150 to 200 participants would provide power to include 7 to 10 variables of interest within the model.
Results
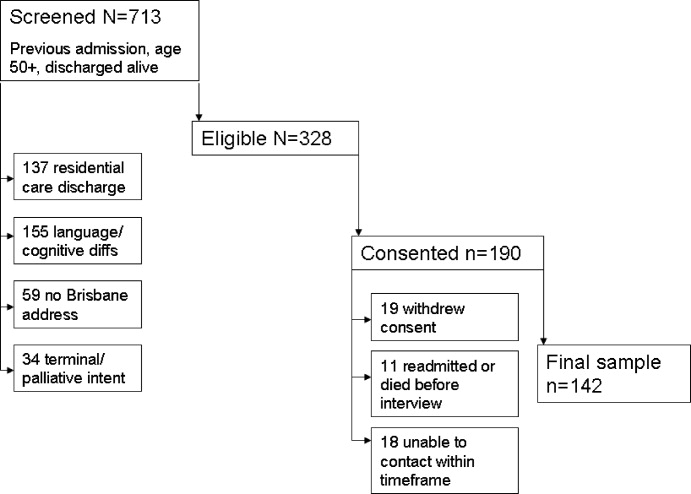
Active screening over 12 months identified 1194 new admissions with a documented hospitalization in the previous 6 months. Of these, 85 were discharged prior to clinical review, 227 were aged less than 50 years, 16 died in hospital, and 153 had been screened previously in the study, leaving 713 individual patients for eligibility screening. Screening identified 328 of 713 (46.0%) patients eligible to participate in the study, who were approached for consent. Of these eligible patients, 190 of 328 (57.9%) agreed to participate but 48 of 190 (25%) did not complete posthospital follow‐up, leaving a total of 142 participants. Patient eligibility, consent, and follow‐up are detailed in Figure 1.
Demographic and disease characteristics of the study participants are shown in Table 1. The 48 participants without follow‐up data appeared similar to those with full data, and 25 (52.1%) of these participants without follow‐up data had an unplanned admission within 6 months.
By 6 months, 55 of 142 participants with follow‐up data (38.7%) had had a total of 102 unplanned admissions to the study hospital. Of these, 42 of 55 (76%) were readmitted to internal medicine. Of the 55 participants with an unplanned readmission, 30 had only 1 unplanned readmission, 9 had 2, and 16 had 3 or more unplanned readmissions within 6 months of the index hospitalization.
During 6 month follow‐up of all 142 participants, there were also 97 planned (scheduled) admissions, 56 (58%) of which occurred in the group with an unplanned admission. Thus the 55 participants with an unplanned readmission accounted for a total of 1055 hospital bed‐days (mean 19.2 days per patient over 6 months follow‐up) while the 87 participants without an unplanned readmission used only 147 bed‐days (mean 1.7 days per patient over 6 months).
Bivariate analysis of the association of unplanned readmissions with the study variables is detailed in Table 2. BMI showed a nonlinear relationship with readmission, with a higher risk apparent at each end of the distribution. Depressive symptoms were also associated with a higher risk of readmission.
Age, sex, number of previous admissions, and discharge supports were not significantly different between the 2 groups. There was no difference in length of the index hospital stay: median length of stay was 6 days (interquartile range [IQR] 3‐14 days) in the readmitted group and 7 (IQR 4‐10 days) in the non‐readmitted group. There was a trend to higher mean number of medications in the readmitted group (9.4 vs. 8.8, P = 0.21).
The strongest predictor of readmission was the presence of a chronic disease diagnosis. Patterns of readmission for each primary clinical diagnosis are shown in Table 3. Chronic comorbidities including heart failure, chronic renal failure, and diabetes were associated with a higher risk of readmission (Table 4). Median comorbidity score was 3 (IQR 1‐5) in the readmitted group compared to 2 (IQR 1‐3) in the nonreadmitted group (P = 0.02).
| Co‐Morbidity | Number with Co‐Morbidity (%) | % Readmitted | P |
|---|---|---|---|
| Heart failure | 30 (21) | 57 | 0.02 |
| Chronic renal impairment | 22 (15) | 59 | 0.03 |
| Diabetes | 36 (25) | 53 | 0.05 |
| Chronic lung disease | 39 (27) | 49 | 0.13 |
| Peripheral vascular disease | 25 (18) | 44 | 0.55 |
| Cerebrovascular disease | 36 (25) | 44 | 0.42 |
| Ischemic heart disease | 57 (40) | 40 | 0.75 |
| Cancer | 23 (16) | 35 | 0.67 |
On the basis of these findings and the literature, a multivariate binary logistic regression model for unplanned admission within 6 months was fitted, including chronic disease diagnosis, comorbiditiy score, BMI, functional status, and GDS as explanatory variables, and adjusting for the potential confounders of age and length of stay (as a severity surrogate). The model is shown in Table 5, and demonstrates a significant association between readmission and chronic conditions, BMI, and depressive symptoms. The area under the receiving operating curve was 0.73.
| Odds Ratio (95% CI) | P Value | |
|---|---|---|
| ||
| Body mass index (reference 18.525) | ||
| Underweight (<18.5) | 12.7 (2.370.7) | 0.004 |
| Overweight (2530) | 1.9 (0.75.1) | 0.18 |
| Obese (>30) | 2.6 (0.97.3) | 0.07 |
| Depressive symptoms (GDS 5) | 3.0 (1.36.8) | 0.01 |
| Chronic disease diagnosis | 3.4 (1.39.3) | 0.02 |
| Co‐morbidity score | 1.3 (1.01.6) | 0.02 |
| Dependency (reference independent) | 0.32 | |
| IADL dependency only | 1.7 (0.55.4) | |
| BADL dependency | 0.9 (0.32.8) | |
| Age group (reference <65 years) | 0.94 | |
| 6584 | 1.1 (0.42.8) | |
| 85 or older | 0.9 (0.23.5) | |
| Log length of stay | 0.99 (0.961.01) | 0.43 |
Discussion
This study demonstrates a number of important findings. First, 39% of this group of participants went on to further unplanned hospital readmissions in the ensuing 6 months, demonstrating the high risk in this group with more than 1 recent hospital admission. However, within this group, the risk of readmission was not related to the frequency of admission within the previous year, consistent with several previous studies.29, 30 These finding suggest that 1 or more recent previous admissions identified at the time of a medical admission is an effective identifier of high risk patients. Subgroup analysis of a recent discharge intervention study in medical patients suggests that this high risk group may particularly benefit from such an intervention.16
Second, the study describes important predictors of readmission which may inform novel interventions. The BMI showed a significant nonlinear relationship with readmission, with an increased risk both above and below the normal weight range. Almost half the group was overweight or obese, with a 2‐fold risk compared to normal weight patients. While underweight was less prevalent, it carried a markedly increased probability of readmission. Limited previous studies support the association of nutritional status and unplanned readmission.31, 32 Malnutrition may be a marker of disease stage or severity, or may be associated with other unmeasured social determinants which increase readmission risk. However, malnutrition itself may reduce physiological resilience and predispose to higher health care needs. There are no published trials of posthospital nutritional intervention programs for reducing readmission rates in general medical patients.
The risk of readmission was also increased in participants with depressive symptoms, consistent with several previous studies.3336 This effect was independent of illness type and comorbidity. Depression is increasingly recognized as an important independent predictor of a range of important outcomes in older medical patients, including posthospital functional decline,37 institutionalization and mortality.36, 38 Posthospital decline and poor self‐management might contribute to higher rehospitalization. There is some evidence that effective treatment of psychological comorbidities in medically ill patients may reduce readmissions.18, 39
Both the number and type of chronic conditions appear to be predictors of readmission in this high risk group, where there was a high baseline prevalence of chronic diseases such as heart failure, diabetes, renal impairment, and chronic lung disease which have been associated with higher readmission rates in a number of previous studies.13, 15, 30, 40 Almost all participants had one or more significant comorbid conditions in addition to their presenting complaint; single disease‐focused chronic disease management programs may not be an optimal solution in this group. Consistent with this comorbidity burden, most participants were prescribed a large number of medications. In keeping with other studies,17 about one‐third of participants reported reduced medication adherence but this was not associated with a higher readmission risk.
Like most previous studies in medical patients,10, 11, 15, 29, 30, 35, 36, 40, 41 there was no evidence of increasing readmission rates with age. Functional status impairment was not a significant predictor of readmission, probably reflecting selection of a patient subgroup with a high prevalence of disability and chronic disease. Satisfaction with social support was generally high, and not associated with readmission. This may reflect the emphasis on discharge planning and postacute social and functional support already occurring in usual care.
Measures of cognition and literacy were not associated with readmission. However, these were the items with the most missing data (see Table 2), which may have reduced our ability to detect an association. The study design excluded patients with significant cognitive or communication deficits who were unable to participate in detailed assessments. Such stringent eligibility criteria may be seen as a weakness of this study, reducing the generalizability of the findings. However, the study deliberately sampled a population of older adults suitable for a multifacetted posthospital management program, in order to inform specific intervention targets, and the eligibility criteria reflect these practical considerations. Although some previous studies have found that cognitive impairment is a predictor of readmission,10, 12 others have found no association.29, 30, 36, 40, 41
The main study weaknesses are the small sample size (reflected in the wide confidence intervals [CIs] in the multivariate analysis), and the relatively high rate of drop‐outs (25% of enrolments) for whom detailed posthospital data could not be collected. This problem reflects the age and burden of illness in the population under study. Readmission data were collected for all participants, and a similar rate of readmission was observed in patients with missing data (52% vs. 39%, P = 0.11). The heterogeneous patients mix may have concealed some important associations within individual diagnoses or other patient subgroups. This heterogeneity reflects the reality of the selected high risk subgroup, and the study deliberately avoided a disease‐specific focus for generalizability.
Conclusions
This study confirms the high rate of hospital readmission in medical patients who have already had a previous inpatient admission in the past 6 months. It shifts the emphasis from nonmodifiable disease and demographic predictors to consideration of common, nondisease specific factors which might have a plausible causative relationship with readmission and may be amenable to specific interventions. The population sampled had a high prevalence of chronic disease, and often multiple diseases. Nutritional status and depressive symptoms are emerging as important modifiers of disease course and mortality in the setting of several chronic diseases; this study also supports their potential contribution to increased hospital resource consumption in a high‐risk group. Posthospital programs which specifically address these factors in the context of optimal medical management of underlying chronic diseases have the potential to reduce hospital readmissions.
- ,,.Rehospitalizations among patients in the Medicare fee‐for‐service program.N Engl J Med.2009;360:1418–1428.
- ,,,,,.Hospital readmissions and quality of care.Med Care.1999;37(5):490–501.
- ,,.Clinical and sociodemographic risk factors for reamdission of Medicare benficiaries.Health Care Financ Rev.1988;10(1):27–36.
- .Hazards of hospitalization of the elderly.Ann Intern Med.1993;118:219–223.
- ,,,,.A case manager intervention to reduce readmissions.Arch Intern Med.1995;154(15):1721–1729.
- ,,, et al.A transitional care service for elderly chronic disease patients at risk of readmission.Aust Health Rev.2004;28(3):275–284.
- ,,,,.Self‐management programmes by lay leaders for people with chronic conditions.Cochrane Database Syst Rev.2007(4):Art No.CD005108.
- ,,,.The effectiveness of disease management programmes in reducing hospital re‐admission in older patients with heart failure: a systematic review and meta‐analysis of published reports.Eur Heart J.2004;25:1570–1595.
- ,,, et al.Discharge planning from hospital to home.Cochrane Database Syst Rev.2010(Issue 1):Art No.CD000313.
- ,,, et al.Characteristics of geriatric patients related to early and late readmissions to hospital.Aging Clin Exp Res.1998;10:339–346.
- ,,, et al.Hospital readmission among older medical patietns in Hong Kong.J R Coll Physicians Lond.1999;33(2):153–156.
- ,,, et al.Early re‐hospitalization of elderly people discharged from a geriatric ward.Aging Clin Exp Res.2006;18(1):63–69.
- ,,,,.Readmission patterns in patients with chronic obstructive pulmonary disease, chronic heart failure and diabetes mellitus: an administrative dataset analysis.Intern Med J.2005;35:296–299.
- ,,,.Case finding for patients at risk of readmission to hospital: development of algorithm to identify high risk patients.BMJ.2006;333:327–330.
- ,,,.Predicting emergency readmission for patients discharged from the medical service of a teaching hospital.J Gen Intern Med.1987;2:400–405.
- ,,, et al.A reengineered hospital discharge program to decrease hospitalization.Ann Intern Med.2009;150:178–187.
- ,,.The role of medication noncompliance and adverse drug reactions in hospitalisations in the elderly.Arch Intern Med.1990;150:841–845.
- ,,, et al.UPBEAT: the impact of a psychogeriatric intervention in VA medical centers.Med Care.2001;39(5):500–512.
- ,,,.Controlled trial of multidisciplinary care teams for acutely ill medical inpatients: enhanced multidisciplinary care.Intern Med J.2006;36:558–563.
- ,.The modified mini‐mental state (3MS) examination.J Clin Psychiatry.1987;48:314–318.
- .Development of the Cambridge Contextual Reading Test for improving the examination of premorbid verbal intelligence in older persons with dementia.Br J Clin Psychol.1998;37:229–240.
- ,.Geriatric Depression Scale (GDS): recent evidence and development of a shorter version.Clinics in Gerontology.1986;5:165–172.
- ,,,,,.Development and validation of the Geriatric Anxiety Inventory.Int Psychogeriatr.2007;19(1):103–114.
- ,,.A brief measure of social support: practical and theoretical implications.J Soc Pers Relat.1987;4:497–510.
- ,,,,.Screening for problem drinking: comparison of the CAGE and AUDIT.J Gen Intern Med.1998;13(6):379–388.
- ,.OARS methodology: a decade of experience in geriatric assessment.J Am Geriatr Soc.1985;33:607–615.
- ,.Hospital readmissions among the elderly.J Am Geriatr Soc.1985;33:595–601.
- ,,,,,.Discharge destination and repeat hospitalizations.Med Care.1997;35:756–767.
- ,,, et al.Measuring frailty in the hospitalized elderly. Concept of functional homeostasis.Am J Phys Med Rehab.1998;77(3):252–257.
- ,.Factors predicting readmission of older general medicine patients.J Gen Intern Med.1991;6(5):389–393.
- .Risk factors for early hospital readmission in a select population of geriatric rehabilitation patients: the significance of functional status.J Am Geriatr Soc.1992;40:792–798.
- ,,,.Predicting early nonelective hospital readmission in nutritionally compromised older adults.Am J Clin Nutr.1997;65:1714–1720.
- ,,,,,.Factors associated with unplanned hospital readmission among patients 65 years of age and older in a Medicare managed care plan.Am J Med.1999;107(1):13–17.
- ,,,.Depression and activities of daily living predict rehospitalisation within 6 months of discharge from geriatric rehabilitation.Rehabil Psychol.2004;49(3):219–223.
- ,,,.Depressive symptoms and negative outcomes in older hospitalized patients.Arch Intern Med.2002;162:948–949.
- ,,,.Depressive symptoms as a predictor of 6‐month outcomes and services utilization in elderly medical inpatients.Arch Intern Med.2001;161:2609–2615.
- ,,,,.Relation between symptoms of depression and health status outcomes in acutely ill hospitalized older persons.Ann Intern Med.1997;126(6):417–425.
- ,,,.Diabetes, depression and death. A randomized controlled trial of a depression treatment program for older adults based in primary care (PROSPECT).Diabetes Care.2007;30(12):3005–3010.
- ,,.Clinical implications of a reduction in psychosocial distress in cardiac prognosis in patients participating in a psychosocial intervention programme.Psychosom Med.2001;63(2):257–266.
- ,,, et al.Predictors of immediate and 6‐month outcomes in hospitalized elderly patients.J Am Geriatr Soc.1988;36:775–783.
- ,,,,.Factors predictive of outcome on admission to an acute geriatric ward.Age Ageing.1999;28:429–432.
Hospital readmissions are recognized as both a significant contributor to health care costs and a putative indicator of healthcare quality.1, 2 Older medical patients with chronic medical comorbidities are at particularly high risk for hospital readmission3 and attendant risks of hospitalization.4 Many intervention strategies have been used in trials to reduce readmissions in such patients. Single interventions such as case management,5 care coordination,6 and self‐management7 have been disappointing. There is emerging evidence to support complex, multidisciplinary interventions which include outreach and support in the early post‐hospital period, especially in heart failure patients,8 but also in medical patients with a range of conditions.9 However, such interventions are resource intensive and it remains uncertain which patients may benefit most from interventions.
Although there are many studies of risk factors for hospital admission and readmission, few studies have reported predictors of recurrent readmission.1012 Patients with 2 or more recent hospitalizations are readily identifiable and have a substantially increased risk of hospital readmission compared to patients with only 1 recent hospitalization.10, 11, 1315 These patients may have a unique risk factor profile, and may be a group which may particularly benefit from complex interventions,16 but no previous study has specifically examined risk factors in this high‐risk group.
Previous studies of readmission predictors have largely focussed on demographic and disease characteristics which are not amenable to intervention at individual level. The results of such studies may determine a population at increased risk, but do not inform an intervention strategy.14 Psychological and behavioral factors such as depression and anxiety, perceptions of health, and adherence patterns may also contribute to hospitalizations.17, 18 However, the role of these factors in repeated admissions of medical patients has been poorly studied.
The aim of this study was to describe the association of a wider range of biological, functional, and psychosocial variables with the risk of unplanned hospital readmission within 6 months in medical patients with 2 or more recent hospitalizations. There was a particular emphasis on risk factors which might be amenable to intervention.
Methods
Setting and Participants
The study was a prospective longitudinal cohort study. Participant enrolment was undertaken from February 2006 to February 2007. The study setting was the Internal Medicine Department of a tertiary teaching hospital in Brisbane, Australia. The Internal Medicine Department admits approximately 5000 inpatients per annum; more than 95% of these are unplanned admissions (general practitioner referral or self‐referral) via the Emergency Department. Acute and some subacute care are provided by 1 of 5 medical units, each staffed by 2 to 3 consultant general physicians, 2 medical residents (post‐graduate year 3‐4), 2 interns (post‐graduate year 1), and a consistent multidisciplinary team of allied health professionals and senior nursing staff. Descriptions of the inpatient case‐mix and model of care have been published previously.19
Participants were identified by 2 trained research nurses. Daily reports were generated from the hospital admission database to identify all consecutive patients admitted to any general medical unit who had already been hospitalized at the study hospital within the previous six months. The medical record was then screened for eligibility.
Patients were considered for inclusion if they were aged 50 years or older, based on clinical consensus that different factors may be relevant in younger patients, and the demonstrated validity of the selected tools in an older medical population. For logistic reasons, patients were ineligible if they lived outside the greater Brisbane area; came from residential care; had significant language or cognitive difficulties which would preclude participation in interviews; were admitted for end‐of‐life care; or were considered otherwise unsuitable for post‐hospital interviews (eg, no fixed address). Eligible patients were invited to participate in the study. Informed consent was obtained from all participants. The study was approved by the Royal Brisbane and Women's Hospitals and University of Queensland Human Research Ethics Committees.
Outcome and Variables
The primary outcome was 1 or more unplanned readmission to any ward at the study hospital within 6 months of the date of hospital discharge. Information about the frequency and duration of planned and unplanned hospital readmissions in the 6 months after discharge was obtained from the hospital admissions database. Planned readmissions included elective surgical or procedural admissions and scheduled day‐case admissions. Unplanned readmissions included all presentations through the emergency department, except for brief emergency department attendances where the participant was not formally admitted under a consultant.
Information was abstracted from the medical record at the time of discharge using a structured audit tool, including age, sex, primary diagnosis according to the treating clinical team, Charlson comorbidity score, number of medications at discharge, living situation at time of discharge, and the number of hospitalizations in the previous 12 months. Note was made of whether a discharge summary was completed and faxed to the general practitioner within 24 hours of discharge. Weight and height were measured by the research assistant to calculate the body mass index (BMI) which was categorized according to World Health Organization recommended cut‐offs.
Within 5 days of discharge from the index admission, the participant was contacted by telephone to schedule an interview at home within the next week. Posthospital interviews were undertaken using a structured interview tool composed of validated measures of the variables of interest, as described below. Interviews took 45 to 90 minutes to complete, and were performed by one of eight postgraduate clinical psychology students from the University of Queensland, who received training and regular supervision by a senior academic psychologist (NP).
Cognitive status was tested using the 3MS cognitive screening test, a sensitive test for early cognitive impairment.20 The Cambridge Contextual Reading Test (CCRT, short version) was used as a measure of literacy and verbal intelligence, as it may be robust in the presence of early cognitive decline21 Mood disturbances were evaluated using the Geriatric Depression Scale (GDS, short version)22 and the Geriatric Anxiety Inventory (GAI).23 The Social Support Questionnaire short form (SSQ6) was used to identify satisfaction with supports.24 Self‐rated health and income adequacy were rated using a 5 point Likert scale. Compliance with prescribed medication was assessed using the Medication Adherence Rating Scale (MARS) (R Horne, personal communication). Alcohol consumption was evaluated using the alcohol use disorders identification tool (AUDIT).25 Instrumental activities of daily living (IADL: using the telephone, using transport, shopping, housework, meal preparation, medication management, managing money) and basic activities of daily living (BADL: bathing, dressing, eating, mobility, transfers, grooming) were assessed using items from the Older Americans Resources and Services (OARS) questionnaire.26 Relevant permissions were obtained from the developers.
Analysis
Data were analyzed using SPSS 17.0. The distribution of each explanatory and confounding variable was examined and summarized using appropriate statistics (mean, median or proportion). Ordinal and some continuous variables were grouped into categories according to previously validated cut‐offs and clinical meaning. Logarithmic transformation was used in analyses of length of stay due to the highly skewed distribution. ADL and IADL function were grouped into independent in all activities, dependent in IADL function only, and dependent in basic ADL function. Bivariate analysis was undertaken using contingency tables and chi‐square testing for categorical variables and independent samples t‐test or equivalent nonparametric testing for continuous variables, to identify potential associations with the primary outcome.
Dealing with diagnosis posed particular difficulties because of the large number of disease categories. Other authors have restricted the sample to a limited number of diagnoses,27, 28 explored the impact of a limited number of diagnoses compared to all others,13 or grouped diagnoses in a pre‐specified or post hoc manner.3, 15 Considering previous studies and preliminary examination of the data (Table 3), we grouped diagnoses as chronic (heart failure, chronic lung disease, diabetes) vs. other for analysis purposes.
| Follow‐Up Data (n = 142) | No Follow‐Up Data (n = 48) | P | |
|---|---|---|---|
| |||
| Age, years, mean (SD) | 74.0 (10.9) | 76.8 (10.1) | 0.13 |
| Male, % | 52.8 | 56.3 | 0.68 |
| Admissions past 12 months, median (IQR) | 2 (1, 2.25) | 1 (1,2) | 0.38 |
| Comorbidity score, median (IQR) | 2 (1,4) | 2 (1,3) | 0.48 |
| Medications on discharge, mean (SD) | 8.8 (4.0) | 9.0 (4.5) | 0.86 |
| Length of stay, median (IQR) | 6.5 (4,11) | 7 (4,14) | 0.35 |
| Discharged to | 0.30 | ||
| Independent living alone | 38.7 | 47.9 | |
| Independent living with others | 54.2 | 50.0 | |
| Assisted living/residential care | 7.1 | 2.1 | |
| Community services on discharge, % | 42.3 | 56.3 | 0.16 |
| Number (%) with characteristic | % Readmitted | P | |
|---|---|---|---|
| |||
| Age (years) | 0.78 | ||
| <65 | 31 (22) | 39 | |
| 6584.9 | 92 (65) | 40 | |
| 85 or more | 19 (13) | 32 | |
| Male | 75 (53) | 40 | 0.74 |
| Admissions past 12 months | 0.78 | ||
| 1 | 67 (47) | 39 | |
| 2 | 40 (28) | 35 | |
| 3 or more | 35 (25) | 43 | |
| Body mass index | 0.02 | ||
| Underweight | 11 (8) | 72 | |
| Normal | 55 (39) | 27 | |
| Overweight | 43 (30) | 37 | |
| Obese | 32 (23) | 50 | |
| Chronic disease diagnosis | 27 (19) | 67 | 0.001 |
| Functional dependence | 0.16 | ||
| Independent | 27 (19) | 26 | |
| Dependent in IADLs | 48 (34) | 48 | |
| Dependent in BADLs | 66 (47) | 36 | |
| Comorbidity score | 0.15 | ||
| 0 | 19 (13) | 26 | |
| 12 | 62 (44) | 34 | |
| 3 or more | 61 (43) | 48 | |
| Summary sent within 24 hours | 117 (82) | 40 | 0.93 |
| Discharge supports | 0.60 | ||
| community | 72 (51) | 35 | |
| community with supports | 60 (42) | 43 | |
| residential care | 10 (7) | 40 | |
| Poor cognition (3MS 85)* | 80 (58) | 36 | 0.68 |
| Reduced literacy (CCRT<21) | 61 (48) | 41 | 0.55 |
| Depressive symptoms (GDS 5) | 72 (51) | 47 | 0.04 |
| Anxiety symptoms (GAI 9) | 45 (32) | 38 | 0.93 |
| Poor adherence (MARS <24) | 48 (34) | 35 | 0.56 |
| Hazardous drinking (AUDIT >6) | 18 (13) | 39 | 0.98 |
| English as second language | 19 (13) | 32 | 0.50 |
| Self‐rated health fair or poor | 102 (72) | 38 | 0.68 |
| Financial hardship | 46 (32) | 35 | 0.47 |
| Total | 142 | 39 | |
| Diagnosis | Number with diagnosis (%) | % readmitted |
|---|---|---|
| Heart failure | 13 (9) | 69 |
| Diabetes | 6 (4) | 67 |
| Chronic lung disease | 8 (6) | 63 |
| Cellulitis | 8 (6) | 63 |
| Syncope/arrhythmia | 11 (8) | 46 |
| Pneumonia | 10 (7) | 40 |
| Urinary infection | 15 (11) | 33 |
| Fall or fracture | 18 (13) | 33 |
| Gastrointestinal disease | 7 (5) | 29 |
| Ischemic heart disease | 11 (8) | 18 |
| Neurological disease | 7 (5) | 0 |
| Other | 28 (20) | 29 |
| Total | 142 (100) | 39 |
Potentially important variables were chosen based on bivariate analysis (P < 0.2) and previous literature. These variables were then entered into a multiple logistic regression model, and a significant association in the adjusted model was defined as P < 0.05. The performance of the final model was assessed by constructing a receiver operating curve. Given a 40% to 50% anticipated event rate, we estimated that 150 to 200 participants would provide power to include 7 to 10 variables of interest within the model.
Results
Active screening over 12 months identified 1194 new admissions with a documented hospitalization in the previous 6 months. Of these, 85 were discharged prior to clinical review, 227 were aged less than 50 years, 16 died in hospital, and 153 had been screened previously in the study, leaving 713 individual patients for eligibility screening. Screening identified 328 of 713 (46.0%) patients eligible to participate in the study, who were approached for consent. Of these eligible patients, 190 of 328 (57.9%) agreed to participate but 48 of 190 (25%) did not complete posthospital follow‐up, leaving a total of 142 participants. Patient eligibility, consent, and follow‐up are detailed in Figure 1.
Demographic and disease characteristics of the study participants are shown in Table 1. The 48 participants without follow‐up data appeared similar to those with full data, and 25 (52.1%) of these participants without follow‐up data had an unplanned admission within 6 months.
By 6 months, 55 of 142 participants with follow‐up data (38.7%) had had a total of 102 unplanned admissions to the study hospital. Of these, 42 of 55 (76%) were readmitted to internal medicine. Of the 55 participants with an unplanned readmission, 30 had only 1 unplanned readmission, 9 had 2, and 16 had 3 or more unplanned readmissions within 6 months of the index hospitalization.
During 6 month follow‐up of all 142 participants, there were also 97 planned (scheduled) admissions, 56 (58%) of which occurred in the group with an unplanned admission. Thus the 55 participants with an unplanned readmission accounted for a total of 1055 hospital bed‐days (mean 19.2 days per patient over 6 months follow‐up) while the 87 participants without an unplanned readmission used only 147 bed‐days (mean 1.7 days per patient over 6 months).
Bivariate analysis of the association of unplanned readmissions with the study variables is detailed in Table 2. BMI showed a nonlinear relationship with readmission, with a higher risk apparent at each end of the distribution. Depressive symptoms were also associated with a higher risk of readmission.
Age, sex, number of previous admissions, and discharge supports were not significantly different between the 2 groups. There was no difference in length of the index hospital stay: median length of stay was 6 days (interquartile range [IQR] 3‐14 days) in the readmitted group and 7 (IQR 4‐10 days) in the non‐readmitted group. There was a trend to higher mean number of medications in the readmitted group (9.4 vs. 8.8, P = 0.21).
The strongest predictor of readmission was the presence of a chronic disease diagnosis. Patterns of readmission for each primary clinical diagnosis are shown in Table 3. Chronic comorbidities including heart failure, chronic renal failure, and diabetes were associated with a higher risk of readmission (Table 4). Median comorbidity score was 3 (IQR 1‐5) in the readmitted group compared to 2 (IQR 1‐3) in the nonreadmitted group (P = 0.02).
| Co‐Morbidity | Number with Co‐Morbidity (%) | % Readmitted | P |
|---|---|---|---|
| Heart failure | 30 (21) | 57 | 0.02 |
| Chronic renal impairment | 22 (15) | 59 | 0.03 |
| Diabetes | 36 (25) | 53 | 0.05 |
| Chronic lung disease | 39 (27) | 49 | 0.13 |
| Peripheral vascular disease | 25 (18) | 44 | 0.55 |
| Cerebrovascular disease | 36 (25) | 44 | 0.42 |
| Ischemic heart disease | 57 (40) | 40 | 0.75 |
| Cancer | 23 (16) | 35 | 0.67 |
On the basis of these findings and the literature, a multivariate binary logistic regression model for unplanned admission within 6 months was fitted, including chronic disease diagnosis, comorbiditiy score, BMI, functional status, and GDS as explanatory variables, and adjusting for the potential confounders of age and length of stay (as a severity surrogate). The model is shown in Table 5, and demonstrates a significant association between readmission and chronic conditions, BMI, and depressive symptoms. The area under the receiving operating curve was 0.73.
| Odds Ratio (95% CI) | P Value | |
|---|---|---|
| ||
| Body mass index (reference 18.525) | ||
| Underweight (<18.5) | 12.7 (2.370.7) | 0.004 |
| Overweight (2530) | 1.9 (0.75.1) | 0.18 |
| Obese (>30) | 2.6 (0.97.3) | 0.07 |
| Depressive symptoms (GDS 5) | 3.0 (1.36.8) | 0.01 |
| Chronic disease diagnosis | 3.4 (1.39.3) | 0.02 |
| Co‐morbidity score | 1.3 (1.01.6) | 0.02 |
| Dependency (reference independent) | 0.32 | |
| IADL dependency only | 1.7 (0.55.4) | |
| BADL dependency | 0.9 (0.32.8) | |
| Age group (reference <65 years) | 0.94 | |
| 6584 | 1.1 (0.42.8) | |
| 85 or older | 0.9 (0.23.5) | |
| Log length of stay | 0.99 (0.961.01) | 0.43 |
Discussion
This study demonstrates a number of important findings. First, 39% of this group of participants went on to further unplanned hospital readmissions in the ensuing 6 months, demonstrating the high risk in this group with more than 1 recent hospital admission. However, within this group, the risk of readmission was not related to the frequency of admission within the previous year, consistent with several previous studies.29, 30 These finding suggest that 1 or more recent previous admissions identified at the time of a medical admission is an effective identifier of high risk patients. Subgroup analysis of a recent discharge intervention study in medical patients suggests that this high risk group may particularly benefit from such an intervention.16
Second, the study describes important predictors of readmission which may inform novel interventions. The BMI showed a significant nonlinear relationship with readmission, with an increased risk both above and below the normal weight range. Almost half the group was overweight or obese, with a 2‐fold risk compared to normal weight patients. While underweight was less prevalent, it carried a markedly increased probability of readmission. Limited previous studies support the association of nutritional status and unplanned readmission.31, 32 Malnutrition may be a marker of disease stage or severity, or may be associated with other unmeasured social determinants which increase readmission risk. However, malnutrition itself may reduce physiological resilience and predispose to higher health care needs. There are no published trials of posthospital nutritional intervention programs for reducing readmission rates in general medical patients.
The risk of readmission was also increased in participants with depressive symptoms, consistent with several previous studies.3336 This effect was independent of illness type and comorbidity. Depression is increasingly recognized as an important independent predictor of a range of important outcomes in older medical patients, including posthospital functional decline,37 institutionalization and mortality.36, 38 Posthospital decline and poor self‐management might contribute to higher rehospitalization. There is some evidence that effective treatment of psychological comorbidities in medically ill patients may reduce readmissions.18, 39
Both the number and type of chronic conditions appear to be predictors of readmission in this high risk group, where there was a high baseline prevalence of chronic diseases such as heart failure, diabetes, renal impairment, and chronic lung disease which have been associated with higher readmission rates in a number of previous studies.13, 15, 30, 40 Almost all participants had one or more significant comorbid conditions in addition to their presenting complaint; single disease‐focused chronic disease management programs may not be an optimal solution in this group. Consistent with this comorbidity burden, most participants were prescribed a large number of medications. In keeping with other studies,17 about one‐third of participants reported reduced medication adherence but this was not associated with a higher readmission risk.
Like most previous studies in medical patients,10, 11, 15, 29, 30, 35, 36, 40, 41 there was no evidence of increasing readmission rates with age. Functional status impairment was not a significant predictor of readmission, probably reflecting selection of a patient subgroup with a high prevalence of disability and chronic disease. Satisfaction with social support was generally high, and not associated with readmission. This may reflect the emphasis on discharge planning and postacute social and functional support already occurring in usual care.
Measures of cognition and literacy were not associated with readmission. However, these were the items with the most missing data (see Table 2), which may have reduced our ability to detect an association. The study design excluded patients with significant cognitive or communication deficits who were unable to participate in detailed assessments. Such stringent eligibility criteria may be seen as a weakness of this study, reducing the generalizability of the findings. However, the study deliberately sampled a population of older adults suitable for a multifacetted posthospital management program, in order to inform specific intervention targets, and the eligibility criteria reflect these practical considerations. Although some previous studies have found that cognitive impairment is a predictor of readmission,10, 12 others have found no association.29, 30, 36, 40, 41
The main study weaknesses are the small sample size (reflected in the wide confidence intervals [CIs] in the multivariate analysis), and the relatively high rate of drop‐outs (25% of enrolments) for whom detailed posthospital data could not be collected. This problem reflects the age and burden of illness in the population under study. Readmission data were collected for all participants, and a similar rate of readmission was observed in patients with missing data (52% vs. 39%, P = 0.11). The heterogeneous patients mix may have concealed some important associations within individual diagnoses or other patient subgroups. This heterogeneity reflects the reality of the selected high risk subgroup, and the study deliberately avoided a disease‐specific focus for generalizability.
Conclusions
This study confirms the high rate of hospital readmission in medical patients who have already had a previous inpatient admission in the past 6 months. It shifts the emphasis from nonmodifiable disease and demographic predictors to consideration of common, nondisease specific factors which might have a plausible causative relationship with readmission and may be amenable to specific interventions. The population sampled had a high prevalence of chronic disease, and often multiple diseases. Nutritional status and depressive symptoms are emerging as important modifiers of disease course and mortality in the setting of several chronic diseases; this study also supports their potential contribution to increased hospital resource consumption in a high‐risk group. Posthospital programs which specifically address these factors in the context of optimal medical management of underlying chronic diseases have the potential to reduce hospital readmissions.
Hospital readmissions are recognized as both a significant contributor to health care costs and a putative indicator of healthcare quality.1, 2 Older medical patients with chronic medical comorbidities are at particularly high risk for hospital readmission3 and attendant risks of hospitalization.4 Many intervention strategies have been used in trials to reduce readmissions in such patients. Single interventions such as case management,5 care coordination,6 and self‐management7 have been disappointing. There is emerging evidence to support complex, multidisciplinary interventions which include outreach and support in the early post‐hospital period, especially in heart failure patients,8 but also in medical patients with a range of conditions.9 However, such interventions are resource intensive and it remains uncertain which patients may benefit most from interventions.
Although there are many studies of risk factors for hospital admission and readmission, few studies have reported predictors of recurrent readmission.1012 Patients with 2 or more recent hospitalizations are readily identifiable and have a substantially increased risk of hospital readmission compared to patients with only 1 recent hospitalization.10, 11, 1315 These patients may have a unique risk factor profile, and may be a group which may particularly benefit from complex interventions,16 but no previous study has specifically examined risk factors in this high‐risk group.
Previous studies of readmission predictors have largely focussed on demographic and disease characteristics which are not amenable to intervention at individual level. The results of such studies may determine a population at increased risk, but do not inform an intervention strategy.14 Psychological and behavioral factors such as depression and anxiety, perceptions of health, and adherence patterns may also contribute to hospitalizations.17, 18 However, the role of these factors in repeated admissions of medical patients has been poorly studied.
The aim of this study was to describe the association of a wider range of biological, functional, and psychosocial variables with the risk of unplanned hospital readmission within 6 months in medical patients with 2 or more recent hospitalizations. There was a particular emphasis on risk factors which might be amenable to intervention.
Methods
Setting and Participants
The study was a prospective longitudinal cohort study. Participant enrolment was undertaken from February 2006 to February 2007. The study setting was the Internal Medicine Department of a tertiary teaching hospital in Brisbane, Australia. The Internal Medicine Department admits approximately 5000 inpatients per annum; more than 95% of these are unplanned admissions (general practitioner referral or self‐referral) via the Emergency Department. Acute and some subacute care are provided by 1 of 5 medical units, each staffed by 2 to 3 consultant general physicians, 2 medical residents (post‐graduate year 3‐4), 2 interns (post‐graduate year 1), and a consistent multidisciplinary team of allied health professionals and senior nursing staff. Descriptions of the inpatient case‐mix and model of care have been published previously.19
Participants were identified by 2 trained research nurses. Daily reports were generated from the hospital admission database to identify all consecutive patients admitted to any general medical unit who had already been hospitalized at the study hospital within the previous six months. The medical record was then screened for eligibility.
Patients were considered for inclusion if they were aged 50 years or older, based on clinical consensus that different factors may be relevant in younger patients, and the demonstrated validity of the selected tools in an older medical population. For logistic reasons, patients were ineligible if they lived outside the greater Brisbane area; came from residential care; had significant language or cognitive difficulties which would preclude participation in interviews; were admitted for end‐of‐life care; or were considered otherwise unsuitable for post‐hospital interviews (eg, no fixed address). Eligible patients were invited to participate in the study. Informed consent was obtained from all participants. The study was approved by the Royal Brisbane and Women's Hospitals and University of Queensland Human Research Ethics Committees.
Outcome and Variables
The primary outcome was 1 or more unplanned readmission to any ward at the study hospital within 6 months of the date of hospital discharge. Information about the frequency and duration of planned and unplanned hospital readmissions in the 6 months after discharge was obtained from the hospital admissions database. Planned readmissions included elective surgical or procedural admissions and scheduled day‐case admissions. Unplanned readmissions included all presentations through the emergency department, except for brief emergency department attendances where the participant was not formally admitted under a consultant.
Information was abstracted from the medical record at the time of discharge using a structured audit tool, including age, sex, primary diagnosis according to the treating clinical team, Charlson comorbidity score, number of medications at discharge, living situation at time of discharge, and the number of hospitalizations in the previous 12 months. Note was made of whether a discharge summary was completed and faxed to the general practitioner within 24 hours of discharge. Weight and height were measured by the research assistant to calculate the body mass index (BMI) which was categorized according to World Health Organization recommended cut‐offs.
Within 5 days of discharge from the index admission, the participant was contacted by telephone to schedule an interview at home within the next week. Posthospital interviews were undertaken using a structured interview tool composed of validated measures of the variables of interest, as described below. Interviews took 45 to 90 minutes to complete, and were performed by one of eight postgraduate clinical psychology students from the University of Queensland, who received training and regular supervision by a senior academic psychologist (NP).
Cognitive status was tested using the 3MS cognitive screening test, a sensitive test for early cognitive impairment.20 The Cambridge Contextual Reading Test (CCRT, short version) was used as a measure of literacy and verbal intelligence, as it may be robust in the presence of early cognitive decline21 Mood disturbances were evaluated using the Geriatric Depression Scale (GDS, short version)22 and the Geriatric Anxiety Inventory (GAI).23 The Social Support Questionnaire short form (SSQ6) was used to identify satisfaction with supports.24 Self‐rated health and income adequacy were rated using a 5 point Likert scale. Compliance with prescribed medication was assessed using the Medication Adherence Rating Scale (MARS) (R Horne, personal communication). Alcohol consumption was evaluated using the alcohol use disorders identification tool (AUDIT).25 Instrumental activities of daily living (IADL: using the telephone, using transport, shopping, housework, meal preparation, medication management, managing money) and basic activities of daily living (BADL: bathing, dressing, eating, mobility, transfers, grooming) were assessed using items from the Older Americans Resources and Services (OARS) questionnaire.26 Relevant permissions were obtained from the developers.
Analysis
Data were analyzed using SPSS 17.0. The distribution of each explanatory and confounding variable was examined and summarized using appropriate statistics (mean, median or proportion). Ordinal and some continuous variables were grouped into categories according to previously validated cut‐offs and clinical meaning. Logarithmic transformation was used in analyses of length of stay due to the highly skewed distribution. ADL and IADL function were grouped into independent in all activities, dependent in IADL function only, and dependent in basic ADL function. Bivariate analysis was undertaken using contingency tables and chi‐square testing for categorical variables and independent samples t‐test or equivalent nonparametric testing for continuous variables, to identify potential associations with the primary outcome.
Dealing with diagnosis posed particular difficulties because of the large number of disease categories. Other authors have restricted the sample to a limited number of diagnoses,27, 28 explored the impact of a limited number of diagnoses compared to all others,13 or grouped diagnoses in a pre‐specified or post hoc manner.3, 15 Considering previous studies and preliminary examination of the data (Table 3), we grouped diagnoses as chronic (heart failure, chronic lung disease, diabetes) vs. other for analysis purposes.
| Follow‐Up Data (n = 142) | No Follow‐Up Data (n = 48) | P | |
|---|---|---|---|
| |||
| Age, years, mean (SD) | 74.0 (10.9) | 76.8 (10.1) | 0.13 |
| Male, % | 52.8 | 56.3 | 0.68 |
| Admissions past 12 months, median (IQR) | 2 (1, 2.25) | 1 (1,2) | 0.38 |
| Comorbidity score, median (IQR) | 2 (1,4) | 2 (1,3) | 0.48 |
| Medications on discharge, mean (SD) | 8.8 (4.0) | 9.0 (4.5) | 0.86 |
| Length of stay, median (IQR) | 6.5 (4,11) | 7 (4,14) | 0.35 |
| Discharged to | 0.30 | ||
| Independent living alone | 38.7 | 47.9 | |
| Independent living with others | 54.2 | 50.0 | |
| Assisted living/residential care | 7.1 | 2.1 | |
| Community services on discharge, % | 42.3 | 56.3 | 0.16 |
| Number (%) with characteristic | % Readmitted | P | |
|---|---|---|---|
| |||
| Age (years) | 0.78 | ||
| <65 | 31 (22) | 39 | |
| 6584.9 | 92 (65) | 40 | |
| 85 or more | 19 (13) | 32 | |
| Male | 75 (53) | 40 | 0.74 |
| Admissions past 12 months | 0.78 | ||
| 1 | 67 (47) | 39 | |
| 2 | 40 (28) | 35 | |
| 3 or more | 35 (25) | 43 | |
| Body mass index | 0.02 | ||
| Underweight | 11 (8) | 72 | |
| Normal | 55 (39) | 27 | |
| Overweight | 43 (30) | 37 | |
| Obese | 32 (23) | 50 | |
| Chronic disease diagnosis | 27 (19) | 67 | 0.001 |
| Functional dependence | 0.16 | ||
| Independent | 27 (19) | 26 | |
| Dependent in IADLs | 48 (34) | 48 | |
| Dependent in BADLs | 66 (47) | 36 | |
| Comorbidity score | 0.15 | ||
| 0 | 19 (13) | 26 | |
| 12 | 62 (44) | 34 | |
| 3 or more | 61 (43) | 48 | |
| Summary sent within 24 hours | 117 (82) | 40 | 0.93 |
| Discharge supports | 0.60 | ||
| community | 72 (51) | 35 | |
| community with supports | 60 (42) | 43 | |
| residential care | 10 (7) | 40 | |
| Poor cognition (3MS 85)* | 80 (58) | 36 | 0.68 |
| Reduced literacy (CCRT<21) | 61 (48) | 41 | 0.55 |
| Depressive symptoms (GDS 5) | 72 (51) | 47 | 0.04 |
| Anxiety symptoms (GAI 9) | 45 (32) | 38 | 0.93 |
| Poor adherence (MARS <24) | 48 (34) | 35 | 0.56 |
| Hazardous drinking (AUDIT >6) | 18 (13) | 39 | 0.98 |
| English as second language | 19 (13) | 32 | 0.50 |
| Self‐rated health fair or poor | 102 (72) | 38 | 0.68 |
| Financial hardship | 46 (32) | 35 | 0.47 |
| Total | 142 | 39 | |
| Diagnosis | Number with diagnosis (%) | % readmitted |
|---|---|---|
| Heart failure | 13 (9) | 69 |
| Diabetes | 6 (4) | 67 |
| Chronic lung disease | 8 (6) | 63 |
| Cellulitis | 8 (6) | 63 |
| Syncope/arrhythmia | 11 (8) | 46 |
| Pneumonia | 10 (7) | 40 |
| Urinary infection | 15 (11) | 33 |
| Fall or fracture | 18 (13) | 33 |
| Gastrointestinal disease | 7 (5) | 29 |
| Ischemic heart disease | 11 (8) | 18 |
| Neurological disease | 7 (5) | 0 |
| Other | 28 (20) | 29 |
| Total | 142 (100) | 39 |
Potentially important variables were chosen based on bivariate analysis (P < 0.2) and previous literature. These variables were then entered into a multiple logistic regression model, and a significant association in the adjusted model was defined as P < 0.05. The performance of the final model was assessed by constructing a receiver operating curve. Given a 40% to 50% anticipated event rate, we estimated that 150 to 200 participants would provide power to include 7 to 10 variables of interest within the model.
Results
Active screening over 12 months identified 1194 new admissions with a documented hospitalization in the previous 6 months. Of these, 85 were discharged prior to clinical review, 227 were aged less than 50 years, 16 died in hospital, and 153 had been screened previously in the study, leaving 713 individual patients for eligibility screening. Screening identified 328 of 713 (46.0%) patients eligible to participate in the study, who were approached for consent. Of these eligible patients, 190 of 328 (57.9%) agreed to participate but 48 of 190 (25%) did not complete posthospital follow‐up, leaving a total of 142 participants. Patient eligibility, consent, and follow‐up are detailed in Figure 1.
Demographic and disease characteristics of the study participants are shown in Table 1. The 48 participants without follow‐up data appeared similar to those with full data, and 25 (52.1%) of these participants without follow‐up data had an unplanned admission within 6 months.
By 6 months, 55 of 142 participants with follow‐up data (38.7%) had had a total of 102 unplanned admissions to the study hospital. Of these, 42 of 55 (76%) were readmitted to internal medicine. Of the 55 participants with an unplanned readmission, 30 had only 1 unplanned readmission, 9 had 2, and 16 had 3 or more unplanned readmissions within 6 months of the index hospitalization.
During 6 month follow‐up of all 142 participants, there were also 97 planned (scheduled) admissions, 56 (58%) of which occurred in the group with an unplanned admission. Thus the 55 participants with an unplanned readmission accounted for a total of 1055 hospital bed‐days (mean 19.2 days per patient over 6 months follow‐up) while the 87 participants without an unplanned readmission used only 147 bed‐days (mean 1.7 days per patient over 6 months).
Bivariate analysis of the association of unplanned readmissions with the study variables is detailed in Table 2. BMI showed a nonlinear relationship with readmission, with a higher risk apparent at each end of the distribution. Depressive symptoms were also associated with a higher risk of readmission.
Age, sex, number of previous admissions, and discharge supports were not significantly different between the 2 groups. There was no difference in length of the index hospital stay: median length of stay was 6 days (interquartile range [IQR] 3‐14 days) in the readmitted group and 7 (IQR 4‐10 days) in the non‐readmitted group. There was a trend to higher mean number of medications in the readmitted group (9.4 vs. 8.8, P = 0.21).
The strongest predictor of readmission was the presence of a chronic disease diagnosis. Patterns of readmission for each primary clinical diagnosis are shown in Table 3. Chronic comorbidities including heart failure, chronic renal failure, and diabetes were associated with a higher risk of readmission (Table 4). Median comorbidity score was 3 (IQR 1‐5) in the readmitted group compared to 2 (IQR 1‐3) in the nonreadmitted group (P = 0.02).
| Co‐Morbidity | Number with Co‐Morbidity (%) | % Readmitted | P |
|---|---|---|---|
| Heart failure | 30 (21) | 57 | 0.02 |
| Chronic renal impairment | 22 (15) | 59 | 0.03 |
| Diabetes | 36 (25) | 53 | 0.05 |
| Chronic lung disease | 39 (27) | 49 | 0.13 |
| Peripheral vascular disease | 25 (18) | 44 | 0.55 |
| Cerebrovascular disease | 36 (25) | 44 | 0.42 |
| Ischemic heart disease | 57 (40) | 40 | 0.75 |
| Cancer | 23 (16) | 35 | 0.67 |
On the basis of these findings and the literature, a multivariate binary logistic regression model for unplanned admission within 6 months was fitted, including chronic disease diagnosis, comorbiditiy score, BMI, functional status, and GDS as explanatory variables, and adjusting for the potential confounders of age and length of stay (as a severity surrogate). The model is shown in Table 5, and demonstrates a significant association between readmission and chronic conditions, BMI, and depressive symptoms. The area under the receiving operating curve was 0.73.
| Odds Ratio (95% CI) | P Value | |
|---|---|---|
| ||
| Body mass index (reference 18.525) | ||
| Underweight (<18.5) | 12.7 (2.370.7) | 0.004 |
| Overweight (2530) | 1.9 (0.75.1) | 0.18 |
| Obese (>30) | 2.6 (0.97.3) | 0.07 |
| Depressive symptoms (GDS 5) | 3.0 (1.36.8) | 0.01 |
| Chronic disease diagnosis | 3.4 (1.39.3) | 0.02 |
| Co‐morbidity score | 1.3 (1.01.6) | 0.02 |
| Dependency (reference independent) | 0.32 | |
| IADL dependency only | 1.7 (0.55.4) | |
| BADL dependency | 0.9 (0.32.8) | |
| Age group (reference <65 years) | 0.94 | |
| 6584 | 1.1 (0.42.8) | |
| 85 or older | 0.9 (0.23.5) | |
| Log length of stay | 0.99 (0.961.01) | 0.43 |
Discussion
This study demonstrates a number of important findings. First, 39% of this group of participants went on to further unplanned hospital readmissions in the ensuing 6 months, demonstrating the high risk in this group with more than 1 recent hospital admission. However, within this group, the risk of readmission was not related to the frequency of admission within the previous year, consistent with several previous studies.29, 30 These finding suggest that 1 or more recent previous admissions identified at the time of a medical admission is an effective identifier of high risk patients. Subgroup analysis of a recent discharge intervention study in medical patients suggests that this high risk group may particularly benefit from such an intervention.16
Second, the study describes important predictors of readmission which may inform novel interventions. The BMI showed a significant nonlinear relationship with readmission, with an increased risk both above and below the normal weight range. Almost half the group was overweight or obese, with a 2‐fold risk compared to normal weight patients. While underweight was less prevalent, it carried a markedly increased probability of readmission. Limited previous studies support the association of nutritional status and unplanned readmission.31, 32 Malnutrition may be a marker of disease stage or severity, or may be associated with other unmeasured social determinants which increase readmission risk. However, malnutrition itself may reduce physiological resilience and predispose to higher health care needs. There are no published trials of posthospital nutritional intervention programs for reducing readmission rates in general medical patients.
The risk of readmission was also increased in participants with depressive symptoms, consistent with several previous studies.3336 This effect was independent of illness type and comorbidity. Depression is increasingly recognized as an important independent predictor of a range of important outcomes in older medical patients, including posthospital functional decline,37 institutionalization and mortality.36, 38 Posthospital decline and poor self‐management might contribute to higher rehospitalization. There is some evidence that effective treatment of psychological comorbidities in medically ill patients may reduce readmissions.18, 39
Both the number and type of chronic conditions appear to be predictors of readmission in this high risk group, where there was a high baseline prevalence of chronic diseases such as heart failure, diabetes, renal impairment, and chronic lung disease which have been associated with higher readmission rates in a number of previous studies.13, 15, 30, 40 Almost all participants had one or more significant comorbid conditions in addition to their presenting complaint; single disease‐focused chronic disease management programs may not be an optimal solution in this group. Consistent with this comorbidity burden, most participants were prescribed a large number of medications. In keeping with other studies,17 about one‐third of participants reported reduced medication adherence but this was not associated with a higher readmission risk.
Like most previous studies in medical patients,10, 11, 15, 29, 30, 35, 36, 40, 41 there was no evidence of increasing readmission rates with age. Functional status impairment was not a significant predictor of readmission, probably reflecting selection of a patient subgroup with a high prevalence of disability and chronic disease. Satisfaction with social support was generally high, and not associated with readmission. This may reflect the emphasis on discharge planning and postacute social and functional support already occurring in usual care.
Measures of cognition and literacy were not associated with readmission. However, these were the items with the most missing data (see Table 2), which may have reduced our ability to detect an association. The study design excluded patients with significant cognitive or communication deficits who were unable to participate in detailed assessments. Such stringent eligibility criteria may be seen as a weakness of this study, reducing the generalizability of the findings. However, the study deliberately sampled a population of older adults suitable for a multifacetted posthospital management program, in order to inform specific intervention targets, and the eligibility criteria reflect these practical considerations. Although some previous studies have found that cognitive impairment is a predictor of readmission,10, 12 others have found no association.29, 30, 36, 40, 41
The main study weaknesses are the small sample size (reflected in the wide confidence intervals [CIs] in the multivariate analysis), and the relatively high rate of drop‐outs (25% of enrolments) for whom detailed posthospital data could not be collected. This problem reflects the age and burden of illness in the population under study. Readmission data were collected for all participants, and a similar rate of readmission was observed in patients with missing data (52% vs. 39%, P = 0.11). The heterogeneous patients mix may have concealed some important associations within individual diagnoses or other patient subgroups. This heterogeneity reflects the reality of the selected high risk subgroup, and the study deliberately avoided a disease‐specific focus for generalizability.
Conclusions
This study confirms the high rate of hospital readmission in medical patients who have already had a previous inpatient admission in the past 6 months. It shifts the emphasis from nonmodifiable disease and demographic predictors to consideration of common, nondisease specific factors which might have a plausible causative relationship with readmission and may be amenable to specific interventions. The population sampled had a high prevalence of chronic disease, and often multiple diseases. Nutritional status and depressive symptoms are emerging as important modifiers of disease course and mortality in the setting of several chronic diseases; this study also supports their potential contribution to increased hospital resource consumption in a high‐risk group. Posthospital programs which specifically address these factors in the context of optimal medical management of underlying chronic diseases have the potential to reduce hospital readmissions.
- ,,.Rehospitalizations among patients in the Medicare fee‐for‐service program.N Engl J Med.2009;360:1418–1428.
- ,,,,,.Hospital readmissions and quality of care.Med Care.1999;37(5):490–501.
- ,,.Clinical and sociodemographic risk factors for reamdission of Medicare benficiaries.Health Care Financ Rev.1988;10(1):27–36.
- .Hazards of hospitalization of the elderly.Ann Intern Med.1993;118:219–223.
- ,,,,.A case manager intervention to reduce readmissions.Arch Intern Med.1995;154(15):1721–1729.
- ,,, et al.A transitional care service for elderly chronic disease patients at risk of readmission.Aust Health Rev.2004;28(3):275–284.
- ,,,,.Self‐management programmes by lay leaders for people with chronic conditions.Cochrane Database Syst Rev.2007(4):Art No.CD005108.
- ,,,.The effectiveness of disease management programmes in reducing hospital re‐admission in older patients with heart failure: a systematic review and meta‐analysis of published reports.Eur Heart J.2004;25:1570–1595.
- ,,, et al.Discharge planning from hospital to home.Cochrane Database Syst Rev.2010(Issue 1):Art No.CD000313.
- ,,, et al.Characteristics of geriatric patients related to early and late readmissions to hospital.Aging Clin Exp Res.1998;10:339–346.
- ,,, et al.Hospital readmission among older medical patietns in Hong Kong.J R Coll Physicians Lond.1999;33(2):153–156.
- ,,, et al.Early re‐hospitalization of elderly people discharged from a geriatric ward.Aging Clin Exp Res.2006;18(1):63–69.
- ,,,,.Readmission patterns in patients with chronic obstructive pulmonary disease, chronic heart failure and diabetes mellitus: an administrative dataset analysis.Intern Med J.2005;35:296–299.
- ,,,.Case finding for patients at risk of readmission to hospital: development of algorithm to identify high risk patients.BMJ.2006;333:327–330.
- ,,,.Predicting emergency readmission for patients discharged from the medical service of a teaching hospital.J Gen Intern Med.1987;2:400–405.
- ,,, et al.A reengineered hospital discharge program to decrease hospitalization.Ann Intern Med.2009;150:178–187.
- ,,.The role of medication noncompliance and adverse drug reactions in hospitalisations in the elderly.Arch Intern Med.1990;150:841–845.
- ,,, et al.UPBEAT: the impact of a psychogeriatric intervention in VA medical centers.Med Care.2001;39(5):500–512.
- ,,,.Controlled trial of multidisciplinary care teams for acutely ill medical inpatients: enhanced multidisciplinary care.Intern Med J.2006;36:558–563.
- ,.The modified mini‐mental state (3MS) examination.J Clin Psychiatry.1987;48:314–318.
- .Development of the Cambridge Contextual Reading Test for improving the examination of premorbid verbal intelligence in older persons with dementia.Br J Clin Psychol.1998;37:229–240.
- ,.Geriatric Depression Scale (GDS): recent evidence and development of a shorter version.Clinics in Gerontology.1986;5:165–172.
- ,,,,,.Development and validation of the Geriatric Anxiety Inventory.Int Psychogeriatr.2007;19(1):103–114.
- ,,.A brief measure of social support: practical and theoretical implications.J Soc Pers Relat.1987;4:497–510.
- ,,,,.Screening for problem drinking: comparison of the CAGE and AUDIT.J Gen Intern Med.1998;13(6):379–388.
- ,.OARS methodology: a decade of experience in geriatric assessment.J Am Geriatr Soc.1985;33:607–615.
- ,.Hospital readmissions among the elderly.J Am Geriatr Soc.1985;33:595–601.
- ,,,,,.Discharge destination and repeat hospitalizations.Med Care.1997;35:756–767.
- ,,, et al.Measuring frailty in the hospitalized elderly. Concept of functional homeostasis.Am J Phys Med Rehab.1998;77(3):252–257.
- ,.Factors predicting readmission of older general medicine patients.J Gen Intern Med.1991;6(5):389–393.
- .Risk factors for early hospital readmission in a select population of geriatric rehabilitation patients: the significance of functional status.J Am Geriatr Soc.1992;40:792–798.
- ,,,.Predicting early nonelective hospital readmission in nutritionally compromised older adults.Am J Clin Nutr.1997;65:1714–1720.
- ,,,,,.Factors associated with unplanned hospital readmission among patients 65 years of age and older in a Medicare managed care plan.Am J Med.1999;107(1):13–17.
- ,,,.Depression and activities of daily living predict rehospitalisation within 6 months of discharge from geriatric rehabilitation.Rehabil Psychol.2004;49(3):219–223.
- ,,,.Depressive symptoms and negative outcomes in older hospitalized patients.Arch Intern Med.2002;162:948–949.
- ,,,.Depressive symptoms as a predictor of 6‐month outcomes and services utilization in elderly medical inpatients.Arch Intern Med.2001;161:2609–2615.
- ,,,,.Relation between symptoms of depression and health status outcomes in acutely ill hospitalized older persons.Ann Intern Med.1997;126(6):417–425.
- ,,,.Diabetes, depression and death. A randomized controlled trial of a depression treatment program for older adults based in primary care (PROSPECT).Diabetes Care.2007;30(12):3005–3010.
- ,,.Clinical implications of a reduction in psychosocial distress in cardiac prognosis in patients participating in a psychosocial intervention programme.Psychosom Med.2001;63(2):257–266.
- ,,, et al.Predictors of immediate and 6‐month outcomes in hospitalized elderly patients.J Am Geriatr Soc.1988;36:775–783.
- ,,,,.Factors predictive of outcome on admission to an acute geriatric ward.Age Ageing.1999;28:429–432.
- ,,.Rehospitalizations among patients in the Medicare fee‐for‐service program.N Engl J Med.2009;360:1418–1428.
- ,,,,,.Hospital readmissions and quality of care.Med Care.1999;37(5):490–501.
- ,,.Clinical and sociodemographic risk factors for reamdission of Medicare benficiaries.Health Care Financ Rev.1988;10(1):27–36.
- .Hazards of hospitalization of the elderly.Ann Intern Med.1993;118:219–223.
- ,,,,.A case manager intervention to reduce readmissions.Arch Intern Med.1995;154(15):1721–1729.
- ,,, et al.A transitional care service for elderly chronic disease patients at risk of readmission.Aust Health Rev.2004;28(3):275–284.
- ,,,,.Self‐management programmes by lay leaders for people with chronic conditions.Cochrane Database Syst Rev.2007(4):Art No.CD005108.
- ,,,.The effectiveness of disease management programmes in reducing hospital re‐admission in older patients with heart failure: a systematic review and meta‐analysis of published reports.Eur Heart J.2004;25:1570–1595.
- ,,, et al.Discharge planning from hospital to home.Cochrane Database Syst Rev.2010(Issue 1):Art No.CD000313.
- ,,, et al.Characteristics of geriatric patients related to early and late readmissions to hospital.Aging Clin Exp Res.1998;10:339–346.
- ,,, et al.Hospital readmission among older medical patietns in Hong Kong.J R Coll Physicians Lond.1999;33(2):153–156.
- ,,, et al.Early re‐hospitalization of elderly people discharged from a geriatric ward.Aging Clin Exp Res.2006;18(1):63–69.
- ,,,,.Readmission patterns in patients with chronic obstructive pulmonary disease, chronic heart failure and diabetes mellitus: an administrative dataset analysis.Intern Med J.2005;35:296–299.
- ,,,.Case finding for patients at risk of readmission to hospital: development of algorithm to identify high risk patients.BMJ.2006;333:327–330.
- ,,,.Predicting emergency readmission for patients discharged from the medical service of a teaching hospital.J Gen Intern Med.1987;2:400–405.
- ,,, et al.A reengineered hospital discharge program to decrease hospitalization.Ann Intern Med.2009;150:178–187.
- ,,.The role of medication noncompliance and adverse drug reactions in hospitalisations in the elderly.Arch Intern Med.1990;150:841–845.
- ,,, et al.UPBEAT: the impact of a psychogeriatric intervention in VA medical centers.Med Care.2001;39(5):500–512.
- ,,,.Controlled trial of multidisciplinary care teams for acutely ill medical inpatients: enhanced multidisciplinary care.Intern Med J.2006;36:558–563.
- ,.The modified mini‐mental state (3MS) examination.J Clin Psychiatry.1987;48:314–318.
- .Development of the Cambridge Contextual Reading Test for improving the examination of premorbid verbal intelligence in older persons with dementia.Br J Clin Psychol.1998;37:229–240.
- ,.Geriatric Depression Scale (GDS): recent evidence and development of a shorter version.Clinics in Gerontology.1986;5:165–172.
- ,,,,,.Development and validation of the Geriatric Anxiety Inventory.Int Psychogeriatr.2007;19(1):103–114.
- ,,.A brief measure of social support: practical and theoretical implications.J Soc Pers Relat.1987;4:497–510.
- ,,,,.Screening for problem drinking: comparison of the CAGE and AUDIT.J Gen Intern Med.1998;13(6):379–388.
- ,.OARS methodology: a decade of experience in geriatric assessment.J Am Geriatr Soc.1985;33:607–615.
- ,.Hospital readmissions among the elderly.J Am Geriatr Soc.1985;33:595–601.
- ,,,,,.Discharge destination and repeat hospitalizations.Med Care.1997;35:756–767.
- ,,, et al.Measuring frailty in the hospitalized elderly. Concept of functional homeostasis.Am J Phys Med Rehab.1998;77(3):252–257.
- ,.Factors predicting readmission of older general medicine patients.J Gen Intern Med.1991;6(5):389–393.
- .Risk factors for early hospital readmission in a select population of geriatric rehabilitation patients: the significance of functional status.J Am Geriatr Soc.1992;40:792–798.
- ,,,.Predicting early nonelective hospital readmission in nutritionally compromised older adults.Am J Clin Nutr.1997;65:1714–1720.
- ,,,,,.Factors associated with unplanned hospital readmission among patients 65 years of age and older in a Medicare managed care plan.Am J Med.1999;107(1):13–17.
- ,,,.Depression and activities of daily living predict rehospitalisation within 6 months of discharge from geriatric rehabilitation.Rehabil Psychol.2004;49(3):219–223.
- ,,,.Depressive symptoms and negative outcomes in older hospitalized patients.Arch Intern Med.2002;162:948–949.
- ,,,.Depressive symptoms as a predictor of 6‐month outcomes and services utilization in elderly medical inpatients.Arch Intern Med.2001;161:2609–2615.
- ,,,,.Relation between symptoms of depression and health status outcomes in acutely ill hospitalized older persons.Ann Intern Med.1997;126(6):417–425.
- ,,,.Diabetes, depression and death. A randomized controlled trial of a depression treatment program for older adults based in primary care (PROSPECT).Diabetes Care.2007;30(12):3005–3010.
- ,,.Clinical implications of a reduction in psychosocial distress in cardiac prognosis in patients participating in a psychosocial intervention programme.Psychosom Med.2001;63(2):257–266.
- ,,, et al.Predictors of immediate and 6‐month outcomes in hospitalized elderly patients.J Am Geriatr Soc.1988;36:775–783.
- ,,,,.Factors predictive of outcome on admission to an acute geriatric ward.Age Ageing.1999;28:429–432.
Copyright © 2010 Society of Hospital Medicine
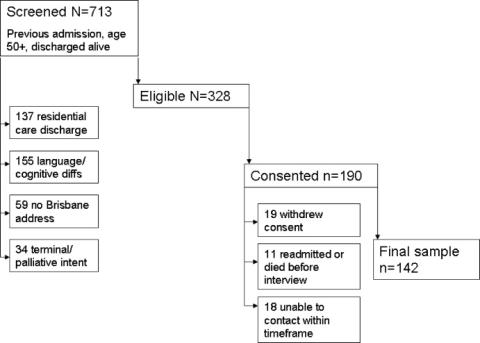
Redefining Readmission Risk Factors
Within Medicare recipients, an astounding one in five medical patients (19.6%) is readmitted within 30 days, accounting for $15 billion in spending.1, 2 Amidst the current healthcare system crisis, reducing these hospital readmissions has risen to the highest priority. Reducing readmissions is the newest addition to multiple quality dashboards, both institutional and national, as a measure of the care delivered during hospitalization.3 One of the most notable of these reporting entities, Hospital Compare, now publicly reports Medicare readmission rates for a few common diagnoses.4 While Medicare already withholds payment to hospitals for readmissions within 24 hours for the same diagnosis, Medicare may soon reduce payment to hospitals with the highest rates of readmission within 30 days, a powerful incentive for hospitals to intervene. Readmissions have also reached the radar of additional stakeholders, even making its way onto Obama's budget considerations, given the potential cost savings to the system overall.5
To develop systems which reduce readmissions, one must first gain understanding of the characteristics of readmissions. A few clinical risk factors (such as age, number of prior admissions, and comorbidities) have been well defined in subgroups of general medicine inpatients.612 Likewise, interventions aiming to reduce readmissions have also focused on subgroups, excluding a large portion of hospitalized patients (for example, non‐English speakers and younger patients).1320 Other data have been derived in veterans or within non‐US populations that have inherently different payer, race, ethnicity, and primary language composition, and may not be applicable outside those settings.7, 8, 10, 11, 21 Lastly, little is known regarding risk that may be associated with operational factors, such as weekend discharge or admission source. As a result, there are few data describing the clinical, operational, and demographic factors associated with readmission in a heterogeneous population of hospitalized general medicine patientsthe patient population of most generalists in the United States.
To understand the impact of a variety of risk factors in a diverse general medicine population, we evaluated the characteristics of readmitted patients in a large urban university medical center over a 2‐year period. We hypothesized that a number of clinical, operational, and sociodemographic factors would be associated with readmission.
Methods
Sites and Subjects
Our data were collected on general medicine patients during hospitalization between June 1, 2006 and May 31, 2008, at the University of California San Francisco. The University of California, San Francisco (UCSF) Medical Center is composed of Moffitt‐Long Hospital (a 400‐bed center) and UCSF‐Mount Zion Hospital (a 200‐bed facility) located in San Francisco, CA.
Medical patients at Moffitt‐Long Hospital are admitted to 1 of 8 medical teams composed of a resident, 1 to 2 interns, and 0 to 3 medical students, supervised by an attending physician who is most often a hospitalist. At Moffitt‐Long Hospital, housestaff write all orders and provide 24‐hour coverage to inpatients. Mount Zion medical patients are cared for by 1 of 2 teams and staffed by a hospitalist on each team who is responsible for all elements of care. Both services care for common inpatient diagnoses, as well as specialty‐associated diagnoses such as cancer, pneumonia, and chronic obstructive pulmonary disease (COPD). Of note, at Moffitt‐Long Hospital, those patients with primary cardiac diagnoses are cared for by a separate team composed of housestaff and students supervised by a cardiologist.
The discharge process at both sites utilizes a multidisciplinary teamincluding physicians, case managers, nurses, pharmacists, and discharge coordinatorsworking in concert. Key components include arranging follow‐up care, faxing the discharge summary to the primary care provider, and educating the patient and caregivers, especially regarding medications. While these goals are clearly delineated, significant variability exists in how these tasks are actually accomplished. The multidisciplinary approach, components of the discharge process, and lack of a systematic approach are representative of the discharge process around the country.22
Data
Data regarding patient demographics, age, comorbidities, and insurance status were collected from administrative data systems at UCSF, reflecting the patient's status at the time of index admission. These same systems were used to collect a date‐stamped log of all medications (eg, anticoagulants) for which the patient was billed during the last 48 hours of hospitalization. Specifically, data were obtained for medications previously shown to cause adverse drug events following hospital discharge.23, 24 These medication groups include corticosteroids, anticoagulants, antibiotics, narcotics, nonsteroidal anti‐inflammatory drugs (NSAIDs), cardiovascular medications, antiepileptics, anticholinergics, antidepressants, and antidiabetics. Operational factors that we hypothesized would affect readmission risk included admission source, discharge disposition, and weekday vs. weekend discharge. Case management, social work, and pharmacy services operate with limited staffing on weekends. Likewise, resident and intern physicians are more likely to be off on a weekend day than a weekday; covering attending physicians care for about half of patients during the weekend. Data were obtained from Transition Systems International (TSI, Boston, MA) administrative databases, a cost‐accounting system that collects data abstracted from patient charts upon discharge from UCSF.
Definition of Readmission Measure
Using TSI, we detected readmission to UCSF by screening for any inpatient encounters on any service (not just medicine) within the 30 days following discharge from the general medicine service at the 2 UCSF campuses. We excluded elective readmissions, such as for scheduled chemotherapy. Patients who died at the index admission were excluded from the cohort.
Adjustment Variables
Age, gender, payer status and APR risk of mortality (3M Health Information Systems, St. Paul, MN) were collected from administrative data. The All Patient Refined (APR) risk of mortality is the all patients risk of mortality score developed by 3M which divides patients into 4 subclasses of risk based on clinical problems and comorbidities.25 We used secondary diagnosis codes in administrative data to classify comorbidities using the method of Elixhauser.26
Using the log of medication charges, we grouped high‐risk medications according to the classification scheme of Forster et al.23 and Hanlon et al.24 We then created a count representing the total number of medications administered to patients within the final 48 hours of stay.
Analysis
We first described study patients and hospitals using univariable methods. Multivariable generalized estimating equations (SAS PROC GENMOD) were used to account for clustering of patients within physicians and calculate adjusted odds ratios (ORs). As there were 2 sites within UCSF Medical Center (Moffitt‐Long and Mount Zion hospitals), we included site as a fixed effect in our model. Models were constructed using manual variable selection methods with final selection being made based on whether the covariate was associated with readmission at P < 0.05. All analyses were carried out using SAS version 9.2 (SAS Institute, Inc. Cary, NC).
Results
Baseline Characteristics
During the 2‐year accrual period, 295 attending physicians admitted 6805 unique patients for a total of 10,359 admissions. Seventeen percent of these 10,359 admissions were readmitted within 30 days. The cohort of all patients had a mean age of 59.6 years 19.5 standard deviation (SD), with 52.8% women. The mean length of stay was 5.6 days 10.4 SD. Medicare was the payer source for approximately half of the admissions. The majority of admissions (90.4%) were billed for at least 1 high risk medication, with narcotics, cardiac medications, and antibiotics being the most common. Regarding disposition, 79.5% of admissions were discharged to home; 9.1% were discharged to a skilled nursing facility (SNF).
Baseline sociodemographic, operational, and clinical characteristics for patients readmitted and not readmitted are shown in Table 1. Demographic characteristics with significant differences (P < 0.05) between readmitted and nonreadmitted groups included mean age, race, payer status, and primary language other than English. Regarding operational characteristics, readmitted patients had a higher median length of stay and were more likely to be admitted through the emergency room during their index admission. Discharge to an SNF was higher in the readmitted group versus the nonreadmitted group (9.7% vs. 9.0%). Several clinical factors were more prevalent in the readmitted group: high‐risk medications, specifically steroids, narcotics, and cardiovascular medications; high‐risk medication count of 3 or greater; and comorbidities including congestive heart failure, renal disease, cancer, anemia, and depression.
| Characteristic | Patients Readmitted (n = 1762 17.0%), n (%) | Patients Not Readmitted (n = 8597 83.0%), n (%) | P Value |
|---|---|---|---|
| |||
| Mean age (years) (SD) | 58.8 (19.3) | 59.8 (19.6) | 0.0491 |
| Female | 930 (52.8) | 4548 (52.9) | 0.9260 |
| Race* | |||
| White | 785 (44.6) | 4166 (48.8) | <0.0001 |
| Black | 442 (25.1) | 1401 (16.4) | |
| Asian | 323 (18.4) | 1726 (20.2) | |
| Other | 209 (11.9) | 1240 (14.5) | |
| Hispanic ethnicity | 140 (8.1) | 734 (8.9) | 0.2737 |
| Payer status | |||
| Medicare | 905 (51.4) | 4266 (49.6) | <0.0001 |
| Medicaid/Medi‐cal | 458 (26.0) | 1578 (18.4) | |
| Private | 370 (21.0) | 2092 (24.3) | |
| Other | 29 (1.7) | 661 (7.7) | |
| Primary language other than English | 242 (17.1) | 1394 (19.5) | 0.0359 |
| Median length of stay (days) (interquartile range) | 4 (2, 7) | 3 (2, 6) | <0.0001 |
| Admit source | |||
| Emergency room | 1506 (85.5) | 6898 (80.2) | <0.0001 |
| Outside hospital | 38 (2.2) | 271 (3.2) | |
| Direct admission/other (jail) | 218 (12.4) | 1428 (16.6) | |
| Discharge to | |||
| Home | 1461 (82.9) | 6773 (78.8) | <0.0001 |
| SNF | 170 (9.7) | 774 (9.0) | |
| Other | 131 (7.4) | 1050 (12.2) | |
| Discharged on weekend | 381 (21.6) | 1904 (22.1) | 0.6288 |
| Patient medications | |||
| Any high‐risk medication | 1679 (95.3) | 7684 (89.4) | <0.0001 |
| High‐risk medication count | |||
| 02 | 577 (32.8) | 3666 (42.6) | <0.0001 |
| 34 | 692 (39.3) | 2968 (34.5) | |
| 5 | 493 (28) | 1963 (22.8) | |
| Any corticosteroids | 399 (22.6) | 1571 (18.3) | <0.0001 |
| Anticoagulant | 120 (6.8) | 559 (6.5) | 0.6340 |
| Any antibiotic | 904 (51.3) | 4203 (48.9) | 0.0646 |
| Any narcotic | 1036 (58.8) | 4206 (48.9) | <0.0001 |
| Any NSAID | 68 (3.9) | 320 (3.7) | 0.7826 |
| Any cardiovascular med | 887 (50.3) | 3806 (44.3) | <0.0001 |
| Any antiepileptic | 93 (5.3) | 470 (5.5) | 0.7500 |
| Any anticholinergic | 47 (2.7) | 354 (4.1) | 0.0040 |
| Any antidepressant | 455 (25.8) | 1863 (25.8) | 0.0001 |
| Any antidiabetic | 198 (11.2) | 994 (11.6) | 0.6970 |
| Elixhauser comorbidities | |||
| Congestive heart failure | 219 (12.4) | 795 (9.3) | <0.0001 |
| Pulmonary circulation disease | 72 (4.1) | 178 (2.1) | <0.0001 |
| Peripheral vascular disease | 84 (4.8) | 331 (3.9) | 0.0737 |
| Hypertension | 745 (42.3) | 3741 (43.5) | 0.3411 |
| Other neurological disease | 101 (5.7) | 696 (8.1) | 0.0007 |
| Chronic pulmonary disease | 317 (18.0) | 1442 (16.8) | 0.2149 |
| Diabetes | 303 (17.2) | 1333 (15.5) | 0.0762 |
| Renal failure | 339 (19.2) | 1286 (15.0) | <0.0001 |
| Liver disease | 188 (10.7) | 774 (9.0) | 0.0281 |
| Metastatic cancer | 160 (9.1) | 530 (6.2) | <0.0001 |
| Solid tumor w/o metastases | 100 (5.7) | 277 (3.2) | <0.0001 |
| Rheumatoid arthritis/collagen vas | 81 (4.6) | 303 (3.5) | 0.0299 |
| Weight loss | 153 (8.7) | 584 (6.8) | 0.0449 |
| Deficiency anemia | 522 (29.6) | 1979 (23.0) | <0.0001 |
| Alcohol abuse | 101 (5.7) | 428 (5.0) | 0.1905 |
| Drug abuse | 148 (8.4) | 619 (7.2) | 0.0798 |
| Depression | 244 (13.9) | 963 (11.2) | 0.0016 |
| APR risk of mortality | |||
| 1 | 451 (25.6) | 3101 (36.1) | <0.0001 |
| 2 | 619 (35.1) | 2797 (32.5) | |
| 3 | 536 (30.4) | 1907 (22.2) | |
| 4 | 156 (8.9) | 792 (9.2) | |
Frequency of Readmission
The 30‐day readmission rate was 17.0% (1762 patients), with 49.7% (875 patients) of the readmissions occurring within 10 days of discharge. Of patients readmitted, the general medicine service was the readmitting team in 78.2%. A quarter of readmissions (26.2%) had the same primary diagnosis on initial and repeat admission.
Factors Associated With Readmission
Factors associated with readmission were categorized as sociodemographic, operational, and clinical. Factors associated with readmission with P < 0.05 and present in at least 5% of admissions are presented in Table 2. Of the sociodemographic factors, black race was significantly associated with readmission. Within the Medicare cohort, risk for readmission was similar for white vs. nonwhite race, with relative risk of 1.0 (95% confidence interval [CI], 0.86‐1.18). Medicaid as payer status was significantly associated in the unadjusted model, and in the adjusted model showed a trend toward readmission. Mean age was significantly different in the readmitted and nonreadmitted groups, but the difference was small (1.0 year). Moreover, when we evaluated age in 5‐year categories (ex. 65‐70, 71‐75, etc.), age was not associated with readmission. In the adjusted model, none of the operational factors were significantly associated with readmission, including discharge to SNF, weekend discharge, or admit source.
| Covariate | Unadjusted OR (95% CI) | Adjusted OR (95% CI) |
|---|---|---|
| ||
| Age | 1.00 (0.991.00) | 1.00 (0.991.00) |
| Race | ||
| White | Referent | Referent |
| Black | 1.67 (1.471.91) | 1.43 (1.241.65) |
| Asian | 0.99 (0.861.14) | 0.95 (0.821.11) |
| Other | 0.89 (0.761.06) | 0.84 (0.671.06) |
| Payer | ||
| Medicare | Referent | Referent |
| Medicaid/medical | 1.37 (1.211.55) | 1.15 (0.971.36) |
| Private | 0.83 (0.730.95) | 0.78 (0.650.95) |
| Other | 0.21 (0.140.30) | 0.23 (0.110.45) |
| Disposition | ||
| To home | Referent | Referent |
| SNF | 1.02 (0.851.21) | 0.98 (0.821.18) |
| Other | 0.58 (0.480.70) | 0.53 (0.430.66) |
| Highrisk medications | ||
| Corticosteroids | 1.31 (1.161.48) | 1.24 (1.091.42) |
| Narcotics | 1.49 (1.341.65) | 1.33 (1.161.53) |
| Anticholinergics | 0.64 (0.470.87) | 0.66 (0.480.90) |
| Comorbidities | ||
| Congestive heart failure | 1.39 (1.191.63) | 1.30 (1.091.56) |
| Neurological disorders | 0.69 (0.560.86) | 0.70 (0.570.87) |
| Renal failure | 1.35 (1.191.55) | 1.19 (1.051.36) |
| Metastatic cancer | 1.52 (1.261.83) | 1.61 (1.331.95) |
| Solid tumor w/o metastasis | 1.81 (1.432.29) | 1.95 (1.542.47) |
| Deficiency anemia | 1.41 (1.261.58) | 1.27 (1.131.44) |
| Weight loss | 1.30 (1.081.57) | 1.26 (1.091.47) |
Of the clinical factors, high‐risk medications and 6 comorbidities were associated with readmission. High‐risk medication categories associated with readmission were steroids and narcotics; anticholinergics medications were protective. The 6 comorbidities associated with readmission were congestive heart failure, renal disease, cancer (with and without metastasis), weight loss, and iron deficiency anemia. While APR risk of mortality was associated with readmission at P < 0.05, including APR in our final model did not alter which other factors were significantly associated with readmission. When site (Moffitt‐Long vs. Mount Zion Hospitals) was added to the model, the ORs for factors associated with readmission did not change appreciably (0.01).
Discussion
In this retrospective observational study of hospitalized patients, we found that readmission was common and associated with a number of risk factors that could be easily identified early in hospitalization. Nonclinical factors associated with readmission were black race and Medicaid payer status (in the unadjusted model). Clinical factors were high risk medications including steroids and narcotics; and comorbidities including congestive heart failure, renal disease, cancer, anemia, and weight loss. In contrast, other potential riskssuch as discharge on a weekend and discharge to an SNFwere not independently associated with readmission. This cohortwith a mix of clinical scenarios, payers, age, etc.represents the inherently heterogeneous population of inpatient general medicine across the country and abroad. Hospitalists provided care for over 65% of the general medicine service, again representative of the trend in US inpatient medicine.27, 28 Lastly, our cohort did not have the benefit of a systematic and consistent discharge process with interventions focused on reducing readmissions. This gap, which is common across hospitals, highlights the utility of this data in targeting quality improvement efforts.
Reducing risks for readmission requires identification of patient populations at highest risk; in those patients, one can further identify factors which are potentially modifiable via education or patient‐engagement interventions. While in the hospital, more intensive predischarge counseling and efforts to increase mobility may be most useful if targeted early and often on those at highest risk.15, 16, 29, 30 Finally, broader‐based support in the form of better home services, more access to longitudinal care, or targeted postdischarge efforts may be required.14, 31
Though current strategies focus largely on clinical risk factors, this study shows that nonclinical factors play an equally important but underappreciated role in contributing to readmission. While prior studies have shown variable results on association of black race with readmission,2, 9, 11 none have evaluated or linked Medicaid to readmission, which just missed statistical significance in this study (OR, 1.15; 95% CI, 0.971.36). Both black race and Medicaid as payer are proxies for the underlying root cause aspects leading to readmission, such as access to longitudinal care. Following this trail to the root cause will require in‐depth qualitative evaluation that includes the patient perspective as a source of data.32 For example, risk for readmission may not stem solely from being on warfarin, but in combination with not having transportation to get an international normalized ratio (INR) checked, a suboptimal understanding of how to take the medication, or not recognizing potential side effects until too late to avoid inpatient admission.
Several of the strongest associations, and perhaps most conducive to targeted interventions, were high‐risk medications at discharge. Risk related to medications and adverse drug events following discharge have been a consistent theme in readmission literature.24, 33 Our current system, which includes mandated inpatient medicine reconciliation, does not encourage discontinuation of unnecessary medications to combat polypharmacy, address affordability of medications, provide consistent medication counseling, or focus on the highest risk medications. In fact, bundled interventions which implement pharmacists to focus on these measures have been successful in decreasing readmission,14, 16, 29 but unfortunately are not yet part of the standard of care. The challenge remains transforming a mandatory policy such as medicine reconciliation into a valuable and systematic tool in the discharge process.
Two factors were surprisingly protective against readmission: neurologic diagnosis and anticholinergic medications. This first may be explained by the presence of a separate neurology service at our institution which skews our data. For example, a patient with acute stroke, who has a 20% rate of bounce‐back to a higher level of care within 30 days of discharge,34 would be admitted to the neurology service, not general medicine, and therefore would not nr part of our cohort. Regarding anticholinergics, several factors may explain this unexpected result. First, use of anticholinergics was relatively rare in our sample (2.7% in readmitted patients, 4.1% in patients not readmitted), possibly creating a false positive result. Second, Hanlon et al.24 showed only a weak association at best between anticholinergics and postdischarge adverse drug reactions (hazard ratio, 1.11; 95% CI, 0.86‐1.43). Lastly, anticholinergics include a varied group of medications, therefore diluting possible relative risk of specific medications.
While this study allows providers to identify patients at increased risk of readmission, the identified factors do not fully account for readmission risk; we did not aim to produce a risk‐prediction rule with our study. Prior readmission studies have been unable to create a tool to predict which patients will be readmitted with much success.3537 These results underscore the complexities and variability of readmission, which often lack a clear single cause and effect relationship. Given the breadth of risk factors we identified, it seems likely that more intensive interventions will require a multidisciplinary approach, one which might be costly if applied broadly. Our study does not attempt to predict who will be readmitted and who will not, but rather provides a list of risk factors which might be used to deploy resources more efficiently.
This study had several limitations. We did not capture readmissions to outside hospitals, which account for 22% to 24% of all readmissions in prior studies, and therefore have underestimated the readmission rate in our population.2, 8 However, by limiting our data to 2 hospitals within 1 institution, we were able to include more detailed patient level data, which is not accurately available in other large databases. Also, while studies of risk factors in a managed care population (such as within Medicare, the Veterans Affairs medical centers, or countries with national integrated medical records) are able to capture all readmissions, this study is the first to evaluate readmissions risk factors in a truly heterogeneous U.S. inpatient medicine population without limitation by age or payer status. Second, we did not have access to outpatient medications lists; however use of these same medications within the last 48 hours of admission is likely a reasonable proxy for outpatient use and more conducive to potential interventions (such as medication reconciliation or patient education) that could flag patients prior to discharge. Payer data was limited to only the primary payer, so patients who were dual eligible (ie, have both Medicare and Medicaid) were categorized as Medicare. Regarding sociodemographic factors, while primary language other than English was not associated with readmission, language data was missing in 17.4% of admissions, thereby limiting our ability to evaluate this factor. Our data did not include access to outpatient or primary care, and therefore we were unable to evaluate access to postdischarge follow‐up care as a risk factor for readmission. Lastly, while this study did not include outpatient deaths, we did exclude patients who died in the hospital.
Conclusions
Readmission is common among general medicine patients, with approximately 1 in 5 patients being readmitted within 30 days. While the identified associated factors do not account for all the potential reasons for readmission, our study suggests a spectrum of risk factors which might be used to target more intensive multidisciplinary interventions. Specifically, the nonclinical factors of race and payer status merit further in depth research incorporating the patient experience to truly determine causation of readmission. Hospitalists, who are at nexus of the discharge process and uniquely invested in quality inpatient care, are ideally positioned to lead efforts to reduce readmissions. How to use our study's results to develop and implement effective interventions to reduce readmissions remains a subject for future studies.
- A path to bundled payment around a rehospitalization.: Medicare payment Advisory Commission; June2005.
- ,,.Rehospitalizations among patients in the Medicare fee‐for‐service program.N Engl J Med.2009;360(14):1418–1428.
- University HealthSystem Consortium. Available at: https://www.uhc.edu. Accessed May2010.
- U.S. Department of Health 15(5):599–606.
- ,,,.Development and validation of a model for predicting emergency admissions over the next year (PEONY): a UK historical cohort study.Arch Intern Med.2008;168(13):1416–1422.
- ,,, et al.Incidence and main factors associated with early unplanned hospital readmission among French medical inpatients aged 75 and over admitted through emergency units.Age Ageing.2008;37(4):416–422.
- ,,,,,.Factors associated with unplanned hospital readmission among patients 65 years of age and older in a Medicare managed care plan.Am J Med.1999;107(1):13–17.
- ,,.Risk factors for early unplanned hospital readmission in the elderly.J Gen Intern Med.1991;6(3):223–228.
- ,,, et al.Predicting non‐elective hospital readmissions: a multi‐site study. Department of Veterans Affairs Cooperative Study Group on Primary Care and Readmissions.J Clin Epidemiol.2000;53(11):1113–1118.
- ,.Effect of gender, ethnicity, pulmonary disease, and symptom stability on rehospitalization in patients with heart failure.Am J Cardiol.2007;100(7):1139–1144.
- ,,,.The care transitions intervention: results of a randomized controlled trial.Arch Intern Med.2006;166(17):1822–1828.
- ,,,.The impact of follow‐up telephone calls to patients after hospitalization.Am J Med.2001;111(9B):26S–30S.
- ,,, et al.A reengineered hospital discharge program to decrease rehospitalization: a randomized trial.Ann Intern Med.2009;150(3):178–187.
- ,,, et al.Reduction of 30‐day postdischarge hospital readmission or emergency department (ED) visit rates in high‐risk elderly medical patients through delivery of a targeted care bundle.J Hosp Med.2009;4(4):211–218.
- ,,,,,.Comprehensive discharge planning with postdischarge support for older patients with congestive heart failure: a meta‐analysis.JAMA.2004;291(11):1358–1367.
- ,.Home‐based intervention in congestive heart failure: long‐term implications on readmission and survival.Circulation.2002;105(24):2861–2866.
- ,,,,,.Effect of a standardized nurse case‐management telephone intervention on resource use in patients with chronic heart failure.Arch Intern Med.2002;162(6):705–712.
- ,,,.The impact of follow‐up physician visits on emergency readmissions for patients with asthma and chronic obstructive pulmonary disease: a population‐based study.Am J Med.2002;112(2):120–125.
- ,.Factors predicting readmission of older general medicine patients.J Gen Intern Med.1991;6(5):389–393.
- BOOSTing Care Transitions. Available at: http://www.hospitalmedicine.org/ResourceRoomRedesign/RR_CareTransitions/CT_Home.cfm. Accessed May2010.
- ,,,,.Adverse drug events occurring following hospital discharge.J Gen Intern Med.2005;20(4):317–323.
- ,,, et al.Incidence and predictors of all and preventable adverse drug reactions in frail elderly persons after hospital stay.J Gerontol A Biol Sci Med Sci.2006;61(5):511–515.
- . Development of the 3M™ All Patient Refined Diagnosis Related Groups (APR DRGs). Available at: http://www.ahrq.gov/qual/mortality/Hughes.htm. Accessed May2010.
- ,,.Volume thresholds and hospital characteristics in the United States.Health Aff (Millwood).2003;22(2):167–177.
- ,,,.The status of hospital medicine groups in the United States.J Hosp Med.2006;1(2):75–80.
- ,,,.Growth in the care of older patients by hospitalists in the United States.N Engl J Med.2009;360(11):1102–1112.
- ,,, et al.Role of pharmacist counseling in preventing adverse drug events after hospitalization.Arch Intern Med.2006;166(5):565–571.
- ,,, et al.Effects of a multicomponent intervention on functional outcomes and process of care in hospitalized older patients: a randomized controlled trial of Acute Care for Elders (ACE) in a community hospital.J Am Geriatr Soc.2000;48(12):1572–1581.
- ,,,,,.Telehome monitoring in patients with cardiac disease who are at high risk of readmission.Heart Lung.2008;37(1):36–45.
- ,,.Understanding rehospitalization risk: can hospital discharge be modified to reduce recurrent hospitalization?J Hosp Med.2007;2(5):297–304.
- ,,,,.The incidence and severity of adverse events affecting patients after discharge from the hospital.Ann Intern Med.2003;138(3):161–167.
- ,,,.Bouncing back: patterns and predictors of complicated transitions 30 days after hospitalization for acute ischemic stroke.J Am Geriatr Soc.2007;55(3):365–373.
- ,,,.Case finding for patients at risk of readmission to hospital: development of algorithm to identify high risk patients.BMJ.2006;333(7563):327.
- ,,,,,.Screening elders for risk of hospital admission.J Am Geriatr Soc.1993;41(8):811–817.
- ,,,.Using routine inpatient data to identify patients at risk of hospital readmission.BMC Health Serv Res.2009;9:96.
Within Medicare recipients, an astounding one in five medical patients (19.6%) is readmitted within 30 days, accounting for $15 billion in spending.1, 2 Amidst the current healthcare system crisis, reducing these hospital readmissions has risen to the highest priority. Reducing readmissions is the newest addition to multiple quality dashboards, both institutional and national, as a measure of the care delivered during hospitalization.3 One of the most notable of these reporting entities, Hospital Compare, now publicly reports Medicare readmission rates for a few common diagnoses.4 While Medicare already withholds payment to hospitals for readmissions within 24 hours for the same diagnosis, Medicare may soon reduce payment to hospitals with the highest rates of readmission within 30 days, a powerful incentive for hospitals to intervene. Readmissions have also reached the radar of additional stakeholders, even making its way onto Obama's budget considerations, given the potential cost savings to the system overall.5
To develop systems which reduce readmissions, one must first gain understanding of the characteristics of readmissions. A few clinical risk factors (such as age, number of prior admissions, and comorbidities) have been well defined in subgroups of general medicine inpatients.612 Likewise, interventions aiming to reduce readmissions have also focused on subgroups, excluding a large portion of hospitalized patients (for example, non‐English speakers and younger patients).1320 Other data have been derived in veterans or within non‐US populations that have inherently different payer, race, ethnicity, and primary language composition, and may not be applicable outside those settings.7, 8, 10, 11, 21 Lastly, little is known regarding risk that may be associated with operational factors, such as weekend discharge or admission source. As a result, there are few data describing the clinical, operational, and demographic factors associated with readmission in a heterogeneous population of hospitalized general medicine patientsthe patient population of most generalists in the United States.
To understand the impact of a variety of risk factors in a diverse general medicine population, we evaluated the characteristics of readmitted patients in a large urban university medical center over a 2‐year period. We hypothesized that a number of clinical, operational, and sociodemographic factors would be associated with readmission.
Methods
Sites and Subjects
Our data were collected on general medicine patients during hospitalization between June 1, 2006 and May 31, 2008, at the University of California San Francisco. The University of California, San Francisco (UCSF) Medical Center is composed of Moffitt‐Long Hospital (a 400‐bed center) and UCSF‐Mount Zion Hospital (a 200‐bed facility) located in San Francisco, CA.
Medical patients at Moffitt‐Long Hospital are admitted to 1 of 8 medical teams composed of a resident, 1 to 2 interns, and 0 to 3 medical students, supervised by an attending physician who is most often a hospitalist. At Moffitt‐Long Hospital, housestaff write all orders and provide 24‐hour coverage to inpatients. Mount Zion medical patients are cared for by 1 of 2 teams and staffed by a hospitalist on each team who is responsible for all elements of care. Both services care for common inpatient diagnoses, as well as specialty‐associated diagnoses such as cancer, pneumonia, and chronic obstructive pulmonary disease (COPD). Of note, at Moffitt‐Long Hospital, those patients with primary cardiac diagnoses are cared for by a separate team composed of housestaff and students supervised by a cardiologist.
The discharge process at both sites utilizes a multidisciplinary teamincluding physicians, case managers, nurses, pharmacists, and discharge coordinatorsworking in concert. Key components include arranging follow‐up care, faxing the discharge summary to the primary care provider, and educating the patient and caregivers, especially regarding medications. While these goals are clearly delineated, significant variability exists in how these tasks are actually accomplished. The multidisciplinary approach, components of the discharge process, and lack of a systematic approach are representative of the discharge process around the country.22
Data
Data regarding patient demographics, age, comorbidities, and insurance status were collected from administrative data systems at UCSF, reflecting the patient's status at the time of index admission. These same systems were used to collect a date‐stamped log of all medications (eg, anticoagulants) for which the patient was billed during the last 48 hours of hospitalization. Specifically, data were obtained for medications previously shown to cause adverse drug events following hospital discharge.23, 24 These medication groups include corticosteroids, anticoagulants, antibiotics, narcotics, nonsteroidal anti‐inflammatory drugs (NSAIDs), cardiovascular medications, antiepileptics, anticholinergics, antidepressants, and antidiabetics. Operational factors that we hypothesized would affect readmission risk included admission source, discharge disposition, and weekday vs. weekend discharge. Case management, social work, and pharmacy services operate with limited staffing on weekends. Likewise, resident and intern physicians are more likely to be off on a weekend day than a weekday; covering attending physicians care for about half of patients during the weekend. Data were obtained from Transition Systems International (TSI, Boston, MA) administrative databases, a cost‐accounting system that collects data abstracted from patient charts upon discharge from UCSF.
Definition of Readmission Measure
Using TSI, we detected readmission to UCSF by screening for any inpatient encounters on any service (not just medicine) within the 30 days following discharge from the general medicine service at the 2 UCSF campuses. We excluded elective readmissions, such as for scheduled chemotherapy. Patients who died at the index admission were excluded from the cohort.
Adjustment Variables
Age, gender, payer status and APR risk of mortality (3M Health Information Systems, St. Paul, MN) were collected from administrative data. The All Patient Refined (APR) risk of mortality is the all patients risk of mortality score developed by 3M which divides patients into 4 subclasses of risk based on clinical problems and comorbidities.25 We used secondary diagnosis codes in administrative data to classify comorbidities using the method of Elixhauser.26
Using the log of medication charges, we grouped high‐risk medications according to the classification scheme of Forster et al.23 and Hanlon et al.24 We then created a count representing the total number of medications administered to patients within the final 48 hours of stay.
Analysis
We first described study patients and hospitals using univariable methods. Multivariable generalized estimating equations (SAS PROC GENMOD) were used to account for clustering of patients within physicians and calculate adjusted odds ratios (ORs). As there were 2 sites within UCSF Medical Center (Moffitt‐Long and Mount Zion hospitals), we included site as a fixed effect in our model. Models were constructed using manual variable selection methods with final selection being made based on whether the covariate was associated with readmission at P < 0.05. All analyses were carried out using SAS version 9.2 (SAS Institute, Inc. Cary, NC).
Results
Baseline Characteristics
During the 2‐year accrual period, 295 attending physicians admitted 6805 unique patients for a total of 10,359 admissions. Seventeen percent of these 10,359 admissions were readmitted within 30 days. The cohort of all patients had a mean age of 59.6 years 19.5 standard deviation (SD), with 52.8% women. The mean length of stay was 5.6 days 10.4 SD. Medicare was the payer source for approximately half of the admissions. The majority of admissions (90.4%) were billed for at least 1 high risk medication, with narcotics, cardiac medications, and antibiotics being the most common. Regarding disposition, 79.5% of admissions were discharged to home; 9.1% were discharged to a skilled nursing facility (SNF).
Baseline sociodemographic, operational, and clinical characteristics for patients readmitted and not readmitted are shown in Table 1. Demographic characteristics with significant differences (P < 0.05) between readmitted and nonreadmitted groups included mean age, race, payer status, and primary language other than English. Regarding operational characteristics, readmitted patients had a higher median length of stay and were more likely to be admitted through the emergency room during their index admission. Discharge to an SNF was higher in the readmitted group versus the nonreadmitted group (9.7% vs. 9.0%). Several clinical factors were more prevalent in the readmitted group: high‐risk medications, specifically steroids, narcotics, and cardiovascular medications; high‐risk medication count of 3 or greater; and comorbidities including congestive heart failure, renal disease, cancer, anemia, and depression.
| Characteristic | Patients Readmitted (n = 1762 17.0%), n (%) | Patients Not Readmitted (n = 8597 83.0%), n (%) | P Value |
|---|---|---|---|
| |||
| Mean age (years) (SD) | 58.8 (19.3) | 59.8 (19.6) | 0.0491 |
| Female | 930 (52.8) | 4548 (52.9) | 0.9260 |
| Race* | |||
| White | 785 (44.6) | 4166 (48.8) | <0.0001 |
| Black | 442 (25.1) | 1401 (16.4) | |
| Asian | 323 (18.4) | 1726 (20.2) | |
| Other | 209 (11.9) | 1240 (14.5) | |
| Hispanic ethnicity | 140 (8.1) | 734 (8.9) | 0.2737 |
| Payer status | |||
| Medicare | 905 (51.4) | 4266 (49.6) | <0.0001 |
| Medicaid/Medi‐cal | 458 (26.0) | 1578 (18.4) | |
| Private | 370 (21.0) | 2092 (24.3) | |
| Other | 29 (1.7) | 661 (7.7) | |
| Primary language other than English | 242 (17.1) | 1394 (19.5) | 0.0359 |
| Median length of stay (days) (interquartile range) | 4 (2, 7) | 3 (2, 6) | <0.0001 |
| Admit source | |||
| Emergency room | 1506 (85.5) | 6898 (80.2) | <0.0001 |
| Outside hospital | 38 (2.2) | 271 (3.2) | |
| Direct admission/other (jail) | 218 (12.4) | 1428 (16.6) | |
| Discharge to | |||
| Home | 1461 (82.9) | 6773 (78.8) | <0.0001 |
| SNF | 170 (9.7) | 774 (9.0) | |
| Other | 131 (7.4) | 1050 (12.2) | |
| Discharged on weekend | 381 (21.6) | 1904 (22.1) | 0.6288 |
| Patient medications | |||
| Any high‐risk medication | 1679 (95.3) | 7684 (89.4) | <0.0001 |
| High‐risk medication count | |||
| 02 | 577 (32.8) | 3666 (42.6) | <0.0001 |
| 34 | 692 (39.3) | 2968 (34.5) | |
| 5 | 493 (28) | 1963 (22.8) | |
| Any corticosteroids | 399 (22.6) | 1571 (18.3) | <0.0001 |
| Anticoagulant | 120 (6.8) | 559 (6.5) | 0.6340 |
| Any antibiotic | 904 (51.3) | 4203 (48.9) | 0.0646 |
| Any narcotic | 1036 (58.8) | 4206 (48.9) | <0.0001 |
| Any NSAID | 68 (3.9) | 320 (3.7) | 0.7826 |
| Any cardiovascular med | 887 (50.3) | 3806 (44.3) | <0.0001 |
| Any antiepileptic | 93 (5.3) | 470 (5.5) | 0.7500 |
| Any anticholinergic | 47 (2.7) | 354 (4.1) | 0.0040 |
| Any antidepressant | 455 (25.8) | 1863 (25.8) | 0.0001 |
| Any antidiabetic | 198 (11.2) | 994 (11.6) | 0.6970 |
| Elixhauser comorbidities | |||
| Congestive heart failure | 219 (12.4) | 795 (9.3) | <0.0001 |
| Pulmonary circulation disease | 72 (4.1) | 178 (2.1) | <0.0001 |
| Peripheral vascular disease | 84 (4.8) | 331 (3.9) | 0.0737 |
| Hypertension | 745 (42.3) | 3741 (43.5) | 0.3411 |
| Other neurological disease | 101 (5.7) | 696 (8.1) | 0.0007 |
| Chronic pulmonary disease | 317 (18.0) | 1442 (16.8) | 0.2149 |
| Diabetes | 303 (17.2) | 1333 (15.5) | 0.0762 |
| Renal failure | 339 (19.2) | 1286 (15.0) | <0.0001 |
| Liver disease | 188 (10.7) | 774 (9.0) | 0.0281 |
| Metastatic cancer | 160 (9.1) | 530 (6.2) | <0.0001 |
| Solid tumor w/o metastases | 100 (5.7) | 277 (3.2) | <0.0001 |
| Rheumatoid arthritis/collagen vas | 81 (4.6) | 303 (3.5) | 0.0299 |
| Weight loss | 153 (8.7) | 584 (6.8) | 0.0449 |
| Deficiency anemia | 522 (29.6) | 1979 (23.0) | <0.0001 |
| Alcohol abuse | 101 (5.7) | 428 (5.0) | 0.1905 |
| Drug abuse | 148 (8.4) | 619 (7.2) | 0.0798 |
| Depression | 244 (13.9) | 963 (11.2) | 0.0016 |
| APR risk of mortality | |||
| 1 | 451 (25.6) | 3101 (36.1) | <0.0001 |
| 2 | 619 (35.1) | 2797 (32.5) | |
| 3 | 536 (30.4) | 1907 (22.2) | |
| 4 | 156 (8.9) | 792 (9.2) | |
Frequency of Readmission
The 30‐day readmission rate was 17.0% (1762 patients), with 49.7% (875 patients) of the readmissions occurring within 10 days of discharge. Of patients readmitted, the general medicine service was the readmitting team in 78.2%. A quarter of readmissions (26.2%) had the same primary diagnosis on initial and repeat admission.
Factors Associated With Readmission
Factors associated with readmission were categorized as sociodemographic, operational, and clinical. Factors associated with readmission with P < 0.05 and present in at least 5% of admissions are presented in Table 2. Of the sociodemographic factors, black race was significantly associated with readmission. Within the Medicare cohort, risk for readmission was similar for white vs. nonwhite race, with relative risk of 1.0 (95% confidence interval [CI], 0.86‐1.18). Medicaid as payer status was significantly associated in the unadjusted model, and in the adjusted model showed a trend toward readmission. Mean age was significantly different in the readmitted and nonreadmitted groups, but the difference was small (1.0 year). Moreover, when we evaluated age in 5‐year categories (ex. 65‐70, 71‐75, etc.), age was not associated with readmission. In the adjusted model, none of the operational factors were significantly associated with readmission, including discharge to SNF, weekend discharge, or admit source.
| Covariate | Unadjusted OR (95% CI) | Adjusted OR (95% CI) |
|---|---|---|
| ||
| Age | 1.00 (0.991.00) | 1.00 (0.991.00) |
| Race | ||
| White | Referent | Referent |
| Black | 1.67 (1.471.91) | 1.43 (1.241.65) |
| Asian | 0.99 (0.861.14) | 0.95 (0.821.11) |
| Other | 0.89 (0.761.06) | 0.84 (0.671.06) |
| Payer | ||
| Medicare | Referent | Referent |
| Medicaid/medical | 1.37 (1.211.55) | 1.15 (0.971.36) |
| Private | 0.83 (0.730.95) | 0.78 (0.650.95) |
| Other | 0.21 (0.140.30) | 0.23 (0.110.45) |
| Disposition | ||
| To home | Referent | Referent |
| SNF | 1.02 (0.851.21) | 0.98 (0.821.18) |
| Other | 0.58 (0.480.70) | 0.53 (0.430.66) |
| Highrisk medications | ||
| Corticosteroids | 1.31 (1.161.48) | 1.24 (1.091.42) |
| Narcotics | 1.49 (1.341.65) | 1.33 (1.161.53) |
| Anticholinergics | 0.64 (0.470.87) | 0.66 (0.480.90) |
| Comorbidities | ||
| Congestive heart failure | 1.39 (1.191.63) | 1.30 (1.091.56) |
| Neurological disorders | 0.69 (0.560.86) | 0.70 (0.570.87) |
| Renal failure | 1.35 (1.191.55) | 1.19 (1.051.36) |
| Metastatic cancer | 1.52 (1.261.83) | 1.61 (1.331.95) |
| Solid tumor w/o metastasis | 1.81 (1.432.29) | 1.95 (1.542.47) |
| Deficiency anemia | 1.41 (1.261.58) | 1.27 (1.131.44) |
| Weight loss | 1.30 (1.081.57) | 1.26 (1.091.47) |
Of the clinical factors, high‐risk medications and 6 comorbidities were associated with readmission. High‐risk medication categories associated with readmission were steroids and narcotics; anticholinergics medications were protective. The 6 comorbidities associated with readmission were congestive heart failure, renal disease, cancer (with and without metastasis), weight loss, and iron deficiency anemia. While APR risk of mortality was associated with readmission at P < 0.05, including APR in our final model did not alter which other factors were significantly associated with readmission. When site (Moffitt‐Long vs. Mount Zion Hospitals) was added to the model, the ORs for factors associated with readmission did not change appreciably (0.01).
Discussion
In this retrospective observational study of hospitalized patients, we found that readmission was common and associated with a number of risk factors that could be easily identified early in hospitalization. Nonclinical factors associated with readmission were black race and Medicaid payer status (in the unadjusted model). Clinical factors were high risk medications including steroids and narcotics; and comorbidities including congestive heart failure, renal disease, cancer, anemia, and weight loss. In contrast, other potential riskssuch as discharge on a weekend and discharge to an SNFwere not independently associated with readmission. This cohortwith a mix of clinical scenarios, payers, age, etc.represents the inherently heterogeneous population of inpatient general medicine across the country and abroad. Hospitalists provided care for over 65% of the general medicine service, again representative of the trend in US inpatient medicine.27, 28 Lastly, our cohort did not have the benefit of a systematic and consistent discharge process with interventions focused on reducing readmissions. This gap, which is common across hospitals, highlights the utility of this data in targeting quality improvement efforts.
Reducing risks for readmission requires identification of patient populations at highest risk; in those patients, one can further identify factors which are potentially modifiable via education or patient‐engagement interventions. While in the hospital, more intensive predischarge counseling and efforts to increase mobility may be most useful if targeted early and often on those at highest risk.15, 16, 29, 30 Finally, broader‐based support in the form of better home services, more access to longitudinal care, or targeted postdischarge efforts may be required.14, 31
Though current strategies focus largely on clinical risk factors, this study shows that nonclinical factors play an equally important but underappreciated role in contributing to readmission. While prior studies have shown variable results on association of black race with readmission,2, 9, 11 none have evaluated or linked Medicaid to readmission, which just missed statistical significance in this study (OR, 1.15; 95% CI, 0.971.36). Both black race and Medicaid as payer are proxies for the underlying root cause aspects leading to readmission, such as access to longitudinal care. Following this trail to the root cause will require in‐depth qualitative evaluation that includes the patient perspective as a source of data.32 For example, risk for readmission may not stem solely from being on warfarin, but in combination with not having transportation to get an international normalized ratio (INR) checked, a suboptimal understanding of how to take the medication, or not recognizing potential side effects until too late to avoid inpatient admission.
Several of the strongest associations, and perhaps most conducive to targeted interventions, were high‐risk medications at discharge. Risk related to medications and adverse drug events following discharge have been a consistent theme in readmission literature.24, 33 Our current system, which includes mandated inpatient medicine reconciliation, does not encourage discontinuation of unnecessary medications to combat polypharmacy, address affordability of medications, provide consistent medication counseling, or focus on the highest risk medications. In fact, bundled interventions which implement pharmacists to focus on these measures have been successful in decreasing readmission,14, 16, 29 but unfortunately are not yet part of the standard of care. The challenge remains transforming a mandatory policy such as medicine reconciliation into a valuable and systematic tool in the discharge process.
Two factors were surprisingly protective against readmission: neurologic diagnosis and anticholinergic medications. This first may be explained by the presence of a separate neurology service at our institution which skews our data. For example, a patient with acute stroke, who has a 20% rate of bounce‐back to a higher level of care within 30 days of discharge,34 would be admitted to the neurology service, not general medicine, and therefore would not nr part of our cohort. Regarding anticholinergics, several factors may explain this unexpected result. First, use of anticholinergics was relatively rare in our sample (2.7% in readmitted patients, 4.1% in patients not readmitted), possibly creating a false positive result. Second, Hanlon et al.24 showed only a weak association at best between anticholinergics and postdischarge adverse drug reactions (hazard ratio, 1.11; 95% CI, 0.86‐1.43). Lastly, anticholinergics include a varied group of medications, therefore diluting possible relative risk of specific medications.
While this study allows providers to identify patients at increased risk of readmission, the identified factors do not fully account for readmission risk; we did not aim to produce a risk‐prediction rule with our study. Prior readmission studies have been unable to create a tool to predict which patients will be readmitted with much success.3537 These results underscore the complexities and variability of readmission, which often lack a clear single cause and effect relationship. Given the breadth of risk factors we identified, it seems likely that more intensive interventions will require a multidisciplinary approach, one which might be costly if applied broadly. Our study does not attempt to predict who will be readmitted and who will not, but rather provides a list of risk factors which might be used to deploy resources more efficiently.
This study had several limitations. We did not capture readmissions to outside hospitals, which account for 22% to 24% of all readmissions in prior studies, and therefore have underestimated the readmission rate in our population.2, 8 However, by limiting our data to 2 hospitals within 1 institution, we were able to include more detailed patient level data, which is not accurately available in other large databases. Also, while studies of risk factors in a managed care population (such as within Medicare, the Veterans Affairs medical centers, or countries with national integrated medical records) are able to capture all readmissions, this study is the first to evaluate readmissions risk factors in a truly heterogeneous U.S. inpatient medicine population without limitation by age or payer status. Second, we did not have access to outpatient medications lists; however use of these same medications within the last 48 hours of admission is likely a reasonable proxy for outpatient use and more conducive to potential interventions (such as medication reconciliation or patient education) that could flag patients prior to discharge. Payer data was limited to only the primary payer, so patients who were dual eligible (ie, have both Medicare and Medicaid) were categorized as Medicare. Regarding sociodemographic factors, while primary language other than English was not associated with readmission, language data was missing in 17.4% of admissions, thereby limiting our ability to evaluate this factor. Our data did not include access to outpatient or primary care, and therefore we were unable to evaluate access to postdischarge follow‐up care as a risk factor for readmission. Lastly, while this study did not include outpatient deaths, we did exclude patients who died in the hospital.
Conclusions
Readmission is common among general medicine patients, with approximately 1 in 5 patients being readmitted within 30 days. While the identified associated factors do not account for all the potential reasons for readmission, our study suggests a spectrum of risk factors which might be used to target more intensive multidisciplinary interventions. Specifically, the nonclinical factors of race and payer status merit further in depth research incorporating the patient experience to truly determine causation of readmission. Hospitalists, who are at nexus of the discharge process and uniquely invested in quality inpatient care, are ideally positioned to lead efforts to reduce readmissions. How to use our study's results to develop and implement effective interventions to reduce readmissions remains a subject for future studies.
Within Medicare recipients, an astounding one in five medical patients (19.6%) is readmitted within 30 days, accounting for $15 billion in spending.1, 2 Amidst the current healthcare system crisis, reducing these hospital readmissions has risen to the highest priority. Reducing readmissions is the newest addition to multiple quality dashboards, both institutional and national, as a measure of the care delivered during hospitalization.3 One of the most notable of these reporting entities, Hospital Compare, now publicly reports Medicare readmission rates for a few common diagnoses.4 While Medicare already withholds payment to hospitals for readmissions within 24 hours for the same diagnosis, Medicare may soon reduce payment to hospitals with the highest rates of readmission within 30 days, a powerful incentive for hospitals to intervene. Readmissions have also reached the radar of additional stakeholders, even making its way onto Obama's budget considerations, given the potential cost savings to the system overall.5
To develop systems which reduce readmissions, one must first gain understanding of the characteristics of readmissions. A few clinical risk factors (such as age, number of prior admissions, and comorbidities) have been well defined in subgroups of general medicine inpatients.612 Likewise, interventions aiming to reduce readmissions have also focused on subgroups, excluding a large portion of hospitalized patients (for example, non‐English speakers and younger patients).1320 Other data have been derived in veterans or within non‐US populations that have inherently different payer, race, ethnicity, and primary language composition, and may not be applicable outside those settings.7, 8, 10, 11, 21 Lastly, little is known regarding risk that may be associated with operational factors, such as weekend discharge or admission source. As a result, there are few data describing the clinical, operational, and demographic factors associated with readmission in a heterogeneous population of hospitalized general medicine patientsthe patient population of most generalists in the United States.
To understand the impact of a variety of risk factors in a diverse general medicine population, we evaluated the characteristics of readmitted patients in a large urban university medical center over a 2‐year period. We hypothesized that a number of clinical, operational, and sociodemographic factors would be associated with readmission.
Methods
Sites and Subjects
Our data were collected on general medicine patients during hospitalization between June 1, 2006 and May 31, 2008, at the University of California San Francisco. The University of California, San Francisco (UCSF) Medical Center is composed of Moffitt‐Long Hospital (a 400‐bed center) and UCSF‐Mount Zion Hospital (a 200‐bed facility) located in San Francisco, CA.
Medical patients at Moffitt‐Long Hospital are admitted to 1 of 8 medical teams composed of a resident, 1 to 2 interns, and 0 to 3 medical students, supervised by an attending physician who is most often a hospitalist. At Moffitt‐Long Hospital, housestaff write all orders and provide 24‐hour coverage to inpatients. Mount Zion medical patients are cared for by 1 of 2 teams and staffed by a hospitalist on each team who is responsible for all elements of care. Both services care for common inpatient diagnoses, as well as specialty‐associated diagnoses such as cancer, pneumonia, and chronic obstructive pulmonary disease (COPD). Of note, at Moffitt‐Long Hospital, those patients with primary cardiac diagnoses are cared for by a separate team composed of housestaff and students supervised by a cardiologist.
The discharge process at both sites utilizes a multidisciplinary teamincluding physicians, case managers, nurses, pharmacists, and discharge coordinatorsworking in concert. Key components include arranging follow‐up care, faxing the discharge summary to the primary care provider, and educating the patient and caregivers, especially regarding medications. While these goals are clearly delineated, significant variability exists in how these tasks are actually accomplished. The multidisciplinary approach, components of the discharge process, and lack of a systematic approach are representative of the discharge process around the country.22
Data
Data regarding patient demographics, age, comorbidities, and insurance status were collected from administrative data systems at UCSF, reflecting the patient's status at the time of index admission. These same systems were used to collect a date‐stamped log of all medications (eg, anticoagulants) for which the patient was billed during the last 48 hours of hospitalization. Specifically, data were obtained for medications previously shown to cause adverse drug events following hospital discharge.23, 24 These medication groups include corticosteroids, anticoagulants, antibiotics, narcotics, nonsteroidal anti‐inflammatory drugs (NSAIDs), cardiovascular medications, antiepileptics, anticholinergics, antidepressants, and antidiabetics. Operational factors that we hypothesized would affect readmission risk included admission source, discharge disposition, and weekday vs. weekend discharge. Case management, social work, and pharmacy services operate with limited staffing on weekends. Likewise, resident and intern physicians are more likely to be off on a weekend day than a weekday; covering attending physicians care for about half of patients during the weekend. Data were obtained from Transition Systems International (TSI, Boston, MA) administrative databases, a cost‐accounting system that collects data abstracted from patient charts upon discharge from UCSF.
Definition of Readmission Measure
Using TSI, we detected readmission to UCSF by screening for any inpatient encounters on any service (not just medicine) within the 30 days following discharge from the general medicine service at the 2 UCSF campuses. We excluded elective readmissions, such as for scheduled chemotherapy. Patients who died at the index admission were excluded from the cohort.
Adjustment Variables
Age, gender, payer status and APR risk of mortality (3M Health Information Systems, St. Paul, MN) were collected from administrative data. The All Patient Refined (APR) risk of mortality is the all patients risk of mortality score developed by 3M which divides patients into 4 subclasses of risk based on clinical problems and comorbidities.25 We used secondary diagnosis codes in administrative data to classify comorbidities using the method of Elixhauser.26
Using the log of medication charges, we grouped high‐risk medications according to the classification scheme of Forster et al.23 and Hanlon et al.24 We then created a count representing the total number of medications administered to patients within the final 48 hours of stay.
Analysis
We first described study patients and hospitals using univariable methods. Multivariable generalized estimating equations (SAS PROC GENMOD) were used to account for clustering of patients within physicians and calculate adjusted odds ratios (ORs). As there were 2 sites within UCSF Medical Center (Moffitt‐Long and Mount Zion hospitals), we included site as a fixed effect in our model. Models were constructed using manual variable selection methods with final selection being made based on whether the covariate was associated with readmission at P < 0.05. All analyses were carried out using SAS version 9.2 (SAS Institute, Inc. Cary, NC).
Results
Baseline Characteristics
During the 2‐year accrual period, 295 attending physicians admitted 6805 unique patients for a total of 10,359 admissions. Seventeen percent of these 10,359 admissions were readmitted within 30 days. The cohort of all patients had a mean age of 59.6 years 19.5 standard deviation (SD), with 52.8% women. The mean length of stay was 5.6 days 10.4 SD. Medicare was the payer source for approximately half of the admissions. The majority of admissions (90.4%) were billed for at least 1 high risk medication, with narcotics, cardiac medications, and antibiotics being the most common. Regarding disposition, 79.5% of admissions were discharged to home; 9.1% were discharged to a skilled nursing facility (SNF).
Baseline sociodemographic, operational, and clinical characteristics for patients readmitted and not readmitted are shown in Table 1. Demographic characteristics with significant differences (P < 0.05) between readmitted and nonreadmitted groups included mean age, race, payer status, and primary language other than English. Regarding operational characteristics, readmitted patients had a higher median length of stay and were more likely to be admitted through the emergency room during their index admission. Discharge to an SNF was higher in the readmitted group versus the nonreadmitted group (9.7% vs. 9.0%). Several clinical factors were more prevalent in the readmitted group: high‐risk medications, specifically steroids, narcotics, and cardiovascular medications; high‐risk medication count of 3 or greater; and comorbidities including congestive heart failure, renal disease, cancer, anemia, and depression.
| Characteristic | Patients Readmitted (n = 1762 17.0%), n (%) | Patients Not Readmitted (n = 8597 83.0%), n (%) | P Value |
|---|---|---|---|
| |||
| Mean age (years) (SD) | 58.8 (19.3) | 59.8 (19.6) | 0.0491 |
| Female | 930 (52.8) | 4548 (52.9) | 0.9260 |
| Race* | |||
| White | 785 (44.6) | 4166 (48.8) | <0.0001 |
| Black | 442 (25.1) | 1401 (16.4) | |
| Asian | 323 (18.4) | 1726 (20.2) | |
| Other | 209 (11.9) | 1240 (14.5) | |
| Hispanic ethnicity | 140 (8.1) | 734 (8.9) | 0.2737 |
| Payer status | |||
| Medicare | 905 (51.4) | 4266 (49.6) | <0.0001 |
| Medicaid/Medi‐cal | 458 (26.0) | 1578 (18.4) | |
| Private | 370 (21.0) | 2092 (24.3) | |
| Other | 29 (1.7) | 661 (7.7) | |
| Primary language other than English | 242 (17.1) | 1394 (19.5) | 0.0359 |
| Median length of stay (days) (interquartile range) | 4 (2, 7) | 3 (2, 6) | <0.0001 |
| Admit source | |||
| Emergency room | 1506 (85.5) | 6898 (80.2) | <0.0001 |
| Outside hospital | 38 (2.2) | 271 (3.2) | |
| Direct admission/other (jail) | 218 (12.4) | 1428 (16.6) | |
| Discharge to | |||
| Home | 1461 (82.9) | 6773 (78.8) | <0.0001 |
| SNF | 170 (9.7) | 774 (9.0) | |
| Other | 131 (7.4) | 1050 (12.2) | |
| Discharged on weekend | 381 (21.6) | 1904 (22.1) | 0.6288 |
| Patient medications | |||
| Any high‐risk medication | 1679 (95.3) | 7684 (89.4) | <0.0001 |
| High‐risk medication count | |||
| 02 | 577 (32.8) | 3666 (42.6) | <0.0001 |
| 34 | 692 (39.3) | 2968 (34.5) | |
| 5 | 493 (28) | 1963 (22.8) | |
| Any corticosteroids | 399 (22.6) | 1571 (18.3) | <0.0001 |
| Anticoagulant | 120 (6.8) | 559 (6.5) | 0.6340 |
| Any antibiotic | 904 (51.3) | 4203 (48.9) | 0.0646 |
| Any narcotic | 1036 (58.8) | 4206 (48.9) | <0.0001 |
| Any NSAID | 68 (3.9) | 320 (3.7) | 0.7826 |
| Any cardiovascular med | 887 (50.3) | 3806 (44.3) | <0.0001 |
| Any antiepileptic | 93 (5.3) | 470 (5.5) | 0.7500 |
| Any anticholinergic | 47 (2.7) | 354 (4.1) | 0.0040 |
| Any antidepressant | 455 (25.8) | 1863 (25.8) | 0.0001 |
| Any antidiabetic | 198 (11.2) | 994 (11.6) | 0.6970 |
| Elixhauser comorbidities | |||
| Congestive heart failure | 219 (12.4) | 795 (9.3) | <0.0001 |
| Pulmonary circulation disease | 72 (4.1) | 178 (2.1) | <0.0001 |
| Peripheral vascular disease | 84 (4.8) | 331 (3.9) | 0.0737 |
| Hypertension | 745 (42.3) | 3741 (43.5) | 0.3411 |
| Other neurological disease | 101 (5.7) | 696 (8.1) | 0.0007 |
| Chronic pulmonary disease | 317 (18.0) | 1442 (16.8) | 0.2149 |
| Diabetes | 303 (17.2) | 1333 (15.5) | 0.0762 |
| Renal failure | 339 (19.2) | 1286 (15.0) | <0.0001 |
| Liver disease | 188 (10.7) | 774 (9.0) | 0.0281 |
| Metastatic cancer | 160 (9.1) | 530 (6.2) | <0.0001 |
| Solid tumor w/o metastases | 100 (5.7) | 277 (3.2) | <0.0001 |
| Rheumatoid arthritis/collagen vas | 81 (4.6) | 303 (3.5) | 0.0299 |
| Weight loss | 153 (8.7) | 584 (6.8) | 0.0449 |
| Deficiency anemia | 522 (29.6) | 1979 (23.0) | <0.0001 |
| Alcohol abuse | 101 (5.7) | 428 (5.0) | 0.1905 |
| Drug abuse | 148 (8.4) | 619 (7.2) | 0.0798 |
| Depression | 244 (13.9) | 963 (11.2) | 0.0016 |
| APR risk of mortality | |||
| 1 | 451 (25.6) | 3101 (36.1) | <0.0001 |
| 2 | 619 (35.1) | 2797 (32.5) | |
| 3 | 536 (30.4) | 1907 (22.2) | |
| 4 | 156 (8.9) | 792 (9.2) | |
Frequency of Readmission
The 30‐day readmission rate was 17.0% (1762 patients), with 49.7% (875 patients) of the readmissions occurring within 10 days of discharge. Of patients readmitted, the general medicine service was the readmitting team in 78.2%. A quarter of readmissions (26.2%) had the same primary diagnosis on initial and repeat admission.
Factors Associated With Readmission
Factors associated with readmission were categorized as sociodemographic, operational, and clinical. Factors associated with readmission with P < 0.05 and present in at least 5% of admissions are presented in Table 2. Of the sociodemographic factors, black race was significantly associated with readmission. Within the Medicare cohort, risk for readmission was similar for white vs. nonwhite race, with relative risk of 1.0 (95% confidence interval [CI], 0.86‐1.18). Medicaid as payer status was significantly associated in the unadjusted model, and in the adjusted model showed a trend toward readmission. Mean age was significantly different in the readmitted and nonreadmitted groups, but the difference was small (1.0 year). Moreover, when we evaluated age in 5‐year categories (ex. 65‐70, 71‐75, etc.), age was not associated with readmission. In the adjusted model, none of the operational factors were significantly associated with readmission, including discharge to SNF, weekend discharge, or admit source.
| Covariate | Unadjusted OR (95% CI) | Adjusted OR (95% CI) |
|---|---|---|
| ||
| Age | 1.00 (0.991.00) | 1.00 (0.991.00) |
| Race | ||
| White | Referent | Referent |
| Black | 1.67 (1.471.91) | 1.43 (1.241.65) |
| Asian | 0.99 (0.861.14) | 0.95 (0.821.11) |
| Other | 0.89 (0.761.06) | 0.84 (0.671.06) |
| Payer | ||
| Medicare | Referent | Referent |
| Medicaid/medical | 1.37 (1.211.55) | 1.15 (0.971.36) |
| Private | 0.83 (0.730.95) | 0.78 (0.650.95) |
| Other | 0.21 (0.140.30) | 0.23 (0.110.45) |
| Disposition | ||
| To home | Referent | Referent |
| SNF | 1.02 (0.851.21) | 0.98 (0.821.18) |
| Other | 0.58 (0.480.70) | 0.53 (0.430.66) |
| Highrisk medications | ||
| Corticosteroids | 1.31 (1.161.48) | 1.24 (1.091.42) |
| Narcotics | 1.49 (1.341.65) | 1.33 (1.161.53) |
| Anticholinergics | 0.64 (0.470.87) | 0.66 (0.480.90) |
| Comorbidities | ||
| Congestive heart failure | 1.39 (1.191.63) | 1.30 (1.091.56) |
| Neurological disorders | 0.69 (0.560.86) | 0.70 (0.570.87) |
| Renal failure | 1.35 (1.191.55) | 1.19 (1.051.36) |
| Metastatic cancer | 1.52 (1.261.83) | 1.61 (1.331.95) |
| Solid tumor w/o metastasis | 1.81 (1.432.29) | 1.95 (1.542.47) |
| Deficiency anemia | 1.41 (1.261.58) | 1.27 (1.131.44) |
| Weight loss | 1.30 (1.081.57) | 1.26 (1.091.47) |
Of the clinical factors, high‐risk medications and 6 comorbidities were associated with readmission. High‐risk medication categories associated with readmission were steroids and narcotics; anticholinergics medications were protective. The 6 comorbidities associated with readmission were congestive heart failure, renal disease, cancer (with and without metastasis), weight loss, and iron deficiency anemia. While APR risk of mortality was associated with readmission at P < 0.05, including APR in our final model did not alter which other factors were significantly associated with readmission. When site (Moffitt‐Long vs. Mount Zion Hospitals) was added to the model, the ORs for factors associated with readmission did not change appreciably (0.01).
Discussion
In this retrospective observational study of hospitalized patients, we found that readmission was common and associated with a number of risk factors that could be easily identified early in hospitalization. Nonclinical factors associated with readmission were black race and Medicaid payer status (in the unadjusted model). Clinical factors were high risk medications including steroids and narcotics; and comorbidities including congestive heart failure, renal disease, cancer, anemia, and weight loss. In contrast, other potential riskssuch as discharge on a weekend and discharge to an SNFwere not independently associated with readmission. This cohortwith a mix of clinical scenarios, payers, age, etc.represents the inherently heterogeneous population of inpatient general medicine across the country and abroad. Hospitalists provided care for over 65% of the general medicine service, again representative of the trend in US inpatient medicine.27, 28 Lastly, our cohort did not have the benefit of a systematic and consistent discharge process with interventions focused on reducing readmissions. This gap, which is common across hospitals, highlights the utility of this data in targeting quality improvement efforts.
Reducing risks for readmission requires identification of patient populations at highest risk; in those patients, one can further identify factors which are potentially modifiable via education or patient‐engagement interventions. While in the hospital, more intensive predischarge counseling and efforts to increase mobility may be most useful if targeted early and often on those at highest risk.15, 16, 29, 30 Finally, broader‐based support in the form of better home services, more access to longitudinal care, or targeted postdischarge efforts may be required.14, 31
Though current strategies focus largely on clinical risk factors, this study shows that nonclinical factors play an equally important but underappreciated role in contributing to readmission. While prior studies have shown variable results on association of black race with readmission,2, 9, 11 none have evaluated or linked Medicaid to readmission, which just missed statistical significance in this study (OR, 1.15; 95% CI, 0.971.36). Both black race and Medicaid as payer are proxies for the underlying root cause aspects leading to readmission, such as access to longitudinal care. Following this trail to the root cause will require in‐depth qualitative evaluation that includes the patient perspective as a source of data.32 For example, risk for readmission may not stem solely from being on warfarin, but in combination with not having transportation to get an international normalized ratio (INR) checked, a suboptimal understanding of how to take the medication, or not recognizing potential side effects until too late to avoid inpatient admission.
Several of the strongest associations, and perhaps most conducive to targeted interventions, were high‐risk medications at discharge. Risk related to medications and adverse drug events following discharge have been a consistent theme in readmission literature.24, 33 Our current system, which includes mandated inpatient medicine reconciliation, does not encourage discontinuation of unnecessary medications to combat polypharmacy, address affordability of medications, provide consistent medication counseling, or focus on the highest risk medications. In fact, bundled interventions which implement pharmacists to focus on these measures have been successful in decreasing readmission,14, 16, 29 but unfortunately are not yet part of the standard of care. The challenge remains transforming a mandatory policy such as medicine reconciliation into a valuable and systematic tool in the discharge process.
Two factors were surprisingly protective against readmission: neurologic diagnosis and anticholinergic medications. This first may be explained by the presence of a separate neurology service at our institution which skews our data. For example, a patient with acute stroke, who has a 20% rate of bounce‐back to a higher level of care within 30 days of discharge,34 would be admitted to the neurology service, not general medicine, and therefore would not nr part of our cohort. Regarding anticholinergics, several factors may explain this unexpected result. First, use of anticholinergics was relatively rare in our sample (2.7% in readmitted patients, 4.1% in patients not readmitted), possibly creating a false positive result. Second, Hanlon et al.24 showed only a weak association at best between anticholinergics and postdischarge adverse drug reactions (hazard ratio, 1.11; 95% CI, 0.86‐1.43). Lastly, anticholinergics include a varied group of medications, therefore diluting possible relative risk of specific medications.
While this study allows providers to identify patients at increased risk of readmission, the identified factors do not fully account for readmission risk; we did not aim to produce a risk‐prediction rule with our study. Prior readmission studies have been unable to create a tool to predict which patients will be readmitted with much success.3537 These results underscore the complexities and variability of readmission, which often lack a clear single cause and effect relationship. Given the breadth of risk factors we identified, it seems likely that more intensive interventions will require a multidisciplinary approach, one which might be costly if applied broadly. Our study does not attempt to predict who will be readmitted and who will not, but rather provides a list of risk factors which might be used to deploy resources more efficiently.
This study had several limitations. We did not capture readmissions to outside hospitals, which account for 22% to 24% of all readmissions in prior studies, and therefore have underestimated the readmission rate in our population.2, 8 However, by limiting our data to 2 hospitals within 1 institution, we were able to include more detailed patient level data, which is not accurately available in other large databases. Also, while studies of risk factors in a managed care population (such as within Medicare, the Veterans Affairs medical centers, or countries with national integrated medical records) are able to capture all readmissions, this study is the first to evaluate readmissions risk factors in a truly heterogeneous U.S. inpatient medicine population without limitation by age or payer status. Second, we did not have access to outpatient medications lists; however use of these same medications within the last 48 hours of admission is likely a reasonable proxy for outpatient use and more conducive to potential interventions (such as medication reconciliation or patient education) that could flag patients prior to discharge. Payer data was limited to only the primary payer, so patients who were dual eligible (ie, have both Medicare and Medicaid) were categorized as Medicare. Regarding sociodemographic factors, while primary language other than English was not associated with readmission, language data was missing in 17.4% of admissions, thereby limiting our ability to evaluate this factor. Our data did not include access to outpatient or primary care, and therefore we were unable to evaluate access to postdischarge follow‐up care as a risk factor for readmission. Lastly, while this study did not include outpatient deaths, we did exclude patients who died in the hospital.
Conclusions
Readmission is common among general medicine patients, with approximately 1 in 5 patients being readmitted within 30 days. While the identified associated factors do not account for all the potential reasons for readmission, our study suggests a spectrum of risk factors which might be used to target more intensive multidisciplinary interventions. Specifically, the nonclinical factors of race and payer status merit further in depth research incorporating the patient experience to truly determine causation of readmission. Hospitalists, who are at nexus of the discharge process and uniquely invested in quality inpatient care, are ideally positioned to lead efforts to reduce readmissions. How to use our study's results to develop and implement effective interventions to reduce readmissions remains a subject for future studies.
- A path to bundled payment around a rehospitalization.: Medicare payment Advisory Commission; June2005.
- ,,.Rehospitalizations among patients in the Medicare fee‐for‐service program.N Engl J Med.2009;360(14):1418–1428.
- University HealthSystem Consortium. Available at: https://www.uhc.edu. Accessed May2010.
- U.S. Department of Health 15(5):599–606.
- ,,,.Development and validation of a model for predicting emergency admissions over the next year (PEONY): a UK historical cohort study.Arch Intern Med.2008;168(13):1416–1422.
- ,,, et al.Incidence and main factors associated with early unplanned hospital readmission among French medical inpatients aged 75 and over admitted through emergency units.Age Ageing.2008;37(4):416–422.
- ,,,,,.Factors associated with unplanned hospital readmission among patients 65 years of age and older in a Medicare managed care plan.Am J Med.1999;107(1):13–17.
- ,,.Risk factors for early unplanned hospital readmission in the elderly.J Gen Intern Med.1991;6(3):223–228.
- ,,, et al.Predicting non‐elective hospital readmissions: a multi‐site study. Department of Veterans Affairs Cooperative Study Group on Primary Care and Readmissions.J Clin Epidemiol.2000;53(11):1113–1118.
- ,.Effect of gender, ethnicity, pulmonary disease, and symptom stability on rehospitalization in patients with heart failure.Am J Cardiol.2007;100(7):1139–1144.
- ,,,.The care transitions intervention: results of a randomized controlled trial.Arch Intern Med.2006;166(17):1822–1828.
- ,,,.The impact of follow‐up telephone calls to patients after hospitalization.Am J Med.2001;111(9B):26S–30S.
- ,,, et al.A reengineered hospital discharge program to decrease rehospitalization: a randomized trial.Ann Intern Med.2009;150(3):178–187.
- ,,, et al.Reduction of 30‐day postdischarge hospital readmission or emergency department (ED) visit rates in high‐risk elderly medical patients through delivery of a targeted care bundle.J Hosp Med.2009;4(4):211–218.
- ,,,,,.Comprehensive discharge planning with postdischarge support for older patients with congestive heart failure: a meta‐analysis.JAMA.2004;291(11):1358–1367.
- ,.Home‐based intervention in congestive heart failure: long‐term implications on readmission and survival.Circulation.2002;105(24):2861–2866.
- ,,,,,.Effect of a standardized nurse case‐management telephone intervention on resource use in patients with chronic heart failure.Arch Intern Med.2002;162(6):705–712.
- ,,,.The impact of follow‐up physician visits on emergency readmissions for patients with asthma and chronic obstructive pulmonary disease: a population‐based study.Am J Med.2002;112(2):120–125.
- ,.Factors predicting readmission of older general medicine patients.J Gen Intern Med.1991;6(5):389–393.
- BOOSTing Care Transitions. Available at: http://www.hospitalmedicine.org/ResourceRoomRedesign/RR_CareTransitions/CT_Home.cfm. Accessed May2010.
- ,,,,.Adverse drug events occurring following hospital discharge.J Gen Intern Med.2005;20(4):317–323.
- ,,, et al.Incidence and predictors of all and preventable adverse drug reactions in frail elderly persons after hospital stay.J Gerontol A Biol Sci Med Sci.2006;61(5):511–515.
- . Development of the 3M™ All Patient Refined Diagnosis Related Groups (APR DRGs). Available at: http://www.ahrq.gov/qual/mortality/Hughes.htm. Accessed May2010.
- ,,.Volume thresholds and hospital characteristics in the United States.Health Aff (Millwood).2003;22(2):167–177.
- ,,,.The status of hospital medicine groups in the United States.J Hosp Med.2006;1(2):75–80.
- ,,,.Growth in the care of older patients by hospitalists in the United States.N Engl J Med.2009;360(11):1102–1112.
- ,,, et al.Role of pharmacist counseling in preventing adverse drug events after hospitalization.Arch Intern Med.2006;166(5):565–571.
- ,,, et al.Effects of a multicomponent intervention on functional outcomes and process of care in hospitalized older patients: a randomized controlled trial of Acute Care for Elders (ACE) in a community hospital.J Am Geriatr Soc.2000;48(12):1572–1581.
- ,,,,,.Telehome monitoring in patients with cardiac disease who are at high risk of readmission.Heart Lung.2008;37(1):36–45.
- ,,.Understanding rehospitalization risk: can hospital discharge be modified to reduce recurrent hospitalization?J Hosp Med.2007;2(5):297–304.
- ,,,,.The incidence and severity of adverse events affecting patients after discharge from the hospital.Ann Intern Med.2003;138(3):161–167.
- ,,,.Bouncing back: patterns and predictors of complicated transitions 30 days after hospitalization for acute ischemic stroke.J Am Geriatr Soc.2007;55(3):365–373.
- ,,,.Case finding for patients at risk of readmission to hospital: development of algorithm to identify high risk patients.BMJ.2006;333(7563):327.
- ,,,,,.Screening elders for risk of hospital admission.J Am Geriatr Soc.1993;41(8):811–817.
- ,,,.Using routine inpatient data to identify patients at risk of hospital readmission.BMC Health Serv Res.2009;9:96.
- A path to bundled payment around a rehospitalization.: Medicare payment Advisory Commission; June2005.
- ,,.Rehospitalizations among patients in the Medicare fee‐for‐service program.N Engl J Med.2009;360(14):1418–1428.
- University HealthSystem Consortium. Available at: https://www.uhc.edu. Accessed May2010.
- U.S. Department of Health 15(5):599–606.
- ,,,.Development and validation of a model for predicting emergency admissions over the next year (PEONY): a UK historical cohort study.Arch Intern Med.2008;168(13):1416–1422.
- ,,, et al.Incidence and main factors associated with early unplanned hospital readmission among French medical inpatients aged 75 and over admitted through emergency units.Age Ageing.2008;37(4):416–422.
- ,,,,,.Factors associated with unplanned hospital readmission among patients 65 years of age and older in a Medicare managed care plan.Am J Med.1999;107(1):13–17.
- ,,.Risk factors for early unplanned hospital readmission in the elderly.J Gen Intern Med.1991;6(3):223–228.
- ,,, et al.Predicting non‐elective hospital readmissions: a multi‐site study. Department of Veterans Affairs Cooperative Study Group on Primary Care and Readmissions.J Clin Epidemiol.2000;53(11):1113–1118.
- ,.Effect of gender, ethnicity, pulmonary disease, and symptom stability on rehospitalization in patients with heart failure.Am J Cardiol.2007;100(7):1139–1144.
- ,,,.The care transitions intervention: results of a randomized controlled trial.Arch Intern Med.2006;166(17):1822–1828.
- ,,,.The impact of follow‐up telephone calls to patients after hospitalization.Am J Med.2001;111(9B):26S–30S.
- ,,, et al.A reengineered hospital discharge program to decrease rehospitalization: a randomized trial.Ann Intern Med.2009;150(3):178–187.
- ,,, et al.Reduction of 30‐day postdischarge hospital readmission or emergency department (ED) visit rates in high‐risk elderly medical patients through delivery of a targeted care bundle.J Hosp Med.2009;4(4):211–218.
- ,,,,,.Comprehensive discharge planning with postdischarge support for older patients with congestive heart failure: a meta‐analysis.JAMA.2004;291(11):1358–1367.
- ,.Home‐based intervention in congestive heart failure: long‐term implications on readmission and survival.Circulation.2002;105(24):2861–2866.
- ,,,,,.Effect of a standardized nurse case‐management telephone intervention on resource use in patients with chronic heart failure.Arch Intern Med.2002;162(6):705–712.
- ,,,.The impact of follow‐up physician visits on emergency readmissions for patients with asthma and chronic obstructive pulmonary disease: a population‐based study.Am J Med.2002;112(2):120–125.
- ,.Factors predicting readmission of older general medicine patients.J Gen Intern Med.1991;6(5):389–393.
- BOOSTing Care Transitions. Available at: http://www.hospitalmedicine.org/ResourceRoomRedesign/RR_CareTransitions/CT_Home.cfm. Accessed May2010.
- ,,,,.Adverse drug events occurring following hospital discharge.J Gen Intern Med.2005;20(4):317–323.
- ,,, et al.Incidence and predictors of all and preventable adverse drug reactions in frail elderly persons after hospital stay.J Gerontol A Biol Sci Med Sci.2006;61(5):511–515.
- . Development of the 3M™ All Patient Refined Diagnosis Related Groups (APR DRGs). Available at: http://www.ahrq.gov/qual/mortality/Hughes.htm. Accessed May2010.
- ,,.Volume thresholds and hospital characteristics in the United States.Health Aff (Millwood).2003;22(2):167–177.
- ,,,.The status of hospital medicine groups in the United States.J Hosp Med.2006;1(2):75–80.
- ,,,.Growth in the care of older patients by hospitalists in the United States.N Engl J Med.2009;360(11):1102–1112.
- ,,, et al.Role of pharmacist counseling in preventing adverse drug events after hospitalization.Arch Intern Med.2006;166(5):565–571.
- ,,, et al.Effects of a multicomponent intervention on functional outcomes and process of care in hospitalized older patients: a randomized controlled trial of Acute Care for Elders (ACE) in a community hospital.J Am Geriatr Soc.2000;48(12):1572–1581.
- ,,,,,.Telehome monitoring in patients with cardiac disease who are at high risk of readmission.Heart Lung.2008;37(1):36–45.
- ,,.Understanding rehospitalization risk: can hospital discharge be modified to reduce recurrent hospitalization?J Hosp Med.2007;2(5):297–304.
- ,,,,.The incidence and severity of adverse events affecting patients after discharge from the hospital.Ann Intern Med.2003;138(3):161–167.
- ,,,.Bouncing back: patterns and predictors of complicated transitions 30 days after hospitalization for acute ischemic stroke.J Am Geriatr Soc.2007;55(3):365–373.
- ,,,.Case finding for patients at risk of readmission to hospital: development of algorithm to identify high risk patients.BMJ.2006;333(7563):327.
- ,,,,,.Screening elders for risk of hospital admission.J Am Geriatr Soc.1993;41(8):811–817.
- ,,,.Using routine inpatient data to identify patients at risk of hospital readmission.BMC Health Serv Res.2009;9:96.
Copyright © 2010 Society of Hospital Medicine
Unforgettable
The approach to clinical conundrums by an expert clinician is revealed through presentation of an actual patient's case in an approach typical of morning report. Similar to patient care, sequential pieces of information are provided to the clinician who is unfamiliar with the case. The focus is on the thought processes of both the clinical team caring the patient and the discussant.
A 27‐year‐old woman with a history of asthma presented to her primary care physician (PCP) with a sore throat which began after attending a party where she shared alcoholic beverages with friends. She denied any high‐risk sexual behavior. Her PCP prescribed azithromycin and methylprednisolone empirically for tonsillitis. The throat pain subsided, but in the next several days she experienced increased weakness, lethargy, poor appetite, and chills, and she returned to her PCP for reevaluation.
Two months prior she had been treated at a walk‐in clinic with a course of penicillin for a presumed streptococcal pharyngitis. Her symptoms resolved until her current presentation.
In a young woman with 2 episodes of pharyngitis in 2 months followed by an acute systemic illness, one must consider an immunocompromised state such as human immunodeficiency virus (HIV), hematologic malignancy, or autoimmune diseases. Weakness, lethargy, anorexia, and chills in the setting of pharyngitis suggest a local process in the neck, most likely infection associated with systemic toxicity. As neck abscess and bacteremia warrant early consideration, the physical examination should focus on the neck and oropharynx, as well as neurologic exam to evaluate for bacterial spreading into the central nervous system. In addition to routine laboratory studies, a chest x‐ray (CXR) would be appropriate as upper respiratory infections may be complicated by pneumonia and present with signs and symptoms of systemic illness.
On examination by her PCP, her temperature was 99.2F and her blood pressure was 118/68. She had bilateral oropharyngeal erythema without exudates and bilateral tonsillar and anterior triangle lymphadenopathy (LAD). An oropharyngeal rapid Streptococcal antigen detection test was negative, but a Monospot test was positive for heterophile antibodies. Azithromycin and methylprednisolone were discontinued, and the patient was informed she most likely had Epstein Barr Virus (EBV) infection.
The following day, the complete blood count results returned. The platelet count was 50 K/L and the white blood cell (WBC) count was 13.0 K/L. The patient stated she had developed right‐sided flank pain upon deep inspiration and used her albuterol inhaler with minimal relief. She continued to have fever, decreased appetite, chest and abdominal pain, and difficulty swallowing due to odynophagia. She was instructed to go to the emergency department (ED) for further evaluation. In the ED, she denied any shortness of breath, but reported a slight cough and right‐sided abdominal pain.
Acute tonsillar pharyngitis and fever, as well as systemic symptoms of fatigue and abdominal pain along with positive heterophile screen are highly suggestive of EBV infection in this young female. The episode of pharyngitis 2 months prior remains unexplained and may be unrelated. Right‐sided pleuritic pain and abdominal pain may be related to EBV hepatitis. Odynophagia is consistent with EBV infection as well. Profound lethargy, however, is not a common presenting feature in mononucleosis unless infected patients are profoundly dehydrated due to inability to swallow. Her pain symptoms may be secondary to other signs of EBV infection, such as hepatomegaly, splenomegaly, ascites, and/or right pleural effusion. A history of rash should be investigated. Initial assessment in this acutely ill patient should focus on evaluation for the presence of severe sepsis and for a primary source of infection. Given the severity of her illness, I would consider early computed tomography (CT) of her chest, abdomen, and pelvis, as well as CT of the neck to exclude a possibility of peritonsillar abscess. The complaint of chills indicates a possible bacteremia, so coverage with broad‐spectrum antibiotics is indicated. Symptomatic relief with acetaminophen and intravenous fluid rehydration is appropriate.
On exam, temperature was 101.9F, blood pressure was 111/74, heart rate was 140 beats per minute, respiratory rate was 18 per minute, and oxygen saturation was 99% on room air. She appeared drowsy, but answered questions appropriately. She had bilateral swollen tonsils, as well as anterior and posterior cervical adenopathy, with tenderness greater on the left side. Her chest exam had slightly diminished breath sounds at the bases bilaterally. Heart rhythm was regular, and there were no murmurs appreciated. On abdominal exam, she was tender to palpation in both right‐upper and left‐upper quadrants, without obvious hepatosplenomegaly. There were no petechiae noted on her skin.
The WBC was 17.6 K/L, with 89% neutrophils and 5% lymphocytes, platelet count was 22 K/L, and hemoglobin was 13.8 g/dL. A D‐dimer test was elevated at 1344 ng/mL. Peripheral blood smear showed thrombocytopenia and neutrophilia, but demonstrated no schistocytes. The serum potassium was 3.2 mEq/L, bicarbonate was 29 mEq/L, blood urea nitrogen was 15 mg/dL and the creatinine was 1.29 mg/dL. Transaminases were within normal limits, but total bilirubin was 1.8 mg/dL. Her urinalysis was normal. Blood cultures were sent. A CXR showed bibasilar consolidations and pleural effusions (Figure 1). A CT of the chest with contrast was obtained that showed multiple confluent and patchy foci of consolidation in the lung bases, with trace bilateral pleural effusions (Figure 2). A CT of the abdomen showed a spleen at the upper limits of normal in size, measuring 13 cm in length, but was otherwise normal.
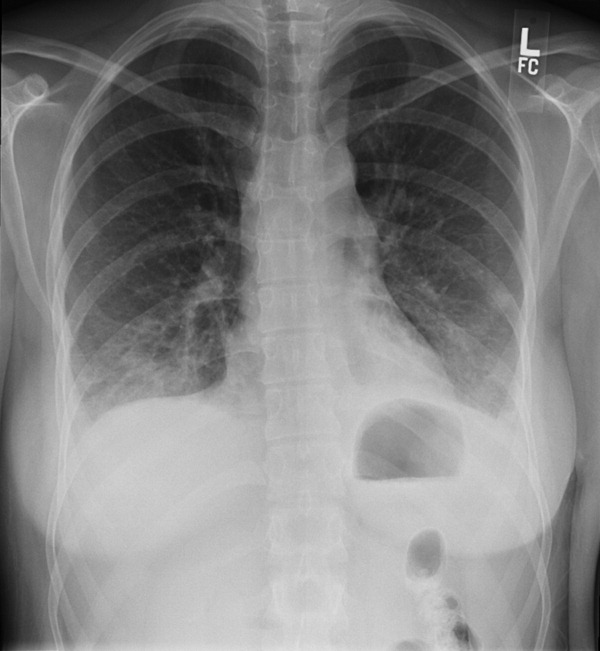
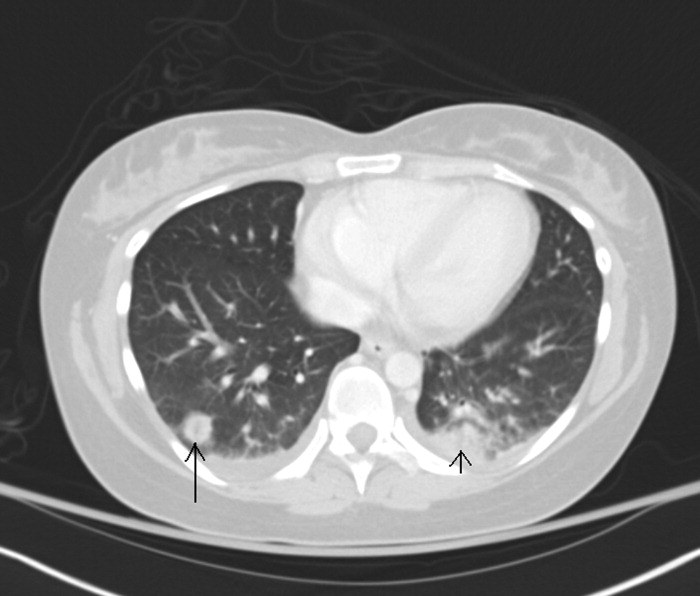
Leukocytosis with lymphopenia is not consistent with EBV infection and another process needs to be considered. This patient meets criteria for sepsis syndrome and should receive broad spectrum antibiotics, such as vancomycin and piperacillin‐tazobactam immediately after the blood cultures are sent, in addition to further evaluation to determine the source of sepsis. Depending on her mental status response to initial measures such as acetaminophen and hydration, one should consider a lumbar puncture, which would require platelet transfusion and may therefore not be done immediately. HIV serology should be performed, since acute retroviral syndrome can mimic this presentation. With neck tenderness that is more localized to her left side, a CT of her neck to evaluate for an abscess may be helpful.
She was admitted for presumed community‐acquired pneumonia complicating an upper respiratory tract infection. Her pharyngitis was thought to be of viral etiology. Moxifloxacin was started and intravenous fluids were administered. She was started on prednisone 60 mg daily for presumed immune‐mediated thrombocytopenia related to EBV infection. An HIV antibody test and quantitative polymerase chain reaction (PCR) were both negative. The EBV immunoglobulin G (IgG) titer was positive (>1:10), but the IgM titer was negative. Her mental status improved after starting moxifloxacin and fluids. Her creatinine and bilirubin normalized to 0.97 mg/dL and 0.8 mg/dL respectively. She continued to have a tender left‐sided submandibular swelling. Blood cultures grew Gram‐negative bacilli in 2 anaerobic bottles.
I am uncomfortable with moxifloxacin as initial empiric therapy because at presentation she had sepsis syndrome as well as a suspected immunocompromised state. In addition, moxifloxacin would not be adequate coverage for anaerobic organisms if a peritonsillar abscess was involved. At this point, she needs a CT of her neck to look for a focus of infection which may require surgical management and, if negative, further imaging such as a tagged white blood scan to identify the source of the anaerobes.
Moxifloxacin was switched to piperacillin‐tazobactam and prednisone was discontinued. By day 4 of hospitalization her platelet count had risen to 261 K/L. Her WBC continued to rise to a peak of 21.5 K/L and she continued to have fevers and diffuse pains, although her repeat blood cultures were negative. She continued to have tenderness of the cervical lymph nodes, left greater than right. A repeat CXR showed patchy air space disease bilaterally and pleural effusions, both of which had progressed compared with the prior film. Clindamycin was empirically added to her antibiotic regimen in light of her progressing pneumonia and evidence of anaerobic infection. A repeat CT scan of her chest revealed multiple nodular opacities scattered throughout the lung fields, some of which were cavitary, predominating in the lung bases. The CT scan of her neck revealed a left peritonsillar abscess and phlegmon in the left retropharyngeal and deep neck area along the sternocleidomastoid and internal jugular vein (IJV). There also was noted a large thrombus within the left IJV extending superiorly to involve the jugular bulb, sigmoid sinus, and distal left transverse sinus; and inferiorly to near the origin of the brachiocephalic vein (see Figure 3). An echocardiogram did not reveal any vegetations.

The combination of recent pharyngitis, septic pulmonary emboli, and IJV thrombosis is consistent with a diagnosis of Lemierre's syndrome (LS). This is a life threatening condition, even if diagnosis is made early and appropriate treatment is started. The most likely causative agent is Fusobacterium necrophorum. In this case it was important to realize that clinical presentation was not consistent with EBV infection, even though heterophile screen was positive. Early initiation of broad spectrum antibiotics as well as CT scan of the neck would have been appropriate.
The diagnosis of LS was made. The blood culture speciation revealed Fusobacterium nucleatum, which was too fastidious to perform antimicrobial sensitivities. Her symptoms improved significantly with the addition of clindamycin to piperacillin‐tazobactam, which was postulated to be the result of bacterial beta‐lactamase activity mitigating the efficacy of piperacillin‐tazobactam. Thoracentesis of her pleural effusion did not reveal an empyema. Due to her large thrombus burden, she was started on anticoagulation with heparin and transitioned to outpatient coumadin. She was switched to metronidazole as a single agent antibiotic for 6 weeks, and on outpatient follow‐up was doing well.
Commentary
LS was described by Dr. Andre Lemierre in 1936.6 The syndrome consists of a primary oropharyngeal infection, thrombosis of the IJV, bacteremia, and septic metastatic foci, usually involving the lungs.1, 2 LS is a form of necrobacillosis, which is a systemic infection resulting from F. necrophorum.3, 4 In classic LS, the initial pharyngitis is usually a tonsillar or peritonsillar abscess, and is followed by intense fever and rigors after 4 days to 2 weeks.1, 3 This is followed by a unilateral painful submaxillary LAD and IJV thrombophlebitisthe cord sign.2 Finally, bacteremia and distant metastatic pyogenic abscesses develop.1 (see Table 1).
| Lemierre's Syndrome typical features |
| Antecedent head and neck infection, typically an oropharyngeal infection prior to deterioration |
| Thrombophlebitis, typically of internal jugular vein (present in only 1/3 of cases) |
| Bacteremia (Fusobacterium necrophorum most commonly) |
| Septic metastatic foci, typically to lungs |
| Usual Presentation |
| Pharyngitis |
| Fevers |
| Rigors |
| Neck involvement: tenderness, swelling, tender internal jugular vein thrombus (cord sign) |
| Pulmonary infiltrates which cavitate |
With the advent of antibiotics, LS is now rare with an incidence of 0.9 per million persons per year. In Lemierre's time, the disease was fulminant and led to death within 2 weeks, but in the antibiotic age the mortality rate is 4.9%.1, 3 The median age of an LS patient is 19 years, with a higher incidence in males.1, 35 Although in the literature it is referred to as the forgotten disease, there is evidence the incidence is increasing.3, 4, 6, 8
There are variations of classic LS. Bacteremia may occur much later than the initial pharyngitis, the disease may be less aggressive, the thrombus may be in the external jugular vein, or there may be no identified thrombus.3, 4, 8 In fact, a thrombus is only identified in 36% of cases.9 The primary infection may be a head and neck infection that is not pharyngitis, such as an odontogenic infection,4 or may not be identified.10 Despite variations, the fundamentals of diagnosis are prior head and neck infection, presumed thrombophlebitis and bacteremia, and evidence of septic metastatic foci.
The genus Fusobacterium comprises anaerobic, nonspore forming gram negative bacilli.1, 35, 11 F. necrophorum and F. nucleatum are 2 species within this genus. F. nucleatum causes the majority of reported human bacteremias by Fusobacterium species, but it is F. necrophorum that is most associated with anaerobic oropharyngeal infections, thrombocytopenia, clot formation, and LS.35, 8, 9
It is unknown if Fusobacterium species directly cause the sore throat, or rather are bystanders which thrive once a favorable anaerobic environment is created via endotoxins and exotoxins.35 A break in oral mucosa via trauma or coinfection with bacteria/viruses (especially EBV) is also thought to play a role with infection.2, 3, 5 One‐third of LS cases have coinfection with other oropharyngeal flora. Thus, one must reexamine the anaerobic blood cultures after an organism has been identified in suspect cases.3, 4
There is an increased association of LS with EBV infection, likely due to viral‐induced and steroid‐induced immunosuppression.24 False positive heterophile tests are reported with LS, so the specific antibody tests for EBV must be checked.3, 4
Once thrombophlebitis occurs, the bacteria can metastasize to distant sites. In 80% to 92% of LS cases, the metastatic complication is a pleuro‐pulmonary infection, consisting of septic pulmonary emboli, empyema, and pleural effusions, but extra‐pulmonary lesions occur.1, 3, 9, 12 Abdominal pain usually results from abdominal microabscesses or thrombophlebitis.4 Mild renal impairment and abnormal liver function tests are common.3, 4 Cranial nerve palsies and Horner's syndrome are rare and indicate carotid sheath involvement.3, 12 An elevated C‐reactive protein can distinguish bacterial from uncomplicated viral pharyngitis.3, 4 Also, rigors are unusual in tonsillitis, and their presence indicate bacterial entry into the circulation.3
CXRs may reveal the pulmonary septic emboli. Ultrasound of the IJV is inexpensive and noninvasive, but may have limited sensitivity for an acute thrombus. CT scan allows increased visualization of anatomy, but can have decreased sensitivity and specificity for thrombosis.3 Magnetic resonance imaging (MRI) is recommended if LS results from mastoiditis, to exclude an intracerebral vein thrombosis.9
Antibiotics have both dramatically decreased the incidence of LS and improved its prognosis. The recent rise in incidence may be due to a renewed interest in restricting the use of antibiotics in cases of pharyngitis, as well as an increased use of macrolides, to which F. necrophorum is frequently resistant.3 Decreased tonsillectomies may also have a role, as LS is more common with retained tonsils.1, 3
No trials have evaluated the optimal antibiotic regimen. Fusobacterium species are sensitive to penicillin, but 23% have beta‐lactamase activity as reported clinically by several authors.3, 5 F. necrophorum is also sensitive to metronidazole, ticarcillin‐clavulanate, cefoxitin, amoxicillin‐clavulanate, imipenem, and clindamycin. There is a high resistance to macrolides and gentamicin, and the activity of tetracyclines is poor. For treatment, most authors suggest a carbapenem, a penicillin/beta‐lactamase inhibitor combination, or metronidazole. Clindamycin has weaker bactericidal activity than metronidazole or imipenem. Metronidazole is preferred because of its activity against all Fusobacterium species, good penetration into tissues, bactericidal activity, low minimum inhibitory concentration, and ability to achieve high concentration in the cerebrospinal fluid if meningitis occurs. An effective regimen is metronidazole with a penicillinase‐resistant penicillin to cover for mixed coinfection with streptococci or staphylococci.3, 4, 12 A 6‐week antibiotic course is given for adequate penetration into the protective fibrin clots.4
Reports have shown good outcomes both with and without the use of anticoagulation.3, 4, 8 Support for anticoagulation is extrapolated from experience with septic pelvic thrombophlebitis, in which anticoagulation results in more rapid resolution of symptoms.13 Given the lack of firm evidence in cases of LS, anticoagulation is typically reserved for poor clinical response despite 2 to 3 days of antibiotic therapy or propagation of thromboses into the cavernous sinus. It is generally given for 3 months.4, 13
Prior to the antibiotic era, surgical ligation or excision of the IJV was done without clear benefit. Today, surgery is reserved for cases of continued septic emboli or extension of thrombus despite aggressive medical therapy.3 If mediastinitis develops, then surgical intervention is essential.4
Lemierre stated that the symptoms and signs of LS are so characteristic that it permits diagnosis before bacteriological examination.1 However, today it may go unrecognized by physicians until a blood culture shows anaerobes or Fusobacterium species. For a young patient admitted with pneumonia preceded by pharyngitis, hospitalists must remain vigilant for the presence of LS.
Key Points for Hospitalists/Teaching Points
-
The triad of LS is pharyngitis, thrombophlebitis, and distant metastatic pyogenic emboli.
-
Suspect LS in a young, otherwise healthy patient who clinically deteriorates in the setting of a recent pharyngeal infection.
-
With the modern decrease in antibiotic use for pharyngitis, LS may be on the rise.
- .On certain septicaemias due to anaerobic organisms.Lancet.1936;1:701–703.
- ,.Lemierre's syndrome: more judicious antibiotic prescribing habits may lead to the clinical reappearance of this often forgotten disease.Am J Med.2006;119(3):e7–e9.
- .Human infection with Fusobacterium necrophorum (necrobacillosis), with a focus on Lemierre's syndrome.Clin Microbiol Rev.2007;20(4):622–659.
- ,.Human necrobacillosis, with emphasis on Lemierre's syndrome.Clin Infect Dis.2000;31(2):524–532.
- ,.Fusobacterial infections: clinical spectrum and incidence of invasive disease.J Infect.2008;57(4):283–289.
- .Human infections with Fusobacterium necrophorum.Anaerobe.2006;12(4):165–172.
- ,,, et al.Increased diagnosis of Lemierre Syndrome and other Fusobacterium necrophorum infections at a Children's Hospital.Pediatrics.2003;112(5):e380.
- ,,.Unusual presentation of Lemierre's syndrome due to Fusobacterium nucleatum.J Clin Microbiol.2003;41(7):3445–3448.
- ,,,.The evolution of Lemierre Syndrome: report of 2 cases and review of the literature.Medicine (Baltimore).2002;81(6):458–465.
- ,.An unusual case of Lemierre's syndrome presenting as pyomyositis.Am J Med Sci.2008;335(6):499–501.
- .Update on the taxonomy and clinical aspects of the genus Fusobacterium.Clin Infect Dis.2002;35(Suppl 1):S22–S27.
- ,,,,.Lemierre syndrome: two cases and a review.Laryngosope.2007;117(9):1605–1610.
- ,,.Lemierre's syndrome (necrobacillosis).Postgrad Med J.1999;75(881):141–144.
The approach to clinical conundrums by an expert clinician is revealed through presentation of an actual patient's case in an approach typical of morning report. Similar to patient care, sequential pieces of information are provided to the clinician who is unfamiliar with the case. The focus is on the thought processes of both the clinical team caring the patient and the discussant.
A 27‐year‐old woman with a history of asthma presented to her primary care physician (PCP) with a sore throat which began after attending a party where she shared alcoholic beverages with friends. She denied any high‐risk sexual behavior. Her PCP prescribed azithromycin and methylprednisolone empirically for tonsillitis. The throat pain subsided, but in the next several days she experienced increased weakness, lethargy, poor appetite, and chills, and she returned to her PCP for reevaluation.
Two months prior she had been treated at a walk‐in clinic with a course of penicillin for a presumed streptococcal pharyngitis. Her symptoms resolved until her current presentation.
In a young woman with 2 episodes of pharyngitis in 2 months followed by an acute systemic illness, one must consider an immunocompromised state such as human immunodeficiency virus (HIV), hematologic malignancy, or autoimmune diseases. Weakness, lethargy, anorexia, and chills in the setting of pharyngitis suggest a local process in the neck, most likely infection associated with systemic toxicity. As neck abscess and bacteremia warrant early consideration, the physical examination should focus on the neck and oropharynx, as well as neurologic exam to evaluate for bacterial spreading into the central nervous system. In addition to routine laboratory studies, a chest x‐ray (CXR) would be appropriate as upper respiratory infections may be complicated by pneumonia and present with signs and symptoms of systemic illness.
On examination by her PCP, her temperature was 99.2F and her blood pressure was 118/68. She had bilateral oropharyngeal erythema without exudates and bilateral tonsillar and anterior triangle lymphadenopathy (LAD). An oropharyngeal rapid Streptococcal antigen detection test was negative, but a Monospot test was positive for heterophile antibodies. Azithromycin and methylprednisolone were discontinued, and the patient was informed she most likely had Epstein Barr Virus (EBV) infection.
The following day, the complete blood count results returned. The platelet count was 50 K/L and the white blood cell (WBC) count was 13.0 K/L. The patient stated she had developed right‐sided flank pain upon deep inspiration and used her albuterol inhaler with minimal relief. She continued to have fever, decreased appetite, chest and abdominal pain, and difficulty swallowing due to odynophagia. She was instructed to go to the emergency department (ED) for further evaluation. In the ED, she denied any shortness of breath, but reported a slight cough and right‐sided abdominal pain.
Acute tonsillar pharyngitis and fever, as well as systemic symptoms of fatigue and abdominal pain along with positive heterophile screen are highly suggestive of EBV infection in this young female. The episode of pharyngitis 2 months prior remains unexplained and may be unrelated. Right‐sided pleuritic pain and abdominal pain may be related to EBV hepatitis. Odynophagia is consistent with EBV infection as well. Profound lethargy, however, is not a common presenting feature in mononucleosis unless infected patients are profoundly dehydrated due to inability to swallow. Her pain symptoms may be secondary to other signs of EBV infection, such as hepatomegaly, splenomegaly, ascites, and/or right pleural effusion. A history of rash should be investigated. Initial assessment in this acutely ill patient should focus on evaluation for the presence of severe sepsis and for a primary source of infection. Given the severity of her illness, I would consider early computed tomography (CT) of her chest, abdomen, and pelvis, as well as CT of the neck to exclude a possibility of peritonsillar abscess. The complaint of chills indicates a possible bacteremia, so coverage with broad‐spectrum antibiotics is indicated. Symptomatic relief with acetaminophen and intravenous fluid rehydration is appropriate.
On exam, temperature was 101.9F, blood pressure was 111/74, heart rate was 140 beats per minute, respiratory rate was 18 per minute, and oxygen saturation was 99% on room air. She appeared drowsy, but answered questions appropriately. She had bilateral swollen tonsils, as well as anterior and posterior cervical adenopathy, with tenderness greater on the left side. Her chest exam had slightly diminished breath sounds at the bases bilaterally. Heart rhythm was regular, and there were no murmurs appreciated. On abdominal exam, she was tender to palpation in both right‐upper and left‐upper quadrants, without obvious hepatosplenomegaly. There were no petechiae noted on her skin.
The WBC was 17.6 K/L, with 89% neutrophils and 5% lymphocytes, platelet count was 22 K/L, and hemoglobin was 13.8 g/dL. A D‐dimer test was elevated at 1344 ng/mL. Peripheral blood smear showed thrombocytopenia and neutrophilia, but demonstrated no schistocytes. The serum potassium was 3.2 mEq/L, bicarbonate was 29 mEq/L, blood urea nitrogen was 15 mg/dL and the creatinine was 1.29 mg/dL. Transaminases were within normal limits, but total bilirubin was 1.8 mg/dL. Her urinalysis was normal. Blood cultures were sent. A CXR showed bibasilar consolidations and pleural effusions (Figure 1). A CT of the chest with contrast was obtained that showed multiple confluent and patchy foci of consolidation in the lung bases, with trace bilateral pleural effusions (Figure 2). A CT of the abdomen showed a spleen at the upper limits of normal in size, measuring 13 cm in length, but was otherwise normal.
Leukocytosis with lymphopenia is not consistent with EBV infection and another process needs to be considered. This patient meets criteria for sepsis syndrome and should receive broad spectrum antibiotics, such as vancomycin and piperacillin‐tazobactam immediately after the blood cultures are sent, in addition to further evaluation to determine the source of sepsis. Depending on her mental status response to initial measures such as acetaminophen and hydration, one should consider a lumbar puncture, which would require platelet transfusion and may therefore not be done immediately. HIV serology should be performed, since acute retroviral syndrome can mimic this presentation. With neck tenderness that is more localized to her left side, a CT of her neck to evaluate for an abscess may be helpful.
She was admitted for presumed community‐acquired pneumonia complicating an upper respiratory tract infection. Her pharyngitis was thought to be of viral etiology. Moxifloxacin was started and intravenous fluids were administered. She was started on prednisone 60 mg daily for presumed immune‐mediated thrombocytopenia related to EBV infection. An HIV antibody test and quantitative polymerase chain reaction (PCR) were both negative. The EBV immunoglobulin G (IgG) titer was positive (>1:10), but the IgM titer was negative. Her mental status improved after starting moxifloxacin and fluids. Her creatinine and bilirubin normalized to 0.97 mg/dL and 0.8 mg/dL respectively. She continued to have a tender left‐sided submandibular swelling. Blood cultures grew Gram‐negative bacilli in 2 anaerobic bottles.
I am uncomfortable with moxifloxacin as initial empiric therapy because at presentation she had sepsis syndrome as well as a suspected immunocompromised state. In addition, moxifloxacin would not be adequate coverage for anaerobic organisms if a peritonsillar abscess was involved. At this point, she needs a CT of her neck to look for a focus of infection which may require surgical management and, if negative, further imaging such as a tagged white blood scan to identify the source of the anaerobes.
Moxifloxacin was switched to piperacillin‐tazobactam and prednisone was discontinued. By day 4 of hospitalization her platelet count had risen to 261 K/L. Her WBC continued to rise to a peak of 21.5 K/L and she continued to have fevers and diffuse pains, although her repeat blood cultures were negative. She continued to have tenderness of the cervical lymph nodes, left greater than right. A repeat CXR showed patchy air space disease bilaterally and pleural effusions, both of which had progressed compared with the prior film. Clindamycin was empirically added to her antibiotic regimen in light of her progressing pneumonia and evidence of anaerobic infection. A repeat CT scan of her chest revealed multiple nodular opacities scattered throughout the lung fields, some of which were cavitary, predominating in the lung bases. The CT scan of her neck revealed a left peritonsillar abscess and phlegmon in the left retropharyngeal and deep neck area along the sternocleidomastoid and internal jugular vein (IJV). There also was noted a large thrombus within the left IJV extending superiorly to involve the jugular bulb, sigmoid sinus, and distal left transverse sinus; and inferiorly to near the origin of the brachiocephalic vein (see Figure 3). An echocardiogram did not reveal any vegetations.
The combination of recent pharyngitis, septic pulmonary emboli, and IJV thrombosis is consistent with a diagnosis of Lemierre's syndrome (LS). This is a life threatening condition, even if diagnosis is made early and appropriate treatment is started. The most likely causative agent is Fusobacterium necrophorum. In this case it was important to realize that clinical presentation was not consistent with EBV infection, even though heterophile screen was positive. Early initiation of broad spectrum antibiotics as well as CT scan of the neck would have been appropriate.
The diagnosis of LS was made. The blood culture speciation revealed Fusobacterium nucleatum, which was too fastidious to perform antimicrobial sensitivities. Her symptoms improved significantly with the addition of clindamycin to piperacillin‐tazobactam, which was postulated to be the result of bacterial beta‐lactamase activity mitigating the efficacy of piperacillin‐tazobactam. Thoracentesis of her pleural effusion did not reveal an empyema. Due to her large thrombus burden, she was started on anticoagulation with heparin and transitioned to outpatient coumadin. She was switched to metronidazole as a single agent antibiotic for 6 weeks, and on outpatient follow‐up was doing well.
Commentary
LS was described by Dr. Andre Lemierre in 1936.6 The syndrome consists of a primary oropharyngeal infection, thrombosis of the IJV, bacteremia, and septic metastatic foci, usually involving the lungs.1, 2 LS is a form of necrobacillosis, which is a systemic infection resulting from F. necrophorum.3, 4 In classic LS, the initial pharyngitis is usually a tonsillar or peritonsillar abscess, and is followed by intense fever and rigors after 4 days to 2 weeks.1, 3 This is followed by a unilateral painful submaxillary LAD and IJV thrombophlebitisthe cord sign.2 Finally, bacteremia and distant metastatic pyogenic abscesses develop.1 (see Table 1).
| Lemierre's Syndrome typical features |
| Antecedent head and neck infection, typically an oropharyngeal infection prior to deterioration |
| Thrombophlebitis, typically of internal jugular vein (present in only 1/3 of cases) |
| Bacteremia (Fusobacterium necrophorum most commonly) |
| Septic metastatic foci, typically to lungs |
| Usual Presentation |
| Pharyngitis |
| Fevers |
| Rigors |
| Neck involvement: tenderness, swelling, tender internal jugular vein thrombus (cord sign) |
| Pulmonary infiltrates which cavitate |
With the advent of antibiotics, LS is now rare with an incidence of 0.9 per million persons per year. In Lemierre's time, the disease was fulminant and led to death within 2 weeks, but in the antibiotic age the mortality rate is 4.9%.1, 3 The median age of an LS patient is 19 years, with a higher incidence in males.1, 35 Although in the literature it is referred to as the forgotten disease, there is evidence the incidence is increasing.3, 4, 6, 8
There are variations of classic LS. Bacteremia may occur much later than the initial pharyngitis, the disease may be less aggressive, the thrombus may be in the external jugular vein, or there may be no identified thrombus.3, 4, 8 In fact, a thrombus is only identified in 36% of cases.9 The primary infection may be a head and neck infection that is not pharyngitis, such as an odontogenic infection,4 or may not be identified.10 Despite variations, the fundamentals of diagnosis are prior head and neck infection, presumed thrombophlebitis and bacteremia, and evidence of septic metastatic foci.
The genus Fusobacterium comprises anaerobic, nonspore forming gram negative bacilli.1, 35, 11 F. necrophorum and F. nucleatum are 2 species within this genus. F. nucleatum causes the majority of reported human bacteremias by Fusobacterium species, but it is F. necrophorum that is most associated with anaerobic oropharyngeal infections, thrombocytopenia, clot formation, and LS.35, 8, 9
It is unknown if Fusobacterium species directly cause the sore throat, or rather are bystanders which thrive once a favorable anaerobic environment is created via endotoxins and exotoxins.35 A break in oral mucosa via trauma or coinfection with bacteria/viruses (especially EBV) is also thought to play a role with infection.2, 3, 5 One‐third of LS cases have coinfection with other oropharyngeal flora. Thus, one must reexamine the anaerobic blood cultures after an organism has been identified in suspect cases.3, 4
There is an increased association of LS with EBV infection, likely due to viral‐induced and steroid‐induced immunosuppression.24 False positive heterophile tests are reported with LS, so the specific antibody tests for EBV must be checked.3, 4
Once thrombophlebitis occurs, the bacteria can metastasize to distant sites. In 80% to 92% of LS cases, the metastatic complication is a pleuro‐pulmonary infection, consisting of septic pulmonary emboli, empyema, and pleural effusions, but extra‐pulmonary lesions occur.1, 3, 9, 12 Abdominal pain usually results from abdominal microabscesses or thrombophlebitis.4 Mild renal impairment and abnormal liver function tests are common.3, 4 Cranial nerve palsies and Horner's syndrome are rare and indicate carotid sheath involvement.3, 12 An elevated C‐reactive protein can distinguish bacterial from uncomplicated viral pharyngitis.3, 4 Also, rigors are unusual in tonsillitis, and their presence indicate bacterial entry into the circulation.3
CXRs may reveal the pulmonary septic emboli. Ultrasound of the IJV is inexpensive and noninvasive, but may have limited sensitivity for an acute thrombus. CT scan allows increased visualization of anatomy, but can have decreased sensitivity and specificity for thrombosis.3 Magnetic resonance imaging (MRI) is recommended if LS results from mastoiditis, to exclude an intracerebral vein thrombosis.9
Antibiotics have both dramatically decreased the incidence of LS and improved its prognosis. The recent rise in incidence may be due to a renewed interest in restricting the use of antibiotics in cases of pharyngitis, as well as an increased use of macrolides, to which F. necrophorum is frequently resistant.3 Decreased tonsillectomies may also have a role, as LS is more common with retained tonsils.1, 3
No trials have evaluated the optimal antibiotic regimen. Fusobacterium species are sensitive to penicillin, but 23% have beta‐lactamase activity as reported clinically by several authors.3, 5 F. necrophorum is also sensitive to metronidazole, ticarcillin‐clavulanate, cefoxitin, amoxicillin‐clavulanate, imipenem, and clindamycin. There is a high resistance to macrolides and gentamicin, and the activity of tetracyclines is poor. For treatment, most authors suggest a carbapenem, a penicillin/beta‐lactamase inhibitor combination, or metronidazole. Clindamycin has weaker bactericidal activity than metronidazole or imipenem. Metronidazole is preferred because of its activity against all Fusobacterium species, good penetration into tissues, bactericidal activity, low minimum inhibitory concentration, and ability to achieve high concentration in the cerebrospinal fluid if meningitis occurs. An effective regimen is metronidazole with a penicillinase‐resistant penicillin to cover for mixed coinfection with streptococci or staphylococci.3, 4, 12 A 6‐week antibiotic course is given for adequate penetration into the protective fibrin clots.4
Reports have shown good outcomes both with and without the use of anticoagulation.3, 4, 8 Support for anticoagulation is extrapolated from experience with septic pelvic thrombophlebitis, in which anticoagulation results in more rapid resolution of symptoms.13 Given the lack of firm evidence in cases of LS, anticoagulation is typically reserved for poor clinical response despite 2 to 3 days of antibiotic therapy or propagation of thromboses into the cavernous sinus. It is generally given for 3 months.4, 13
Prior to the antibiotic era, surgical ligation or excision of the IJV was done without clear benefit. Today, surgery is reserved for cases of continued septic emboli or extension of thrombus despite aggressive medical therapy.3 If mediastinitis develops, then surgical intervention is essential.4
Lemierre stated that the symptoms and signs of LS are so characteristic that it permits diagnosis before bacteriological examination.1 However, today it may go unrecognized by physicians until a blood culture shows anaerobes or Fusobacterium species. For a young patient admitted with pneumonia preceded by pharyngitis, hospitalists must remain vigilant for the presence of LS.
Key Points for Hospitalists/Teaching Points
-
The triad of LS is pharyngitis, thrombophlebitis, and distant metastatic pyogenic emboli.
-
Suspect LS in a young, otherwise healthy patient who clinically deteriorates in the setting of a recent pharyngeal infection.
-
With the modern decrease in antibiotic use for pharyngitis, LS may be on the rise.
The approach to clinical conundrums by an expert clinician is revealed through presentation of an actual patient's case in an approach typical of morning report. Similar to patient care, sequential pieces of information are provided to the clinician who is unfamiliar with the case. The focus is on the thought processes of both the clinical team caring the patient and the discussant.
A 27‐year‐old woman with a history of asthma presented to her primary care physician (PCP) with a sore throat which began after attending a party where she shared alcoholic beverages with friends. She denied any high‐risk sexual behavior. Her PCP prescribed azithromycin and methylprednisolone empirically for tonsillitis. The throat pain subsided, but in the next several days she experienced increased weakness, lethargy, poor appetite, and chills, and she returned to her PCP for reevaluation.
Two months prior she had been treated at a walk‐in clinic with a course of penicillin for a presumed streptococcal pharyngitis. Her symptoms resolved until her current presentation.
In a young woman with 2 episodes of pharyngitis in 2 months followed by an acute systemic illness, one must consider an immunocompromised state such as human immunodeficiency virus (HIV), hematologic malignancy, or autoimmune diseases. Weakness, lethargy, anorexia, and chills in the setting of pharyngitis suggest a local process in the neck, most likely infection associated with systemic toxicity. As neck abscess and bacteremia warrant early consideration, the physical examination should focus on the neck and oropharynx, as well as neurologic exam to evaluate for bacterial spreading into the central nervous system. In addition to routine laboratory studies, a chest x‐ray (CXR) would be appropriate as upper respiratory infections may be complicated by pneumonia and present with signs and symptoms of systemic illness.
On examination by her PCP, her temperature was 99.2F and her blood pressure was 118/68. She had bilateral oropharyngeal erythema without exudates and bilateral tonsillar and anterior triangle lymphadenopathy (LAD). An oropharyngeal rapid Streptococcal antigen detection test was negative, but a Monospot test was positive for heterophile antibodies. Azithromycin and methylprednisolone were discontinued, and the patient was informed she most likely had Epstein Barr Virus (EBV) infection.
The following day, the complete blood count results returned. The platelet count was 50 K/L and the white blood cell (WBC) count was 13.0 K/L. The patient stated she had developed right‐sided flank pain upon deep inspiration and used her albuterol inhaler with minimal relief. She continued to have fever, decreased appetite, chest and abdominal pain, and difficulty swallowing due to odynophagia. She was instructed to go to the emergency department (ED) for further evaluation. In the ED, she denied any shortness of breath, but reported a slight cough and right‐sided abdominal pain.
Acute tonsillar pharyngitis and fever, as well as systemic symptoms of fatigue and abdominal pain along with positive heterophile screen are highly suggestive of EBV infection in this young female. The episode of pharyngitis 2 months prior remains unexplained and may be unrelated. Right‐sided pleuritic pain and abdominal pain may be related to EBV hepatitis. Odynophagia is consistent with EBV infection as well. Profound lethargy, however, is not a common presenting feature in mononucleosis unless infected patients are profoundly dehydrated due to inability to swallow. Her pain symptoms may be secondary to other signs of EBV infection, such as hepatomegaly, splenomegaly, ascites, and/or right pleural effusion. A history of rash should be investigated. Initial assessment in this acutely ill patient should focus on evaluation for the presence of severe sepsis and for a primary source of infection. Given the severity of her illness, I would consider early computed tomography (CT) of her chest, abdomen, and pelvis, as well as CT of the neck to exclude a possibility of peritonsillar abscess. The complaint of chills indicates a possible bacteremia, so coverage with broad‐spectrum antibiotics is indicated. Symptomatic relief with acetaminophen and intravenous fluid rehydration is appropriate.
On exam, temperature was 101.9F, blood pressure was 111/74, heart rate was 140 beats per minute, respiratory rate was 18 per minute, and oxygen saturation was 99% on room air. She appeared drowsy, but answered questions appropriately. She had bilateral swollen tonsils, as well as anterior and posterior cervical adenopathy, with tenderness greater on the left side. Her chest exam had slightly diminished breath sounds at the bases bilaterally. Heart rhythm was regular, and there were no murmurs appreciated. On abdominal exam, she was tender to palpation in both right‐upper and left‐upper quadrants, without obvious hepatosplenomegaly. There were no petechiae noted on her skin.
The WBC was 17.6 K/L, with 89% neutrophils and 5% lymphocytes, platelet count was 22 K/L, and hemoglobin was 13.8 g/dL. A D‐dimer test was elevated at 1344 ng/mL. Peripheral blood smear showed thrombocytopenia and neutrophilia, but demonstrated no schistocytes. The serum potassium was 3.2 mEq/L, bicarbonate was 29 mEq/L, blood urea nitrogen was 15 mg/dL and the creatinine was 1.29 mg/dL. Transaminases were within normal limits, but total bilirubin was 1.8 mg/dL. Her urinalysis was normal. Blood cultures were sent. A CXR showed bibasilar consolidations and pleural effusions (Figure 1). A CT of the chest with contrast was obtained that showed multiple confluent and patchy foci of consolidation in the lung bases, with trace bilateral pleural effusions (Figure 2). A CT of the abdomen showed a spleen at the upper limits of normal in size, measuring 13 cm in length, but was otherwise normal.
Leukocytosis with lymphopenia is not consistent with EBV infection and another process needs to be considered. This patient meets criteria for sepsis syndrome and should receive broad spectrum antibiotics, such as vancomycin and piperacillin‐tazobactam immediately after the blood cultures are sent, in addition to further evaluation to determine the source of sepsis. Depending on her mental status response to initial measures such as acetaminophen and hydration, one should consider a lumbar puncture, which would require platelet transfusion and may therefore not be done immediately. HIV serology should be performed, since acute retroviral syndrome can mimic this presentation. With neck tenderness that is more localized to her left side, a CT of her neck to evaluate for an abscess may be helpful.
She was admitted for presumed community‐acquired pneumonia complicating an upper respiratory tract infection. Her pharyngitis was thought to be of viral etiology. Moxifloxacin was started and intravenous fluids were administered. She was started on prednisone 60 mg daily for presumed immune‐mediated thrombocytopenia related to EBV infection. An HIV antibody test and quantitative polymerase chain reaction (PCR) were both negative. The EBV immunoglobulin G (IgG) titer was positive (>1:10), but the IgM titer was negative. Her mental status improved after starting moxifloxacin and fluids. Her creatinine and bilirubin normalized to 0.97 mg/dL and 0.8 mg/dL respectively. She continued to have a tender left‐sided submandibular swelling. Blood cultures grew Gram‐negative bacilli in 2 anaerobic bottles.
I am uncomfortable with moxifloxacin as initial empiric therapy because at presentation she had sepsis syndrome as well as a suspected immunocompromised state. In addition, moxifloxacin would not be adequate coverage for anaerobic organisms if a peritonsillar abscess was involved. At this point, she needs a CT of her neck to look for a focus of infection which may require surgical management and, if negative, further imaging such as a tagged white blood scan to identify the source of the anaerobes.
Moxifloxacin was switched to piperacillin‐tazobactam and prednisone was discontinued. By day 4 of hospitalization her platelet count had risen to 261 K/L. Her WBC continued to rise to a peak of 21.5 K/L and she continued to have fevers and diffuse pains, although her repeat blood cultures were negative. She continued to have tenderness of the cervical lymph nodes, left greater than right. A repeat CXR showed patchy air space disease bilaterally and pleural effusions, both of which had progressed compared with the prior film. Clindamycin was empirically added to her antibiotic regimen in light of her progressing pneumonia and evidence of anaerobic infection. A repeat CT scan of her chest revealed multiple nodular opacities scattered throughout the lung fields, some of which were cavitary, predominating in the lung bases. The CT scan of her neck revealed a left peritonsillar abscess and phlegmon in the left retropharyngeal and deep neck area along the sternocleidomastoid and internal jugular vein (IJV). There also was noted a large thrombus within the left IJV extending superiorly to involve the jugular bulb, sigmoid sinus, and distal left transverse sinus; and inferiorly to near the origin of the brachiocephalic vein (see Figure 3). An echocardiogram did not reveal any vegetations.
The combination of recent pharyngitis, septic pulmonary emboli, and IJV thrombosis is consistent with a diagnosis of Lemierre's syndrome (LS). This is a life threatening condition, even if diagnosis is made early and appropriate treatment is started. The most likely causative agent is Fusobacterium necrophorum. In this case it was important to realize that clinical presentation was not consistent with EBV infection, even though heterophile screen was positive. Early initiation of broad spectrum antibiotics as well as CT scan of the neck would have been appropriate.
The diagnosis of LS was made. The blood culture speciation revealed Fusobacterium nucleatum, which was too fastidious to perform antimicrobial sensitivities. Her symptoms improved significantly with the addition of clindamycin to piperacillin‐tazobactam, which was postulated to be the result of bacterial beta‐lactamase activity mitigating the efficacy of piperacillin‐tazobactam. Thoracentesis of her pleural effusion did not reveal an empyema. Due to her large thrombus burden, she was started on anticoagulation with heparin and transitioned to outpatient coumadin. She was switched to metronidazole as a single agent antibiotic for 6 weeks, and on outpatient follow‐up was doing well.
Commentary
LS was described by Dr. Andre Lemierre in 1936.6 The syndrome consists of a primary oropharyngeal infection, thrombosis of the IJV, bacteremia, and septic metastatic foci, usually involving the lungs.1, 2 LS is a form of necrobacillosis, which is a systemic infection resulting from F. necrophorum.3, 4 In classic LS, the initial pharyngitis is usually a tonsillar or peritonsillar abscess, and is followed by intense fever and rigors after 4 days to 2 weeks.1, 3 This is followed by a unilateral painful submaxillary LAD and IJV thrombophlebitisthe cord sign.2 Finally, bacteremia and distant metastatic pyogenic abscesses develop.1 (see Table 1).
| Lemierre's Syndrome typical features |
| Antecedent head and neck infection, typically an oropharyngeal infection prior to deterioration |
| Thrombophlebitis, typically of internal jugular vein (present in only 1/3 of cases) |
| Bacteremia (Fusobacterium necrophorum most commonly) |
| Septic metastatic foci, typically to lungs |
| Usual Presentation |
| Pharyngitis |
| Fevers |
| Rigors |
| Neck involvement: tenderness, swelling, tender internal jugular vein thrombus (cord sign) |
| Pulmonary infiltrates which cavitate |
With the advent of antibiotics, LS is now rare with an incidence of 0.9 per million persons per year. In Lemierre's time, the disease was fulminant and led to death within 2 weeks, but in the antibiotic age the mortality rate is 4.9%.1, 3 The median age of an LS patient is 19 years, with a higher incidence in males.1, 35 Although in the literature it is referred to as the forgotten disease, there is evidence the incidence is increasing.3, 4, 6, 8
There are variations of classic LS. Bacteremia may occur much later than the initial pharyngitis, the disease may be less aggressive, the thrombus may be in the external jugular vein, or there may be no identified thrombus.3, 4, 8 In fact, a thrombus is only identified in 36% of cases.9 The primary infection may be a head and neck infection that is not pharyngitis, such as an odontogenic infection,4 or may not be identified.10 Despite variations, the fundamentals of diagnosis are prior head and neck infection, presumed thrombophlebitis and bacteremia, and evidence of septic metastatic foci.
The genus Fusobacterium comprises anaerobic, nonspore forming gram negative bacilli.1, 35, 11 F. necrophorum and F. nucleatum are 2 species within this genus. F. nucleatum causes the majority of reported human bacteremias by Fusobacterium species, but it is F. necrophorum that is most associated with anaerobic oropharyngeal infections, thrombocytopenia, clot formation, and LS.35, 8, 9
It is unknown if Fusobacterium species directly cause the sore throat, or rather are bystanders which thrive once a favorable anaerobic environment is created via endotoxins and exotoxins.35 A break in oral mucosa via trauma or coinfection with bacteria/viruses (especially EBV) is also thought to play a role with infection.2, 3, 5 One‐third of LS cases have coinfection with other oropharyngeal flora. Thus, one must reexamine the anaerobic blood cultures after an organism has been identified in suspect cases.3, 4
There is an increased association of LS with EBV infection, likely due to viral‐induced and steroid‐induced immunosuppression.24 False positive heterophile tests are reported with LS, so the specific antibody tests for EBV must be checked.3, 4
Once thrombophlebitis occurs, the bacteria can metastasize to distant sites. In 80% to 92% of LS cases, the metastatic complication is a pleuro‐pulmonary infection, consisting of septic pulmonary emboli, empyema, and pleural effusions, but extra‐pulmonary lesions occur.1, 3, 9, 12 Abdominal pain usually results from abdominal microabscesses or thrombophlebitis.4 Mild renal impairment and abnormal liver function tests are common.3, 4 Cranial nerve palsies and Horner's syndrome are rare and indicate carotid sheath involvement.3, 12 An elevated C‐reactive protein can distinguish bacterial from uncomplicated viral pharyngitis.3, 4 Also, rigors are unusual in tonsillitis, and their presence indicate bacterial entry into the circulation.3
CXRs may reveal the pulmonary septic emboli. Ultrasound of the IJV is inexpensive and noninvasive, but may have limited sensitivity for an acute thrombus. CT scan allows increased visualization of anatomy, but can have decreased sensitivity and specificity for thrombosis.3 Magnetic resonance imaging (MRI) is recommended if LS results from mastoiditis, to exclude an intracerebral vein thrombosis.9
Antibiotics have both dramatically decreased the incidence of LS and improved its prognosis. The recent rise in incidence may be due to a renewed interest in restricting the use of antibiotics in cases of pharyngitis, as well as an increased use of macrolides, to which F. necrophorum is frequently resistant.3 Decreased tonsillectomies may also have a role, as LS is more common with retained tonsils.1, 3
No trials have evaluated the optimal antibiotic regimen. Fusobacterium species are sensitive to penicillin, but 23% have beta‐lactamase activity as reported clinically by several authors.3, 5 F. necrophorum is also sensitive to metronidazole, ticarcillin‐clavulanate, cefoxitin, amoxicillin‐clavulanate, imipenem, and clindamycin. There is a high resistance to macrolides and gentamicin, and the activity of tetracyclines is poor. For treatment, most authors suggest a carbapenem, a penicillin/beta‐lactamase inhibitor combination, or metronidazole. Clindamycin has weaker bactericidal activity than metronidazole or imipenem. Metronidazole is preferred because of its activity against all Fusobacterium species, good penetration into tissues, bactericidal activity, low minimum inhibitory concentration, and ability to achieve high concentration in the cerebrospinal fluid if meningitis occurs. An effective regimen is metronidazole with a penicillinase‐resistant penicillin to cover for mixed coinfection with streptococci or staphylococci.3, 4, 12 A 6‐week antibiotic course is given for adequate penetration into the protective fibrin clots.4
Reports have shown good outcomes both with and without the use of anticoagulation.3, 4, 8 Support for anticoagulation is extrapolated from experience with septic pelvic thrombophlebitis, in which anticoagulation results in more rapid resolution of symptoms.13 Given the lack of firm evidence in cases of LS, anticoagulation is typically reserved for poor clinical response despite 2 to 3 days of antibiotic therapy or propagation of thromboses into the cavernous sinus. It is generally given for 3 months.4, 13
Prior to the antibiotic era, surgical ligation or excision of the IJV was done without clear benefit. Today, surgery is reserved for cases of continued septic emboli or extension of thrombus despite aggressive medical therapy.3 If mediastinitis develops, then surgical intervention is essential.4
Lemierre stated that the symptoms and signs of LS are so characteristic that it permits diagnosis before bacteriological examination.1 However, today it may go unrecognized by physicians until a blood culture shows anaerobes or Fusobacterium species. For a young patient admitted with pneumonia preceded by pharyngitis, hospitalists must remain vigilant for the presence of LS.
Key Points for Hospitalists/Teaching Points
-
The triad of LS is pharyngitis, thrombophlebitis, and distant metastatic pyogenic emboli.
-
Suspect LS in a young, otherwise healthy patient who clinically deteriorates in the setting of a recent pharyngeal infection.
-
With the modern decrease in antibiotic use for pharyngitis, LS may be on the rise.
- .On certain septicaemias due to anaerobic organisms.Lancet.1936;1:701–703.
- ,.Lemierre's syndrome: more judicious antibiotic prescribing habits may lead to the clinical reappearance of this often forgotten disease.Am J Med.2006;119(3):e7–e9.
- .Human infection with Fusobacterium necrophorum (necrobacillosis), with a focus on Lemierre's syndrome.Clin Microbiol Rev.2007;20(4):622–659.
- ,.Human necrobacillosis, with emphasis on Lemierre's syndrome.Clin Infect Dis.2000;31(2):524–532.
- ,.Fusobacterial infections: clinical spectrum and incidence of invasive disease.J Infect.2008;57(4):283–289.
- .Human infections with Fusobacterium necrophorum.Anaerobe.2006;12(4):165–172.
- ,,, et al.Increased diagnosis of Lemierre Syndrome and other Fusobacterium necrophorum infections at a Children's Hospital.Pediatrics.2003;112(5):e380.
- ,,.Unusual presentation of Lemierre's syndrome due to Fusobacterium nucleatum.J Clin Microbiol.2003;41(7):3445–3448.
- ,,,.The evolution of Lemierre Syndrome: report of 2 cases and review of the literature.Medicine (Baltimore).2002;81(6):458–465.
- ,.An unusual case of Lemierre's syndrome presenting as pyomyositis.Am J Med Sci.2008;335(6):499–501.
- .Update on the taxonomy and clinical aspects of the genus Fusobacterium.Clin Infect Dis.2002;35(Suppl 1):S22–S27.
- ,,,,.Lemierre syndrome: two cases and a review.Laryngosope.2007;117(9):1605–1610.
- ,,.Lemierre's syndrome (necrobacillosis).Postgrad Med J.1999;75(881):141–144.
- .On certain septicaemias due to anaerobic organisms.Lancet.1936;1:701–703.
- ,.Lemierre's syndrome: more judicious antibiotic prescribing habits may lead to the clinical reappearance of this often forgotten disease.Am J Med.2006;119(3):e7–e9.
- .Human infection with Fusobacterium necrophorum (necrobacillosis), with a focus on Lemierre's syndrome.Clin Microbiol Rev.2007;20(4):622–659.
- ,.Human necrobacillosis, with emphasis on Lemierre's syndrome.Clin Infect Dis.2000;31(2):524–532.
- ,.Fusobacterial infections: clinical spectrum and incidence of invasive disease.J Infect.2008;57(4):283–289.
- .Human infections with Fusobacterium necrophorum.Anaerobe.2006;12(4):165–172.
- ,,, et al.Increased diagnosis of Lemierre Syndrome and other Fusobacterium necrophorum infections at a Children's Hospital.Pediatrics.2003;112(5):e380.
- ,,.Unusual presentation of Lemierre's syndrome due to Fusobacterium nucleatum.J Clin Microbiol.2003;41(7):3445–3448.
- ,,,.The evolution of Lemierre Syndrome: report of 2 cases and review of the literature.Medicine (Baltimore).2002;81(6):458–465.
- ,.An unusual case of Lemierre's syndrome presenting as pyomyositis.Am J Med Sci.2008;335(6):499–501.
- .Update on the taxonomy and clinical aspects of the genus Fusobacterium.Clin Infect Dis.2002;35(Suppl 1):S22–S27.
- ,,,,.Lemierre syndrome: two cases and a review.Laryngosope.2007;117(9):1605–1610.
- ,,.Lemierre's syndrome (necrobacillosis).Postgrad Med J.1999;75(881):141–144.
It Starts With a Dog Scratch
A 63‐year‐old female with a history of essential thrombocythemia and hypertension presented with a 4‐week history of a worsening ulcer on her right second digit. Initially, the patient attributed the wound to a dog scratch but sought further treatment at an outside clinic when she did not see improvement. She was given a diagnosis of cellulitis and was treated with unknown oral antibiotics and silvadene cream. The ulcer continued to worsen and the patient presented to our hospital. On physical exam, an 8 cm 3 cm ulcer was observed on the right second digit. It had violaceous rolled up borders, granulation tissue, fibrinous exudates, and areas of necrotic tissue (Figure 1). The remainder of the physical examination was unremarkable. Initial laboratory values included hemoglobin 12.5 gm/dL, white blood cell count 31.2 K/UL, and platelets 625 gm/dL. An x‐ray of the hand showed soft tissue swelling with no evidence of osteomyelitis. The ulcer was evaluated and treated as an infected wound. The patient was started on broad spectrum intravenous antibiotics and underwent excisional debridement with biopsy. Blood and wound cultures were negative for aerobic and anaerobic bacteria, fungi, and acid‐fast bacilli. Pathology from the biopsy showed extensive necrosis and acute inflammation. The patient was discharged home with 10 days of oral antibiotics, and instructions for wound care. Upon follow‐up 1 week later, the patient complained of intense pain and worsening of the ulcer prompting readmission. Dermatology was consulted and diagnosed pyoderma gangrenosum (PG). The patient was started on prednisone, 60 mg daily and azathioprine, 50 mg daily. The ulcer slowly improved (Figure 2) and the steroid dosage was tapered. She was finally discharged home with a 6‐week taper of prednisone, azathioprine, and home health consultation for assistance with wound care.0, 0

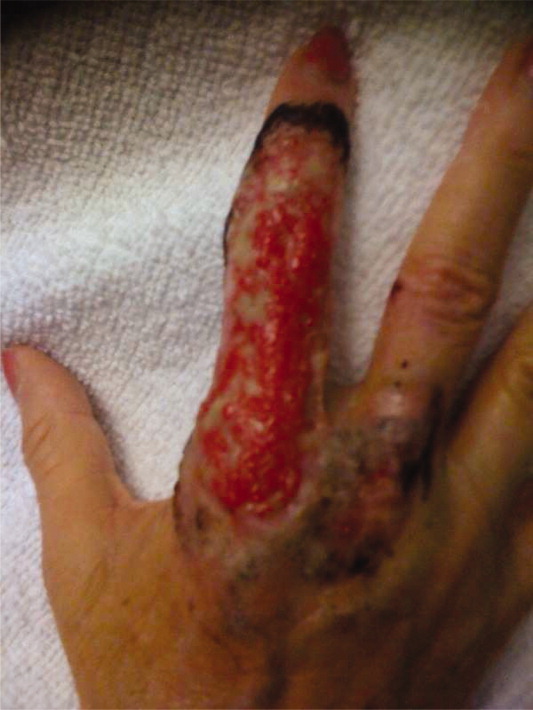
PG is an ulcerative neutrophilic dermatosis. In up to 50% of cases, PG is associated with either inflammatory bowel disease, collagen vascular disease, or hematologic disorders.1 Although an immune‐modulated pathway may be involved, the etiology and pathophysiology of PG is still unknown.1 Furthermore, PG is a diagnosis of exclusion.1 However, PG does have clinical findings which favor the diagnosis. There are 4 main subtypes of PG; ulcerative or classic, pustular, bullous, and vegetative.1 Although myeloproliferative disorders are more specifically associated with the bullous form, our patient presented with the classic subtype.2, 3 In the classic subtype, patients will often describe an initial pustule which then necroses, forming an ulcer with a reddish/purple or gray undermined border and a red halo surrounding the ulcer. PG can occur anywhere on the body however it is more frequently seen on the legs. A clinically relevant feature of PG, emphasized in this case, is pathergy. Thus, PG can develop or worsen secondary to mild trauma. PG has been reported to form after mild trauma such as an insect bite or dog scratch and has been documented to worsen with debridement, skin grafting, and biopsies.1 Another feature and clinical clue of PG as manifested by our patient is intense pain. The skin biopsy, however, is usually nonspecific and can reveal findings which include edema, neutrophil infiltration, abscess formation, necrosis, and thrombosis of vessels.1 In patients with PG associated with myeloproliferative syndromes, no correlation has been shown between the time of diagnosis and the severity of the underlying myeloproliferative syndrome.2, 3 Treatment for PG depends on extent of involvement and association with underlying disease and can include local, oral, or intravenous corticosteroids, immunosuppressants, appropriate wound care, and treatment of associated disease.4
PG is a diagnosis of exclusion. Underlying infection, vasculitis, malignancy, and Sweet's syndrome should be considered in the differential. However, one must consider PG in the differential diagnosis of an ulcer in a patient with an underlying predisposing illness, when the ulcer has characteristics of pathergy and intense pain, and is not healing appropriately as illustrated in this case.
- ,,,,.Pyoderma gangrenosum: an updated review.J Eur Acad Dermatol Venereol.2009;23(9):1008–1017.
- ,.Pyoderma gangrenosum and myeloproliferative disorders: report of a case and review of literature.Arch Intern Med.1979;139:932–934.
- ,.Pyoderma gangrenosum in a patient with essential thrombocythemia.J Cutan Med Surg.2000;2:107–109.
- ,,.Pyoderma gangrenosum: a review.J Cutan Pathol.2003;30:97–107.
A 63‐year‐old female with a history of essential thrombocythemia and hypertension presented with a 4‐week history of a worsening ulcer on her right second digit. Initially, the patient attributed the wound to a dog scratch but sought further treatment at an outside clinic when she did not see improvement. She was given a diagnosis of cellulitis and was treated with unknown oral antibiotics and silvadene cream. The ulcer continued to worsen and the patient presented to our hospital. On physical exam, an 8 cm 3 cm ulcer was observed on the right second digit. It had violaceous rolled up borders, granulation tissue, fibrinous exudates, and areas of necrotic tissue (Figure 1). The remainder of the physical examination was unremarkable. Initial laboratory values included hemoglobin 12.5 gm/dL, white blood cell count 31.2 K/UL, and platelets 625 gm/dL. An x‐ray of the hand showed soft tissue swelling with no evidence of osteomyelitis. The ulcer was evaluated and treated as an infected wound. The patient was started on broad spectrum intravenous antibiotics and underwent excisional debridement with biopsy. Blood and wound cultures were negative for aerobic and anaerobic bacteria, fungi, and acid‐fast bacilli. Pathology from the biopsy showed extensive necrosis and acute inflammation. The patient was discharged home with 10 days of oral antibiotics, and instructions for wound care. Upon follow‐up 1 week later, the patient complained of intense pain and worsening of the ulcer prompting readmission. Dermatology was consulted and diagnosed pyoderma gangrenosum (PG). The patient was started on prednisone, 60 mg daily and azathioprine, 50 mg daily. The ulcer slowly improved (Figure 2) and the steroid dosage was tapered. She was finally discharged home with a 6‐week taper of prednisone, azathioprine, and home health consultation for assistance with wound care.0, 0
PG is an ulcerative neutrophilic dermatosis. In up to 50% of cases, PG is associated with either inflammatory bowel disease, collagen vascular disease, or hematologic disorders.1 Although an immune‐modulated pathway may be involved, the etiology and pathophysiology of PG is still unknown.1 Furthermore, PG is a diagnosis of exclusion.1 However, PG does have clinical findings which favor the diagnosis. There are 4 main subtypes of PG; ulcerative or classic, pustular, bullous, and vegetative.1 Although myeloproliferative disorders are more specifically associated with the bullous form, our patient presented with the classic subtype.2, 3 In the classic subtype, patients will often describe an initial pustule which then necroses, forming an ulcer with a reddish/purple or gray undermined border and a red halo surrounding the ulcer. PG can occur anywhere on the body however it is more frequently seen on the legs. A clinically relevant feature of PG, emphasized in this case, is pathergy. Thus, PG can develop or worsen secondary to mild trauma. PG has been reported to form after mild trauma such as an insect bite or dog scratch and has been documented to worsen with debridement, skin grafting, and biopsies.1 Another feature and clinical clue of PG as manifested by our patient is intense pain. The skin biopsy, however, is usually nonspecific and can reveal findings which include edema, neutrophil infiltration, abscess formation, necrosis, and thrombosis of vessels.1 In patients with PG associated with myeloproliferative syndromes, no correlation has been shown between the time of diagnosis and the severity of the underlying myeloproliferative syndrome.2, 3 Treatment for PG depends on extent of involvement and association with underlying disease and can include local, oral, or intravenous corticosteroids, immunosuppressants, appropriate wound care, and treatment of associated disease.4
PG is a diagnosis of exclusion. Underlying infection, vasculitis, malignancy, and Sweet's syndrome should be considered in the differential. However, one must consider PG in the differential diagnosis of an ulcer in a patient with an underlying predisposing illness, when the ulcer has characteristics of pathergy and intense pain, and is not healing appropriately as illustrated in this case.
A 63‐year‐old female with a history of essential thrombocythemia and hypertension presented with a 4‐week history of a worsening ulcer on her right second digit. Initially, the patient attributed the wound to a dog scratch but sought further treatment at an outside clinic when she did not see improvement. She was given a diagnosis of cellulitis and was treated with unknown oral antibiotics and silvadene cream. The ulcer continued to worsen and the patient presented to our hospital. On physical exam, an 8 cm 3 cm ulcer was observed on the right second digit. It had violaceous rolled up borders, granulation tissue, fibrinous exudates, and areas of necrotic tissue (Figure 1). The remainder of the physical examination was unremarkable. Initial laboratory values included hemoglobin 12.5 gm/dL, white blood cell count 31.2 K/UL, and platelets 625 gm/dL. An x‐ray of the hand showed soft tissue swelling with no evidence of osteomyelitis. The ulcer was evaluated and treated as an infected wound. The patient was started on broad spectrum intravenous antibiotics and underwent excisional debridement with biopsy. Blood and wound cultures were negative for aerobic and anaerobic bacteria, fungi, and acid‐fast bacilli. Pathology from the biopsy showed extensive necrosis and acute inflammation. The patient was discharged home with 10 days of oral antibiotics, and instructions for wound care. Upon follow‐up 1 week later, the patient complained of intense pain and worsening of the ulcer prompting readmission. Dermatology was consulted and diagnosed pyoderma gangrenosum (PG). The patient was started on prednisone, 60 mg daily and azathioprine, 50 mg daily. The ulcer slowly improved (Figure 2) and the steroid dosage was tapered. She was finally discharged home with a 6‐week taper of prednisone, azathioprine, and home health consultation for assistance with wound care.0, 0
PG is an ulcerative neutrophilic dermatosis. In up to 50% of cases, PG is associated with either inflammatory bowel disease, collagen vascular disease, or hematologic disorders.1 Although an immune‐modulated pathway may be involved, the etiology and pathophysiology of PG is still unknown.1 Furthermore, PG is a diagnosis of exclusion.1 However, PG does have clinical findings which favor the diagnosis. There are 4 main subtypes of PG; ulcerative or classic, pustular, bullous, and vegetative.1 Although myeloproliferative disorders are more specifically associated with the bullous form, our patient presented with the classic subtype.2, 3 In the classic subtype, patients will often describe an initial pustule which then necroses, forming an ulcer with a reddish/purple or gray undermined border and a red halo surrounding the ulcer. PG can occur anywhere on the body however it is more frequently seen on the legs. A clinically relevant feature of PG, emphasized in this case, is pathergy. Thus, PG can develop or worsen secondary to mild trauma. PG has been reported to form after mild trauma such as an insect bite or dog scratch and has been documented to worsen with debridement, skin grafting, and biopsies.1 Another feature and clinical clue of PG as manifested by our patient is intense pain. The skin biopsy, however, is usually nonspecific and can reveal findings which include edema, neutrophil infiltration, abscess formation, necrosis, and thrombosis of vessels.1 In patients with PG associated with myeloproliferative syndromes, no correlation has been shown between the time of diagnosis and the severity of the underlying myeloproliferative syndrome.2, 3 Treatment for PG depends on extent of involvement and association with underlying disease and can include local, oral, or intravenous corticosteroids, immunosuppressants, appropriate wound care, and treatment of associated disease.4
PG is a diagnosis of exclusion. Underlying infection, vasculitis, malignancy, and Sweet's syndrome should be considered in the differential. However, one must consider PG in the differential diagnosis of an ulcer in a patient with an underlying predisposing illness, when the ulcer has characteristics of pathergy and intense pain, and is not healing appropriately as illustrated in this case.
- ,,,,.Pyoderma gangrenosum: an updated review.J Eur Acad Dermatol Venereol.2009;23(9):1008–1017.
- ,.Pyoderma gangrenosum and myeloproliferative disorders: report of a case and review of literature.Arch Intern Med.1979;139:932–934.
- ,.Pyoderma gangrenosum in a patient with essential thrombocythemia.J Cutan Med Surg.2000;2:107–109.
- ,,.Pyoderma gangrenosum: a review.J Cutan Pathol.2003;30:97–107.
- ,,,,.Pyoderma gangrenosum: an updated review.J Eur Acad Dermatol Venereol.2009;23(9):1008–1017.
- ,.Pyoderma gangrenosum and myeloproliferative disorders: report of a case and review of literature.Arch Intern Med.1979;139:932–934.
- ,.Pyoderma gangrenosum in a patient with essential thrombocythemia.J Cutan Med Surg.2000;2:107–109.
- ,,.Pyoderma gangrenosum: a review.J Cutan Pathol.2003;30:97–107.

Medical ICU Insulin Infusion Protocols
Observational studies in hospitalized patients with and without diabetes indicate that hyperglycemia is a predictor of poor clinical outcome and mortality.14 Early randomized controlled trials of intensified insulin therapy in patients with surgical and medical acute critical illness reported a reduction on the risk of multiorgan failure and systemic infections,35 as well as short‐ and long‐term mortality.1, 4 Recent randomized controlled trials, however, have failed to confirm the previously suggested benefits of intensive glucose control,6 and the large multicenter normoglycaemia in intensive care evaluation and survival using glucose algorithm regulation (NICE‐SUGAR) study reported an absolute increase in mortality rate with intensive glucose control.7 In addition, intensified insulin therapy in critically‐ill patients has been shown to be associated with a higher rate of severe hypoglycemic events than less aggressive glycemic control protocols.710 These results have led to a heightened interest in improving the quality and safety of the management of diabetes and hyperglycemia in the hospital.
The use of intravenous continuous insulin infusion (CII) is the preferred route of insulin administration for the management of hyperglycemia in the critical care setting.1, 11 Numerous examples of successful CII algorithms in achieving glycemic control are reported in the literature.4, 5, 12 Traditionally, order forms to titrate drip to achieve a target blood glucose (BG) range using an established algorithm or by the application of mathematical rules have been used in clinical practice. Recently, computer‐based algorithms aiming to direct the nursing staff adjusting insulin infusion rate have become commercially available.13, 14 It is not known, however, if computer‐based algorithms are superior to standard paper form‐based protocols in achieving glucose control and in reducing hypoglycemic events in critically‐ill patients. Accordingly, this multicenter randomized study aimed to determine differences in glycemic control and hypoglycemic events between treatment with a computer‐guided CII device and a standard column‐based paper algorithm in critically‐ill patients in the medical intensive care unit (ICU).
Research Design and Methods
In this multicenter, prospective, open‐label randomized study, 160 adult patients admitted to a medical ICU with new hyperglycemia or with a known history of diabetes treated with diet, insulin therapy or with any combination of oral antidiabetic agents were enrolled after written informed consent had been obtained from the patient or closest family member (Figure 1). Patients with known history of diabetes had 2 BG readings >120 mg/dL while subjects without a history of diabetes had 2 BG readings >140 mg/dL prior to enrollment. We excluded patients with acute hyperglycemic crises such as diabetic ketoacidosis (DKA) and hyperosmolar hyperglycemic state,15 patients with severely impaired renal function (serum creatinine 3.5 mg/dL), dementia, and pregnancy. This study was conducted at 4 hospital centers including Grady Memorial Hospital, Emory University Hospital, and Piedmont Hospital in Atlanta, Georgia and the Regional Medical Center in Memphis, Tennessee.

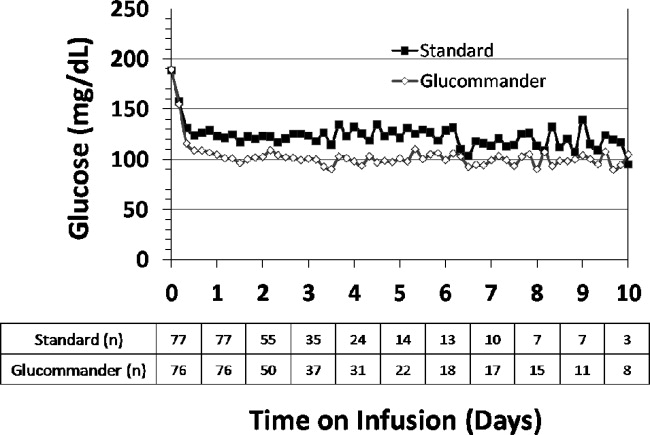
Patients were randomized using a computer randomization table to receive CII following a computer‐guided algorithm (Glucommander) or CII following a standard paper form insulin infusion algorithm. Both protocols used glulisine (Apidra) insulin and targeted a BG between 80 mg/dL and 120 mg/dL. Insulin management was directed by the specific assigned protocol and was carried out daily by the nursing staff and by members of the internal medicine residency program. The ICU physician and primary care team decided on the treatment for all other medical problem(s) for which patients were admitted. Data were collected during CII up to the first 10 days of ICU stay.
Standard and Computer‐Based CII Algorithms
The standard paper algorithm was adapted from a protocol initially published by Markovitz et al.16 (Supporting Information Appendix). The algorithm is divided into four columns based on empirically determined insulin sensitivity. The first algorithm column was for the most insulin‐sensitive patients, and the fourth algorithm column was for the most insulin resistant patients. The majority of patients started in the algorithm 1 column. Insulin‐resistant patients, such as those receiving glucocorticoids or receiving >80 units of insulin per day as outpatients, started in the algorithm 2 column. The insulin infusion rate was determined by the patient's BG level and was measured hourly until the patient was stable and within the target range. If BG targets were not achieved and the BG had not decreased by at least 60 mg/dL in the preceding hour, the patient was moved to the next column.
The characteristics and use of the Glucommander algorithm have been reported previously.13 In brief, this computer‐guided insulin algorithm directs the administration of intravenous insulin in response to BG measurement at the patient's bedside. In this study, the Glucommander program was loaded into a PalmOne (Zire 31, Tungsten E2 by Palm Inc.) handheld personal digital assistant (PDA) device. During the infusion, the nurse entered BG levels into the system and the computer recommended the insulin infusion rate and a variable time to check the next glucose testing. An alarm prompted the scheduled glucose check. The insulin infusion followed the formula: Insulin/Hour = Multiplier (BG 60). The initial multiplier or insulin sensitivity factor was 0.02. The Glucommander was programmed to adjust the multiplier to achieve and maintain target glucose.
Prior to the beginning of the study, the nursing staff at all institutions was instructed on the use of the Glucommander and paper form protocol. The insulin drip adjustment was carried out by ICU nurses in each hospital. Study investigators and coordinators rounded daily on study patients and were available for consultation and collecting data but were not involved in insulin adjustment based on the protocol.
Clinical Outcome Measures
The primary outcome of the study was to determine differences in glycemic control as measured by mean daily BG concentration between treatment groups. Secondary outcomes include differences between groups in number of hypoglycemic events (BG <60 mg/dL and <40 mg/dL), time to first glucose in target range, amount of insulin treatment (units/kg/hour), number and frequency of glucose measurements, length of stay (LOS) in the ICU and hospital, number of hyperglycemic episodes (BG >200 mg/dL), and mortality rate.
BG Monitoring
Capillary BG measurement in the standard paper protocol was performed hourly until it was within goal range for 4 hours and then every 2 hours for the duration of the infusion. Glucose measurements in the Glucommander arm were requested by the device at intervals that ranged from 20 minutes to 2 hours. The Glucommander software determined the interval between measurements based on the stability of the BG levels of the patient. The insulin infusion rate adjustment was based on the current glucose value and the slope of the glucose curve. The Glucommander alarmed at the appropriate interval to remind the nurse to check and enter the new BG value. If the BG was decreasing faster than expected, the program called for repeat BG measurements more frequently for insulin drip adjustment. If the BG was within target range for 4 consecutive readings, the Glucommander alarmed for repeat BG every 2 hours.
Laboratory Assays
Plasma glucose and glycosylated hemoglobin (HbA1c) were measured on admission. Complete blood count and complete metabolic profile were measured on admission and as otherwise determined by the treating physician.
Statistical Analysis
All data in the text, table and figures are expressed as mean standard deviation. Comparison between groups was carried out by nonparametric two‐sample Wilcoxon tests for continuous variables and chi‐square tests (or Fisher's exact tests) for categorical variables. Cochran‐Mantel‐Haenszel (CMH) or CMH exact tests were further used to adjust for site difference. Repeated measures analyses were conducted to model the probability of BG <60 mg/dL or BG<40 mg/dL based on generalized linear model with AR(1) within‐subject correlation structure. A P value <0.05 is considered as significant. We expected differences in mean BG concentration 30 mg/dL between groups. Assuming 2‐tailed alpha of 0.05, a standard deviation of approximately 40, and a one‐to‐one allocation and no subject attrition, 80 patients per treatment group were thought to be sufficient to achieve 80% power for group mean comparisons. Statistical significance was defined as a type 1 error of 0.05. Statistical analysis was performed using the SAS 9.2.
Results
The admission characteristics and clinical outcomes of interest of the study patients are shown in Table 1. A total of 160 adult patients admitted to a medical ICU with new hyperglycemia (47%) or with a known history of diabetes (53%) were randomized into the study. Of them, 7 patients were excluded due to withdrawal of consent, treatment with subcutaneous basal or supplemental short‐acting insulin during CII, or receiving less than 4 hours of CII. There were no differences in the mean age, gender, race, history of diabetes, or primary admitting diagnosis between treatment groups. The most common admitting diagnosis categories included pulmonary (22.1%), cardiovascular (21.4%), infectious (20.0%), and central nervous system (16.6%) disorders.
| Glucommander (# patients = 77) | Standard (# patients = 76) | P Value | |
|---|---|---|---|
| |||
| Age (years) | 57.8 11.0 | 58.5 13.4 | NS |
| Gender (M/F), % | 57.1/42.9 | 51.3/46.7 | NS |
| Race (W/B/H), % | 25.0/69.6/1.8 | 28.9/67.3/3.9 | NS |
| BMI (Kg/m2) | 31.6 10.4 | 30.5 8.1 | NS |
| Primary admitting diagnosis: | |||
| Cardiovascular, % | 24.7 | 18.1 | NS |
| Pulmonary, % | 24.7 | 19.4 | NS |
| Infection, % | 16.4 | 23.6 | NS |
| Cerebro‐vascular, % | 4.1 | 4.2 | NS |
| Renal, % | 1.4 | 1.4 | NS |
| Apache score | 13.4 6.1 | 16.0 8.3 | NS |
| History of diabetes, % | 53.3 | 54.3 | NS |
| Hemoglobin A1c (%) | 7.2 1.9 | 6.8 1.4 | NS |
| DM patients | 7.9 2.2 | 7.3 1.6 | NS |
| Non‐DM patients | 6.2 0.7 | 6.0 0.7 | NS |
The mean admission glucose concentration for study patients was 190.6 58.2 mg/dL and the mean A1C was 7.0 1.7%. Glycemic control parameters achieved with the CII protocols are listed in Table 2. At the start of CII, the mean BG value was similar for the Glucommander and paper protocols (189.7 64.8 mg/dL and 188.4 54.8 mg/dL, P = 0.419). The mean time to reach the BG target was shorter in the Glucommander group (4.8 2.8 vs. 7.8 9.1 hours, P < 0.001). The Glucommander group had a lower mean glucose value during insulin infusion (115.5 20.7 vs. 131.0 24.6 mg/dL, P < 0.001) and once at target goal, in a lower mean BG values (103.3 8.8 vs. 117.3 16.5 mg/dL, P < 0.001) than the standard algorithm (Figure 2). The mean inpatient BG difference between treatment groups was 15.5 mg/dL (P < 0.001), with a mean daily BG difference ranging from 17.4 mg/dL to 24.4 mg/dL less for the Glucommander group during days 2 to 6 of therapy (P < 0.01).
| Glucommander (# patients = 77) | Standard (# patients = 76) | Mean Difference (CI) or P Value | |
|---|---|---|---|
| |||
| Initial glucose (mg/dL) | 189.7 64.8 | 188.3 54.8 | 1.333 (17.701, 20.367) |
| Median (range) duration of CII (hours) | 46 (12‐240) | 47 (5‐240) | 12.939 (34.630, 8,752) |
| Insulin infusion rate (units/Kg/hour) | 0.035 0.024 | 0.028 0.021 | 0.006 (0.002, 0.014) |
| Time to achieve target BG of 80‐120 mg/dL (hours) | 4.8 2.8 | 7.8 9.1 | 3.0 (5.2, 0.9) |
| Mean BG maintained once target achieved (mg/dL) | 103.3 8.8 | 117.3 16.5 | 14.0 (18.210, 9.774) |
| % of BG tests within target range | 71.0 17.0% | 51.3 19.7% | 19.6 (13.7, 25.5) |
| Mild hypoglycemia, <60 mg/dL, n (% patients) | 33 (42.9) | 23 (31.9) | NS |
| Severe hypoglycemia, <40 mg/dL, n (% patients) | 3 (3.9) | 4 (5.6) | NS |
| Hyperglycemia, >200 mg/dL, n (% patients) | 9 (11.7) | 18 (25.0) | 0.054 |
The Glucommander algorithm was associated with tighter glycemic control and less glucose variability than the standard paper form protocol. Once patients achieved BG target, on average 71.1% of BG readings in the Glucommander and 51.3% in the standard group remained within the 80 mg/dL to 120 mg/dL target range (P < 0.001). In addition, the Glucommander was associated with a significantly lower rate of severe hyperglycemia during insulin infusion. The number of patients with 1 or more episodes of BG >200 mg/dL (11.7% vs. 25%, P = 0.057 before adjusting for potential site difference and P = 0.034 after adjusting for site difference) were less in the Glucommander group than in the standard paper regimen. In addition, 4 of these patients in spite of being on the highest insulin delivery column failed to achieve glucoses <180 and had an average in‐hospital glucose level of 204.5 32.2 mg/dL. These patients were transitioned to the Glucommander arm and withdrawn from the study. All episodes of hypoglycemia occurred after the patients achieved 1 glucose measurement within the target range. The number of patients who experienced one or more BG <40 mg/dL and <60 mg/dL was 3.9% and 42.9% in the Glucommander and 5.6% and 31.9% in the standard regimen, respectively (both, P = not significant [NS]). Similar results were obtained when site effect was accommodated (both, P = NS). Based on repeated measures analyses, the probabilities of BG reading <40 mg/dL or <60 mg/dL were not significantly different between groups (P = 0.969, P = 0.084) after accounting for within‐patient correlations with or without adjusting for time effect. None of these episodes resulted in seizures or were otherwise judged to be associated with deterioration of clinical status.
The mean insulin infusion rate was slightly higher in the Glucommander regimen but the difference was not statistically significant between groups. Patients treated with the Glucommander protocol received a mean infusion rate of 0.035 0.024 unit/kg/hour for a total of 2.85 1.93 units per hour, and those treated with the paper protocol received a 0.028 0.021 units/kg/hour for a total of 2.50 2.28 units per hour, P = 0.12 and P = 0.09, respectively.
The numbers of BG measurements were similar between the Glucommander and standard paper algorithms (44.2 39.8 and 41.2 34.5 respectively, P = NS) with the number of glucose testing per patient ranging from 6 to 175 in the Glucommander and 3 to 168 in the standard group. Similarly, when normalized to the duration of insulin infusion, the frequency of BG monitoring was not different with the protocols (0.68 0.18 and 0.62 0.22 tests/hour respectively, P = NS).
Compared to the standard paper insulin infusion algorithm, patients treated with the Glucommander device had a similar mean ICU LOS (13.4 13.8 vs. 8.5 7.6 days, P = 0.145), mean hospital LOS (17.5 15.0 days vs. 23.9 26.3 days, P = 0.704) and hospital mortality (26.0% vs. 21.9%, P = 0.561).
Discussion
This study is the first to compare the safety and efficacy of a CII via a computer‐guided algorithm and a standard paper form protocol in nonsurgical patients in the ICU. Both treatment algorithms resulted in significant improvement in glycemic control with the Glucommander achieving glycemic glucose target in a shorter time of treatment, a lower mean glucose concentration, and in greater percentage of glucose measurements maintained within target range, without an increased risk of severe hypoglycemia compared to the standard paper protocol.
Hyperglycemia in hospitalized patients is a common, serious, and costly health care problem. Evidence from observational and interventional studies indicate that hyperglycemia in critical illness is associated with an increased risk of complications and mortality.25 There is ongoing debate, however, about the optimal glucose level in hospitalized patients with critical illness. Although, several cohort studies as well as early randomized trials in ICU patients reported that intensified insulin treatment to achieve a target glucose between 80 mg/dL to 110 mg/dL reported a reduction in short‐term and long‐term mortality and rates of multiorgan failure and systemic infections compared with conventionally treated patients.3, 4, 17 More recent randomized controlled trials and meta‐analyses, however, have shown that this low BG target has been difficult to achieve without increasing the risk for severe hypoglycemia.710 In addition, recent multicenter trials have failed to show significant improvement in clinical outcome or have even shown increased mortality risk with intensive glycemic control.610 Based on these reports, the American Association of Clinical Endocrinologist (AACE) and American Diabetes Association (ADA) task force on inpatient glycemic control recommended different glycemic targets in the ICU setting. Current guidelines suggest targeting a BG level between 140 mg/dL and 180 mg/dL (7.8 and 10.0 mmol/L) for the majority of ICU patients and a lower glucose targets between 110 mg/dL and 140 mg/dL (6.1 and 7.8 mmol/L) in selected ICU patients (ie, centers with extensive experience and appropriate nursing support, cardiac surgical patients, patients with stable glycemic control without hypoglycemia). Glucose targets >180 mg/dL or <110 mg/dL are no longer recommended in ICU patients.
The rate of severe hypoglycemic events (<40 mg/dL) observed in both arms of our trial was significantly lower than those reported in recent international trials of intensive glycemic control.3, 4, 8 The overall rate of severe hypoglycemic events in international trials ranged between 5% to 28.6%.3, 4, 7, 8, 18, 19 In this trial, the number of patients with severe hypoglycemia was 3.9% in the computer‐based and 5.6% in the standard paper algorithm. Repeated measures analyses show the probabilities of BG readings <40 mg/dL were similar and not significantly different between groups (P = 0.969). We observed, however, a high rate of mild hypoglycemic events in patients treated with both insulin algorithms. The number of patients with BG <60 mg/dL was 42.9% in the Glucommander and 31.9% in the standard (P = NS). Minimizing the rate of hypoglycemia events is of major importance in hospitalized patients because it has been shown that hypoglycemia may be an independent risk factor of poor clinical outcome and mortality.20 Hypoglycemia may increase the risk of ventricular arrhythmias, in part due to the prolongation QT interval21 and can impair cerebral glucose metabolism resulting in brain metabolic dysfunction, as suggested by recent clinical studies.22 Moreover, insulin‐induced hypoglycemia is also associated with increased proinflammatory cytokines (tumor necrosis factor [TNF]‐alpha, interleukin [IL]‐1beta, IL‐6, and IL‐8) and oxidative stress23 that correlate with elevations of counterregulatory hormones (catecholamines, cortisol).
The Glucommander was associated with lower glycemic variability and with a higher percentage of BG readings within target range than patients treated with the standard paper form regimen. The clinical importance of the degree of variability and rapidity of fluctuations in glucose levels in critically ill patients is a topic of recent interest. Glycemic variability has been identified as a strong independent contributor to the risk of mortality in critically ill and surgical patients.24 Low levels of glycemic variability (standard deviation [SD] <10 mg/dL or 10‐20 mg/dL) have been shown to have a statistically significant lower risk of mortality, even after adjustment for severity of illness. Further studies are needed to determine benefits on clinical outcomes from the more consistent BG control from computer‐based titration protocols.
We acknowledge the following limitations in this multicenter open label study. First, this study was conducted in the medical ICU and excluded postsurgical patients and subjects expected to undergo a major surgical procedure during the hospital stay. Although a recent meta‐analysis9 of 26 studies involving 13,567 patients reported no benefits in the general ICU population, it found a favorable effect of intensive glycemic control on mortality in surgical ICU patients (relative risk [RR], 0.63; confidence interval [CI], 0.44‐0.91). We also excluded patients with severe renal insufficiency and patients with a history of hyperglycemic crises. In addition, our study was not powered to demonstrate differences in mortality or clinical outcome between treatment groups, and the BG targets used in this study were lower than glycemic targets recently recommended by the AACE and ADA inpatient glycemic control task force.25 Raising the BG targets is likely to reduce or prevent the rate of mild and severe hypoglycemic events in the ICU.
In conclusion, the computer‐guided algorithm resulted in a more rapid and tighter glycemic control with a similar rate of hypoglycemic events than the standard paper form protocol in medical ICU patients. Our study suggests that, both treatment algorithms are appropriate alternatives for the management of hyperglycemia in critically ill patients, and the choice depends on a physician's preferences, cost considerations, and the availability of the computer guided algorithm. Large randomized clinical trials are needed to test the impact of the new AACE/ADA recommended BG targets in reducing hypoglycemic events, hospital complications, and hospital mortality in critically ill patients in the ICU.
- ,,, et al.Management of diabetes and hyperglycemia in hospitals.Diabetes Care.2004;27:553–597.
- ,,,,,.Hyperglycemia: an independent marker of in‐hospital mortality in patients with undiagnosed diabetes.J Clin Endocrinol Metab.2002;87:978–982.
- ,,, et al.Intensive insulin therapy in the medical ICU.N Engl J Med.2006;354:449–461.
- ,,, et al.Intensive insulin therapy in the critically ill patients.N Engl J Med.2001;345:1359–1367.
- ,,, et al.Continuous insulin infusion reduces mortality in patients with diabetes undergoing coronary artery bypass grafting.J Thorac Cardiovasc Surg.2003;125:1007–1021.
- ,,, et al.Intensive insulin therapy and mortality among critically ill patients: a meta‐analysis including NICE‐SUGAR study data.CMAJ.2009;180:821–827.
- ,,, et al.Intensive versus conventional glucose control in critically ill patients.N Engl J Med.2009;360:1283–1297.
- ,,, et al.Intensive insulin therapy and pentastarch resuscitation in severe sepsis.N Engl J Med.2008;358:125–139.
- ,,, et al.Strict glycaemic control in patients hospitalised in a mixed medical and surgical intensive care unit: a randomised clinical trial.Crit Care.2008;12:R120.
- ,.Tight glucose control and hypoglycemia.Crit Care Med.2008;36:1391; author reply 1391–1392.
- ,.ICU care for patients with diabetes.Curr Opin Endocrinol Diabetes Obes.2004;11:75–81.
- ,,, et al.Implementation of a safe and effective insulin infusion protocol in a medical intensive care unit.Diabetes Care.2004;27:461–467.
- ,,.Glucommander: a computer‐directed intravenous insulin system shown to be safe, simple, and effective in 120,618 h of operation.Diabetes Care.2005;28:2418–2423.
- ,,, et al.Utilization of a computerized intravenous insulin infusion program to control blood glucose in the intensive care unit.Diabetes Technol Ther.2007;9:232–240.
- ,,, et al.Hyperglycemic crises in diabetes.Diabetes Care.2004;27Suppl 1:S94–S102.
- ,,, et al.Description and evaluation of a glycemic management protocol for patients with diabetes undergoing heart surgery.Endocr Pract.2002;8:10–18.
- ,,.Evidence for strict inpatient blood glucose control: time to revise glycemic goals in hospitalized patients.Metabolism.2008;57:116–120.
- ,,, et al.Intensive versus conventional insulin therapy: a randomized controlled trial in medical and surgical critically ill patients.Crit Care Med.2008;36:3190–3197.
- ,,.Benefits and risks of tight glucose control in critically ill adults: a meta‐analysis.JAMA.2008;300:933–944.
- ,.Severe hypoglycemia in critically ill patients: risk factors and outcomes.Crit Care Med.2007;35:2262–2267.
- ,,, et al.Evaluation and management of adult hypoglycemic disorders: an Endocrine Society Clinical Practice Guideline.J Clin Endocrinol Metab.2009;94:709–728.
- ,,, et al.Impact of tight glycemic control on cerebral glucose metabolism after severe brain injury: a microdialysis study.Crit Care Med.2008;36:3233–3238.
- ,,, et al.Proinflammatory cytokines in response to insulin‐induced hypoglycemic stress in healthy subjects.Metabolism.2009;58:443–448.
- ,,, et al.Blood glucose variability is associated with mortality in the surgical intensive care unit.Am Surg.2008;74:679–685; discussion685.
- ,,, et al.American Association of Clinical Endocrinologists and American Diabetes Association consensus statement on inpatient glycemic control.Diabetes Care.2009;32:1119–1131.
Observational studies in hospitalized patients with and without diabetes indicate that hyperglycemia is a predictor of poor clinical outcome and mortality.14 Early randomized controlled trials of intensified insulin therapy in patients with surgical and medical acute critical illness reported a reduction on the risk of multiorgan failure and systemic infections,35 as well as short‐ and long‐term mortality.1, 4 Recent randomized controlled trials, however, have failed to confirm the previously suggested benefits of intensive glucose control,6 and the large multicenter normoglycaemia in intensive care evaluation and survival using glucose algorithm regulation (NICE‐SUGAR) study reported an absolute increase in mortality rate with intensive glucose control.7 In addition, intensified insulin therapy in critically‐ill patients has been shown to be associated with a higher rate of severe hypoglycemic events than less aggressive glycemic control protocols.710 These results have led to a heightened interest in improving the quality and safety of the management of diabetes and hyperglycemia in the hospital.
The use of intravenous continuous insulin infusion (CII) is the preferred route of insulin administration for the management of hyperglycemia in the critical care setting.1, 11 Numerous examples of successful CII algorithms in achieving glycemic control are reported in the literature.4, 5, 12 Traditionally, order forms to titrate drip to achieve a target blood glucose (BG) range using an established algorithm or by the application of mathematical rules have been used in clinical practice. Recently, computer‐based algorithms aiming to direct the nursing staff adjusting insulin infusion rate have become commercially available.13, 14 It is not known, however, if computer‐based algorithms are superior to standard paper form‐based protocols in achieving glucose control and in reducing hypoglycemic events in critically‐ill patients. Accordingly, this multicenter randomized study aimed to determine differences in glycemic control and hypoglycemic events between treatment with a computer‐guided CII device and a standard column‐based paper algorithm in critically‐ill patients in the medical intensive care unit (ICU).
Research Design and Methods
In this multicenter, prospective, open‐label randomized study, 160 adult patients admitted to a medical ICU with new hyperglycemia or with a known history of diabetes treated with diet, insulin therapy or with any combination of oral antidiabetic agents were enrolled after written informed consent had been obtained from the patient or closest family member (Figure 1). Patients with known history of diabetes had 2 BG readings >120 mg/dL while subjects without a history of diabetes had 2 BG readings >140 mg/dL prior to enrollment. We excluded patients with acute hyperglycemic crises such as diabetic ketoacidosis (DKA) and hyperosmolar hyperglycemic state,15 patients with severely impaired renal function (serum creatinine 3.5 mg/dL), dementia, and pregnancy. This study was conducted at 4 hospital centers including Grady Memorial Hospital, Emory University Hospital, and Piedmont Hospital in Atlanta, Georgia and the Regional Medical Center in Memphis, Tennessee.
Patients were randomized using a computer randomization table to receive CII following a computer‐guided algorithm (Glucommander) or CII following a standard paper form insulin infusion algorithm. Both protocols used glulisine (Apidra) insulin and targeted a BG between 80 mg/dL and 120 mg/dL. Insulin management was directed by the specific assigned protocol and was carried out daily by the nursing staff and by members of the internal medicine residency program. The ICU physician and primary care team decided on the treatment for all other medical problem(s) for which patients were admitted. Data were collected during CII up to the first 10 days of ICU stay.
Standard and Computer‐Based CII Algorithms
The standard paper algorithm was adapted from a protocol initially published by Markovitz et al.16 (Supporting Information Appendix). The algorithm is divided into four columns based on empirically determined insulin sensitivity. The first algorithm column was for the most insulin‐sensitive patients, and the fourth algorithm column was for the most insulin resistant patients. The majority of patients started in the algorithm 1 column. Insulin‐resistant patients, such as those receiving glucocorticoids or receiving >80 units of insulin per day as outpatients, started in the algorithm 2 column. The insulin infusion rate was determined by the patient's BG level and was measured hourly until the patient was stable and within the target range. If BG targets were not achieved and the BG had not decreased by at least 60 mg/dL in the preceding hour, the patient was moved to the next column.
The characteristics and use of the Glucommander algorithm have been reported previously.13 In brief, this computer‐guided insulin algorithm directs the administration of intravenous insulin in response to BG measurement at the patient's bedside. In this study, the Glucommander program was loaded into a PalmOne (Zire 31, Tungsten E2 by Palm Inc.) handheld personal digital assistant (PDA) device. During the infusion, the nurse entered BG levels into the system and the computer recommended the insulin infusion rate and a variable time to check the next glucose testing. An alarm prompted the scheduled glucose check. The insulin infusion followed the formula: Insulin/Hour = Multiplier (BG 60). The initial multiplier or insulin sensitivity factor was 0.02. The Glucommander was programmed to adjust the multiplier to achieve and maintain target glucose.
Prior to the beginning of the study, the nursing staff at all institutions was instructed on the use of the Glucommander and paper form protocol. The insulin drip adjustment was carried out by ICU nurses in each hospital. Study investigators and coordinators rounded daily on study patients and were available for consultation and collecting data but were not involved in insulin adjustment based on the protocol.
Clinical Outcome Measures
The primary outcome of the study was to determine differences in glycemic control as measured by mean daily BG concentration between treatment groups. Secondary outcomes include differences between groups in number of hypoglycemic events (BG <60 mg/dL and <40 mg/dL), time to first glucose in target range, amount of insulin treatment (units/kg/hour), number and frequency of glucose measurements, length of stay (LOS) in the ICU and hospital, number of hyperglycemic episodes (BG >200 mg/dL), and mortality rate.
BG Monitoring
Capillary BG measurement in the standard paper protocol was performed hourly until it was within goal range for 4 hours and then every 2 hours for the duration of the infusion. Glucose measurements in the Glucommander arm were requested by the device at intervals that ranged from 20 minutes to 2 hours. The Glucommander software determined the interval between measurements based on the stability of the BG levels of the patient. The insulin infusion rate adjustment was based on the current glucose value and the slope of the glucose curve. The Glucommander alarmed at the appropriate interval to remind the nurse to check and enter the new BG value. If the BG was decreasing faster than expected, the program called for repeat BG measurements more frequently for insulin drip adjustment. If the BG was within target range for 4 consecutive readings, the Glucommander alarmed for repeat BG every 2 hours.
Laboratory Assays
Plasma glucose and glycosylated hemoglobin (HbA1c) were measured on admission. Complete blood count and complete metabolic profile were measured on admission and as otherwise determined by the treating physician.
Statistical Analysis
All data in the text, table and figures are expressed as mean standard deviation. Comparison between groups was carried out by nonparametric two‐sample Wilcoxon tests for continuous variables and chi‐square tests (or Fisher's exact tests) for categorical variables. Cochran‐Mantel‐Haenszel (CMH) or CMH exact tests were further used to adjust for site difference. Repeated measures analyses were conducted to model the probability of BG <60 mg/dL or BG<40 mg/dL based on generalized linear model with AR(1) within‐subject correlation structure. A P value <0.05 is considered as significant. We expected differences in mean BG concentration 30 mg/dL between groups. Assuming 2‐tailed alpha of 0.05, a standard deviation of approximately 40, and a one‐to‐one allocation and no subject attrition, 80 patients per treatment group were thought to be sufficient to achieve 80% power for group mean comparisons. Statistical significance was defined as a type 1 error of 0.05. Statistical analysis was performed using the SAS 9.2.
Results
The admission characteristics and clinical outcomes of interest of the study patients are shown in Table 1. A total of 160 adult patients admitted to a medical ICU with new hyperglycemia (47%) or with a known history of diabetes (53%) were randomized into the study. Of them, 7 patients were excluded due to withdrawal of consent, treatment with subcutaneous basal or supplemental short‐acting insulin during CII, or receiving less than 4 hours of CII. There were no differences in the mean age, gender, race, history of diabetes, or primary admitting diagnosis between treatment groups. The most common admitting diagnosis categories included pulmonary (22.1%), cardiovascular (21.4%), infectious (20.0%), and central nervous system (16.6%) disorders.
| Glucommander (# patients = 77) | Standard (# patients = 76) | P Value | |
|---|---|---|---|
| |||
| Age (years) | 57.8 11.0 | 58.5 13.4 | NS |
| Gender (M/F), % | 57.1/42.9 | 51.3/46.7 | NS |
| Race (W/B/H), % | 25.0/69.6/1.8 | 28.9/67.3/3.9 | NS |
| BMI (Kg/m2) | 31.6 10.4 | 30.5 8.1 | NS |
| Primary admitting diagnosis: | |||
| Cardiovascular, % | 24.7 | 18.1 | NS |
| Pulmonary, % | 24.7 | 19.4 | NS |
| Infection, % | 16.4 | 23.6 | NS |
| Cerebro‐vascular, % | 4.1 | 4.2 | NS |
| Renal, % | 1.4 | 1.4 | NS |
| Apache score | 13.4 6.1 | 16.0 8.3 | NS |
| History of diabetes, % | 53.3 | 54.3 | NS |
| Hemoglobin A1c (%) | 7.2 1.9 | 6.8 1.4 | NS |
| DM patients | 7.9 2.2 | 7.3 1.6 | NS |
| Non‐DM patients | 6.2 0.7 | 6.0 0.7 | NS |
The mean admission glucose concentration for study patients was 190.6 58.2 mg/dL and the mean A1C was 7.0 1.7%. Glycemic control parameters achieved with the CII protocols are listed in Table 2. At the start of CII, the mean BG value was similar for the Glucommander and paper protocols (189.7 64.8 mg/dL and 188.4 54.8 mg/dL, P = 0.419). The mean time to reach the BG target was shorter in the Glucommander group (4.8 2.8 vs. 7.8 9.1 hours, P < 0.001). The Glucommander group had a lower mean glucose value during insulin infusion (115.5 20.7 vs. 131.0 24.6 mg/dL, P < 0.001) and once at target goal, in a lower mean BG values (103.3 8.8 vs. 117.3 16.5 mg/dL, P < 0.001) than the standard algorithm (Figure 2). The mean inpatient BG difference between treatment groups was 15.5 mg/dL (P < 0.001), with a mean daily BG difference ranging from 17.4 mg/dL to 24.4 mg/dL less for the Glucommander group during days 2 to 6 of therapy (P < 0.01).
| Glucommander (# patients = 77) | Standard (# patients = 76) | Mean Difference (CI) or P Value | |
|---|---|---|---|
| |||
| Initial glucose (mg/dL) | 189.7 64.8 | 188.3 54.8 | 1.333 (17.701, 20.367) |
| Median (range) duration of CII (hours) | 46 (12‐240) | 47 (5‐240) | 12.939 (34.630, 8,752) |
| Insulin infusion rate (units/Kg/hour) | 0.035 0.024 | 0.028 0.021 | 0.006 (0.002, 0.014) |
| Time to achieve target BG of 80‐120 mg/dL (hours) | 4.8 2.8 | 7.8 9.1 | 3.0 (5.2, 0.9) |
| Mean BG maintained once target achieved (mg/dL) | 103.3 8.8 | 117.3 16.5 | 14.0 (18.210, 9.774) |
| % of BG tests within target range | 71.0 17.0% | 51.3 19.7% | 19.6 (13.7, 25.5) |
| Mild hypoglycemia, <60 mg/dL, n (% patients) | 33 (42.9) | 23 (31.9) | NS |
| Severe hypoglycemia, <40 mg/dL, n (% patients) | 3 (3.9) | 4 (5.6) | NS |
| Hyperglycemia, >200 mg/dL, n (% patients) | 9 (11.7) | 18 (25.0) | 0.054 |
The Glucommander algorithm was associated with tighter glycemic control and less glucose variability than the standard paper form protocol. Once patients achieved BG target, on average 71.1% of BG readings in the Glucommander and 51.3% in the standard group remained within the 80 mg/dL to 120 mg/dL target range (P < 0.001). In addition, the Glucommander was associated with a significantly lower rate of severe hyperglycemia during insulin infusion. The number of patients with 1 or more episodes of BG >200 mg/dL (11.7% vs. 25%, P = 0.057 before adjusting for potential site difference and P = 0.034 after adjusting for site difference) were less in the Glucommander group than in the standard paper regimen. In addition, 4 of these patients in spite of being on the highest insulin delivery column failed to achieve glucoses <180 and had an average in‐hospital glucose level of 204.5 32.2 mg/dL. These patients were transitioned to the Glucommander arm and withdrawn from the study. All episodes of hypoglycemia occurred after the patients achieved 1 glucose measurement within the target range. The number of patients who experienced one or more BG <40 mg/dL and <60 mg/dL was 3.9% and 42.9% in the Glucommander and 5.6% and 31.9% in the standard regimen, respectively (both, P = not significant [NS]). Similar results were obtained when site effect was accommodated (both, P = NS). Based on repeated measures analyses, the probabilities of BG reading <40 mg/dL or <60 mg/dL were not significantly different between groups (P = 0.969, P = 0.084) after accounting for within‐patient correlations with or without adjusting for time effect. None of these episodes resulted in seizures or were otherwise judged to be associated with deterioration of clinical status.
The mean insulin infusion rate was slightly higher in the Glucommander regimen but the difference was not statistically significant between groups. Patients treated with the Glucommander protocol received a mean infusion rate of 0.035 0.024 unit/kg/hour for a total of 2.85 1.93 units per hour, and those treated with the paper protocol received a 0.028 0.021 units/kg/hour for a total of 2.50 2.28 units per hour, P = 0.12 and P = 0.09, respectively.
The numbers of BG measurements were similar between the Glucommander and standard paper algorithms (44.2 39.8 and 41.2 34.5 respectively, P = NS) with the number of glucose testing per patient ranging from 6 to 175 in the Glucommander and 3 to 168 in the standard group. Similarly, when normalized to the duration of insulin infusion, the frequency of BG monitoring was not different with the protocols (0.68 0.18 and 0.62 0.22 tests/hour respectively, P = NS).
Compared to the standard paper insulin infusion algorithm, patients treated with the Glucommander device had a similar mean ICU LOS (13.4 13.8 vs. 8.5 7.6 days, P = 0.145), mean hospital LOS (17.5 15.0 days vs. 23.9 26.3 days, P = 0.704) and hospital mortality (26.0% vs. 21.9%, P = 0.561).
Discussion
This study is the first to compare the safety and efficacy of a CII via a computer‐guided algorithm and a standard paper form protocol in nonsurgical patients in the ICU. Both treatment algorithms resulted in significant improvement in glycemic control with the Glucommander achieving glycemic glucose target in a shorter time of treatment, a lower mean glucose concentration, and in greater percentage of glucose measurements maintained within target range, without an increased risk of severe hypoglycemia compared to the standard paper protocol.
Hyperglycemia in hospitalized patients is a common, serious, and costly health care problem. Evidence from observational and interventional studies indicate that hyperglycemia in critical illness is associated with an increased risk of complications and mortality.25 There is ongoing debate, however, about the optimal glucose level in hospitalized patients with critical illness. Although, several cohort studies as well as early randomized trials in ICU patients reported that intensified insulin treatment to achieve a target glucose between 80 mg/dL to 110 mg/dL reported a reduction in short‐term and long‐term mortality and rates of multiorgan failure and systemic infections compared with conventionally treated patients.3, 4, 17 More recent randomized controlled trials and meta‐analyses, however, have shown that this low BG target has been difficult to achieve without increasing the risk for severe hypoglycemia.710 In addition, recent multicenter trials have failed to show significant improvement in clinical outcome or have even shown increased mortality risk with intensive glycemic control.610 Based on these reports, the American Association of Clinical Endocrinologist (AACE) and American Diabetes Association (ADA) task force on inpatient glycemic control recommended different glycemic targets in the ICU setting. Current guidelines suggest targeting a BG level between 140 mg/dL and 180 mg/dL (7.8 and 10.0 mmol/L) for the majority of ICU patients and a lower glucose targets between 110 mg/dL and 140 mg/dL (6.1 and 7.8 mmol/L) in selected ICU patients (ie, centers with extensive experience and appropriate nursing support, cardiac surgical patients, patients with stable glycemic control without hypoglycemia). Glucose targets >180 mg/dL or <110 mg/dL are no longer recommended in ICU patients.
The rate of severe hypoglycemic events (<40 mg/dL) observed in both arms of our trial was significantly lower than those reported in recent international trials of intensive glycemic control.3, 4, 8 The overall rate of severe hypoglycemic events in international trials ranged between 5% to 28.6%.3, 4, 7, 8, 18, 19 In this trial, the number of patients with severe hypoglycemia was 3.9% in the computer‐based and 5.6% in the standard paper algorithm. Repeated measures analyses show the probabilities of BG readings <40 mg/dL were similar and not significantly different between groups (P = 0.969). We observed, however, a high rate of mild hypoglycemic events in patients treated with both insulin algorithms. The number of patients with BG <60 mg/dL was 42.9% in the Glucommander and 31.9% in the standard (P = NS). Minimizing the rate of hypoglycemia events is of major importance in hospitalized patients because it has been shown that hypoglycemia may be an independent risk factor of poor clinical outcome and mortality.20 Hypoglycemia may increase the risk of ventricular arrhythmias, in part due to the prolongation QT interval21 and can impair cerebral glucose metabolism resulting in brain metabolic dysfunction, as suggested by recent clinical studies.22 Moreover, insulin‐induced hypoglycemia is also associated with increased proinflammatory cytokines (tumor necrosis factor [TNF]‐alpha, interleukin [IL]‐1beta, IL‐6, and IL‐8) and oxidative stress23 that correlate with elevations of counterregulatory hormones (catecholamines, cortisol).
The Glucommander was associated with lower glycemic variability and with a higher percentage of BG readings within target range than patients treated with the standard paper form regimen. The clinical importance of the degree of variability and rapidity of fluctuations in glucose levels in critically ill patients is a topic of recent interest. Glycemic variability has been identified as a strong independent contributor to the risk of mortality in critically ill and surgical patients.24 Low levels of glycemic variability (standard deviation [SD] <10 mg/dL or 10‐20 mg/dL) have been shown to have a statistically significant lower risk of mortality, even after adjustment for severity of illness. Further studies are needed to determine benefits on clinical outcomes from the more consistent BG control from computer‐based titration protocols.
We acknowledge the following limitations in this multicenter open label study. First, this study was conducted in the medical ICU and excluded postsurgical patients and subjects expected to undergo a major surgical procedure during the hospital stay. Although a recent meta‐analysis9 of 26 studies involving 13,567 patients reported no benefits in the general ICU population, it found a favorable effect of intensive glycemic control on mortality in surgical ICU patients (relative risk [RR], 0.63; confidence interval [CI], 0.44‐0.91). We also excluded patients with severe renal insufficiency and patients with a history of hyperglycemic crises. In addition, our study was not powered to demonstrate differences in mortality or clinical outcome between treatment groups, and the BG targets used in this study were lower than glycemic targets recently recommended by the AACE and ADA inpatient glycemic control task force.25 Raising the BG targets is likely to reduce or prevent the rate of mild and severe hypoglycemic events in the ICU.
In conclusion, the computer‐guided algorithm resulted in a more rapid and tighter glycemic control with a similar rate of hypoglycemic events than the standard paper form protocol in medical ICU patients. Our study suggests that, both treatment algorithms are appropriate alternatives for the management of hyperglycemia in critically ill patients, and the choice depends on a physician's preferences, cost considerations, and the availability of the computer guided algorithm. Large randomized clinical trials are needed to test the impact of the new AACE/ADA recommended BG targets in reducing hypoglycemic events, hospital complications, and hospital mortality in critically ill patients in the ICU.
Observational studies in hospitalized patients with and without diabetes indicate that hyperglycemia is a predictor of poor clinical outcome and mortality.14 Early randomized controlled trials of intensified insulin therapy in patients with surgical and medical acute critical illness reported a reduction on the risk of multiorgan failure and systemic infections,35 as well as short‐ and long‐term mortality.1, 4 Recent randomized controlled trials, however, have failed to confirm the previously suggested benefits of intensive glucose control,6 and the large multicenter normoglycaemia in intensive care evaluation and survival using glucose algorithm regulation (NICE‐SUGAR) study reported an absolute increase in mortality rate with intensive glucose control.7 In addition, intensified insulin therapy in critically‐ill patients has been shown to be associated with a higher rate of severe hypoglycemic events than less aggressive glycemic control protocols.710 These results have led to a heightened interest in improving the quality and safety of the management of diabetes and hyperglycemia in the hospital.
The use of intravenous continuous insulin infusion (CII) is the preferred route of insulin administration for the management of hyperglycemia in the critical care setting.1, 11 Numerous examples of successful CII algorithms in achieving glycemic control are reported in the literature.4, 5, 12 Traditionally, order forms to titrate drip to achieve a target blood glucose (BG) range using an established algorithm or by the application of mathematical rules have been used in clinical practice. Recently, computer‐based algorithms aiming to direct the nursing staff adjusting insulin infusion rate have become commercially available.13, 14 It is not known, however, if computer‐based algorithms are superior to standard paper form‐based protocols in achieving glucose control and in reducing hypoglycemic events in critically‐ill patients. Accordingly, this multicenter randomized study aimed to determine differences in glycemic control and hypoglycemic events between treatment with a computer‐guided CII device and a standard column‐based paper algorithm in critically‐ill patients in the medical intensive care unit (ICU).
Research Design and Methods
In this multicenter, prospective, open‐label randomized study, 160 adult patients admitted to a medical ICU with new hyperglycemia or with a known history of diabetes treated with diet, insulin therapy or with any combination of oral antidiabetic agents were enrolled after written informed consent had been obtained from the patient or closest family member (Figure 1). Patients with known history of diabetes had 2 BG readings >120 mg/dL while subjects without a history of diabetes had 2 BG readings >140 mg/dL prior to enrollment. We excluded patients with acute hyperglycemic crises such as diabetic ketoacidosis (DKA) and hyperosmolar hyperglycemic state,15 patients with severely impaired renal function (serum creatinine 3.5 mg/dL), dementia, and pregnancy. This study was conducted at 4 hospital centers including Grady Memorial Hospital, Emory University Hospital, and Piedmont Hospital in Atlanta, Georgia and the Regional Medical Center in Memphis, Tennessee.
Patients were randomized using a computer randomization table to receive CII following a computer‐guided algorithm (Glucommander) or CII following a standard paper form insulin infusion algorithm. Both protocols used glulisine (Apidra) insulin and targeted a BG between 80 mg/dL and 120 mg/dL. Insulin management was directed by the specific assigned protocol and was carried out daily by the nursing staff and by members of the internal medicine residency program. The ICU physician and primary care team decided on the treatment for all other medical problem(s) for which patients were admitted. Data were collected during CII up to the first 10 days of ICU stay.
Standard and Computer‐Based CII Algorithms
The standard paper algorithm was adapted from a protocol initially published by Markovitz et al.16 (Supporting Information Appendix). The algorithm is divided into four columns based on empirically determined insulin sensitivity. The first algorithm column was for the most insulin‐sensitive patients, and the fourth algorithm column was for the most insulin resistant patients. The majority of patients started in the algorithm 1 column. Insulin‐resistant patients, such as those receiving glucocorticoids or receiving >80 units of insulin per day as outpatients, started in the algorithm 2 column. The insulin infusion rate was determined by the patient's BG level and was measured hourly until the patient was stable and within the target range. If BG targets were not achieved and the BG had not decreased by at least 60 mg/dL in the preceding hour, the patient was moved to the next column.
The characteristics and use of the Glucommander algorithm have been reported previously.13 In brief, this computer‐guided insulin algorithm directs the administration of intravenous insulin in response to BG measurement at the patient's bedside. In this study, the Glucommander program was loaded into a PalmOne (Zire 31, Tungsten E2 by Palm Inc.) handheld personal digital assistant (PDA) device. During the infusion, the nurse entered BG levels into the system and the computer recommended the insulin infusion rate and a variable time to check the next glucose testing. An alarm prompted the scheduled glucose check. The insulin infusion followed the formula: Insulin/Hour = Multiplier (BG 60). The initial multiplier or insulin sensitivity factor was 0.02. The Glucommander was programmed to adjust the multiplier to achieve and maintain target glucose.
Prior to the beginning of the study, the nursing staff at all institutions was instructed on the use of the Glucommander and paper form protocol. The insulin drip adjustment was carried out by ICU nurses in each hospital. Study investigators and coordinators rounded daily on study patients and were available for consultation and collecting data but were not involved in insulin adjustment based on the protocol.
Clinical Outcome Measures
The primary outcome of the study was to determine differences in glycemic control as measured by mean daily BG concentration between treatment groups. Secondary outcomes include differences between groups in number of hypoglycemic events (BG <60 mg/dL and <40 mg/dL), time to first glucose in target range, amount of insulin treatment (units/kg/hour), number and frequency of glucose measurements, length of stay (LOS) in the ICU and hospital, number of hyperglycemic episodes (BG >200 mg/dL), and mortality rate.
BG Monitoring
Capillary BG measurement in the standard paper protocol was performed hourly until it was within goal range for 4 hours and then every 2 hours for the duration of the infusion. Glucose measurements in the Glucommander arm were requested by the device at intervals that ranged from 20 minutes to 2 hours. The Glucommander software determined the interval between measurements based on the stability of the BG levels of the patient. The insulin infusion rate adjustment was based on the current glucose value and the slope of the glucose curve. The Glucommander alarmed at the appropriate interval to remind the nurse to check and enter the new BG value. If the BG was decreasing faster than expected, the program called for repeat BG measurements more frequently for insulin drip adjustment. If the BG was within target range for 4 consecutive readings, the Glucommander alarmed for repeat BG every 2 hours.
Laboratory Assays
Plasma glucose and glycosylated hemoglobin (HbA1c) were measured on admission. Complete blood count and complete metabolic profile were measured on admission and as otherwise determined by the treating physician.
Statistical Analysis
All data in the text, table and figures are expressed as mean standard deviation. Comparison between groups was carried out by nonparametric two‐sample Wilcoxon tests for continuous variables and chi‐square tests (or Fisher's exact tests) for categorical variables. Cochran‐Mantel‐Haenszel (CMH) or CMH exact tests were further used to adjust for site difference. Repeated measures analyses were conducted to model the probability of BG <60 mg/dL or BG<40 mg/dL based on generalized linear model with AR(1) within‐subject correlation structure. A P value <0.05 is considered as significant. We expected differences in mean BG concentration 30 mg/dL between groups. Assuming 2‐tailed alpha of 0.05, a standard deviation of approximately 40, and a one‐to‐one allocation and no subject attrition, 80 patients per treatment group were thought to be sufficient to achieve 80% power for group mean comparisons. Statistical significance was defined as a type 1 error of 0.05. Statistical analysis was performed using the SAS 9.2.
Results
The admission characteristics and clinical outcomes of interest of the study patients are shown in Table 1. A total of 160 adult patients admitted to a medical ICU with new hyperglycemia (47%) or with a known history of diabetes (53%) were randomized into the study. Of them, 7 patients were excluded due to withdrawal of consent, treatment with subcutaneous basal or supplemental short‐acting insulin during CII, or receiving less than 4 hours of CII. There were no differences in the mean age, gender, race, history of diabetes, or primary admitting diagnosis between treatment groups. The most common admitting diagnosis categories included pulmonary (22.1%), cardiovascular (21.4%), infectious (20.0%), and central nervous system (16.6%) disorders.
| Glucommander (# patients = 77) | Standard (# patients = 76) | P Value | |
|---|---|---|---|
| |||
| Age (years) | 57.8 11.0 | 58.5 13.4 | NS |
| Gender (M/F), % | 57.1/42.9 | 51.3/46.7 | NS |
| Race (W/B/H), % | 25.0/69.6/1.8 | 28.9/67.3/3.9 | NS |
| BMI (Kg/m2) | 31.6 10.4 | 30.5 8.1 | NS |
| Primary admitting diagnosis: | |||
| Cardiovascular, % | 24.7 | 18.1 | NS |
| Pulmonary, % | 24.7 | 19.4 | NS |
| Infection, % | 16.4 | 23.6 | NS |
| Cerebro‐vascular, % | 4.1 | 4.2 | NS |
| Renal, % | 1.4 | 1.4 | NS |
| Apache score | 13.4 6.1 | 16.0 8.3 | NS |
| History of diabetes, % | 53.3 | 54.3 | NS |
| Hemoglobin A1c (%) | 7.2 1.9 | 6.8 1.4 | NS |
| DM patients | 7.9 2.2 | 7.3 1.6 | NS |
| Non‐DM patients | 6.2 0.7 | 6.0 0.7 | NS |
The mean admission glucose concentration for study patients was 190.6 58.2 mg/dL and the mean A1C was 7.0 1.7%. Glycemic control parameters achieved with the CII protocols are listed in Table 2. At the start of CII, the mean BG value was similar for the Glucommander and paper protocols (189.7 64.8 mg/dL and 188.4 54.8 mg/dL, P = 0.419). The mean time to reach the BG target was shorter in the Glucommander group (4.8 2.8 vs. 7.8 9.1 hours, P < 0.001). The Glucommander group had a lower mean glucose value during insulin infusion (115.5 20.7 vs. 131.0 24.6 mg/dL, P < 0.001) and once at target goal, in a lower mean BG values (103.3 8.8 vs. 117.3 16.5 mg/dL, P < 0.001) than the standard algorithm (Figure 2). The mean inpatient BG difference between treatment groups was 15.5 mg/dL (P < 0.001), with a mean daily BG difference ranging from 17.4 mg/dL to 24.4 mg/dL less for the Glucommander group during days 2 to 6 of therapy (P < 0.01).
| Glucommander (# patients = 77) | Standard (# patients = 76) | Mean Difference (CI) or P Value | |
|---|---|---|---|
| |||
| Initial glucose (mg/dL) | 189.7 64.8 | 188.3 54.8 | 1.333 (17.701, 20.367) |
| Median (range) duration of CII (hours) | 46 (12‐240) | 47 (5‐240) | 12.939 (34.630, 8,752) |
| Insulin infusion rate (units/Kg/hour) | 0.035 0.024 | 0.028 0.021 | 0.006 (0.002, 0.014) |
| Time to achieve target BG of 80‐120 mg/dL (hours) | 4.8 2.8 | 7.8 9.1 | 3.0 (5.2, 0.9) |
| Mean BG maintained once target achieved (mg/dL) | 103.3 8.8 | 117.3 16.5 | 14.0 (18.210, 9.774) |
| % of BG tests within target range | 71.0 17.0% | 51.3 19.7% | 19.6 (13.7, 25.5) |
| Mild hypoglycemia, <60 mg/dL, n (% patients) | 33 (42.9) | 23 (31.9) | NS |
| Severe hypoglycemia, <40 mg/dL, n (% patients) | 3 (3.9) | 4 (5.6) | NS |
| Hyperglycemia, >200 mg/dL, n (% patients) | 9 (11.7) | 18 (25.0) | 0.054 |
The Glucommander algorithm was associated with tighter glycemic control and less glucose variability than the standard paper form protocol. Once patients achieved BG target, on average 71.1% of BG readings in the Glucommander and 51.3% in the standard group remained within the 80 mg/dL to 120 mg/dL target range (P < 0.001). In addition, the Glucommander was associated with a significantly lower rate of severe hyperglycemia during insulin infusion. The number of patients with 1 or more episodes of BG >200 mg/dL (11.7% vs. 25%, P = 0.057 before adjusting for potential site difference and P = 0.034 after adjusting for site difference) were less in the Glucommander group than in the standard paper regimen. In addition, 4 of these patients in spite of being on the highest insulin delivery column failed to achieve glucoses <180 and had an average in‐hospital glucose level of 204.5 32.2 mg/dL. These patients were transitioned to the Glucommander arm and withdrawn from the study. All episodes of hypoglycemia occurred after the patients achieved 1 glucose measurement within the target range. The number of patients who experienced one or more BG <40 mg/dL and <60 mg/dL was 3.9% and 42.9% in the Glucommander and 5.6% and 31.9% in the standard regimen, respectively (both, P = not significant [NS]). Similar results were obtained when site effect was accommodated (both, P = NS). Based on repeated measures analyses, the probabilities of BG reading <40 mg/dL or <60 mg/dL were not significantly different between groups (P = 0.969, P = 0.084) after accounting for within‐patient correlations with or without adjusting for time effect. None of these episodes resulted in seizures or were otherwise judged to be associated with deterioration of clinical status.
The mean insulin infusion rate was slightly higher in the Glucommander regimen but the difference was not statistically significant between groups. Patients treated with the Glucommander protocol received a mean infusion rate of 0.035 0.024 unit/kg/hour for a total of 2.85 1.93 units per hour, and those treated with the paper protocol received a 0.028 0.021 units/kg/hour for a total of 2.50 2.28 units per hour, P = 0.12 and P = 0.09, respectively.
The numbers of BG measurements were similar between the Glucommander and standard paper algorithms (44.2 39.8 and 41.2 34.5 respectively, P = NS) with the number of glucose testing per patient ranging from 6 to 175 in the Glucommander and 3 to 168 in the standard group. Similarly, when normalized to the duration of insulin infusion, the frequency of BG monitoring was not different with the protocols (0.68 0.18 and 0.62 0.22 tests/hour respectively, P = NS).
Compared to the standard paper insulin infusion algorithm, patients treated with the Glucommander device had a similar mean ICU LOS (13.4 13.8 vs. 8.5 7.6 days, P = 0.145), mean hospital LOS (17.5 15.0 days vs. 23.9 26.3 days, P = 0.704) and hospital mortality (26.0% vs. 21.9%, P = 0.561).
Discussion
This study is the first to compare the safety and efficacy of a CII via a computer‐guided algorithm and a standard paper form protocol in nonsurgical patients in the ICU. Both treatment algorithms resulted in significant improvement in glycemic control with the Glucommander achieving glycemic glucose target in a shorter time of treatment, a lower mean glucose concentration, and in greater percentage of glucose measurements maintained within target range, without an increased risk of severe hypoglycemia compared to the standard paper protocol.
Hyperglycemia in hospitalized patients is a common, serious, and costly health care problem. Evidence from observational and interventional studies indicate that hyperglycemia in critical illness is associated with an increased risk of complications and mortality.25 There is ongoing debate, however, about the optimal glucose level in hospitalized patients with critical illness. Although, several cohort studies as well as early randomized trials in ICU patients reported that intensified insulin treatment to achieve a target glucose between 80 mg/dL to 110 mg/dL reported a reduction in short‐term and long‐term mortality and rates of multiorgan failure and systemic infections compared with conventionally treated patients.3, 4, 17 More recent randomized controlled trials and meta‐analyses, however, have shown that this low BG target has been difficult to achieve without increasing the risk for severe hypoglycemia.710 In addition, recent multicenter trials have failed to show significant improvement in clinical outcome or have even shown increased mortality risk with intensive glycemic control.610 Based on these reports, the American Association of Clinical Endocrinologist (AACE) and American Diabetes Association (ADA) task force on inpatient glycemic control recommended different glycemic targets in the ICU setting. Current guidelines suggest targeting a BG level between 140 mg/dL and 180 mg/dL (7.8 and 10.0 mmol/L) for the majority of ICU patients and a lower glucose targets between 110 mg/dL and 140 mg/dL (6.1 and 7.8 mmol/L) in selected ICU patients (ie, centers with extensive experience and appropriate nursing support, cardiac surgical patients, patients with stable glycemic control without hypoglycemia). Glucose targets >180 mg/dL or <110 mg/dL are no longer recommended in ICU patients.
The rate of severe hypoglycemic events (<40 mg/dL) observed in both arms of our trial was significantly lower than those reported in recent international trials of intensive glycemic control.3, 4, 8 The overall rate of severe hypoglycemic events in international trials ranged between 5% to 28.6%.3, 4, 7, 8, 18, 19 In this trial, the number of patients with severe hypoglycemia was 3.9% in the computer‐based and 5.6% in the standard paper algorithm. Repeated measures analyses show the probabilities of BG readings <40 mg/dL were similar and not significantly different between groups (P = 0.969). We observed, however, a high rate of mild hypoglycemic events in patients treated with both insulin algorithms. The number of patients with BG <60 mg/dL was 42.9% in the Glucommander and 31.9% in the standard (P = NS). Minimizing the rate of hypoglycemia events is of major importance in hospitalized patients because it has been shown that hypoglycemia may be an independent risk factor of poor clinical outcome and mortality.20 Hypoglycemia may increase the risk of ventricular arrhythmias, in part due to the prolongation QT interval21 and can impair cerebral glucose metabolism resulting in brain metabolic dysfunction, as suggested by recent clinical studies.22 Moreover, insulin‐induced hypoglycemia is also associated with increased proinflammatory cytokines (tumor necrosis factor [TNF]‐alpha, interleukin [IL]‐1beta, IL‐6, and IL‐8) and oxidative stress23 that correlate with elevations of counterregulatory hormones (catecholamines, cortisol).
The Glucommander was associated with lower glycemic variability and with a higher percentage of BG readings within target range than patients treated with the standard paper form regimen. The clinical importance of the degree of variability and rapidity of fluctuations in glucose levels in critically ill patients is a topic of recent interest. Glycemic variability has been identified as a strong independent contributor to the risk of mortality in critically ill and surgical patients.24 Low levels of glycemic variability (standard deviation [SD] <10 mg/dL or 10‐20 mg/dL) have been shown to have a statistically significant lower risk of mortality, even after adjustment for severity of illness. Further studies are needed to determine benefits on clinical outcomes from the more consistent BG control from computer‐based titration protocols.
We acknowledge the following limitations in this multicenter open label study. First, this study was conducted in the medical ICU and excluded postsurgical patients and subjects expected to undergo a major surgical procedure during the hospital stay. Although a recent meta‐analysis9 of 26 studies involving 13,567 patients reported no benefits in the general ICU population, it found a favorable effect of intensive glycemic control on mortality in surgical ICU patients (relative risk [RR], 0.63; confidence interval [CI], 0.44‐0.91). We also excluded patients with severe renal insufficiency and patients with a history of hyperglycemic crises. In addition, our study was not powered to demonstrate differences in mortality or clinical outcome between treatment groups, and the BG targets used in this study were lower than glycemic targets recently recommended by the AACE and ADA inpatient glycemic control task force.25 Raising the BG targets is likely to reduce or prevent the rate of mild and severe hypoglycemic events in the ICU.
In conclusion, the computer‐guided algorithm resulted in a more rapid and tighter glycemic control with a similar rate of hypoglycemic events than the standard paper form protocol in medical ICU patients. Our study suggests that, both treatment algorithms are appropriate alternatives for the management of hyperglycemia in critically ill patients, and the choice depends on a physician's preferences, cost considerations, and the availability of the computer guided algorithm. Large randomized clinical trials are needed to test the impact of the new AACE/ADA recommended BG targets in reducing hypoglycemic events, hospital complications, and hospital mortality in critically ill patients in the ICU.
- ,,, et al.Management of diabetes and hyperglycemia in hospitals.Diabetes Care.2004;27:553–597.
- ,,,,,.Hyperglycemia: an independent marker of in‐hospital mortality in patients with undiagnosed diabetes.J Clin Endocrinol Metab.2002;87:978–982.
- ,,, et al.Intensive insulin therapy in the medical ICU.N Engl J Med.2006;354:449–461.
- ,,, et al.Intensive insulin therapy in the critically ill patients.N Engl J Med.2001;345:1359–1367.
- ,,, et al.Continuous insulin infusion reduces mortality in patients with diabetes undergoing coronary artery bypass grafting.J Thorac Cardiovasc Surg.2003;125:1007–1021.
- ,,, et al.Intensive insulin therapy and mortality among critically ill patients: a meta‐analysis including NICE‐SUGAR study data.CMAJ.2009;180:821–827.
- ,,, et al.Intensive versus conventional glucose control in critically ill patients.N Engl J Med.2009;360:1283–1297.
- ,,, et al.Intensive insulin therapy and pentastarch resuscitation in severe sepsis.N Engl J Med.2008;358:125–139.
- ,,, et al.Strict glycaemic control in patients hospitalised in a mixed medical and surgical intensive care unit: a randomised clinical trial.Crit Care.2008;12:R120.
- ,.Tight glucose control and hypoglycemia.Crit Care Med.2008;36:1391; author reply 1391–1392.
- ,.ICU care for patients with diabetes.Curr Opin Endocrinol Diabetes Obes.2004;11:75–81.
- ,,, et al.Implementation of a safe and effective insulin infusion protocol in a medical intensive care unit.Diabetes Care.2004;27:461–467.
- ,,.Glucommander: a computer‐directed intravenous insulin system shown to be safe, simple, and effective in 120,618 h of operation.Diabetes Care.2005;28:2418–2423.
- ,,, et al.Utilization of a computerized intravenous insulin infusion program to control blood glucose in the intensive care unit.Diabetes Technol Ther.2007;9:232–240.
- ,,, et al.Hyperglycemic crises in diabetes.Diabetes Care.2004;27Suppl 1:S94–S102.
- ,,, et al.Description and evaluation of a glycemic management protocol for patients with diabetes undergoing heart surgery.Endocr Pract.2002;8:10–18.
- ,,.Evidence for strict inpatient blood glucose control: time to revise glycemic goals in hospitalized patients.Metabolism.2008;57:116–120.
- ,,, et al.Intensive versus conventional insulin therapy: a randomized controlled trial in medical and surgical critically ill patients.Crit Care Med.2008;36:3190–3197.
- ,,.Benefits and risks of tight glucose control in critically ill adults: a meta‐analysis.JAMA.2008;300:933–944.
- ,.Severe hypoglycemia in critically ill patients: risk factors and outcomes.Crit Care Med.2007;35:2262–2267.
- ,,, et al.Evaluation and management of adult hypoglycemic disorders: an Endocrine Society Clinical Practice Guideline.J Clin Endocrinol Metab.2009;94:709–728.
- ,,, et al.Impact of tight glycemic control on cerebral glucose metabolism after severe brain injury: a microdialysis study.Crit Care Med.2008;36:3233–3238.
- ,,, et al.Proinflammatory cytokines in response to insulin‐induced hypoglycemic stress in healthy subjects.Metabolism.2009;58:443–448.
- ,,, et al.Blood glucose variability is associated with mortality in the surgical intensive care unit.Am Surg.2008;74:679–685; discussion685.
- ,,, et al.American Association of Clinical Endocrinologists and American Diabetes Association consensus statement on inpatient glycemic control.Diabetes Care.2009;32:1119–1131.
- ,,, et al.Management of diabetes and hyperglycemia in hospitals.Diabetes Care.2004;27:553–597.
- ,,,,,.Hyperglycemia: an independent marker of in‐hospital mortality in patients with undiagnosed diabetes.J Clin Endocrinol Metab.2002;87:978–982.
- ,,, et al.Intensive insulin therapy in the medical ICU.N Engl J Med.2006;354:449–461.
- ,,, et al.Intensive insulin therapy in the critically ill patients.N Engl J Med.2001;345:1359–1367.
- ,,, et al.Continuous insulin infusion reduces mortality in patients with diabetes undergoing coronary artery bypass grafting.J Thorac Cardiovasc Surg.2003;125:1007–1021.
- ,,, et al.Intensive insulin therapy and mortality among critically ill patients: a meta‐analysis including NICE‐SUGAR study data.CMAJ.2009;180:821–827.
- ,,, et al.Intensive versus conventional glucose control in critically ill patients.N Engl J Med.2009;360:1283–1297.
- ,,, et al.Intensive insulin therapy and pentastarch resuscitation in severe sepsis.N Engl J Med.2008;358:125–139.
- ,,, et al.Strict glycaemic control in patients hospitalised in a mixed medical and surgical intensive care unit: a randomised clinical trial.Crit Care.2008;12:R120.
- ,.Tight glucose control and hypoglycemia.Crit Care Med.2008;36:1391; author reply 1391–1392.
- ,.ICU care for patients with diabetes.Curr Opin Endocrinol Diabetes Obes.2004;11:75–81.
- ,,, et al.Implementation of a safe and effective insulin infusion protocol in a medical intensive care unit.Diabetes Care.2004;27:461–467.
- ,,.Glucommander: a computer‐directed intravenous insulin system shown to be safe, simple, and effective in 120,618 h of operation.Diabetes Care.2005;28:2418–2423.
- ,,, et al.Utilization of a computerized intravenous insulin infusion program to control blood glucose in the intensive care unit.Diabetes Technol Ther.2007;9:232–240.
- ,,, et al.Hyperglycemic crises in diabetes.Diabetes Care.2004;27Suppl 1:S94–S102.
- ,,, et al.Description and evaluation of a glycemic management protocol for patients with diabetes undergoing heart surgery.Endocr Pract.2002;8:10–18.
- ,,.Evidence for strict inpatient blood glucose control: time to revise glycemic goals in hospitalized patients.Metabolism.2008;57:116–120.
- ,,, et al.Intensive versus conventional insulin therapy: a randomized controlled trial in medical and surgical critically ill patients.Crit Care Med.2008;36:3190–3197.
- ,,.Benefits and risks of tight glucose control in critically ill adults: a meta‐analysis.JAMA.2008;300:933–944.
- ,.Severe hypoglycemia in critically ill patients: risk factors and outcomes.Crit Care Med.2007;35:2262–2267.
- ,,, et al.Evaluation and management of adult hypoglycemic disorders: an Endocrine Society Clinical Practice Guideline.J Clin Endocrinol Metab.2009;94:709–728.
- ,,, et al.Impact of tight glycemic control on cerebral glucose metabolism after severe brain injury: a microdialysis study.Crit Care Med.2008;36:3233–3238.
- ,,, et al.Proinflammatory cytokines in response to insulin‐induced hypoglycemic stress in healthy subjects.Metabolism.2009;58:443–448.
- ,,, et al.Blood glucose variability is associated with mortality in the surgical intensive care unit.Am Surg.2008;74:679–685; discussion685.
- ,,, et al.American Association of Clinical Endocrinologists and American Diabetes Association consensus statement on inpatient glycemic control.Diabetes Care.2009;32:1119–1131.
Copyright © 2010 Society of Hospital Medicine