User login
In the Literature: Research You Need to Know
Clinical question: Does the incorporation of bar-code verification technology within an electronic medication-administration system (eMAR) reduce the rate of medication errors?
Background: More than a fourth of medication-related inpatient adverse events are due to errors. Bar-code verification technology reduces the incidence of such errors; however, the quantitative effect of implementing such technology is unknown.
Study design: Before-and-after quasi-experimental study.
Setting: Single academic tertiary-care medical center in Boston.
Synopsis: Investigators directly observed 14,041 medication administrations in patient units that did and did not have bar-code eMAR. They reported a 41.4% relative reduction (RR) in medication administration errors (11.5% error rate before versus 6.8% after adoption of this technology) and 50.8% RR in the rate of potential adverse drug events (3.1% versus 1.6%). Significant reductions in wrong medication, dose, and administration documentation errors were noted. Order transcription errors were completely eliminated (6% versus 0%). Although errors in medication administration timing fell by 27.3%, no significant difference in the number of potential adverse events related to timing errors was found.
The investigators estimated that approximately 145,000 potential adverse drug events would be prevented from amongst an annual 1.69 million medication orders.
Pre-existent computerized physician order entry and bar-code verification technology in the pharmacy at the study hospital might limit the generalization of these results. Additionally, potential, not actual, adverse drug events were reported. Lastly, the study compared early implementers with late implementers.
Bottom line: Bar-code verification technology substantially reduced the number of medication administration errors and associated adverse drug events and completely eliminated the occurrence of transcription errors.
Citation: Poon EG, Keohane CA, Yoon CS, et al. Effect of bar-code technology on the safety of medication administration. N Engl J Med. 2010;362(18):1698-1707.
Reviewed for TH eWire by Robert Chang, MD, Anita Hart, MD, Hae-won Kim, MD, Robert Paretti, MD, Helena Pasieka, MD, and Matt Smitherman, MD, University of Michigan, Ann Arbor.
For more physician reviews of HM-related research, visit our website.
Safety of Inferior Vena Cava Filters Questioned
An Archives of Internal Medicine report and a U.S. Food and Drug Administration (FDA) advisory that question the long-term safety of inferior vena cava (IVC) filters should give hospitalists pause, one HM leader says.
The Aug. 9 report (PDF) found that the Bard Recovery and Bard G2 filters “had high prevalences of fracture and embolization, with potentially life-threatening sequelae." An FDA advisory issued the same day as the study cautioned that retrievable filters are not always removed from patients once the risk of pulmonary embolism (PE) has subsided, further increasing the risks.
“We’re going to be thinking more than twice before we recommend when these filters are placed in and then thinking twice about when we get them out,” says Shaker Eid, MD, an instructor of medicine at Johns Hopkins University School of Medicine in Baltimore.
Dr. Eid, however, cautions HM leaders about being too fearful of the data. The Archives report, he notes, was a single-center study. And while the FDA reports that the use of filters grew exponentially from 1979 to 2007, new American College of Chest Physicians guidelines from 2008 have limited their use mostly to patients who cannot receive anticoagulation treatments, Dr. Eid notes.
In cases in which they are necessary to implant, or in instances in which a patient already has a permanent IVC filter implanted, Dr. Eid recommends hospitalists be diligent in working with the filter.
Hospitalists in the Developing World
Could U.S. hospitals learn from how HM is practiced in developing nations such as Ecuador? David Gaus, MD, MS, founder and director of Andean Health and Development (AHD), thinks so.
Dr. Gaus, who spends half the year as assistant clinical professor of medicine and teaching hospitalist at the University of Wisconsin and the other half with AHD in Ecuador, was inspired to pursue a medical degree by doing development work in Ecuador. When he returned to Ecuador in 1995 to be a doctor to the poor, he discovered a major gap in the healthcare system, between undertrained rural PCPs and the specialist-heavy medical practice in the country’s capital of Quito.
Under his leadership, AHD established a hospital in the rural community of Pedro Vicente Maldonado; it opened in 2000 and now is financially self-sufficient. “The focus was on the need for cost-effective, high-quality hospital services in a country with a dearth of hospitals,” he says.
At the hospital, family-practice physicians serve as hospitalists and deal with a wide spectrum of clinical needs ranging from car accidents and complicated pregnancies to snake bites and toxic organic phosphate herbicide exposure.
“Rural hospitals can’t afford five or six types of attendings, but if you have well-trained family practitioners backed by a general surgeon, they can handle most of the spectrum of clinical needs and the chaos management,” he says. Increasingly, those clinical needs include such chronic degenerative diseases as diabetes, hypertension, and arthritis, for which Ecuador’s cadre of rural PCPs are not trained.
Dr. Gaus is planning a second hospital in the larger Ecuadorean city of Santo Domingo (population 400,000), with the support of the Ministry of Public Health and the Social Security system. The new facility, using the same model and hospitalist roles, will open in 12 to 18 months and will increase the number of three-year family-practice residency slots from six to 20.
Sensitivity of Superficial Wound Culture
While a general consensus exists that surface wound cultures have less utility than deeper cultures, surface cultures are nevertheless routinely used to guide empiric antibiotic administration. This is due in part to the ease with which surface cultures are obtained and the delay in obtaining deeper wound and bone cultures. The Infectious Diseases Society of America (IDSA) recommends routine culture of all diabetic infections before initiating empiric antibiotic therapy, despite caveats regarding undebrided wounds.1 Further examination of 2 additional societies, the European Society of Clinical Microbiology and Infectious Diseases and the Australasian Society for Infectious Diseases, reveals that they also do not describe guidelines on the role of surface wound cultures in skin, and skin structure infection (SSSI) management.2, 3
Surface wound cultures are used to aid in diagnosis and appropriate antibiotic treatment of lower extremity foot ulcers.4 Contaminated cultures from other body locations have shown little utility and may be wasteful of resources.5, 6 We hypothesize that given commensal skin flora, coupled with the additional flora that colonizes (chronic) lower extremity wounds, surface wound cultures provide poor diagnostic accuracy for determining the etiology of acute infection. In contrast, many believe that deep tissue cultures obtained at time of debridement or surgical intervention may provide more relevant information to guide antibiotic therapy, thus serving as a gold standard.13, 7, 8 Nevertheless, with the ease of obtaining these superficial cultures and the promptness of the results, surface wound cultures are still used as a surrogate for the information derived from deeper cultures.
Purpose
The frequency at which superficial wound cultures correlate with the data obtained from deeper cultures is needed to interpret the posttest likelihood of infection. However, the sensitivity and specificity of superficial wound culture as a diagnostic test is unclear. The purpose of this study is to conduct a systematic review of the existing literature in order to investigate the relationship between superficial wound cultures and the etiology of SSSI. Accordingly, we aim to describe any role that surface wound cultures may play in the treatment of lower extremity ulcers.
Materials and Methods
Data Sources
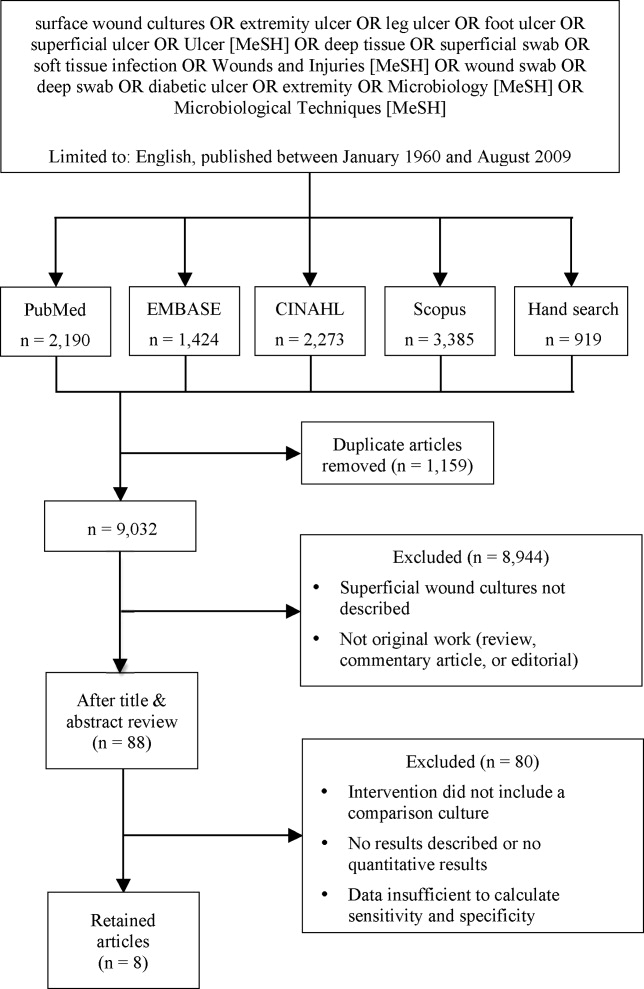
We identified eligible articles through an electronic search of the following databases: Medline through PubMed, Excerpta Medica Database (EMBASE), Cumulative Index of Nursing and Allied Health Literature (CINAHL), and Scopus. We also hand searched the reference lists of key review articles identified by the electronic search and the reference lists of all eligible articles (Figure 1).

Study Selection
The search strategy was limited to English articles published between January 1960 and August 2009. A PubMed search identified titles that contained the following keywords combined with OR: surface wound cultures, extremity ulcer, leg ulcer, foot ulcer, superficial ulcer, Ulcer [MeSH], deep tissue, superficial swab, soft tissue infection, Wounds and Injuries [MeSH], wound swab, deep swab, diabetic ulcer, Microbiology [MeSH], Microbiological Techniques [MeSH]. Medical Subject Headings [MeSH] were used as indicated and were exploded to include subheadings and maximize results. This search strategy was adapted to search the other databases.
Data Extraction
Eligible studies were identified in 2 phases. In the first phase, 2 authors (AY and CC) independently reviewed potential titles of citations for eligibility. Citations were returned for adjudication if disagreement occurred. If agreement could not be reached, the article was retained for further review. In the second phase, 2 authors (AY and CC) independently reviewed the abstracts of eligible titles. In situations of disagreement, abstracts were returned for adjudication and if necessary were retained for further review. Once all eligible articles were identified, 2 reviewers (AY and CL) independently abstracted the information within each article using a pre‐defined abstraction tool. A third investigator (CC) reviewed all the abstracted articles for verification.
We initially selected articles that involved lower extremity wounds. Articles were included if they described superficial wound cultures along with an alternative method of culture for comparison. Alternative culture methods were defined as cultures derived from needle aspiration, wound base biopsy, deep tissue biopsy, surgical debridement, or bone biopsy. Further inclusion criteria required that articles have enough microbiology data to calculate sensitivity and specificity values for superficial wound swabs.
For the included articles, 2 reviewers (AY, CC) abstracted information pertaining to microbiology data from superficial wound swabs and alternative comparison cultures as reported in each article in the form of mean number of isolates recovered. Study characteristics and patient demographics were also recorded.
When not reported in the article, calculation of test sensitivity and specificity involved identifying true and false‐positive tests as well as true and false‐negative tests. Articles were excluded if they did not contain sufficient data to calculate true/false‐positive and true/false‐negative tests. For all articles, we used the formulae [(sensitivity) (1‐specificity)] and [(1‐sensitivity) (specificity)] to calculate positive and negative likelihood ratios (LRs), respectively.
Data Synthesis and Statistical Analysis
Test sensitivity, specificity, positive and negative LR from all articles were pooled using a random‐effects meta‐analysis model (DerSimonian and Laird method). This method considers heterogeneity both within and between studies to calculate the range of possible true effects.9 For situations in which significant heterogeneity is anticipated, the random‐effects model is most conservative and appropriate.9, 10
We also compared the mean number of organisms isolated from wound cultures to the mean number of organisms isolated from alternative culture methods using the nonparametric Wilcoxon rank sum test. Inter‐rater reliability was assessed using the kappa statistic. We assessed potential publication bias by visually examining a funnel plot as described by Egger et al.11 We report 95% confidence intervals, medians with interquartile ranges, and p‐values where appropriate. All data analyses were performed using Stata 9.2 (STATA Corporation, College Station, TX, 2007).
Results
Of 9032 unique citations, eight studies met all inclusion criteria (Figure 1). Inter‐rater reliability was substantial (Kappa = 0.78).12 Areas of initial disagreement generally involved whether a study adequately described an appropriate alternative culture method for comparison or whether data available in an article was sufficient for sensitivity and specificity calculation. Consensus was achieved once the full article was retrieved, reviewed and discussed.
The 8 studies evaluated in the review included a total number of 615 patients or samples (Table 1). Diabetic wounds were described in four studies.1316 Two studies described wounds associated with peripheral vascular disease,13, 17 while four involved traumatic wounds.13, 1719 One study did not identify the clinical circumstances concerning the wounds.20
| Study ID | n | Sensitivity | Specificity | Positive LR | Negative LR |
|---|---|---|---|---|---|
| |||||
| Machowiak et al. (1978)17 | 183* | 0.26 | 0.56 | 0.59 | 1.32 |
| Sharp et al. (1979)15 | 58 | 0.53 | 0.62 | 1.38 | 0.77 |
| Wheat et al. (1986)16 | 26 | 0.35 | 0.32 | 0.51 | 2.06 |
| Zuluaga et al. (2006)19 | 100 | 0.20 | 0.67 | 0.60 | 1.20 |
| Zuluaga et al. (2002)18 | 50 | 0.22 | 0.54 | 0.47 | 1.45 |
| Gardner et al. (2007)13 | 83 | 0.90 | 0.57 | 2.09 | 0.18 |
| Slater et al. (2004)14 | 60 | 0.93 | 0.96 | 23.3 | 0.07 |
| Mousa (1997)20 | 55 | 0.89 | 0.96 | 20.6 | 0.12 |
| Pooled values (95% CI) | 0.49 (0.37‐0.61) | 0.62 (0.51‐0.74) | 1.1 (0.71‐1.5) | 0.67 (0.52‐0.82) | |
The studies used several different methods for obtaining superficial cultures. Six studies obtained purulent wound drainage material through the application of sterile swabs.1316, 18, 19 One study obtained purulent drainage material using needle aspiration.18 Two studies obtained culture material from sinus tracts associated with the wounds, one through sinus tract washings17 and another by obtaining sinus tract discharge material.20
The types of comparison cultures used were equally divided between deep tissue biopsies1316 and bone biopsies,1720 each accounting for 50% (4 of 8) of studies.
In assessing the data from the eight studies, the pooled test sensitivity for superficial wound swabs was 49% (95% confidence interval [CI], 37‐61%) (Figure 2). The pooled specificity for superficial wound swabs was 62% (95% CI, 51‐74%), while the pooled positive and negative LRs were 1.1 (95% CI, 0.71‐1.5) and 0.67 (95% CI, 0.52‐0.82), respectively (Figure 2).

The median number of bacterial isolates reported for each culture type, superficial and comparison culture, was collected from each study (Table 2). The median value for number of bacterial isolates identified by superficial culture was 2.7 (interquartile range [IQR] 1.8‐3.2). The median value for number of bacterial isolates identified by comparison culture was 2.2 (IQR 1.7‐2.9). A Wilcoxon rank sum analysis showed that the number of isolates for surface wound cultures was not significantly different than the number of isolates for comparison cultures (P = 0.75) (Table 1).
| Study ID | # of Isolates (Swab) | # of Isolates (Comparison) | Prior Antibiotics? |
|---|---|---|---|
| |||
| Machowiak et al. (1978)17 | * | * | Treated, but details not reported |
| Sharp et al. (1979)15 | 2.3 | 2.2 | Treated, but details not reported |
| Wheat et al. (1986)16 | 3.3 | 3.4 | Not described |
| Zuluaga et al. (2006)19 | 1.3 | 1.6 | Antibiotics stopped 48 hours prior |
| Zuluaga et al. (2002)18 | 1.1 | 1.4 | 52% on antibiotics, stopped 48 hours prior |
| Gardner et al. (2007)13 | 3.0 | 3.1 | 42% on antibiotics |
| Slater et al. (2004)14 | 2.7 | 2.5 | 27% on prior antibiotics |
| Mousa (1997)20 | 3.6 | 1.9 | Treated, but details not reported |
| Median (IQR) | 2.7 (1.8‐3.2) | 2.2 (1.7‐2.9) | |
Discussion
In performing this review, we discovered ambiguity in the literature regarding the utility of surface wound cultures. Some studies obtained findings to suggest the utility of surface wound cultures,8, 14, 17 while other studies in our review16, 18, 19 provided evidence against them. This variability confirmed the need for a meta‐analytic approach as provided by this review.
While we have tried to minimize bias through a well‐established methodology, we acknowledge that certain methodological limitations should be considered in interpreting the results. There may be publication bias in reviews that include only published articles; a funnel plot of sensitivity vs. sample size showed some asymmetry, suggesting bias. Our search strategy was limited to English‐only articles, which may result in publication bias.
Further, this review included a group of studies that were heterogeneous in several regards. Differences exist in culturing methods and laboratory technology, as exemplified by the variety of superficial culture methods used. We were not able to account for these laboratory differences, as methodologies in obtaining and isolating bacteria were not uniformly well described.
Additionally, the studies classified organisms in different ways. Three studies categorized organisms according to Gram's stain characteristics.13, 16, 18 One study described organisms primarily in terms of aerobic or anaerobic respiration.15 Two studies14, 19 discussed pathogens both in terms of respiration (aerobic/anaerobic) and Gram's stain characteristic, while another 2 studies17, 20 did not describe organisms in either terms. These inconsistencies limited our ability to provide sensitivity and specificity information for specific subclasses of organisms.
The clinical conditions in each study surrounding the wounds were also heterogeneous: most significantly in the issue of prior antibiotic administration. All but 1 study16 indicated that the patients had received antibiotics prior to having cultures obtained. The type of antibiotics (narrow‐spectrum or broad‐spectrum), the route of administration, and the cessation of antibiotics in relation to obtaining swabs and cultures all varied widely or were not well described. This degree of ambiguity will necessarily impact both the reliability of data regarding microbial growth as well as the component flora.
The inclusion of higher quality studies is likely to result in a more reliable meta‐analysis.21 We had hoped that antibiotic trials would contain uniform outcomes and thus strengthen our meta‐analysis through the inclusion of randomized‐controlled studies. Unfortunately, the majority of antibiotic trials did not use superficial wound cultures, did not report mean number of isolates, or did not provide microbiological data in sufficient detail to calculate concordance ratesand therefore, did not meet eligibility criteria. Randomized‐controlled trials were a minority among our included articles; the majority of study designs were retrospective cohorts and case‐controlled studies.
Despite these limitations, we were able to conclude that superficial wound culture provides mediocre sensitivity (49%) and specificity (62%). The positive LR of 1.1 is unhelpful in decision making, having a CI that includes 1. Interestingly, the negative LR of 0.67 could be somewhat helpful in medical decision making, modifying the pretest probability and assisting in ruling out a deeper bacterial infection. Although, according to Fagan's nomogram, a negative LR of 0.67 has only a mild effect on pretest odds.22
The bacterial bioburden assessed by the number of isolates obtained by culture method serves as a proxy for reliability of culture results14, 23 by suggesting that fewer organisms isolated from deep tissue or bone samples reflects a less contaminated specimen. Our assessment of the bioburden found that the median number of isolates was slightly higher in surface cultures than deeper cultures, though not to a significant degree (P = 0.75). This indicates that the degree of contamination in superficial cultures was neither significantly worse nor better than deep cultures.
We attempted to define a role for surface wound cultures; however, we found that these did not show any greater utility than deep cultures for identifying the microbiologic etiology of diabetic wound infections. While the negative LR provides some quantitative verification of the common clinical practice that a negative culture argues against infection, the finding is not especially robust.
Although for this meta‐analysis we grouped all organisms in the same way, we recognize that the sensitivity and specificity may differ according to various subclasses of bacteria. Interpretations of culture results also vary (eg, Gram positive vs. negative; aerobic vs. anaerobic); practitioners will not interpret superficial cultures of coagulase‐negative Staphylococcus in the same way as Pseudomonas. However, this study seeks to establish a reasonable starting point for the medical decision‐making process by providing quantitative values in an area with previously conflicting data. We anticipate that as laboratory techniques improve and research into superficial wounds continues, greater sensitivity of superficial wound cultures will result.
Ultimately, physicians use culture data to target therapy in an effort to use the least toxic and most effective antimicrobial agent possible to successfully treat infections. Clinical outcomes were not described in all included articles; in those that did, the endpoints were too dissimilar for meaningful comparison. Limiting our review to studies reporting treatment outcomes would have resulted in too few included studies. Thus, we were unable able to assess whether superficial wound cultures were associated with improved patient‐oriented outcomes in this meta‐analysis.
There is a significant paucity of trials evaluating the accurate concordance of superficial swabs to deep tissue culture. The current data shows poor sensitivity and specificity of superficial culture methods. The presumption that deeper cultures (such as a bone biopsy) should result in a less contaminated sample and more targeted culture results was also not borne out in our review. When presented with a patient with a wound infection, physicians mentally supply a pretest (or a pretreatment) probability as to the microbiologic etiology of the infection. Careful history will, of course, be critical in identifying extenuating circumstance or unusual exposures. From our meta‐analysis, we cannot recommend the routine use of superficial wound cultures to guide initial antibiotic therapy as this may result in poor resource utilization.5 While clinical outcomes from the use of routine superficial cultures are unclear, we suggest greater use of local antibiograms and methicillin‐resistant Staphylococcus aureus (MRSA) prevalence data to determine resistance patterns and guide the selection of empiric therapies.
- ,,, et al.Diagnosis and treatment of diabetic foot infections.Clin Infect Dis.2004;39:885–910.
- AASID,Australasian Society for Infectious Diseases—Standards, Practice Guidelines (Skin and Soft Tissue Infections): Institute for Safe Medication Practices;2006.
- ESCMID,European Society of Clinical Microbiology 2006.
- ,,,.Methicillin‐resistant Staphylococcus aureus in community‐acquired skin infections.Emerg Infect Dis.2005;11:928–930.
- ,,.Contaminant blood cultures and resource utilization. The true consequences of false‐positive results.JAMA.1991;265:365–369.
- ,,,,,.Cost‐effectiveness of blood cultures for adult patients with cellulitis.Clin Infect Dis.1999;29:1483–1488.
- ,,,,,.Managing skin and soft tissue infections: expert panel recommendations on key decision points.J Antimicrob Chemother.2003;52 Suppl 1:i3‐i17.
- ,,, et al.Deep tissue biopsy vs. superficial swab culture monitoring in the microbiological assessment of limb‐threatening diabetic foot infection.Diabet Med.2001;18:822–827.
- ,.Meta‐analysis in clinical trials.Control Clin Trials.1986;7:177–188.
- ,,.Quantitative synthesis in systematic reviews.Ann Intern Med.1997;127:820–826.
- ,,,.Bias in meta‐analysis detected by a simple, graphical test.BMJ.1997;315:629–634.
- .Practical statistics for medical research.London, UK:Chapman 1991:403–409.
- ,,,,,.Diagnostic validity of three swab techniques for identifying chronic wound infection.Wound Repair Regen.2006;14(5):548–57.
- ,,, et al.Swab cultures accurately identify bacterial pathogens in diabetic foot wounds not involving bone.Diabet Med.2004;21:705–709.
- ,,,,.Microbiology of superficial and deep tissues in infected diabetic gangrene.Surg Gynecol Obstet.1979;149:217–219.
- ,,, et al.Diabetic foot infections. Bacteriologic analysis.Arch Intern Med.1986;146:1935–1940.
- ,,.Diagnostic value of sinus‐tract cultures in chronic osteomyelitis.JAMA.1978;239:2772–2775.
- ,,,.Lack of microbiological concordance between bone and non‐bone specimens in chronic osteomyelitis: an observational study.BMC Infect Dis.2002;2:8.
- ,,,,,.Etiologic diagnosis of chronic osteomyelitis: a prospective study.Arch Intern Med.2006;166:95–100.
- .Evaluation of sinus‐track cultures in chronic bone infection.J Bone Joint Surg Br.1997;79:567–569.
- ,,, et al.Meta‐analysis of observational studies in epidemiology: a proposal for reporting.JAMA.2000;283:2008–2012.
- ,Letter: nomogram for Bayes theorem.N Engl J Med.1975;293:257.
- ,,,,,.Quantitative swab culture versus tissue biopsy: a comparison in chronic wounds.Ostomy Wound Manage.2001;47:34–37.
While a general consensus exists that surface wound cultures have less utility than deeper cultures, surface cultures are nevertheless routinely used to guide empiric antibiotic administration. This is due in part to the ease with which surface cultures are obtained and the delay in obtaining deeper wound and bone cultures. The Infectious Diseases Society of America (IDSA) recommends routine culture of all diabetic infections before initiating empiric antibiotic therapy, despite caveats regarding undebrided wounds.1 Further examination of 2 additional societies, the European Society of Clinical Microbiology and Infectious Diseases and the Australasian Society for Infectious Diseases, reveals that they also do not describe guidelines on the role of surface wound cultures in skin, and skin structure infection (SSSI) management.2, 3
Surface wound cultures are used to aid in diagnosis and appropriate antibiotic treatment of lower extremity foot ulcers.4 Contaminated cultures from other body locations have shown little utility and may be wasteful of resources.5, 6 We hypothesize that given commensal skin flora, coupled with the additional flora that colonizes (chronic) lower extremity wounds, surface wound cultures provide poor diagnostic accuracy for determining the etiology of acute infection. In contrast, many believe that deep tissue cultures obtained at time of debridement or surgical intervention may provide more relevant information to guide antibiotic therapy, thus serving as a gold standard.13, 7, 8 Nevertheless, with the ease of obtaining these superficial cultures and the promptness of the results, surface wound cultures are still used as a surrogate for the information derived from deeper cultures.
Purpose
The frequency at which superficial wound cultures correlate with the data obtained from deeper cultures is needed to interpret the posttest likelihood of infection. However, the sensitivity and specificity of superficial wound culture as a diagnostic test is unclear. The purpose of this study is to conduct a systematic review of the existing literature in order to investigate the relationship between superficial wound cultures and the etiology of SSSI. Accordingly, we aim to describe any role that surface wound cultures may play in the treatment of lower extremity ulcers.
Materials and Methods
Data Sources
We identified eligible articles through an electronic search of the following databases: Medline through PubMed, Excerpta Medica Database (EMBASE), Cumulative Index of Nursing and Allied Health Literature (CINAHL), and Scopus. We also hand searched the reference lists of key review articles identified by the electronic search and the reference lists of all eligible articles (Figure 1).
Study Selection
The search strategy was limited to English articles published between January 1960 and August 2009. A PubMed search identified titles that contained the following keywords combined with OR: surface wound cultures, extremity ulcer, leg ulcer, foot ulcer, superficial ulcer, Ulcer [MeSH], deep tissue, superficial swab, soft tissue infection, Wounds and Injuries [MeSH], wound swab, deep swab, diabetic ulcer, Microbiology [MeSH], Microbiological Techniques [MeSH]. Medical Subject Headings [MeSH] were used as indicated and were exploded to include subheadings and maximize results. This search strategy was adapted to search the other databases.
Data Extraction
Eligible studies were identified in 2 phases. In the first phase, 2 authors (AY and CC) independently reviewed potential titles of citations for eligibility. Citations were returned for adjudication if disagreement occurred. If agreement could not be reached, the article was retained for further review. In the second phase, 2 authors (AY and CC) independently reviewed the abstracts of eligible titles. In situations of disagreement, abstracts were returned for adjudication and if necessary were retained for further review. Once all eligible articles were identified, 2 reviewers (AY and CL) independently abstracted the information within each article using a pre‐defined abstraction tool. A third investigator (CC) reviewed all the abstracted articles for verification.
We initially selected articles that involved lower extremity wounds. Articles were included if they described superficial wound cultures along with an alternative method of culture for comparison. Alternative culture methods were defined as cultures derived from needle aspiration, wound base biopsy, deep tissue biopsy, surgical debridement, or bone biopsy. Further inclusion criteria required that articles have enough microbiology data to calculate sensitivity and specificity values for superficial wound swabs.
For the included articles, 2 reviewers (AY, CC) abstracted information pertaining to microbiology data from superficial wound swabs and alternative comparison cultures as reported in each article in the form of mean number of isolates recovered. Study characteristics and patient demographics were also recorded.
When not reported in the article, calculation of test sensitivity and specificity involved identifying true and false‐positive tests as well as true and false‐negative tests. Articles were excluded if they did not contain sufficient data to calculate true/false‐positive and true/false‐negative tests. For all articles, we used the formulae [(sensitivity) (1‐specificity)] and [(1‐sensitivity) (specificity)] to calculate positive and negative likelihood ratios (LRs), respectively.
Data Synthesis and Statistical Analysis
Test sensitivity, specificity, positive and negative LR from all articles were pooled using a random‐effects meta‐analysis model (DerSimonian and Laird method). This method considers heterogeneity both within and between studies to calculate the range of possible true effects.9 For situations in which significant heterogeneity is anticipated, the random‐effects model is most conservative and appropriate.9, 10
We also compared the mean number of organisms isolated from wound cultures to the mean number of organisms isolated from alternative culture methods using the nonparametric Wilcoxon rank sum test. Inter‐rater reliability was assessed using the kappa statistic. We assessed potential publication bias by visually examining a funnel plot as described by Egger et al.11 We report 95% confidence intervals, medians with interquartile ranges, and p‐values where appropriate. All data analyses were performed using Stata 9.2 (STATA Corporation, College Station, TX, 2007).
Results
Of 9032 unique citations, eight studies met all inclusion criteria (Figure 1). Inter‐rater reliability was substantial (Kappa = 0.78).12 Areas of initial disagreement generally involved whether a study adequately described an appropriate alternative culture method for comparison or whether data available in an article was sufficient for sensitivity and specificity calculation. Consensus was achieved once the full article was retrieved, reviewed and discussed.
The 8 studies evaluated in the review included a total number of 615 patients or samples (Table 1). Diabetic wounds were described in four studies.1316 Two studies described wounds associated with peripheral vascular disease,13, 17 while four involved traumatic wounds.13, 1719 One study did not identify the clinical circumstances concerning the wounds.20
| Study ID | n | Sensitivity | Specificity | Positive LR | Negative LR |
|---|---|---|---|---|---|
| |||||
| Machowiak et al. (1978)17 | 183* | 0.26 | 0.56 | 0.59 | 1.32 |
| Sharp et al. (1979)15 | 58 | 0.53 | 0.62 | 1.38 | 0.77 |
| Wheat et al. (1986)16 | 26 | 0.35 | 0.32 | 0.51 | 2.06 |
| Zuluaga et al. (2006)19 | 100 | 0.20 | 0.67 | 0.60 | 1.20 |
| Zuluaga et al. (2002)18 | 50 | 0.22 | 0.54 | 0.47 | 1.45 |
| Gardner et al. (2007)13 | 83 | 0.90 | 0.57 | 2.09 | 0.18 |
| Slater et al. (2004)14 | 60 | 0.93 | 0.96 | 23.3 | 0.07 |
| Mousa (1997)20 | 55 | 0.89 | 0.96 | 20.6 | 0.12 |
| Pooled values (95% CI) | 0.49 (0.37‐0.61) | 0.62 (0.51‐0.74) | 1.1 (0.71‐1.5) | 0.67 (0.52‐0.82) | |
The studies used several different methods for obtaining superficial cultures. Six studies obtained purulent wound drainage material through the application of sterile swabs.1316, 18, 19 One study obtained purulent drainage material using needle aspiration.18 Two studies obtained culture material from sinus tracts associated with the wounds, one through sinus tract washings17 and another by obtaining sinus tract discharge material.20
The types of comparison cultures used were equally divided between deep tissue biopsies1316 and bone biopsies,1720 each accounting for 50% (4 of 8) of studies.
In assessing the data from the eight studies, the pooled test sensitivity for superficial wound swabs was 49% (95% confidence interval [CI], 37‐61%) (Figure 2). The pooled specificity for superficial wound swabs was 62% (95% CI, 51‐74%), while the pooled positive and negative LRs were 1.1 (95% CI, 0.71‐1.5) and 0.67 (95% CI, 0.52‐0.82), respectively (Figure 2).
The median number of bacterial isolates reported for each culture type, superficial and comparison culture, was collected from each study (Table 2). The median value for number of bacterial isolates identified by superficial culture was 2.7 (interquartile range [IQR] 1.8‐3.2). The median value for number of bacterial isolates identified by comparison culture was 2.2 (IQR 1.7‐2.9). A Wilcoxon rank sum analysis showed that the number of isolates for surface wound cultures was not significantly different than the number of isolates for comparison cultures (P = 0.75) (Table 1).
| Study ID | # of Isolates (Swab) | # of Isolates (Comparison) | Prior Antibiotics? |
|---|---|---|---|
| |||
| Machowiak et al. (1978)17 | * | * | Treated, but details not reported |
| Sharp et al. (1979)15 | 2.3 | 2.2 | Treated, but details not reported |
| Wheat et al. (1986)16 | 3.3 | 3.4 | Not described |
| Zuluaga et al. (2006)19 | 1.3 | 1.6 | Antibiotics stopped 48 hours prior |
| Zuluaga et al. (2002)18 | 1.1 | 1.4 | 52% on antibiotics, stopped 48 hours prior |
| Gardner et al. (2007)13 | 3.0 | 3.1 | 42% on antibiotics |
| Slater et al. (2004)14 | 2.7 | 2.5 | 27% on prior antibiotics |
| Mousa (1997)20 | 3.6 | 1.9 | Treated, but details not reported |
| Median (IQR) | 2.7 (1.8‐3.2) | 2.2 (1.7‐2.9) | |
Discussion
In performing this review, we discovered ambiguity in the literature regarding the utility of surface wound cultures. Some studies obtained findings to suggest the utility of surface wound cultures,8, 14, 17 while other studies in our review16, 18, 19 provided evidence against them. This variability confirmed the need for a meta‐analytic approach as provided by this review.
While we have tried to minimize bias through a well‐established methodology, we acknowledge that certain methodological limitations should be considered in interpreting the results. There may be publication bias in reviews that include only published articles; a funnel plot of sensitivity vs. sample size showed some asymmetry, suggesting bias. Our search strategy was limited to English‐only articles, which may result in publication bias.
Further, this review included a group of studies that were heterogeneous in several regards. Differences exist in culturing methods and laboratory technology, as exemplified by the variety of superficial culture methods used. We were not able to account for these laboratory differences, as methodologies in obtaining and isolating bacteria were not uniformly well described.
Additionally, the studies classified organisms in different ways. Three studies categorized organisms according to Gram's stain characteristics.13, 16, 18 One study described organisms primarily in terms of aerobic or anaerobic respiration.15 Two studies14, 19 discussed pathogens both in terms of respiration (aerobic/anaerobic) and Gram's stain characteristic, while another 2 studies17, 20 did not describe organisms in either terms. These inconsistencies limited our ability to provide sensitivity and specificity information for specific subclasses of organisms.
The clinical conditions in each study surrounding the wounds were also heterogeneous: most significantly in the issue of prior antibiotic administration. All but 1 study16 indicated that the patients had received antibiotics prior to having cultures obtained. The type of antibiotics (narrow‐spectrum or broad‐spectrum), the route of administration, and the cessation of antibiotics in relation to obtaining swabs and cultures all varied widely or were not well described. This degree of ambiguity will necessarily impact both the reliability of data regarding microbial growth as well as the component flora.
The inclusion of higher quality studies is likely to result in a more reliable meta‐analysis.21 We had hoped that antibiotic trials would contain uniform outcomes and thus strengthen our meta‐analysis through the inclusion of randomized‐controlled studies. Unfortunately, the majority of antibiotic trials did not use superficial wound cultures, did not report mean number of isolates, or did not provide microbiological data in sufficient detail to calculate concordance ratesand therefore, did not meet eligibility criteria. Randomized‐controlled trials were a minority among our included articles; the majority of study designs were retrospective cohorts and case‐controlled studies.
Despite these limitations, we were able to conclude that superficial wound culture provides mediocre sensitivity (49%) and specificity (62%). The positive LR of 1.1 is unhelpful in decision making, having a CI that includes 1. Interestingly, the negative LR of 0.67 could be somewhat helpful in medical decision making, modifying the pretest probability and assisting in ruling out a deeper bacterial infection. Although, according to Fagan's nomogram, a negative LR of 0.67 has only a mild effect on pretest odds.22
The bacterial bioburden assessed by the number of isolates obtained by culture method serves as a proxy for reliability of culture results14, 23 by suggesting that fewer organisms isolated from deep tissue or bone samples reflects a less contaminated specimen. Our assessment of the bioburden found that the median number of isolates was slightly higher in surface cultures than deeper cultures, though not to a significant degree (P = 0.75). This indicates that the degree of contamination in superficial cultures was neither significantly worse nor better than deep cultures.
We attempted to define a role for surface wound cultures; however, we found that these did not show any greater utility than deep cultures for identifying the microbiologic etiology of diabetic wound infections. While the negative LR provides some quantitative verification of the common clinical practice that a negative culture argues against infection, the finding is not especially robust.
Although for this meta‐analysis we grouped all organisms in the same way, we recognize that the sensitivity and specificity may differ according to various subclasses of bacteria. Interpretations of culture results also vary (eg, Gram positive vs. negative; aerobic vs. anaerobic); practitioners will not interpret superficial cultures of coagulase‐negative Staphylococcus in the same way as Pseudomonas. However, this study seeks to establish a reasonable starting point for the medical decision‐making process by providing quantitative values in an area with previously conflicting data. We anticipate that as laboratory techniques improve and research into superficial wounds continues, greater sensitivity of superficial wound cultures will result.
Ultimately, physicians use culture data to target therapy in an effort to use the least toxic and most effective antimicrobial agent possible to successfully treat infections. Clinical outcomes were not described in all included articles; in those that did, the endpoints were too dissimilar for meaningful comparison. Limiting our review to studies reporting treatment outcomes would have resulted in too few included studies. Thus, we were unable able to assess whether superficial wound cultures were associated with improved patient‐oriented outcomes in this meta‐analysis.
There is a significant paucity of trials evaluating the accurate concordance of superficial swabs to deep tissue culture. The current data shows poor sensitivity and specificity of superficial culture methods. The presumption that deeper cultures (such as a bone biopsy) should result in a less contaminated sample and more targeted culture results was also not borne out in our review. When presented with a patient with a wound infection, physicians mentally supply a pretest (or a pretreatment) probability as to the microbiologic etiology of the infection. Careful history will, of course, be critical in identifying extenuating circumstance or unusual exposures. From our meta‐analysis, we cannot recommend the routine use of superficial wound cultures to guide initial antibiotic therapy as this may result in poor resource utilization.5 While clinical outcomes from the use of routine superficial cultures are unclear, we suggest greater use of local antibiograms and methicillin‐resistant Staphylococcus aureus (MRSA) prevalence data to determine resistance patterns and guide the selection of empiric therapies.
- ,,, et al.Diagnosis and treatment of diabetic foot infections.Clin Infect Dis.2004;39:885–910.
- AASID,Australasian Society for Infectious Diseases—Standards, Practice Guidelines (Skin and Soft Tissue Infections): Institute for Safe Medication Practices;2006.
- ESCMID,European Society of Clinical Microbiology 2006.
- ,,,.Methicillin‐resistant Staphylococcus aureus in community‐acquired skin infections.Emerg Infect Dis.2005;11:928–930.
- ,,.Contaminant blood cultures and resource utilization. The true consequences of false‐positive results.JAMA.1991;265:365–369.
- ,,,,,.Cost‐effectiveness of blood cultures for adult patients with cellulitis.Clin Infect Dis.1999;29:1483–1488.
- ,,,,,.Managing skin and soft tissue infections: expert panel recommendations on key decision points.J Antimicrob Chemother.2003;52 Suppl 1:i3‐i17.
- ,,, et al.Deep tissue biopsy vs. superficial swab culture monitoring in the microbiological assessment of limb‐threatening diabetic foot infection.Diabet Med.2001;18:822–827.
- ,.Meta‐analysis in clinical trials.Control Clin Trials.1986;7:177–188.
- ,,.Quantitative synthesis in systematic reviews.Ann Intern Med.1997;127:820–826.
- ,,,.Bias in meta‐analysis detected by a simple, graphical test.BMJ.1997;315:629–634.
- .Practical statistics for medical research.London, UK:Chapman 1991:403–409.
- ,,,,,.Diagnostic validity of three swab techniques for identifying chronic wound infection.Wound Repair Regen.2006;14(5):548–57.
- ,,, et al.Swab cultures accurately identify bacterial pathogens in diabetic foot wounds not involving bone.Diabet Med.2004;21:705–709.
- ,,,,.Microbiology of superficial and deep tissues in infected diabetic gangrene.Surg Gynecol Obstet.1979;149:217–219.
- ,,, et al.Diabetic foot infections. Bacteriologic analysis.Arch Intern Med.1986;146:1935–1940.
- ,,.Diagnostic value of sinus‐tract cultures in chronic osteomyelitis.JAMA.1978;239:2772–2775.
- ,,,.Lack of microbiological concordance between bone and non‐bone specimens in chronic osteomyelitis: an observational study.BMC Infect Dis.2002;2:8.
- ,,,,,.Etiologic diagnosis of chronic osteomyelitis: a prospective study.Arch Intern Med.2006;166:95–100.
- .Evaluation of sinus‐track cultures in chronic bone infection.J Bone Joint Surg Br.1997;79:567–569.
- ,,, et al.Meta‐analysis of observational studies in epidemiology: a proposal for reporting.JAMA.2000;283:2008–2012.
- ,Letter: nomogram for Bayes theorem.N Engl J Med.1975;293:257.
- ,,,,,.Quantitative swab culture versus tissue biopsy: a comparison in chronic wounds.Ostomy Wound Manage.2001;47:34–37.
Pott's Puffy Tumor
A 6‐year‐old girl with a history of bilateral myringotomies, tonsillectomy, and adenoidectomy 6 and 8 months prior, presented with forehead swelling. Eight days prior, she developed right ear pain, sore throat and fever followed by eye pain and headache for which she was evaluated and diagnosed with viral illness. On the day of presentation she awoke with forehead swelling, persistent headache, and recurrent fever.
On exam she was afebrile. Central forehead swelling was noted without overlying erythema or fluctulence (Figure 1). Neurologic exam was normal. Noncontrast computed tomography (CT) scan of the head showed pan sinusitis with an extra‐axial fluid collection in the left frontal region (Figure 2).

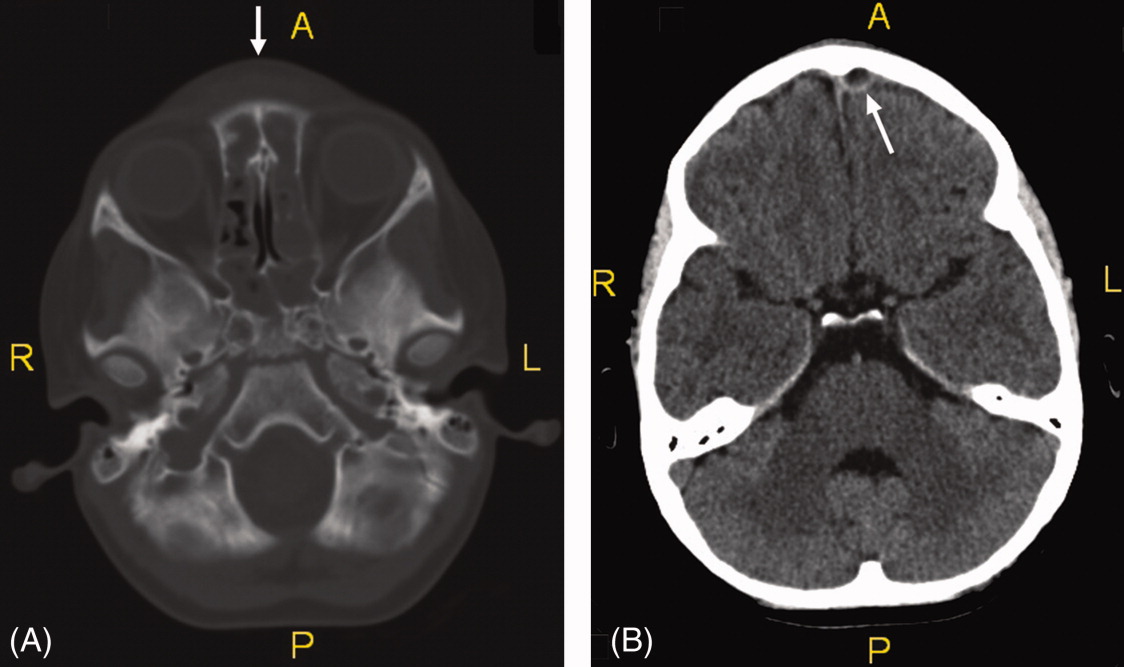
Vancomycin, ceftriaxone, and metronidazole were started empirically. She underwent bilateral maxillary antrostomy, total ethmoidectomy, and burr‐hole evacuation of the epidural abscess. Operative specimen cultures grew out Group A streptococci, after‐which antibiotic therapy was narrowed down to ampicillin/sulbactam alone.
Pott's puffy tumor, or osteomyelitis of the frontal bone with subperiosteal abscess formation, is rare in children less than 7 years of age and usually the result of a delay in diagnosis or inadequate treatment of rhinosinusitis.1 Risk factors include frontal sinusitis, head trauma, and less commonly, cocaine use, dental infection, or delayed neurosurgical or sinus surgery complications.2, 3 Fever, vomiting, forehead tenderness, and headache are the most common complaints, though seizure and focal neurologic findings have been described.2 CT scanning is the imaging modality of choice. Most commonly cultured organisms include Streptococci, Haemophilus influenzae, Bacteroides, and less commonly, Staphylococcus aureus.2, 4 Treatment includes empiric broad‐spectrum antibiotics that penetrate the blood‐brain barrier with early surgical drainage of the abscess and debridement of the osteomyelitic bone.4
- ,.Simultaneous intracranial and orbital complications of acute rhinosinusitis in children.Int J Pediatr Otorhinolaryngol.2004;68:619–625.
- ,,, et al.Pott's puffy tumor in children.Childs Nerv Syst.2010;26(1):53–60.
- ,,,,.A Pott's Puffy Tumour as a late complication of a frontal sinus reconstruction: case report and literature review.Rhinology.2009;47(4):470–475.
- ,,.An unusual cause of headache: Pott's puffy tumour.Eur J Emerg Med.2007;14(3):170–173.
A 6‐year‐old girl with a history of bilateral myringotomies, tonsillectomy, and adenoidectomy 6 and 8 months prior, presented with forehead swelling. Eight days prior, she developed right ear pain, sore throat and fever followed by eye pain and headache for which she was evaluated and diagnosed with viral illness. On the day of presentation she awoke with forehead swelling, persistent headache, and recurrent fever.
On exam she was afebrile. Central forehead swelling was noted without overlying erythema or fluctulence (Figure 1). Neurologic exam was normal. Noncontrast computed tomography (CT) scan of the head showed pan sinusitis with an extra‐axial fluid collection in the left frontal region (Figure 2).
Vancomycin, ceftriaxone, and metronidazole were started empirically. She underwent bilateral maxillary antrostomy, total ethmoidectomy, and burr‐hole evacuation of the epidural abscess. Operative specimen cultures grew out Group A streptococci, after‐which antibiotic therapy was narrowed down to ampicillin/sulbactam alone.
Pott's puffy tumor, or osteomyelitis of the frontal bone with subperiosteal abscess formation, is rare in children less than 7 years of age and usually the result of a delay in diagnosis or inadequate treatment of rhinosinusitis.1 Risk factors include frontal sinusitis, head trauma, and less commonly, cocaine use, dental infection, or delayed neurosurgical or sinus surgery complications.2, 3 Fever, vomiting, forehead tenderness, and headache are the most common complaints, though seizure and focal neurologic findings have been described.2 CT scanning is the imaging modality of choice. Most commonly cultured organisms include Streptococci, Haemophilus influenzae, Bacteroides, and less commonly, Staphylococcus aureus.2, 4 Treatment includes empiric broad‐spectrum antibiotics that penetrate the blood‐brain barrier with early surgical drainage of the abscess and debridement of the osteomyelitic bone.4
- ,.Simultaneous intracranial and orbital complications of acute rhinosinusitis in children.Int J Pediatr Otorhinolaryngol.2004;68:619–625.
- ,,, et al.Pott's puffy tumor in children.Childs Nerv Syst.2010;26(1):53–60.
- ,,,,.A Pott's Puffy Tumour as a late complication of a frontal sinus reconstruction: case report and literature review.Rhinology.2009;47(4):470–475.
- ,,.An unusual cause of headache: Pott's puffy tumour.Eur J Emerg Med.2007;14(3):170–173.
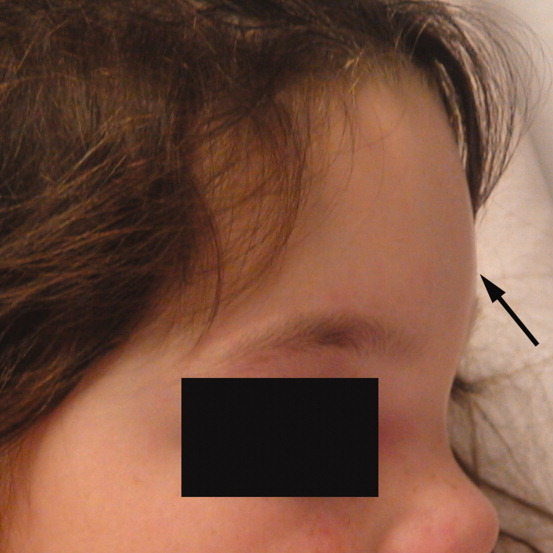
Partnering to Improve Care Transitions
Hospital readmissions are common, costly in both economic and human terms, and often preventable. This perfect storm of attributes has placed hospital readmissions at the center of discourse among payers, providers, and policy makers, which is leading to innovations in care delivery. Evolving efforts to enhance discharge communication, to improve care coordination and accountability, and to meaningfully involve primary care, show promise of reducing readmissions.14 These pockets of success demonstrate that improving care transitions can increase quality of care while decreasing costs.
Within the hospital, it is now clear that the discharge process typically requires the same intensity of effort as admission. The hospitalist guides an interdisciplinary team, including nurses, pharmacists, case managers, and social workers, through a checklist of discharge tasks. Some tasks require substantial hospitalist involvement and expertise, such as medication reconciliationa detail‐oriented, time‐consuming process. Other tasks can be accomplished by team members, overseen by the hospitalist, such as scheduling timely follow‐up appointments, coordinating outpatient services, and assembling educational materials. Taken as a whole, significant time and effort must be devoted by the inpatient team to address the complex landscape of a patient's medical and psychosocial needs.
That of course, is only half of the equation, as patient care must be transferred to an equally invested outpatient team led by a primary care provider (PCP). Several influential medical societies have endorsed the medical home (a multidisciplinary care team led by a PCP) as the primary agent to coordinate patient care across settings.5 Indeed, promptly reconnecting with their PCP and primary care team after discharge can have profound meaning for patients, who may otherwise be unsupported with their postdischarge clinical needs. In this issue of the Journal of Hospital Medicine, 4 important articles provide evidence in support of an outpatient partner to actively assume patient care responsibility after hospital discharge.
van Walraven et al.6 conducted an elegant study to evaluate the impact of postdischarge PCP visits on readmissions. Following more than 5000 patients for nearly 6 months, they demonstrated that increased PCP follow‐up was significantly and independently associated with a decreased risk of hospital readmission. This confirms the positive impact that a primary care connection can have on postdischarge care. This study also highlights some challenges: 18% of the original cohort were excluded from the final analyses because they had only 1 or no PCP visit in the 6 months following discharge, indicating inadequate postdischarge follow‐up for a substantial sub‐group. Misky et al.7 similarly established that patients with timely PCP follow‐up (within one month of discharge) were 10 times less likely to be readmitted for the same condition as their index admission. These are also encouraging findings for those patients with PCP follow‐up. Yet among patients in their study, PCP follow‐up was even less common, with only 49% of patients having appointments within one month. Future studies should consider how more intensive outreach strategies might engage difficult‐to‐reach patients and communities.
PCP follow‐up may be beneficial because discharged patients often have ongoing issues that need to be addressed. Arora et al.8 surveyed inner city patients and their PCPs 2 weeks after hospital discharge to assess whether patients experienced any problems in the postdischarge period, and whether PCPs were aware of their patients' hospitalization. Nearly half of all patients recounted 1 or more postdischarge problems. The likelihood of reporting such a problem was twice as common among those patients whose PCP was unaware of their hospitalization. Again, this is strong validation of the importance of PCP involvement in posthospital care, but equally concerning is their finding that fully 3 in 10 PCPs were unaware of their patient's hospitalization.
Finally, Mitchell et al.9 further refine our understanding of risk factors for readmission. In an ethnically diverse inner city population, they screened 738 inpatients for depression. Among the 238 (32%) patients who screened positive, there was a marked 73% increase in hospital utilization (emergency department [ED] visits and readmissions) within 30 days of discharge.9 This confirms previous research that depression is a risk factor for rehospitalization.10 Depression, however, is amenable to treatment and receiving care through one's primary care practice can potentially mitigate how depression negatively affects patients' medication adherence, self‐care behavior, and ultimately readmission rates.
Collectively, these 4 articles give us reason to experience both despair and hope. It is discouraging that large numbers of patients do not have timely encounters with their PCP after discharge, confirming previous findings,11 and that too often PCPs are unaware of their patients' hospitalizations. In any other industry this sort of inefficiency and poor customer service would put a company out of business; that it persists in medicine is embarrassing. Because our medical system is not sufficiently incentivized by quality outcomes, such poor practices continue to be tolerated, and our patients suffer the consequences.
But we are also shown a way forward, with accumulating evidence complimenting existing studies that a primary care connection can improve the quality of postdischarge care and decrease readmissions.1214 Recognizing this central role of primary care, however, forces us to acknowledge the diminishing availability of primary care nationwide; in many inner city and rural locations, accessible primary care is largely nonexistent. This shortage must be corrected to attain needed access and to advance health care reform.
Postdischarge PCP involvement is particularly essential with shorter hospital stays, as patients will predictably have complex postdischarge needs as they complete their recuperation at home. Indeed, Arora et al.8 indicate that posthospitalization problems may be more the rule than the exception, and that specific types of problems can be foreseen. Most commonly reported were challenges obtaining follow‐up appointments, difficulties managing or obtaining medications, feeling unprepared for discharge, having unanswered questions, or needing an urgent reevaluation. While well organized predischarge efforts help to prepare patients, even the most perfect discharge process cannot anticipate all possible pitfalls. Fortunately, most postdischarge problems can be effectively handled by those who often know the patient best, the patient's primary care team. The outpatient team is ideally situated to assist patients with the logistics of accessing the care system, to provide ongoing education, and to help with such basic needs as transportation and social support. It makes sense that such personalized outreach can prevent small problems from blossoming into more serious issues that might ultimately require rehospitalization.
Upon discharge, patients and families are also often expected to assume new self‐care responsibilities, to implement new dietary restrictions, to use new medications, and to monitor and respond to new and evolving symptoms. Gaining the knowledge, the confidence, and the experience to adopt new behaviors is critical to successful postdischarge self‐care. Adult learning theory informs us that education is an ongoing process. Mastering new material occurs with repetition, over time, and under different circumstances. An ancient Chinese proverb encapsulates the key aspects of learning:
-
I hear and I forget;
-
I see and I remember;
-
I do and I understand.
Thus, a single didactic discharge session in the hospital is unlikely to provide patients with sufficient depth of understanding that one attains through experiential learning. Hospital‐based discharge teaching is further compromised in the setting of patient fatigue, anxiety and illness: it is not surprising that patients comprehend and retain only 50% of the medical information discussed with their physicians.15
While teach back has been effectively used to ensure that information is registered when initially presented, it does not ensure that information has been internalized in such a way that it can be utilized hours or days later. Instead, it is the active engagement with the primary care team that provides opportunities for ongoing learning, personalized to the educational needs of each patient. With nurses, dieticians, pharmacists, and medical educators playing a central guiding role, patients can receive appropriately tailored instruction, as well as opportunities to practically apply their new knowledge.
The evolving partnership among hospitals, hospitalists, and primary care holds great promise to reduce avoidable readmissions, and the Patient Protection and Affordable Care Act of 2010 will provide financial incentives to support this partnership. Health care reform aims to adjust hospital payments based on rates of preventable Medicare readmissions; bundling payments (paying for episodes of illness based on outcomes) and accountable care organizations (ACOs) will ideally foster seamless care coordination.16 Nurturing and developing this collaboration between the inpatient and outpatient care teams will be essential as we seek to provide patients the safest transition possible from the hospital to home.
- ,,, et al.A reengineered hospital discharge program to decrease rehospitalization: a randomized trial.Ann Intern Med.2009;150(3):178–187.
- ,,,.The care transitions intervention: results of a randomized controlled trial.Arch Intern Med.2006;166(17):1822–1828.
- ,,,.Redefining and redesigning hospital discharge to enhance patient care: a randomized controlled study.J Gen Intern Med.2008;23(8):1228–1233.
- ,,, et al.Reduction of 30‐day postdischarge hospital readmission or emergency department (ED) visit rates in high‐risk elderly medical patients through delivery of a targeted care bundle.J Hosp Med.2009;4(4):211–218.
- ,,, et al.Transitions of Care Consensus policy statement: American College of Physicians, Society of General Internal Medicine, Society of Hospital Medicine, American Geriatrics Society, American College Of Emergency Physicians, and Society for Academic Emergency Medicine.J Hosp Med.2009;4(6):364–370.
- et al.Independent association of provider and information continuity on outcomes after hospital discharge: implications for hospitalists.J Hosp Med.2010;5(7):398–405.
- et al.Post‐hospitalization transitions: examining the effects of timing of primary care follow‐up.J Hosp Med.2010;5(7):392–397.
- et al.Problems after discharge and understanding of communication with their PCPs among hospitalized seniors: a mixed methods study.J Hosp Med.2010;5(7):385–391.
- et al.Post‐discharge hospital utilization among adult medical inpatients with depressive symptoms.J Hosp Med.2010;5(7):378–384.
- ,,, et al.Depression Is a risk factor for rehospitalization in medical inpatients.Prim Care Companion J Clin Psychiatry.2007;9(4):256–262.
- ,,.Rehospitalizations among patients in the Medicare fee‐for‐service program.N Engl J Med. 22009;360(14):1418–1428.
- ,,,,.The effect of technology‐supported, multidisease care management on the mortality and hospitalization of seniors.J Am Geriatr Soc.2008;56(12):2195–2202.
- ,,, et al.Guided care and the cost of complex healthcare: a preliminary report.Am J Manag Care.2009;15(8):555–559.
- ,,, et al.Geriatric care management for low‐income seniors: a randomized controlled trial.JAMA.2007;298(22):2623–2633.
- .Patients' memory for medical information.J R Soc Med.2003;96(5):219–222.
- .Understanding the new vocabulary of healthcare reform.J Hosp Med.2010;5(4):197–199.
Hospital readmissions are common, costly in both economic and human terms, and often preventable. This perfect storm of attributes has placed hospital readmissions at the center of discourse among payers, providers, and policy makers, which is leading to innovations in care delivery. Evolving efforts to enhance discharge communication, to improve care coordination and accountability, and to meaningfully involve primary care, show promise of reducing readmissions.14 These pockets of success demonstrate that improving care transitions can increase quality of care while decreasing costs.
Within the hospital, it is now clear that the discharge process typically requires the same intensity of effort as admission. The hospitalist guides an interdisciplinary team, including nurses, pharmacists, case managers, and social workers, through a checklist of discharge tasks. Some tasks require substantial hospitalist involvement and expertise, such as medication reconciliationa detail‐oriented, time‐consuming process. Other tasks can be accomplished by team members, overseen by the hospitalist, such as scheduling timely follow‐up appointments, coordinating outpatient services, and assembling educational materials. Taken as a whole, significant time and effort must be devoted by the inpatient team to address the complex landscape of a patient's medical and psychosocial needs.
That of course, is only half of the equation, as patient care must be transferred to an equally invested outpatient team led by a primary care provider (PCP). Several influential medical societies have endorsed the medical home (a multidisciplinary care team led by a PCP) as the primary agent to coordinate patient care across settings.5 Indeed, promptly reconnecting with their PCP and primary care team after discharge can have profound meaning for patients, who may otherwise be unsupported with their postdischarge clinical needs. In this issue of the Journal of Hospital Medicine, 4 important articles provide evidence in support of an outpatient partner to actively assume patient care responsibility after hospital discharge.
van Walraven et al.6 conducted an elegant study to evaluate the impact of postdischarge PCP visits on readmissions. Following more than 5000 patients for nearly 6 months, they demonstrated that increased PCP follow‐up was significantly and independently associated with a decreased risk of hospital readmission. This confirms the positive impact that a primary care connection can have on postdischarge care. This study also highlights some challenges: 18% of the original cohort were excluded from the final analyses because they had only 1 or no PCP visit in the 6 months following discharge, indicating inadequate postdischarge follow‐up for a substantial sub‐group. Misky et al.7 similarly established that patients with timely PCP follow‐up (within one month of discharge) were 10 times less likely to be readmitted for the same condition as their index admission. These are also encouraging findings for those patients with PCP follow‐up. Yet among patients in their study, PCP follow‐up was even less common, with only 49% of patients having appointments within one month. Future studies should consider how more intensive outreach strategies might engage difficult‐to‐reach patients and communities.
PCP follow‐up may be beneficial because discharged patients often have ongoing issues that need to be addressed. Arora et al.8 surveyed inner city patients and their PCPs 2 weeks after hospital discharge to assess whether patients experienced any problems in the postdischarge period, and whether PCPs were aware of their patients' hospitalization. Nearly half of all patients recounted 1 or more postdischarge problems. The likelihood of reporting such a problem was twice as common among those patients whose PCP was unaware of their hospitalization. Again, this is strong validation of the importance of PCP involvement in posthospital care, but equally concerning is their finding that fully 3 in 10 PCPs were unaware of their patient's hospitalization.
Finally, Mitchell et al.9 further refine our understanding of risk factors for readmission. In an ethnically diverse inner city population, they screened 738 inpatients for depression. Among the 238 (32%) patients who screened positive, there was a marked 73% increase in hospital utilization (emergency department [ED] visits and readmissions) within 30 days of discharge.9 This confirms previous research that depression is a risk factor for rehospitalization.10 Depression, however, is amenable to treatment and receiving care through one's primary care practice can potentially mitigate how depression negatively affects patients' medication adherence, self‐care behavior, and ultimately readmission rates.
Collectively, these 4 articles give us reason to experience both despair and hope. It is discouraging that large numbers of patients do not have timely encounters with their PCP after discharge, confirming previous findings,11 and that too often PCPs are unaware of their patients' hospitalizations. In any other industry this sort of inefficiency and poor customer service would put a company out of business; that it persists in medicine is embarrassing. Because our medical system is not sufficiently incentivized by quality outcomes, such poor practices continue to be tolerated, and our patients suffer the consequences.
But we are also shown a way forward, with accumulating evidence complimenting existing studies that a primary care connection can improve the quality of postdischarge care and decrease readmissions.1214 Recognizing this central role of primary care, however, forces us to acknowledge the diminishing availability of primary care nationwide; in many inner city and rural locations, accessible primary care is largely nonexistent. This shortage must be corrected to attain needed access and to advance health care reform.
Postdischarge PCP involvement is particularly essential with shorter hospital stays, as patients will predictably have complex postdischarge needs as they complete their recuperation at home. Indeed, Arora et al.8 indicate that posthospitalization problems may be more the rule than the exception, and that specific types of problems can be foreseen. Most commonly reported were challenges obtaining follow‐up appointments, difficulties managing or obtaining medications, feeling unprepared for discharge, having unanswered questions, or needing an urgent reevaluation. While well organized predischarge efforts help to prepare patients, even the most perfect discharge process cannot anticipate all possible pitfalls. Fortunately, most postdischarge problems can be effectively handled by those who often know the patient best, the patient's primary care team. The outpatient team is ideally situated to assist patients with the logistics of accessing the care system, to provide ongoing education, and to help with such basic needs as transportation and social support. It makes sense that such personalized outreach can prevent small problems from blossoming into more serious issues that might ultimately require rehospitalization.
Upon discharge, patients and families are also often expected to assume new self‐care responsibilities, to implement new dietary restrictions, to use new medications, and to monitor and respond to new and evolving symptoms. Gaining the knowledge, the confidence, and the experience to adopt new behaviors is critical to successful postdischarge self‐care. Adult learning theory informs us that education is an ongoing process. Mastering new material occurs with repetition, over time, and under different circumstances. An ancient Chinese proverb encapsulates the key aspects of learning:
-
I hear and I forget;
-
I see and I remember;
-
I do and I understand.
Thus, a single didactic discharge session in the hospital is unlikely to provide patients with sufficient depth of understanding that one attains through experiential learning. Hospital‐based discharge teaching is further compromised in the setting of patient fatigue, anxiety and illness: it is not surprising that patients comprehend and retain only 50% of the medical information discussed with their physicians.15
While teach back has been effectively used to ensure that information is registered when initially presented, it does not ensure that information has been internalized in such a way that it can be utilized hours or days later. Instead, it is the active engagement with the primary care team that provides opportunities for ongoing learning, personalized to the educational needs of each patient. With nurses, dieticians, pharmacists, and medical educators playing a central guiding role, patients can receive appropriately tailored instruction, as well as opportunities to practically apply their new knowledge.
The evolving partnership among hospitals, hospitalists, and primary care holds great promise to reduce avoidable readmissions, and the Patient Protection and Affordable Care Act of 2010 will provide financial incentives to support this partnership. Health care reform aims to adjust hospital payments based on rates of preventable Medicare readmissions; bundling payments (paying for episodes of illness based on outcomes) and accountable care organizations (ACOs) will ideally foster seamless care coordination.16 Nurturing and developing this collaboration between the inpatient and outpatient care teams will be essential as we seek to provide patients the safest transition possible from the hospital to home.
- ,,, et al.A reengineered hospital discharge program to decrease rehospitalization: a randomized trial.Ann Intern Med.2009;150(3):178–187.
- ,,,.The care transitions intervention: results of a randomized controlled trial.Arch Intern Med.2006;166(17):1822–1828.
- ,,,.Redefining and redesigning hospital discharge to enhance patient care: a randomized controlled study.J Gen Intern Med.2008;23(8):1228–1233.
- ,,, et al.Reduction of 30‐day postdischarge hospital readmission or emergency department (ED) visit rates in high‐risk elderly medical patients through delivery of a targeted care bundle.J Hosp Med.2009;4(4):211–218.
- ,,, et al.Transitions of Care Consensus policy statement: American College of Physicians, Society of General Internal Medicine, Society of Hospital Medicine, American Geriatrics Society, American College Of Emergency Physicians, and Society for Academic Emergency Medicine.J Hosp Med.2009;4(6):364–370.
- et al.Independent association of provider and information continuity on outcomes after hospital discharge: implications for hospitalists.J Hosp Med.2010;5(7):398–405.
- et al.Post‐hospitalization transitions: examining the effects of timing of primary care follow‐up.J Hosp Med.2010;5(7):392–397.
- et al.Problems after discharge and understanding of communication with their PCPs among hospitalized seniors: a mixed methods study.J Hosp Med.2010;5(7):385–391.
- et al.Post‐discharge hospital utilization among adult medical inpatients with depressive symptoms.J Hosp Med.2010;5(7):378–384.
- ,,, et al.Depression Is a risk factor for rehospitalization in medical inpatients.Prim Care Companion J Clin Psychiatry.2007;9(4):256–262.
- ,,.Rehospitalizations among patients in the Medicare fee‐for‐service program.N Engl J Med. 22009;360(14):1418–1428.
- ,,,,.The effect of technology‐supported, multidisease care management on the mortality and hospitalization of seniors.J Am Geriatr Soc.2008;56(12):2195–2202.
- ,,, et al.Guided care and the cost of complex healthcare: a preliminary report.Am J Manag Care.2009;15(8):555–559.
- ,,, et al.Geriatric care management for low‐income seniors: a randomized controlled trial.JAMA.2007;298(22):2623–2633.
- .Patients' memory for medical information.J R Soc Med.2003;96(5):219–222.
- .Understanding the new vocabulary of healthcare reform.J Hosp Med.2010;5(4):197–199.
Scrofula
A 25 year‐old hitherto healthy female Asian immigrant presented with gradually worsening painful neck swelling for 5 weeks and a 40‐pound weight loss. Neck examination showed tender, firm, matted and fixed lymph nodes in left and right cervical chains. Contrast computed tomography of the neck confirmed extensive necrotic lymphadenopathy. Excisional lymph node biopsy revealed granulomatous lymphadenitis with microabscesses. Staining for acid‐fast bacilli was positive; tissue culture confirmed the diagnosis of Mycobacterium tuberculosis. She was started on rifampin 600 mg, isoniazid 300 mg, pyrazinamide 1000 mg, and ethambutol 800 mg; ethambutol was discontinued when the mycobacteria proved susceptible to isoniazid. Pyrazinamide was discontinued after 2 months and isoniazid and rifampin continued to complete 6 months of therapy.0, 0
Tuberculous lymphadenitisscrofula when occurring in the cervical regionis a common cause of extrapulmonary tuberculosis, especially in developing countries. In developed countries, tuberculous lymphadenitis occurs mainly in immigrants but can also arise in travelers to endemic areas and immunodeficient persons.1 Painless lymphadenopathy of the superficial lymph nodes is typical. Fine needle aspiration with microscopy, culture and polymerase chain reaction (PCR) may be used as an initial diagnostic tool.2 However, if the results are negative despite high clinical suspicion, excisional biopsy of the lymph node may be necessary. Various nontuberculous mycobacteria also cause adenitis, so definitive speciation is needed to determine optimal therapy.3
Recommended initial treatment for M. tuberculosis includes isoniazid, rifampin, pyrazinamide and ethambutol or streptomycin, based on local resistance patterns. The fourth drug is withdrawn when the isolate is found susceptible to the first 3 drugs; isoniazid and rifampin are used for a total of 6 months of treatment, while pyrazinamide is withdrawn after 2 months.4 Twice‐weekly directly observed therapy (DOT) can be as effective as daily therapy supervised weekly.5 DOT maximizes compliance and reduces treatment failure.
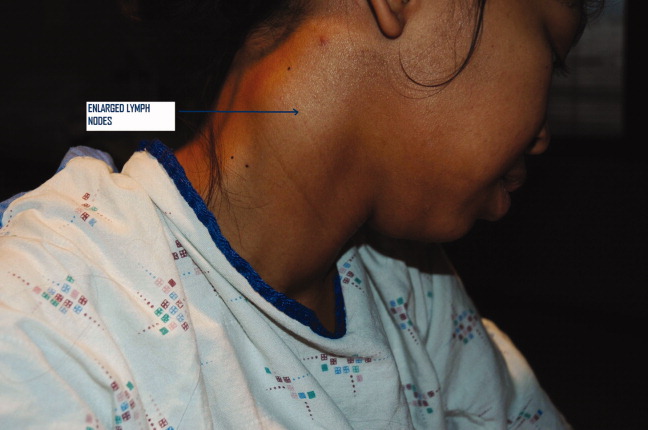
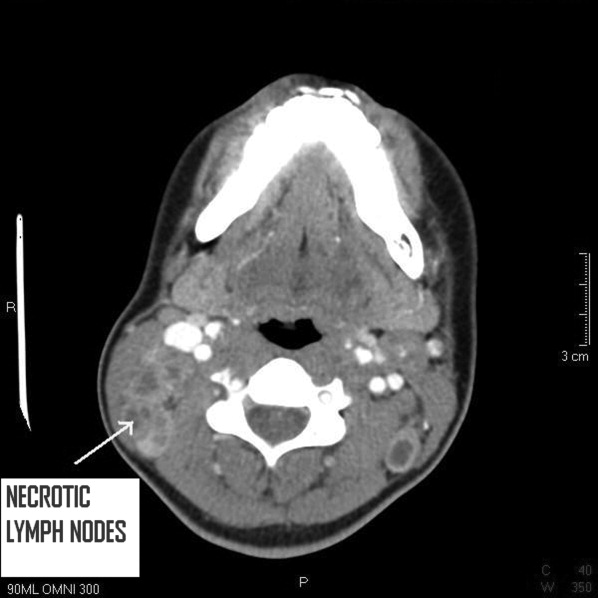
- ,,,,.Cervical tuberculous lymphadenopathy: changing clinical pattern and concepts in management.Postgrad Med J.2001;77:185–187.
- ,,, et al.Comparison of inhouse polymerase chain reaction with conventional technique for detection of Mycobacterium tuberculosis DNA in granulomatous lymphadenopathy.J Clin Pathol.2000;53:355–361.
- ,.Extrapulmonary infections associated with nontuberculous mycobacteria in immunocompetent persons.Emerg Infect Dis.2009;15(9):1351–1358.
- ,,.Practice guidelines for treatment of tuberculosis.Clin Infect Dis.2000;31(3):633–639.
- ,,, et al.Treatment of lymph node tuberculosis—a randomised clinical trial of two 6‐month regimens.Trop Med Int Health.2005;10(11):1090–1098.
A 25 year‐old hitherto healthy female Asian immigrant presented with gradually worsening painful neck swelling for 5 weeks and a 40‐pound weight loss. Neck examination showed tender, firm, matted and fixed lymph nodes in left and right cervical chains. Contrast computed tomography of the neck confirmed extensive necrotic lymphadenopathy. Excisional lymph node biopsy revealed granulomatous lymphadenitis with microabscesses. Staining for acid‐fast bacilli was positive; tissue culture confirmed the diagnosis of Mycobacterium tuberculosis. She was started on rifampin 600 mg, isoniazid 300 mg, pyrazinamide 1000 mg, and ethambutol 800 mg; ethambutol was discontinued when the mycobacteria proved susceptible to isoniazid. Pyrazinamide was discontinued after 2 months and isoniazid and rifampin continued to complete 6 months of therapy.0, 0
Tuberculous lymphadenitisscrofula when occurring in the cervical regionis a common cause of extrapulmonary tuberculosis, especially in developing countries. In developed countries, tuberculous lymphadenitis occurs mainly in immigrants but can also arise in travelers to endemic areas and immunodeficient persons.1 Painless lymphadenopathy of the superficial lymph nodes is typical. Fine needle aspiration with microscopy, culture and polymerase chain reaction (PCR) may be used as an initial diagnostic tool.2 However, if the results are negative despite high clinical suspicion, excisional biopsy of the lymph node may be necessary. Various nontuberculous mycobacteria also cause adenitis, so definitive speciation is needed to determine optimal therapy.3
Recommended initial treatment for M. tuberculosis includes isoniazid, rifampin, pyrazinamide and ethambutol or streptomycin, based on local resistance patterns. The fourth drug is withdrawn when the isolate is found susceptible to the first 3 drugs; isoniazid and rifampin are used for a total of 6 months of treatment, while pyrazinamide is withdrawn after 2 months.4 Twice‐weekly directly observed therapy (DOT) can be as effective as daily therapy supervised weekly.5 DOT maximizes compliance and reduces treatment failure.
- ,,,,.Cervical tuberculous lymphadenopathy: changing clinical pattern and concepts in management.Postgrad Med J.2001;77:185–187.
- ,,, et al.Comparison of inhouse polymerase chain reaction with conventional technique for detection of Mycobacterium tuberculosis DNA in granulomatous lymphadenopathy.J Clin Pathol.2000;53:355–361.
- ,.Extrapulmonary infections associated with nontuberculous mycobacteria in immunocompetent persons.Emerg Infect Dis.2009;15(9):1351–1358.
- ,,.Practice guidelines for treatment of tuberculosis.Clin Infect Dis.2000;31(3):633–639.
- ,,, et al.Treatment of lymph node tuberculosis—a randomised clinical trial of two 6‐month regimens.Trop Med Int Health.2005;10(11):1090–1098.

Taking the Next Step
As resident physicians, we find ourselves at the forefronts of medicine. While tackling the complexities of clinical medicine, all too soon we become entrenched in the bureaucracy of the medical system. We have come to accept realism and practicality over idealism. Shackled by the inefficiencies of a medical system in dire need of reform, we trek forward in hopes of a new future.
I remember the day quite clearly. My 30‐hour shift was nearing an end. It had not been a rough night, but covering both telemetry and coronary care unit services does take a toll on one's physical and mental well‐being. We were ready to discharge Mr. H, an indigent man recovering from a heart attack. I entered his room. He was all dressed. I explained all the important details and handed him a prescription. These medications are very important. Here is a taxi voucher to the pharmacy to get these medications.
He smiled, Thank you very much. You guys saved my life and I really appreciate it.
You are very welcome, I replied. In addition to the medications, it is very important that you follow up with your doctor within 1 to 2 weeks. Do you have any questions?
No problem. You guys saved my life. Thank you so much!
His eyes glistened with tears as he stared right through me, not hearing anything I had said. Mr. H, could you please wait a few more minutes? I will help you schedule a clinic visit.
I quickly located his clinic number at the county hospital. After 3 attempts, I reached a live person. I explained my situation: I am a doctor at a local hospital trying to help a patient setup a clinic appointment. She rattled off a slurry of information, clearly from a script, and left me with 5 different numbers to choose from (the main clinic line, an alternative number, a third number for the urgent advice nurse, one for new patients, and another for subspecialists). The main line was busy, and despite 3 additional attempts, this avenue ended in a recording advising me to leave a message. Unfortunately, my patient lived in an single resident occupancy (SRO) and did not have a phone, and thus leaving a message would not be helpful. I tried another number and the operator informed me that Mr. H was not in the system, and therefore, he would transfer me to the new patients department. The phone rang 5 times before the voicemail message answered, instructing me to leave a detailed message with my contact information. I hung up, and called the original operator back.
I'm sorry. Only the new patient department can schedule appointments for new patients. Here is the direct number. They must be busy. You can try again.
After several attempts, someone answered. My system shows that Mr. H has been assigned to the 7th Street Clinic. He's been seen there before, so you need to contact the main clinic line. I can only make appointments for new patients. She transferred me back to the first operator.
Oh yes, it looks like Mr. H is assigned to 7th Street Clinic. Please hold while I try to locate the next available appointment. He returns 3 minutes later. The next appointment I have is 4 months from now9:30 AM or 3:30 PM?
Is there anyway to schedule an earlier appointment? Mr. H has just recovered from a heart attack and needs to be seen sooner.
I'm sorry. This is the earliest appointment available. If he needs urgent care, he can go to the urgent care clinic Monday through Friday 7:30 AM to 6:00 PM. I persisted and he gave me the clinic's direct line. Sometimes, they may have earlier openings.
I called the 7th Street Clinic. The receptionist informed me that Mr. H was not in the system and she could not help me. I would need to speak with the new patient department. I just spoke with that department, and they were not able to schedule an appointment because their records show he has been seen at 7th Street Clinic in the past.
I'm sorry. He is not in our system. I can't schedule any appointments for him.
Again I went through all the previous numbers and spoke with the same 4 or 5 people, transferring me back and forth through this ridiculous maze, dodging voicemails and busy tones. One hour after I first began this endeavor, I finally succeeded in securing an appointment for Mr. H within 2 weeks as a new patient at a new clinic.
Why had this task been so difficult? Mr. H is the type of individual most at risk of falling through the cracks. Why is it that these individuals, homeless and indigent patients that lack social support, suffering already from countless barriers to health care access and resources because of their socioeconomic status continue to face such a horridly complex system of inefficiency and bureaucracy when trying to make a simple clinic appointment? How difficult and frustrating it was for me to accomplish this taskhow could I expect my patient living in an SRO without a phone to succeed?
Identifying barriers to health care access is the first step in addressing these issues. Previous studies have demonstrated that the majority of barriers to adequate follow‐up after a hospital visit occur among minority groups.17 Lower socioeconomic status is often associated with financial limitations from inability to take time off from work. Among immigrant cohorts, language and cultural barriers also play an important role in affecting follow‐up care. In addition to suboptimal follow‐up care, these barriers often lead to increased patient morbidity and increased rates of hospital readmission. For example, studies have reported that certain minority groups were more likely to receive no pain medication after bone fractures and were less likely to receive adequate analgesia for cancer‐related pain.1, 2, 7 In an attempt to address these issues, several studies have reported on multidisciplinary discharge planning interventions.810 One program in particular involved emergency departments providing free medication, transportation vouchers to and from the patient's primary care clinic, and telephone reminders to schedule follow‐up appointments.10 The implementation of these programs translated into improved primary care follow up, decreased hospital readmission rates, and decreased costs.
It is clear that our current health care system is wrought with inefficiencies that pose significant barriers to access by certain cohorts. The fact that minority groups and cohorts of the lowest socioeconomic status suffer most from these obstacles is concerning. Studies have shown that comprehensive programs to address these barriers including greater access to language interpreters and implementing a multidisciplinary approach to discharge planning improve patient outcomes. As we move forward in the ever‐evolving US medical system, there needs to be greater emphasis on preventative care. Education and resources to improve access to primary care physicians through identification of barriers and developing programs to address these issues is only the first step.
- ,.Effect of language barriers on follow‐up appointments after an emergency department visit.J Gen Intern Med.2000;15:256–264.
- ,,.Ethnicity as a risk factor for inadequate emergency department analgesia.JAMA.1993;269:1537–1539.
- ,.Differences in follow‐up visits between African‐American and White Medicaid children hospitalized with asthma.J Health Care Poor Underserved.1997;8:83–98.
- ,,.Predictors and barriers to timely medical follow‐up after cardiovascular disease risk factor screening according to race/ethnicity.J Natl Med Assoc.2008;100:534–539.
- ,.Nonprice barriers to ambulatory care after an emergency department visit.Ann Emerg Med.2008;51:607–613.
- ,,,,.Financial barriers to health care and outcomes after acute myocardial infarction.JAMA.2007;297:1063–1072.
- ,,,,.Pain and treatment of pain in minority patients with cancer: The Eastern Cooperative Oncology Group Minority Outpatient Pain Study.Ann Intern Med.1997;127:813–816.
- ,,, et al.Comprehensive discharge planning and home follow‐up of hospitalized elders; a randomized clinical trial.JAMA.1999;281:613–620.
- .Approaches to help people with diabetes overcome barriers for improved health outcomes.Diabetes Educ.2008;34(1 Suppl):18S–24S.
- ,,, et al.A randomized, controlled trial of a simple emergency department intervention to improve the rate of primary care follow‐up for patients with acute asthma exacerbations.Ann Emerg Med.2001;38:115–122.
As resident physicians, we find ourselves at the forefronts of medicine. While tackling the complexities of clinical medicine, all too soon we become entrenched in the bureaucracy of the medical system. We have come to accept realism and practicality over idealism. Shackled by the inefficiencies of a medical system in dire need of reform, we trek forward in hopes of a new future.
I remember the day quite clearly. My 30‐hour shift was nearing an end. It had not been a rough night, but covering both telemetry and coronary care unit services does take a toll on one's physical and mental well‐being. We were ready to discharge Mr. H, an indigent man recovering from a heart attack. I entered his room. He was all dressed. I explained all the important details and handed him a prescription. These medications are very important. Here is a taxi voucher to the pharmacy to get these medications.
He smiled, Thank you very much. You guys saved my life and I really appreciate it.
You are very welcome, I replied. In addition to the medications, it is very important that you follow up with your doctor within 1 to 2 weeks. Do you have any questions?
No problem. You guys saved my life. Thank you so much!
His eyes glistened with tears as he stared right through me, not hearing anything I had said. Mr. H, could you please wait a few more minutes? I will help you schedule a clinic visit.
I quickly located his clinic number at the county hospital. After 3 attempts, I reached a live person. I explained my situation: I am a doctor at a local hospital trying to help a patient setup a clinic appointment. She rattled off a slurry of information, clearly from a script, and left me with 5 different numbers to choose from (the main clinic line, an alternative number, a third number for the urgent advice nurse, one for new patients, and another for subspecialists). The main line was busy, and despite 3 additional attempts, this avenue ended in a recording advising me to leave a message. Unfortunately, my patient lived in an single resident occupancy (SRO) and did not have a phone, and thus leaving a message would not be helpful. I tried another number and the operator informed me that Mr. H was not in the system, and therefore, he would transfer me to the new patients department. The phone rang 5 times before the voicemail message answered, instructing me to leave a detailed message with my contact information. I hung up, and called the original operator back.
I'm sorry. Only the new patient department can schedule appointments for new patients. Here is the direct number. They must be busy. You can try again.
After several attempts, someone answered. My system shows that Mr. H has been assigned to the 7th Street Clinic. He's been seen there before, so you need to contact the main clinic line. I can only make appointments for new patients. She transferred me back to the first operator.
Oh yes, it looks like Mr. H is assigned to 7th Street Clinic. Please hold while I try to locate the next available appointment. He returns 3 minutes later. The next appointment I have is 4 months from now9:30 AM or 3:30 PM?
Is there anyway to schedule an earlier appointment? Mr. H has just recovered from a heart attack and needs to be seen sooner.
I'm sorry. This is the earliest appointment available. If he needs urgent care, he can go to the urgent care clinic Monday through Friday 7:30 AM to 6:00 PM. I persisted and he gave me the clinic's direct line. Sometimes, they may have earlier openings.
I called the 7th Street Clinic. The receptionist informed me that Mr. H was not in the system and she could not help me. I would need to speak with the new patient department. I just spoke with that department, and they were not able to schedule an appointment because their records show he has been seen at 7th Street Clinic in the past.
I'm sorry. He is not in our system. I can't schedule any appointments for him.
Again I went through all the previous numbers and spoke with the same 4 or 5 people, transferring me back and forth through this ridiculous maze, dodging voicemails and busy tones. One hour after I first began this endeavor, I finally succeeded in securing an appointment for Mr. H within 2 weeks as a new patient at a new clinic.
Why had this task been so difficult? Mr. H is the type of individual most at risk of falling through the cracks. Why is it that these individuals, homeless and indigent patients that lack social support, suffering already from countless barriers to health care access and resources because of their socioeconomic status continue to face such a horridly complex system of inefficiency and bureaucracy when trying to make a simple clinic appointment? How difficult and frustrating it was for me to accomplish this taskhow could I expect my patient living in an SRO without a phone to succeed?
Identifying barriers to health care access is the first step in addressing these issues. Previous studies have demonstrated that the majority of barriers to adequate follow‐up after a hospital visit occur among minority groups.17 Lower socioeconomic status is often associated with financial limitations from inability to take time off from work. Among immigrant cohorts, language and cultural barriers also play an important role in affecting follow‐up care. In addition to suboptimal follow‐up care, these barriers often lead to increased patient morbidity and increased rates of hospital readmission. For example, studies have reported that certain minority groups were more likely to receive no pain medication after bone fractures and were less likely to receive adequate analgesia for cancer‐related pain.1, 2, 7 In an attempt to address these issues, several studies have reported on multidisciplinary discharge planning interventions.810 One program in particular involved emergency departments providing free medication, transportation vouchers to and from the patient's primary care clinic, and telephone reminders to schedule follow‐up appointments.10 The implementation of these programs translated into improved primary care follow up, decreased hospital readmission rates, and decreased costs.
It is clear that our current health care system is wrought with inefficiencies that pose significant barriers to access by certain cohorts. The fact that minority groups and cohorts of the lowest socioeconomic status suffer most from these obstacles is concerning. Studies have shown that comprehensive programs to address these barriers including greater access to language interpreters and implementing a multidisciplinary approach to discharge planning improve patient outcomes. As we move forward in the ever‐evolving US medical system, there needs to be greater emphasis on preventative care. Education and resources to improve access to primary care physicians through identification of barriers and developing programs to address these issues is only the first step.
- ,.Effect of language barriers on follow‐up appointments after an emergency department visit.J Gen Intern Med.2000;15:256–264.
- ,,.Ethnicity as a risk factor for inadequate emergency department analgesia.JAMA.1993;269:1537–1539.
- ,.Differences in follow‐up visits between African‐American and White Medicaid children hospitalized with asthma.J Health Care Poor Underserved.1997;8:83–98.
- ,,.Predictors and barriers to timely medical follow‐up after cardiovascular disease risk factor screening according to race/ethnicity.J Natl Med Assoc.2008;100:534–539.
- ,.Nonprice barriers to ambulatory care after an emergency department visit.Ann Emerg Med.2008;51:607–613.
- ,,,,.Financial barriers to health care and outcomes after acute myocardial infarction.JAMA.2007;297:1063–1072.
- ,,,,.Pain and treatment of pain in minority patients with cancer: The Eastern Cooperative Oncology Group Minority Outpatient Pain Study.Ann Intern Med.1997;127:813–816.
- ,,, et al.Comprehensive discharge planning and home follow‐up of hospitalized elders; a randomized clinical trial.JAMA.1999;281:613–620.
- .Approaches to help people with diabetes overcome barriers for improved health outcomes.Diabetes Educ.2008;34(1 Suppl):18S–24S.
- ,,, et al.A randomized, controlled trial of a simple emergency department intervention to improve the rate of primary care follow‐up for patients with acute asthma exacerbations.Ann Emerg Med.2001;38:115–122.
Continuing Medical Education Program in
If you wish to receive credit for this activity, which begins on the next page, please refer to the website:
Accreditation and Designation Statement
Blackwell Futura Media Services designates this educational activity for a 1 AMA PRA Category 1 Credit. Physicians should only claim credit commensurate with the extent of their participation in the activity.
Blackwell Futura Media Services is accredited by the Accreditation Council for Continuing Medical Education to provide continuing medical education for physicians.
Educational Objectives
Continuous participation in the Journal of Hospital Medicine CME program will enable learners to be better able to:
-
Interpret clinical guidelines and their applications for higher quality and more efficient care for all hospitalized patients.
-
Describe the standard of care for common illnesses and conditions treated in the hospital; such as pneumonia, COPD exacerbation, acute coronary syndrome, HF exacerbation, glycemic control, venous thromboembolic disease, stroke, etc.
-
Discuss evidence‐based recommendations involving transitions of care, including the hospital discharge process.
-
Gain insights into the roles of hospitalists as medical educators, researchers, medical ethicists, palliative care providers, and hospital‐based geriatricians.
-
Incorporate best practices for hospitalist administration, including quality improvement, patient safety, practice management, leadership, and demonstrating hospitalist value.
-
Identify evidence‐based best practices and trends for both adult and pediatric hospital medicine.
Instructions on Receiving Credit
For information on applicability and acceptance of continuing medical education credit for this activity, please consult your professional licensing board.
This activity is designed to be completed within the time designated on the title page; physicians should claim only those credits that reflect the time actually spent in the activity. To successfully earn credit, participants must complete the activity during the valid credit period that is noted on the title page.
Follow these steps to earn credit:
-
Log on to
www.blackwellpublishing.com/cme . -
Read the target audience, learning objectives, and author disclosures.
-
Read the article in print or online format.
-
Reflect on the article.
-
Access the CME Exam, and choose the best answer to each question.
-
Complete the required evaluation component of the activity.
Pot Shots
A 46‐year‐old man with a history of heavy marijuana use for 30 years presented to the emergency room with 1 month of progressively worsening distal extremity pain and numbness that had developed into necrosis at the tips of his fingers (Figure 1A, arrows). The patient did not have other systemic symptoms. Transthoracic echocardiogram was normal. An evaluation for hypercoagulable disorders, blood cultures, C‐ANCA, cryoglobulins, Hepatitis C serologies, and human immunodeficiency virus (HIV) serologies were all negative. Erythrocyte sedimentation rate was within normal limits. An arteriogram of the hands showed distal subsegmental obliteration of digital arteries (Figure 1B, arrows), which was consistent with thromboangiitis obliterans (Buerger's Disease). While the patient rarely consumed tobacco, he reported smoking up to 10 marijuana cigarettes daily and a diagnosis of cannabis arteritis was made. The patient was encouraged to discontinue smoking and at follow‐up he had marked improvement in symptoms with abstinence from marijuana.
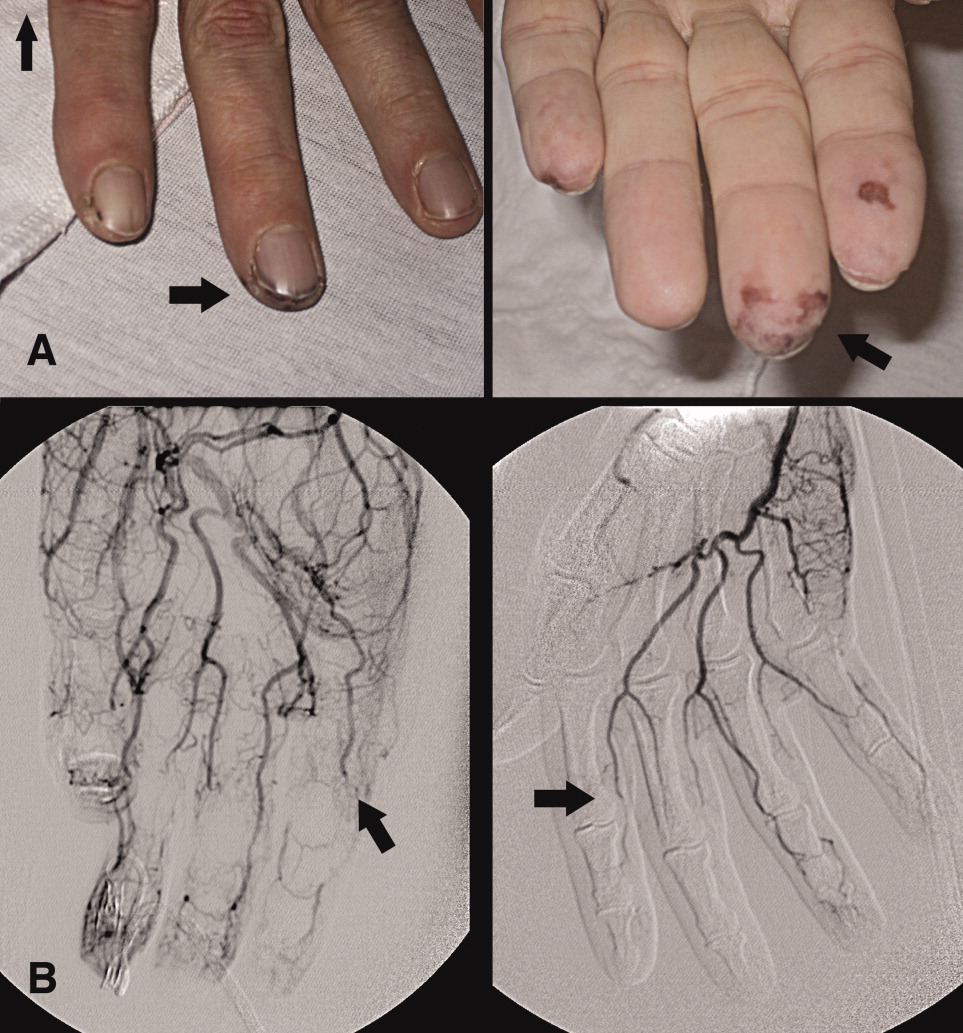
- ,,.Cannabis arteritis.J Am Acad Dermatol.2008;58(5 Suppl 1):S65–S67.
- ,,,,,.Cannabis arteritis.Br J Dermatol.2005;152(1):166–169.
- ,,,,,.Cannabis arteritis: a new case report and a review of literature.J Eur Acad Dermatol Venereol.2007;21(3):388–391.
A 46‐year‐old man with a history of heavy marijuana use for 30 years presented to the emergency room with 1 month of progressively worsening distal extremity pain and numbness that had developed into necrosis at the tips of his fingers (Figure 1A, arrows). The patient did not have other systemic symptoms. Transthoracic echocardiogram was normal. An evaluation for hypercoagulable disorders, blood cultures, C‐ANCA, cryoglobulins, Hepatitis C serologies, and human immunodeficiency virus (HIV) serologies were all negative. Erythrocyte sedimentation rate was within normal limits. An arteriogram of the hands showed distal subsegmental obliteration of digital arteries (Figure 1B, arrows), which was consistent with thromboangiitis obliterans (Buerger's Disease). While the patient rarely consumed tobacco, he reported smoking up to 10 marijuana cigarettes daily and a diagnosis of cannabis arteritis was made. The patient was encouraged to discontinue smoking and at follow‐up he had marked improvement in symptoms with abstinence from marijuana.
A 46‐year‐old man with a history of heavy marijuana use for 30 years presented to the emergency room with 1 month of progressively worsening distal extremity pain and numbness that had developed into necrosis at the tips of his fingers (Figure 1A, arrows). The patient did not have other systemic symptoms. Transthoracic echocardiogram was normal. An evaluation for hypercoagulable disorders, blood cultures, C‐ANCA, cryoglobulins, Hepatitis C serologies, and human immunodeficiency virus (HIV) serologies were all negative. Erythrocyte sedimentation rate was within normal limits. An arteriogram of the hands showed distal subsegmental obliteration of digital arteries (Figure 1B, arrows), which was consistent with thromboangiitis obliterans (Buerger's Disease). While the patient rarely consumed tobacco, he reported smoking up to 10 marijuana cigarettes daily and a diagnosis of cannabis arteritis was made. The patient was encouraged to discontinue smoking and at follow‐up he had marked improvement in symptoms with abstinence from marijuana.
- ,,.Cannabis arteritis.J Am Acad Dermatol.2008;58(5 Suppl 1):S65–S67.
- ,,,,,.Cannabis arteritis.Br J Dermatol.2005;152(1):166–169.
- ,,,,,.Cannabis arteritis: a new case report and a review of literature.J Eur Acad Dermatol Venereol.2007;21(3):388–391.
- ,,.Cannabis arteritis.J Am Acad Dermatol.2008;58(5 Suppl 1):S65–S67.
- ,,,,,.Cannabis arteritis.Br J Dermatol.2005;152(1):166–169.
- ,,,,,.Cannabis arteritis: a new case report and a review of literature.J Eur Acad Dermatol Venereol.2007;21(3):388–391.
