User login
Discharge Before Noon
Late afternoon hospital discharges are thought to create admission bottlenecks in the emergency department (ED).[1] ED overcrowding increases the length of stay (LOS) of patients[2] and is a major dissatisfier for both patients and staff.[3] In our medical center, ED patients who are admitted after 1:00 pm have a 0.6‐day longer risk‐adjusted LOS than those admitted before 1:00 pm (M. Radford, MD, written communication, March 2012).
Many potential barriers to discharging patients early in the day exist.[4] However, comprehensive discharge planning favorably impacts discharge times.[5] There are limited published data regarding discharging patients early in the day. Studies have focused on improved discharge care coordination,[6, 7] in‐room display of planned discharge time,[8] and a discharge brunch.[9] In January 2012, the calendar month discharge before noon (DBN) percentage for 2 inpatient medicine units in our institution was approximately 7%, well below the organizational goal of 30%. We describe an intervention to sustainably increase the DBN percentage.
METHODS
Setting
The intervention took place on the 17th floor of New York University (NYU) Langone Medical Center's Tisch Hospital, an urban, academic medical center. All patients on the 17th floor received the intervention.
The 17th floor is composed of 2 acute care inpatient medical units17E and 17W. Each unit has 35 medical beds including a 16‐bed medical step down unit (SDU). Medical teams on the floor consist of 4 housestaff teams, a nurse practitioner (NP) team, and an SDU team. Each housestaff and NP team is led by a hospitalist, who is the attending of record for the majority of patients, though some patients on these teams are cared for by private attendings. Medical teams admit patients to any unit based upon bed availability. Nurses are assigned patients by acuity, not by medical team.
Intervention
Kick‐Off Event, Definition of Responsibilities, and Checklist
All stakeholders and front‐line staff were invited to a kickoff event on March 5, 2012. This event included education and discussion about the importance of a safe and early discharge from the patient and staff perspective. Roles in the discharge process were clearly defined and a corresponding checklist was created (Table 1). The checklist was used at least once per day during afternoon interdisciplinary in preparation for next‐day DBNs. Discharge date and time are communicated by the medical team to individual patients and families on the day a patient is identified for DBN. Patients and families did not receive additional orientation to the DBN initiative.
| Discharge Task | Responsible Team Member |
|---|---|
| |
| MD discharge summary and medication reconciliation | Resident or NP |
| Discharge order | Resident or NP |
| Prescription(s) | Resident or NP |
| Communicate discharge date and time to patient/family | Resident/hospitalist/NP |
| Patient education | Nurse |
| RN discharge summary | Nurse |
| Patient belongings/clothing | Nurse |
| Patient education/teaching | Nurse |
| Final labs/tests | Nurse |
| Assess Foley catheter need and remove | Nurse |
| Transportation | Social worker and care manager |
| At‐home services (HHA/HA/private hire) | Social worker and care manager |
| Equipment/supplies (DME, O2, ostomy supplies) | Social worker and care manager |
Interdisciplinary Rounds and DBN Website
In the past, interdisciplinary rounds, attended by each unit's charge nurse (CN), the medical resident or NP, the hospitalist, the team‐based social work (SW), and care management (CM) occurred in the morning between 9:00 am and 10:00 am. With the DBN initiative, additional afternoon interdisciplinary rounds were held at 3:00 pm. These rounds were designed to identify the next day's DBNs. Multidisciplinary team members were asked to complete the checklist responsibilities the same day that DBNs were identified rather than waiting until the day of discharge. A DBN website was created, and CMs were asked to log anticipated DBNs on this site after 3:00 pm rounds. The website generates a daily automated email at 4:30 pm to the DBN listserv with a list of the next day's anticipated DBNs. The listserv includes all hospitalists, residents, NPs, CNs, nurse managers (NM), medical directors, bed management, building services, SWs, and CMs. Additional departments were subsequently added as the DBN initiative became standard of care.
Assistant NMs update the DBN website overnight, adding patients identified by nursing staff as a possible DBN and highlighting changes in the condition of previously identified patients. At 7:00 am, an automated update email is sent by the website to the listserv. The automated emails include the DBN checklist, key phone numbers, and useful links.
Daily Leadership Meeting, Ongoing Process Improvement, and Real‐Time Feedback
Weekdays at 11:00 am, an interdisciplinary leadership meeting occurs with the medical directors, assistant NMs, CNs, and representatives from SW, CM, and hospital administration. At this meeting, all discharges from the previous day are reviewed to identify areas for improvement and trends in barriers to DBN. The current day's expected DBNs are also reviewed to address discharge bottlenecks in real time. Daily feedback was provided via a poster displayed in staff areas with daily DBN statistics.
Reward and Recognition
At the kickoff, a prize system was announced for the conclusion of the first month of the intervention if DBN thresholds were met. Rewards included a pizza party and raffle gift certificates. To hardwire the process, these rewards were repeated at the conclusion of each of the first 3 months of the intervention.
Changes to the Floor
There were notable changes to the floor during the time of this intervention. From October 25, 2012 until January 1, 2013, the hospital was closed after evacuation due to Hurricane Sandy. Units 17E and 17W reopened on January 14, 2013. The NP team was not restarted with the reopening. All other floor processes, including the DBN interventions, were restarted. The time period of floor closure was excluded in this analysis. The initial medical center goal was 30% DBNs. During the intervention period, the goal increased to 40%.
Data Collection and Analysis
Primary Outcome: Calendar Month DBN Percentage
The date and time of discharge are recorded by the discharging nurse or patient unit assistant in our electronic medical record (Epic, Madison WI) at the time the patient leaves the unit. Utilizing NYU's cost accounting system (Enterprise Performance Systems Inc., Chicago, IL), we obtained discharge date and time among inpatients discharged from units 17E and 17W between June 1, 2011 and March 4, 2012 (the baseline period) and March 5, 2012 and June 31, 2013 (the intervention period). Data from October 25, 2012 to the end of January 2013 were excluded due to hospital closure from Hurricane Sandy. The analysis includes 8 months of baseline data and 13 months of intervention data (not counting the excluded months from hospital closure), measuring the extent to which improvement was sustained. To match organizational criteria for DBN, we excluded patients on the units in the patient class observation, deaths, and inpatient hospice.
Patients were identified as DBNs if the discharge time was before 12:01 pm, in accordance with our medical center administration's definition of DBN. Calendar month DBN percentage was calculated by dividing the number of DBN patients during the calendar month by the total number of discharged patients during the calendar month. The proportion of DBNs in the baseline population was compared to the proportion of DBNs in the intervention population. Statistical significance for the change in DBN was evaluated by use of a 2‐tailed z test.
Secondary Outcomes: Observed‐to‐Expected LOS and 30‐Day Readmission Rate
Expected LOS was provided by the University Health Consortium (UHC). UHC calculates a risk‐adjusted LOS for each patient by assigning a severity of illness, selection of a patient population to serve as a basis of the model, and use of statistical regression to assign an expected LOS in days. Observed‐to‐expected (O/E) LOS for each patient is calculated by dividing the expected LOS in days by the observed (actual) LOS in days. The average of the O/E LOS for all patients in the baseline period was compared to the average O/E LOS for all patients in the intervention period. This average was calculated by summing the O/E LOS of all patients in each time period and dividing by the total number of patients. In accordance with our medical center administration's reporting standards, we report the mean of the O/E LOS. For statistical evaluation of this non‐normally distributed continuous variable, we also report the median of the O/E LOS for the baseline and intervention time period and use the Wilcoxon rank sum test to evaluate for statistical significance.
Readmission cases are identified by the clinical quality and effectiveness department at our medical center using the UHC definition of all patients who are readmitted to a hospital within 30 days of discharge from the index admission. The 30‐day readmission rate is calculated by dividing the total number of cases identified as readmissions within 30 days by the total number of admissions over the same time period. This rate was obtained on a calendar‐month basis for patients discharged from the index admission before noon, after noon, and in total. These rates were averaged over the baseline and intervention period. The proportion of 30‐day readmissions in the baseline population was compared to the proportion of 30‐day readmissions in the intervention population. Statistical significance for the change in 30‐day readmissions was evaluated by use of a 2‐tailed z test.
RESULTS
Primary Outcome: Calendar Month DBN Percentage
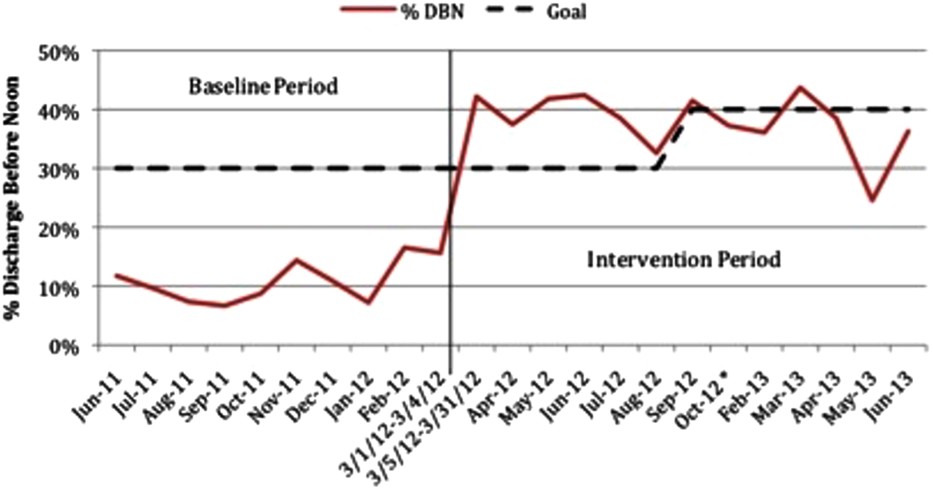
The calendar month DBN percentage increased in the first month of the intervention, from 16% to 42% (Figure 1). This improvement was sustained throughout the intervention, with an average calendar month DBN percentage of 38% over the 13‐month intervention period. Use of a 2‐tailed z test to compare the pre‐intervention proportion (11%) of patients who were DBN with the post‐intervention proportion (38%) who were DBN showed a statistically significant change (z score 23.6, P = 0.0002). Units 17E and 17W had a combined 2536 total discharges in the baseline period, with 265 patients discharged before noon. In the intervention period, 3277 total discharges occurred, with 1236 patients discharged before noon. The average time of discharge moved 1 hour and 31 minutes, from 3:43 pm in the baseline period to 2:13 pm in the intervention period.

Secondary Outcomes: O/E LOS and 30‐Day Readmission Rate
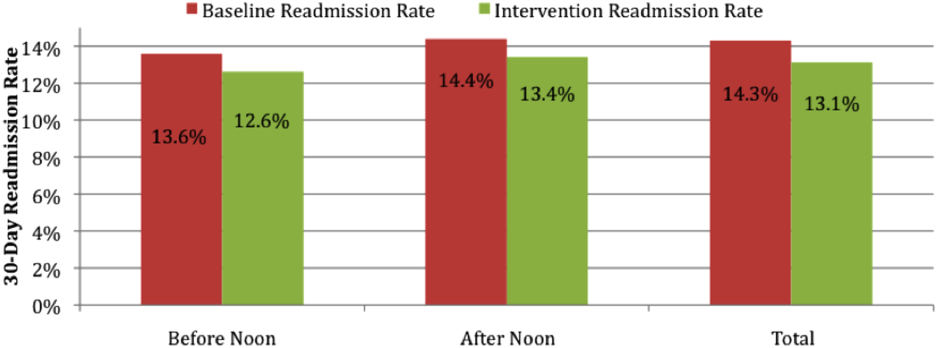
The average O/E LOS during the baseline period was 1.06, and this declined during the intervention period to 0.96 [Table 2]. Using the Wilcoxon rank sum test, we found a statistically significant difference between the O/E LOS in the baseline (median 0.82) and intervention (median 0.76) periods (P = 0.0001). The average 30‐day readmission rate declined from 14.3% during the baseline to 13.1% during the intervention period. The change in 30‐day readmission rate was not statistically significant (z score=1.3132, P=0.1902). The change in readmission rate was similar and not statistically significant whether the patient was discharged before (13.6% baseline vs 12.6% intervention, P=0.66) or after noon (14.4% baseline vs 13.4% intervention, P=0.35) (Figure 2).
| Units 17E and 17W | Baseline Period | Intervention Period | Change | P Value |
|---|---|---|---|---|
| ||||
| O/E LOS, mean (median) | 1.06 (0.82) | 0.96 (0.76) | 10% | 0.0001a |
| 30‐day readmission rate | 14.3 | 13.1 | 1.2% | 0.1902 |
DISCUSSION
Throughput and discharges late in the day are challenges that face all medical centers. We demonstrate that successful and sustainable improvements in DBN are possible. We were able to increase the DBN percentage from 11% in the baseline period to an average of 38% in the 13 months after our intervention. Our success allowed us to surpass our medical center's initial goal of 30% DBN.
The intervention took place on 2 inpatient medical units at an urban, academic medical center. This intervention is likely generalizable to comparable medical centers. The study is limited by the implementation of multiple interventions as part of the DBN initiative at the same time. We are unable to isolate the effect of individual changes. If other medical centers wish to use a similar intervention, we believe the 3 most important parts of our intervention are: (1) kickoff event to engage all staff with a clear definition of roles; (2) daily real‐time feedback, utilizing tools such as unit boards tracking the DBN percentage; and (3) a standardized form of communication for expected DBNs. In our experience, for a DBN to be successful, the team, patient, and family members must be alerted, and discharge plans must be initiated at least 1 day prior to the expected discharge. Attempting to discharge a patient before noon when they have been identified on the day of discharge is a losing proposition, both to achieve a coordinated, safe discharge and for staff and patient satisfaction.
The O/E LOS and 30‐day readmission rate declined over the intervention period, suggesting that there is no negative effect on these metrics. There was concern that staff would choose to keep patients an extra night to allow for an extra DBN the following day. This was actively discouraged during the kickoff event and throughout the intervention period at interdisciplinary rounds and through informal communications. Based upon the decline in O/E LOS, this did not occur. There was also concern that the 30‐day readmission rate may increase if patients are discharged earlier in the day than usual. We observed an actual but not statistically significant decline in 30‐day readmission rate, potentially due to improved communication between team members and earlier identification of expected discharges at the prior day's afternoon DBN rounds. It is unknown if the decline in O/E LOS and 30‐day readmission rate was effected by the DBN initiative. Many other initiatives were ongoing within the medical center that could be effecting these variables. More research is required to better understand the true effect of DBN on LOS and 30‐day readmission rate.
There is limited literature on discharge early in the day. One previous study showed improvement in the DBN percentage on an obstetric floor through the institution of a discharge brunch.[9] Another report showed a modest increase (from 19.6% to 26%) in DBNs with the use of scheduled discharges.[6] This study was of unclear duration and was not specific to medical units. Another study focused on the use of in‐room display boards to document the expected day and time of patient discharge.[8] That report focused on the ability to schedule and achieve the scheduled discharge date and time. The authors describe a trend toward more discharges early in the day but provide no specific data on this effect. The only study looking specifically at discharge early in the day on a medical unit showed improvement in the discharge before 1:00 pm percentage, but was of small size (81 total patients) and short duration (1 month).[7] Our study is of larger size and longer duration, is focused on implementation of a medical service, and provides a comprehensive system that should be reproducible.
There are several next steps to our work. We will continue to monitor the DBN percentage and the ongoing sustainability of the project. We plan to investigate the effect of this rapid and notable increase in DBN percentage on a variety of patient outcomes and hospital metrics, including patient satisfaction, timeliness of ED admissions, intensive care unit transfers to the medical floor, and direct admissions.
Our study demonstrates that increased timely discharge is an achievable and sustainable goal for medical centers. Future work will allow for better understanding of the full effects of such an intervention on patient outcomes and hospital metrics.
- , , , . Impact of admission and discharge peak times on hospital overcrowding. Stud Health Technol Inform. 2011;168:82–88.
- , , , , , . Boarding inpatients in the emergency department increases discharged patient length of stay. J Emerg Med. 2013;44(1):230–235.
- , . Overcrowding in the nation's emergency departments: complex causes and disturbing effects. Ann Emerg Med. 2000;35(1):63–68.
- , , . Caregiver perceptions of the reasons for delayed hospital discharge. Eff Clin Pract. 2001;4(6):250–255.
- , , , et al. Daily multidisciplinary discharge rounds in a trauma center: a little time, well spent. J Trauma. 2009;66(3):880–887.
- , , , . All roads lead to scheduled discharges. Nursing. 2008;38(12):61–63.
- , , , . Discharging patients earlier in the day: a concept worth evaluating. Health Care Manag (Frederick). 2007;26(2):142–146.
- , , , et al. In‐room display of day and time patient is anticipated to leave hospital: a “discharge appointment”. J Hosp Med. 2007;2(1):13–16.
- , . The discharge brunch: reducing chaos and increasing smiles on the OB unit. Nurs Womens Health. 2009;13(5):402–409.
Late afternoon hospital discharges are thought to create admission bottlenecks in the emergency department (ED).[1] ED overcrowding increases the length of stay (LOS) of patients[2] and is a major dissatisfier for both patients and staff.[3] In our medical center, ED patients who are admitted after 1:00 pm have a 0.6‐day longer risk‐adjusted LOS than those admitted before 1:00 pm (M. Radford, MD, written communication, March 2012).
Many potential barriers to discharging patients early in the day exist.[4] However, comprehensive discharge planning favorably impacts discharge times.[5] There are limited published data regarding discharging patients early in the day. Studies have focused on improved discharge care coordination,[6, 7] in‐room display of planned discharge time,[8] and a discharge brunch.[9] In January 2012, the calendar month discharge before noon (DBN) percentage for 2 inpatient medicine units in our institution was approximately 7%, well below the organizational goal of 30%. We describe an intervention to sustainably increase the DBN percentage.
METHODS
Setting
The intervention took place on the 17th floor of New York University (NYU) Langone Medical Center's Tisch Hospital, an urban, academic medical center. All patients on the 17th floor received the intervention.
The 17th floor is composed of 2 acute care inpatient medical units17E and 17W. Each unit has 35 medical beds including a 16‐bed medical step down unit (SDU). Medical teams on the floor consist of 4 housestaff teams, a nurse practitioner (NP) team, and an SDU team. Each housestaff and NP team is led by a hospitalist, who is the attending of record for the majority of patients, though some patients on these teams are cared for by private attendings. Medical teams admit patients to any unit based upon bed availability. Nurses are assigned patients by acuity, not by medical team.
Intervention
Kick‐Off Event, Definition of Responsibilities, and Checklist
All stakeholders and front‐line staff were invited to a kickoff event on March 5, 2012. This event included education and discussion about the importance of a safe and early discharge from the patient and staff perspective. Roles in the discharge process were clearly defined and a corresponding checklist was created (Table 1). The checklist was used at least once per day during afternoon interdisciplinary in preparation for next‐day DBNs. Discharge date and time are communicated by the medical team to individual patients and families on the day a patient is identified for DBN. Patients and families did not receive additional orientation to the DBN initiative.
| Discharge Task | Responsible Team Member |
|---|---|
| |
| MD discharge summary and medication reconciliation | Resident or NP |
| Discharge order | Resident or NP |
| Prescription(s) | Resident or NP |
| Communicate discharge date and time to patient/family | Resident/hospitalist/NP |
| Patient education | Nurse |
| RN discharge summary | Nurse |
| Patient belongings/clothing | Nurse |
| Patient education/teaching | Nurse |
| Final labs/tests | Nurse |
| Assess Foley catheter need and remove | Nurse |
| Transportation | Social worker and care manager |
| At‐home services (HHA/HA/private hire) | Social worker and care manager |
| Equipment/supplies (DME, O2, ostomy supplies) | Social worker and care manager |
Interdisciplinary Rounds and DBN Website
In the past, interdisciplinary rounds, attended by each unit's charge nurse (CN), the medical resident or NP, the hospitalist, the team‐based social work (SW), and care management (CM) occurred in the morning between 9:00 am and 10:00 am. With the DBN initiative, additional afternoon interdisciplinary rounds were held at 3:00 pm. These rounds were designed to identify the next day's DBNs. Multidisciplinary team members were asked to complete the checklist responsibilities the same day that DBNs were identified rather than waiting until the day of discharge. A DBN website was created, and CMs were asked to log anticipated DBNs on this site after 3:00 pm rounds. The website generates a daily automated email at 4:30 pm to the DBN listserv with a list of the next day's anticipated DBNs. The listserv includes all hospitalists, residents, NPs, CNs, nurse managers (NM), medical directors, bed management, building services, SWs, and CMs. Additional departments were subsequently added as the DBN initiative became standard of care.
Assistant NMs update the DBN website overnight, adding patients identified by nursing staff as a possible DBN and highlighting changes in the condition of previously identified patients. At 7:00 am, an automated update email is sent by the website to the listserv. The automated emails include the DBN checklist, key phone numbers, and useful links.
Daily Leadership Meeting, Ongoing Process Improvement, and Real‐Time Feedback
Weekdays at 11:00 am, an interdisciplinary leadership meeting occurs with the medical directors, assistant NMs, CNs, and representatives from SW, CM, and hospital administration. At this meeting, all discharges from the previous day are reviewed to identify areas for improvement and trends in barriers to DBN. The current day's expected DBNs are also reviewed to address discharge bottlenecks in real time. Daily feedback was provided via a poster displayed in staff areas with daily DBN statistics.
Reward and Recognition
At the kickoff, a prize system was announced for the conclusion of the first month of the intervention if DBN thresholds were met. Rewards included a pizza party and raffle gift certificates. To hardwire the process, these rewards were repeated at the conclusion of each of the first 3 months of the intervention.
Changes to the Floor
There were notable changes to the floor during the time of this intervention. From October 25, 2012 until January 1, 2013, the hospital was closed after evacuation due to Hurricane Sandy. Units 17E and 17W reopened on January 14, 2013. The NP team was not restarted with the reopening. All other floor processes, including the DBN interventions, were restarted. The time period of floor closure was excluded in this analysis. The initial medical center goal was 30% DBNs. During the intervention period, the goal increased to 40%.
Data Collection and Analysis
Primary Outcome: Calendar Month DBN Percentage
The date and time of discharge are recorded by the discharging nurse or patient unit assistant in our electronic medical record (Epic, Madison WI) at the time the patient leaves the unit. Utilizing NYU's cost accounting system (Enterprise Performance Systems Inc., Chicago, IL), we obtained discharge date and time among inpatients discharged from units 17E and 17W between June 1, 2011 and March 4, 2012 (the baseline period) and March 5, 2012 and June 31, 2013 (the intervention period). Data from October 25, 2012 to the end of January 2013 were excluded due to hospital closure from Hurricane Sandy. The analysis includes 8 months of baseline data and 13 months of intervention data (not counting the excluded months from hospital closure), measuring the extent to which improvement was sustained. To match organizational criteria for DBN, we excluded patients on the units in the patient class observation, deaths, and inpatient hospice.
Patients were identified as DBNs if the discharge time was before 12:01 pm, in accordance with our medical center administration's definition of DBN. Calendar month DBN percentage was calculated by dividing the number of DBN patients during the calendar month by the total number of discharged patients during the calendar month. The proportion of DBNs in the baseline population was compared to the proportion of DBNs in the intervention population. Statistical significance for the change in DBN was evaluated by use of a 2‐tailed z test.
Secondary Outcomes: Observed‐to‐Expected LOS and 30‐Day Readmission Rate
Expected LOS was provided by the University Health Consortium (UHC). UHC calculates a risk‐adjusted LOS for each patient by assigning a severity of illness, selection of a patient population to serve as a basis of the model, and use of statistical regression to assign an expected LOS in days. Observed‐to‐expected (O/E) LOS for each patient is calculated by dividing the expected LOS in days by the observed (actual) LOS in days. The average of the O/E LOS for all patients in the baseline period was compared to the average O/E LOS for all patients in the intervention period. This average was calculated by summing the O/E LOS of all patients in each time period and dividing by the total number of patients. In accordance with our medical center administration's reporting standards, we report the mean of the O/E LOS. For statistical evaluation of this non‐normally distributed continuous variable, we also report the median of the O/E LOS for the baseline and intervention time period and use the Wilcoxon rank sum test to evaluate for statistical significance.
Readmission cases are identified by the clinical quality and effectiveness department at our medical center using the UHC definition of all patients who are readmitted to a hospital within 30 days of discharge from the index admission. The 30‐day readmission rate is calculated by dividing the total number of cases identified as readmissions within 30 days by the total number of admissions over the same time period. This rate was obtained on a calendar‐month basis for patients discharged from the index admission before noon, after noon, and in total. These rates were averaged over the baseline and intervention period. The proportion of 30‐day readmissions in the baseline population was compared to the proportion of 30‐day readmissions in the intervention population. Statistical significance for the change in 30‐day readmissions was evaluated by use of a 2‐tailed z test.
RESULTS
Primary Outcome: Calendar Month DBN Percentage
The calendar month DBN percentage increased in the first month of the intervention, from 16% to 42% (Figure 1). This improvement was sustained throughout the intervention, with an average calendar month DBN percentage of 38% over the 13‐month intervention period. Use of a 2‐tailed z test to compare the pre‐intervention proportion (11%) of patients who were DBN with the post‐intervention proportion (38%) who were DBN showed a statistically significant change (z score 23.6, P = 0.0002). Units 17E and 17W had a combined 2536 total discharges in the baseline period, with 265 patients discharged before noon. In the intervention period, 3277 total discharges occurred, with 1236 patients discharged before noon. The average time of discharge moved 1 hour and 31 minutes, from 3:43 pm in the baseline period to 2:13 pm in the intervention period.
Secondary Outcomes: O/E LOS and 30‐Day Readmission Rate
The average O/E LOS during the baseline period was 1.06, and this declined during the intervention period to 0.96 [Table 2]. Using the Wilcoxon rank sum test, we found a statistically significant difference between the O/E LOS in the baseline (median 0.82) and intervention (median 0.76) periods (P = 0.0001). The average 30‐day readmission rate declined from 14.3% during the baseline to 13.1% during the intervention period. The change in 30‐day readmission rate was not statistically significant (z score=1.3132, P=0.1902). The change in readmission rate was similar and not statistically significant whether the patient was discharged before (13.6% baseline vs 12.6% intervention, P=0.66) or after noon (14.4% baseline vs 13.4% intervention, P=0.35) (Figure 2).
| Units 17E and 17W | Baseline Period | Intervention Period | Change | P Value |
|---|---|---|---|---|
| ||||
| O/E LOS, mean (median) | 1.06 (0.82) | 0.96 (0.76) | 10% | 0.0001a |
| 30‐day readmission rate | 14.3 | 13.1 | 1.2% | 0.1902 |
DISCUSSION
Throughput and discharges late in the day are challenges that face all medical centers. We demonstrate that successful and sustainable improvements in DBN are possible. We were able to increase the DBN percentage from 11% in the baseline period to an average of 38% in the 13 months after our intervention. Our success allowed us to surpass our medical center's initial goal of 30% DBN.
The intervention took place on 2 inpatient medical units at an urban, academic medical center. This intervention is likely generalizable to comparable medical centers. The study is limited by the implementation of multiple interventions as part of the DBN initiative at the same time. We are unable to isolate the effect of individual changes. If other medical centers wish to use a similar intervention, we believe the 3 most important parts of our intervention are: (1) kickoff event to engage all staff with a clear definition of roles; (2) daily real‐time feedback, utilizing tools such as unit boards tracking the DBN percentage; and (3) a standardized form of communication for expected DBNs. In our experience, for a DBN to be successful, the team, patient, and family members must be alerted, and discharge plans must be initiated at least 1 day prior to the expected discharge. Attempting to discharge a patient before noon when they have been identified on the day of discharge is a losing proposition, both to achieve a coordinated, safe discharge and for staff and patient satisfaction.
The O/E LOS and 30‐day readmission rate declined over the intervention period, suggesting that there is no negative effect on these metrics. There was concern that staff would choose to keep patients an extra night to allow for an extra DBN the following day. This was actively discouraged during the kickoff event and throughout the intervention period at interdisciplinary rounds and through informal communications. Based upon the decline in O/E LOS, this did not occur. There was also concern that the 30‐day readmission rate may increase if patients are discharged earlier in the day than usual. We observed an actual but not statistically significant decline in 30‐day readmission rate, potentially due to improved communication between team members and earlier identification of expected discharges at the prior day's afternoon DBN rounds. It is unknown if the decline in O/E LOS and 30‐day readmission rate was effected by the DBN initiative. Many other initiatives were ongoing within the medical center that could be effecting these variables. More research is required to better understand the true effect of DBN on LOS and 30‐day readmission rate.
There is limited literature on discharge early in the day. One previous study showed improvement in the DBN percentage on an obstetric floor through the institution of a discharge brunch.[9] Another report showed a modest increase (from 19.6% to 26%) in DBNs with the use of scheduled discharges.[6] This study was of unclear duration and was not specific to medical units. Another study focused on the use of in‐room display boards to document the expected day and time of patient discharge.[8] That report focused on the ability to schedule and achieve the scheduled discharge date and time. The authors describe a trend toward more discharges early in the day but provide no specific data on this effect. The only study looking specifically at discharge early in the day on a medical unit showed improvement in the discharge before 1:00 pm percentage, but was of small size (81 total patients) and short duration (1 month).[7] Our study is of larger size and longer duration, is focused on implementation of a medical service, and provides a comprehensive system that should be reproducible.
There are several next steps to our work. We will continue to monitor the DBN percentage and the ongoing sustainability of the project. We plan to investigate the effect of this rapid and notable increase in DBN percentage on a variety of patient outcomes and hospital metrics, including patient satisfaction, timeliness of ED admissions, intensive care unit transfers to the medical floor, and direct admissions.
Our study demonstrates that increased timely discharge is an achievable and sustainable goal for medical centers. Future work will allow for better understanding of the full effects of such an intervention on patient outcomes and hospital metrics.
- , , , . Impact of admission and discharge peak times on hospital overcrowding. Stud Health Technol Inform. 2011;168:82–88.
- , , , , , . Boarding inpatients in the emergency department increases discharged patient length of stay. J Emerg Med. 2013;44(1):230–235.
- , . Overcrowding in the nation's emergency departments: complex causes and disturbing effects. Ann Emerg Med. 2000;35(1):63–68.
- , , . Caregiver perceptions of the reasons for delayed hospital discharge. Eff Clin Pract. 2001;4(6):250–255.
- , , , et al. Daily multidisciplinary discharge rounds in a trauma center: a little time, well spent. J Trauma. 2009;66(3):880–887.
- , , , . All roads lead to scheduled discharges. Nursing. 2008;38(12):61–63.
- , , , . Discharging patients earlier in the day: a concept worth evaluating. Health Care Manag (Frederick). 2007;26(2):142–146.
- , , , et al. In‐room display of day and time patient is anticipated to leave hospital: a “discharge appointment”. J Hosp Med. 2007;2(1):13–16.
- , . The discharge brunch: reducing chaos and increasing smiles on the OB unit. Nurs Womens Health. 2009;13(5):402–409.
© 2014 Society of Hospital Medicine
Residents' ECG Interpretation Skills
Decreased efficiency at the beginning of residency training likely results in preventable harm for patients, a phenomenon known as the July Effect.[1, 2] Postgraduate year (PGY)1 residents enter training with a variety of clinical skills and experiences, and concerns exist regarding their preparation to enter graduate medical education (GME).[3] Electrocardiogram (ECG) interpretation is a core clinical skill that residents must have on the first day of training to manage patients, recognize emergencies, and develop evidence‐based and cost‐effective treatment plans. We assessed incoming PGY‐1 residents' ability to interpret common ECG findings as part of a rigorous boot camp experience.[4]
METHODS
This was an institutional review board‐approved pre‐post study of 81 new PGY‐1 residents' ECG interpretation skills. Subjects represented all trainees from internal medicine (n=47), emergency medicine (n=13), anesthesiology (n=11), and general surgery (n=10), who entered GME at Northwestern University in June 2013. Residents completed a pretest, followed by a 60‐minute interactive small group tutorial and a post‐test. Program faculty and expert cardiologists selected 10 common ECG findings for the study, many representing medical emergencies requiring immediate treatment. The diagnoses were: normal sinus rhythm, hyperkalemia, right bundle branch block (RBBB), left bundle branch block (LBBB), complete heart block, lateral wall myocardial infarction (MI), anterior wall MI, atrial fibrillation, ventricular paced rhythm, and ventricular tachycardia (VT). ECGs were selected from an online reference set (
RESULTS
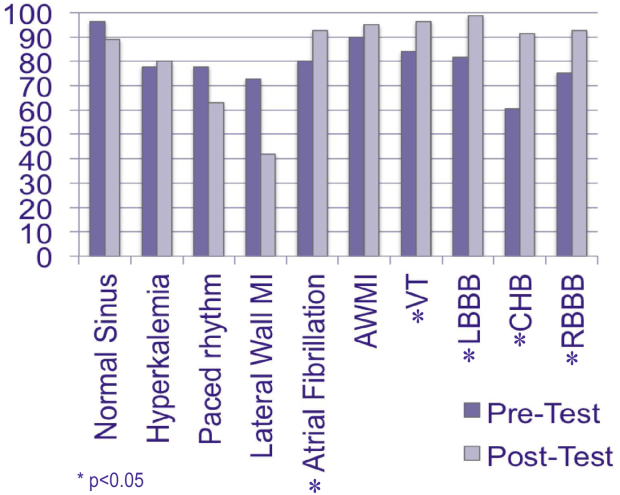
All 81 residents completed the study. The mean age was 27 years, and 56% were male. Eighty (99%) graduated from a US medical school. The mean United States Medical Licensing Examination scores were step 1: 243.8 (14.4) and step 2: 251.8 (13.6). Twenty‐six (32%) completed a cardiology rotation in medical school. Before the pretest, residents self‐assessed their ECG interpretation skills as a mean of 61.8 (standard deviation 17.2) using a scale of 0 (not confident) to 100 (very confident). Pretest results ranged from 60.5% correct (complete heart block) to 96.3% correct (normal sinus rhythm). Eighteen residents (22%) did not recognize hyperkalemia, 20 (25%) were unable to identify RBBB, and 15 (18%) LBBB. Twenty‐two (27%) could not discern a lateral wall MI, and 8 residents (10%) missed an anterior wall MI. Sixteen (20%) could not diagnose atrial fibrillation, 18 (22%) could not identify a ventricular paced rhythm, and 13 (16%) did not recognize VT. Mean post‐test scores improved significantly for 5 cases (P0.05), but did not rise significantly for normal sinus rhythm, lateral wall MI, anterior wall MI, hyperkalemia, and ventricular paced rhythm 1.

DISCUSSION
PGY‐1 residents from multiple specialties were not confident regarding their ability to interpret ECGs and could not reliably identify 10 basic findings. This is despite graduating almost exclusively from US medical schools and performing at high levels on standardized tests. Although boot camp improved recognition of important ECG findings, including VT and bundle branch blocks, identification of emergent diagnoses such as lateral/anterior MI and hyperkalemia require additional training and close supervision during patient care. This study provides further evidence that the preparation of PGY‐1 residents to enter GME is lacking. Recent calls for inclusion of cost‐consciousness and stewardship of resources as a seventh competency for residents[5] are challenging, because incoming trainees do not uniformly possess the basic clinical skills needed to make these judgments.[3, 4] If residents cannot reliably interpret ECGs, it is not possible to determine cost‐effective testing strategies for patients with cardiac conditions. Based on the result of this study and others,[3, 4] we believe medical schools should agree upon specific graduation requirements to ensure all students have mastered core competencies and are prepared to enter GME.
Acknowledgments
Disclosure: Nothing to report.
- , . The July effect: fertile ground for systems improvement. Ann Intern Med. 2011;155(5):331–332.
- , , , , , . July effect: impact of the academic year‐end changeover on patient outcomes: a systematic review. Ann Intern Med. 2011;155(5):309–315.
- , , , . Assessing residents' competencies at baseline: identifying the gaps. Acad Med. 2004;79(6):564–570.
- , , , et al. Making July safer: simulation‐based mastery learning during intern boot camp. Acad Med. 2013;88(2):233–239.
- . Providing high‐value, cost‐conscious care: a critical seventh general competency for physicians. Ann Intern Med. 2011;155(6):386–388.
Decreased efficiency at the beginning of residency training likely results in preventable harm for patients, a phenomenon known as the July Effect.[1, 2] Postgraduate year (PGY)1 residents enter training with a variety of clinical skills and experiences, and concerns exist regarding their preparation to enter graduate medical education (GME).[3] Electrocardiogram (ECG) interpretation is a core clinical skill that residents must have on the first day of training to manage patients, recognize emergencies, and develop evidence‐based and cost‐effective treatment plans. We assessed incoming PGY‐1 residents' ability to interpret common ECG findings as part of a rigorous boot camp experience.[4]
METHODS
This was an institutional review board‐approved pre‐post study of 81 new PGY‐1 residents' ECG interpretation skills. Subjects represented all trainees from internal medicine (n=47), emergency medicine (n=13), anesthesiology (n=11), and general surgery (n=10), who entered GME at Northwestern University in June 2013. Residents completed a pretest, followed by a 60‐minute interactive small group tutorial and a post‐test. Program faculty and expert cardiologists selected 10 common ECG findings for the study, many representing medical emergencies requiring immediate treatment. The diagnoses were: normal sinus rhythm, hyperkalemia, right bundle branch block (RBBB), left bundle branch block (LBBB), complete heart block, lateral wall myocardial infarction (MI), anterior wall MI, atrial fibrillation, ventricular paced rhythm, and ventricular tachycardia (VT). ECGs were selected from an online reference set (
RESULTS
All 81 residents completed the study. The mean age was 27 years, and 56% were male. Eighty (99%) graduated from a US medical school. The mean United States Medical Licensing Examination scores were step 1: 243.8 (14.4) and step 2: 251.8 (13.6). Twenty‐six (32%) completed a cardiology rotation in medical school. Before the pretest, residents self‐assessed their ECG interpretation skills as a mean of 61.8 (standard deviation 17.2) using a scale of 0 (not confident) to 100 (very confident). Pretest results ranged from 60.5% correct (complete heart block) to 96.3% correct (normal sinus rhythm). Eighteen residents (22%) did not recognize hyperkalemia, 20 (25%) were unable to identify RBBB, and 15 (18%) LBBB. Twenty‐two (27%) could not discern a lateral wall MI, and 8 residents (10%) missed an anterior wall MI. Sixteen (20%) could not diagnose atrial fibrillation, 18 (22%) could not identify a ventricular paced rhythm, and 13 (16%) did not recognize VT. Mean post‐test scores improved significantly for 5 cases (P0.05), but did not rise significantly for normal sinus rhythm, lateral wall MI, anterior wall MI, hyperkalemia, and ventricular paced rhythm 1.
DISCUSSION
PGY‐1 residents from multiple specialties were not confident regarding their ability to interpret ECGs and could not reliably identify 10 basic findings. This is despite graduating almost exclusively from US medical schools and performing at high levels on standardized tests. Although boot camp improved recognition of important ECG findings, including VT and bundle branch blocks, identification of emergent diagnoses such as lateral/anterior MI and hyperkalemia require additional training and close supervision during patient care. This study provides further evidence that the preparation of PGY‐1 residents to enter GME is lacking. Recent calls for inclusion of cost‐consciousness and stewardship of resources as a seventh competency for residents[5] are challenging, because incoming trainees do not uniformly possess the basic clinical skills needed to make these judgments.[3, 4] If residents cannot reliably interpret ECGs, it is not possible to determine cost‐effective testing strategies for patients with cardiac conditions. Based on the result of this study and others,[3, 4] we believe medical schools should agree upon specific graduation requirements to ensure all students have mastered core competencies and are prepared to enter GME.
Acknowledgments
Disclosure: Nothing to report.
- , . The July effect: fertile ground for systems improvement. Ann Intern Med. 2011;155(5):331–332.
- , , , , , . July effect: impact of the academic year‐end changeover on patient outcomes: a systematic review. Ann Intern Med. 2011;155(5):309–315.
- , , , . Assessing residents' competencies at baseline: identifying the gaps. Acad Med. 2004;79(6):564–570.
- , , , et al. Making July safer: simulation‐based mastery learning during intern boot camp. Acad Med. 2013;88(2):233–239.
- . Providing high‐value, cost‐conscious care: a critical seventh general competency for physicians. Ann Intern Med. 2011;155(6):386–388.
Entrusting Residents with Tasks
Determining when residents are independently prepared to perform clinical care tasks safely is not easy or understood. Educators have struggled to identify robust ways to evaluate trainees and their preparedness to treat patients while unsupervised. Trust allows the trainee to experience increasing levels of participation and responsibility in the workplace in a way that builds competence for future practice. The breadth of knowledge and skills required to become a competent and safe physician, coupled with the busy workload confound this challenge. Notably, a technically proficient trainee may not have the clinical judgment to treat patients without supervision.
The Accreditation Council of Graduate Medical Education (ACGME) has previously outlined 6 core competencies for residency training: patient care, medical knowledge, practice‐based learning and improvement, interpersonal and communication skills, professionalism, and systems‐based practice.[1] A systematic literature review suggests that traditional trainee evaluation tools are difficult to use and unreliable in measuring the competencies independently from one another, whereas certain competencies are consistently difficult to quantify in a reliable and valid way.[2] The evaluation of trainees' clinical performance despite efforts to create objective tools remain strongly influenced by subjective measures and continues to be highly variable among different evaluators.[3] Objectively measuring resident autonomy and readiness to supervise junior colleagues remains imprecise.[4]
The ACGME's Next Accreditation System (NAS) incorporates educational milestones as part of the reporting of resident training outcomes.[5] The milestones allow for the translation of the core competencies into integrative and observable abilities. Furthermore, the milestone categories are stratified into tiers to allow progress to be measured longitudinally and by task complexity using a novel assessment strategy.
The development of trust between supervisors and trainees is a critical step in decisions to allow increased responsibility and the provision of autonomous decision making, which is an important aspect of physician training. Identifying the factors that influence the supervisors' evaluation of resident competency and capability is at the crux of trainee maturation as well as patient safety.[4] Trust, defined as believability and discernment by attendings of resident physicians, plays a large role in attending evaluations of residents during their clinical rotations.[3] Trust impacts the decisions of successful performance of entrustable professional activities (EPAs), or those tasks that require mastery prior to completion of training milestones.[6] A study of entrustment decisions made by attending anesthesiologists identified the factors that contribute to the amount of autonomy given to residents, such as trainee trustworthiness, medical knowledge, and level of training.[4] The aim of our study, building on this study, was 2‐fold: (1) use deductive qualitative analysis to apply this framework to existing resident and attending data, and (2) define the categories within this framework and describe how internal medicine attending and resident physician perceptions of trust can impact clinical decision making and patient care.
METHODS
We are reporting on a secondary data analysis of interview transcripts from a study conducted on the inpatient general medicine service at the University of Chicago, an academic tertiary care medical center. The methods for data collection and full consent have been outlined previously.[7, 8, 9] The institutional review board of the University of Chicago approved this study.
Briefly, between January 2006 and November 2006, all eligible internal medicine resident physicians, postgraduate year (PGY)‐2 or PGY‐3, and attending physicians, either generalists or hospitalists, were privately interviewed within 1 week of their final call night on the inpatient general medicine rotation to assess decision making and clinical supervision during the rotation. All interviews were conducted by 1 investigator (J.F.), and discussions were audio taped and transcribed for analysis. Interviews were conducted at the conclusion of the rotation to prevent any influence on resident and attending behavior during the rotation.
The critical incident technique, a procedure used for collecting direct observations of human behavior that have critical significance on the decision‐making process, was used to solicit examples of ineffective supervision, inquiring about 2 to 3 important clinical decisions made on the most recent call night, with probes to identify issues of trust, autonomy, and decision making.[10] A critical incident can be described as one that makes a significant contribution, either positively or negatively, on the process.
Appreciative inquiry, a technique that aims to uncover the best things about the clinical encounter being explored, was used to solicit examples of effective supervision. Probes are used to identify factors, either personal or situational, that influenced the withholding or provision of resident autonomy during periods of clinical care delivery.[11]
All identifiable information was removed from the interview transcripts to protect participant and patient confidentiality. Deductive qualitative analysis was performed using the conceptual EPA framework, which describes several factors that influence the attending physicians' decisions to deem a resident trustworthy to independently fulfill a specific clinical task.[4] These factors include (1) the nature of the task, (2) the qualities of the supervisor, (3) the qualities of the trainee and the quality of the relationship between the supervisor and the trainee, and (4) the circumstances surrounding the clinical task.
The deidentified, anonymous transcripts were reviewed by 2 investigators (K.J.C., J.M.F.) and analyzed using the constant comparative methods to deductively map the content to the existing framework and generate novel sub themes.[12, 13, 14] Novel categories within each of the domains were inductively generated. Two reviewers (K.J.C., J.M.F.) independently applied the themes to a randomly selected 10% portion of the interview transcripts to assess the inter‐rater reliability. The inter‐rater agreement was assessed using the generalized kappa statistic. The discrepancies between reviewers regarding assignment of codes were resolved via discussion and third party adjudication until consensus was achieved on thematic structure. The codes were then applied to the entire dataset.
RESULTS
Between January 2006 and November 2006, 46 of 50 (88%) attending physicians and 44 of 50 (92%) resident physicians were interviewed following the conclusion of their general medicine inpatient rotation. Of attending physicians, 55% were male, 45% were female, and 38% were academic faculty hospitalists. Of the residents who completed interviews, 47% were male, 53% were female, 52% were PGY‐2, and 45% were PGY‐3.
A total of 535 mentions of trust were abstracted from the transcripts. The 4 major domains that influence trusttrainee factors (Table 1), supervisor factors (Table 2), task factors (Table 3), and systems factors (Table 4)were deductively coded with several emerging novel categories and subthemes. The domains were consistent across the postgraduate year of trainee. No differences in themes were noted, other than those explicitly stated, between the postgraduate years.
| Domain (N) | Category (N) | Subtheme (N) | Definition and Representative Comment |
|---|---|---|---|
| |||
| Trainee factors (170); characteristics specific to the trainee that either promote or discourage trust. | Personal characteristics (78); traits that impact attendings' decision regarding trust/allowance of autonomy. | Confidence and overconfidence (29) | Displayed level of comfort when approaching specific clinical situations. I think I havea personality and presenting style [that] people think that I know what I am talkingabout and they just let me run with it. (R) |
| Accountability (18) | Sense of responsibility, including ability to follow‐up on details regarding patient care. [What] bothered me the most was that that kind of lack of accountability for patient careand it makes the whole dynamic of rounds much more stressful. I ended up asking him to page me every day to run the list. (A) | ||
| Familiarity/ reputation (18) | Comfort with trainee gained through prior working experience, or reputation of the trainee based on discussion with other supervisors. I do have to get to know someone a little to develop that level of trust, to know that it is okay to not check the labs every day, okay to not talk to them every afternoon. (A) | ||
| Honesty (13) | Sense trainee is not withholding information in order to impact decision making toward a specific outcome. [The residents] have more information than I do and they can clearly spin that information, and it is very difficult to unravelunless you treat them like a hostile witness on the stand.(A) | ||
| Clinical attributes (92); skills demonstrated in the context of patient care that promote or inhibit trust. | Leadership (19) | Ability to organize, teach, and manage coresidents, interns, and students. I want them to be in chargedeciding the plan and sitting down with the team before rounds. (A) | |
| Communication (12) | Establishing and encouraging conversation with supervisor regarding decision making.Some residents call me regularly and let me know what's going on and others don't, and those who don't I really have trouble withif you're not calling to check in, then I don't trust your judgment. (A) | ||
| Specialty (6) | Trainee future career plans. Whether it's right or wrong, nonmedicine interns may not be as attentive to smaller details, and so I had to be attentive to smaller details on [his] patients. (R2) | ||
| Medical knowledge (39) | Ability to display appropriate level of clinical acumen and apply evidence‐based medicine. I definitelygo on my own gestalt of talking with them and deciding if what they do is reasonable. If they can't explain things to me, that's when I worry. (A) | ||
| Recognition of limitations (16) | Trainee's ability to recognize his/her own weaknesses, accept criticism, and solicit help when appropriate. The first thing is that they know their limits and ask for help either in rounds or outside of rounds. That indicates to me that as they are out there on their own they are less likely to do things that they don't understand. (A) | ||
| Domain (N) | Major Category (N) | Subtheme (N) | Definition and Representative Comment |
|---|---|---|---|
| |||
| Supervisor factors (120); characteristics specific to the supervisor which either promote or discourage trust. | Approachability (34); personality traits, such as approachability, which impact the trainees' perception regarding trust/allowance of autonomy. | Sense that the attending physician is available to and receptive to questions from trainees. I think [attending physicians] being approachable and available to you if you need them is really helpful. (R) | |
| Clinical attributes (86); skills demonstrated in the context of patient care that promote or inhibit trust. | Institutional obligation (17) | Attending physician is the one contractually and legally responsible for the provision of high‐quality and appropriate patient care. If [the residents] have a good reason I can be argued out of my position. I am ultimately responsible andhave to choose if there is some serious dispute. (A) | |
| Experience and expertise (29) | Clinical experience, area of specialty, and research interests of the attending physician. You have to be confident in your own clinical skills and knowledge, confident enough that you can say its okay for me to let go a little bit. (A) | ||
| Observation‐based evaluation (27) | Evaluation of trainee decision‐making ability during the early part of the attending/trainee relationship. It's usually the first post‐call day experience, the first on‐call and post‐call day experience. One of the big things is [if they can] tell if a patient is sick or not sickif they are missing at that level then I get very nervous. I really get a sense [of] how they think about patients. (A) | ||
| Educational obligation (13) | Acknowledging the role of the attending as clinical teacher. My theory with the interns was that they should do it because that's how you learn. (R) | ||
| Domain (N) | Major Category (N) | Subtheme (N) | Definition |
|---|---|---|---|
| |||
| Task factors (146); details or characteristics of the task that encouraged or impeded contacting the supervisor. | Clinical characteristics (103) | Case complexity (25) | Evaluation of the level of difficulty in patient management. I don't expect to be always looking over [the resident's] shoulder, I don't check labs everyday, and I don't call them if I see potassium of 3; I assume that they are going to take care of it. |
| Family/ethical dilemma (10) | Uncertainty regarding respecting the wishes of patients and other ethical dilemmas. There was 1 time I called because we had a very sick patient who had a lot of family asking for more aggressive measures, and I called to be a part of the conversation. | ||
| Interdepartment collaboration (18) | Difficulties when treating patients managed by multiple consult services. I have called [the attending] when I have had trouble pushing things through the systemif we had trouble getting tests or trouble with a particular consult team I would call him. | ||
| Urgency/severity of illness (13) | Clinical condition of patient requires immediate or urgent intervention. If I have something that is really pressing I would probably page my attending. If it's a question [of] just something that I didn't know the answer to [or] wasn't that urgent I could turn to my fellow residents. | ||
| Transitions of care (37) | Communication with supervisor because of concern/uncertainty regarding patient transition decisions. We wanted to know if it was okay to discharge somebody or if something changes where something in the plan changes. I usually text page her or call her. | ||
| Situation or environment characteristics (49) | Proximity of attending physicians and support staff (10) | Availability of attending physicians and staff resources . I have been called in once or twice to help with a lumbar puncture or paracentesis, but not too often. The procedure service makes life much easier than it used to be. | |
| Team culture (33) | Presence or absence of a collaborative and supportive group environment. I had a team that I did trust. I think we communicated well; we were all sort of on the same page. | ||
| Time of day (6) | Time of the task. Once its past 11 pm, I feel like I shouldn't call, the threshold is higherthe patient has to be sicker. | ||
| Domain (N) | Major Categories (N) | Definition |
|---|---|---|
| ||
| Systems factors (99); unmodifiable factors not related to personal characteristics or knowledge of trainee or supervisor. | Workload (15) | Increasing trainee clinical workload results in a more intensive experience. They [residents] get 10 patients within a pretty concentrated timeso they really have to absorb a lot of information in a short period of time. |
| Institutional culture (4) | Anticipated quality of the trainee because of the status of the institution. I assume that our residents and interns are top notch, so I go in with this real assumption that I expect the best of them because we are [the best]. | |
| Clinical experience of trainee (36) | Types of clinical experience prior to supervisor/trainee interaction. The interns have done as much [general inpatient medicine] months as I havethey had both done like 2 or 3 months really close together, so they were sort of at their peak knowledge. | |
| Level of training (25) | Postgraduate year of trainee. It depends on the experience level of the resident. A second year who just finished internship, I am going to supervise more closely and be more detail oriented; a fourth year medicine‐pediatrics resident who is almost done, I will supervise a lot less. | |
| Duty hours/efficiency pressures (5) | Absence of residents due to other competing factors, including compliance with work‐hour restrictions. Before the work‐hour [restrictions], when [residents] were here all the time and knew everything about the patients, I found them to be a lot more reliableand now they are still supposed to be in charge, but hell I am here more often than they are. I am here every day, I have more information than they do. How can you run the show if you are not here every day? | |
| Philosophy of medical education (14) | Belief that trainees learn by the provision of completely autonomous decision making. When you are not around, [the residents] have autonomy, they are the people making the initial decisions and making the initial assessments. They are the ones who are there in the middle of the night, the ones who are there at 3 o'clock in the afternoon. The resident is supposed to have room to make decisions. When I am not there, it's not my show. | |
Trainee Factors
Attending and resident physicians both cited trainee factors as major determinants of granting entrustment (Table 1). Within the domain, the categories described included trainee personal characteristics and clinical characteristics. Of the subthemes noted within the major category of personal characteristics, the perceived confidence or overconfidence of the trainee was most often mentioned. Other subthemes included accountability, familiarity, and honesty. Attending physicians reported using perceived resident confidence as a gauge of the trainee's true ability and comfort. Conversely, some attending physicians reported that perceived overconfidence was a red flag that warranted increased scrutiny. Overconfidence was identified by faculty as trainees with an inability to recognize their limitations in either technical skill or knowledge. Confidence was noted in trainees that recognized their own limitations while also enacting effective management plans, and those physicians that prioritized the patient needs over their personal needs.
The clinical attributes of trainees described by attendings included: leadership skills, communication skills, anticipated specialty, medical knowledge, and perceived recognition of limitations. All participants expressed that the possession of adequate medical knowledge was the most important clinical skills‐related factor in the development of trust. Trainee demonstration of judgment, including applying evidence‐based practice, was used to support attending physician's decision to give residents more autonomy in managing patients. Many attending physicians described a specific pattern of observation and evaluation, in which they would rely on impressions shaped early in the rotation to inform their decisions of entrustment throughout the rotation. The use of this early litmus test was highlighted by several attending physicians. This litmus test described the importance of behavior on the first day/call night and postcall interactions as particularly important opportunities to gauge the ability of a resident to triage new patient admissions, manage their anxiety and uncertainty, and demonstrate maturity and professionalism. Several faculty members discussed examples of their litmus test including checking and knowing laboratory data prior to rounds but not mentioning their findings until they had noted the resident was unaware ([I]f I see a 2 g hemoglobin drop when I check the [electronic medical record {EMR}] and they don't bring it up, I will bring it to their attention, and then I'll get more involved.) or assessing the management of both straightforward and complex patients. They would then use this initial impression to determine their degree of involvement in the care of the patient.
The quality and nature of the communication skills, particularly the increased frequency of contact between resident and attending, was used as a barometer of trainee judgment. Furthermore, attending physicians expressed that they would often micromanage patient care if they did not trust a trainee's ability to reliably and frequently communicate patient status as well as the attendings concerns and uncertainty about future decisions. Some level of uncertainty was generally seen in a positive light by attending physicians, because it signaled that trainees had a mature understanding of their limitations. Finally, the trainee's expressed future specialty, especially if the trainee was a preliminary PGY‐1 resident, or a more senior resident anticipating subspecialty training in a procedural specialty, impacted the degree of autonomy provided.
Supervisor Factors
Supervisor characteristics were further categorized into their approachability and clinical attributes (Table 2). Approachability as a proxy for quality of the relationship, was cited as the personality characteristic that most influenced trust by the residents. This was often described by both attending and resident physicians as the presence of a supportive team atmosphere created through explicit declaration of availability to help with patient care tasks. Some attending physicians described the importance of expressing enthusiasm when receiving queries from their team to foster an atmosphere of nonjudgmental collaboration.
The clinical experience and knowledge base of the attending physician played a role in the provision of autonomy, particularly in times of disagreement about particular clinical decisions. Conversely, attending physicians who had spent less time on inpatient general medicine were more willing to yield to resident suggestions.
Task Factors
The domain of task factors was further divided into the categories that pertained to the clinical aspects of the task and those that pertained to the context, that is the environment in which the entrustment decisions were made (Table 3). Clinical characteristics included case complexity, presence of an ethical dilemma, interdepartmental collaboration, urgency/severity of situation, and transitions of care. The environmental characteristics included physical proximity of supervisors/support, team culture, and time of day. Increasing case complexity, especially the coexistence of legal and/or ethical dilemmas, was often mentioned as a factor driving greater attending involvement. Conversely, straightforward clinical decisions, such as electrolyte repletion, were described as sufficiently easy to allow limited attending involvement. Transitions of care, such as patient discharge or transfer, required greater communication and attending involvement or guidance, regardless of case complexity.
Attending and resident physicians reported that the team dynamics played a large role in the development, granting, or discouragement of trust. Teams with a positive rapport reported a collaborative environment that fostered increased trust by the attending and led to greater resident autonomy. Conversely, team discord that influenced the supervisor‐trainee relationship, often defined as toxic attitudes within the team, was often singled out as the reason attending physicians would feel the need to engage more directly in patient care and by extension have less trust in residents to manage their patients.
Systems Factors
Systems factors were described as the nonmodifiable factors, unrelated to either the characteristics of the supervisor, trainee, or the clinical task (Table 4). The subthemes that emerged included workload, institutional culture, trainee experience, level of training, and duty hours/efficiency pressures. Residents and attending physicians noted that trainee PGY and clinical experience commonly influenced the provision of autonomy and supervision by attendings. Participants reported that the importance of adequate clinical experience was of greater concern given the new duty‐hour restrictions, increased workload, as well as efficiency pressures. Attending physicians noted that trainee absences, even when required to comply with duty‐hour restrictions, had a negative effect on entrustment‐granting decisions. Many attendings felt that a trainee had to be physically present to make informed decisions on the inpatient medicine service.
DISCUSSION
Clinical supervisors must hold the quality of care constant while balancing the amount of supervision and autonomy provided to learners in procedural tasks and clinical decision making. We found that the development of trust is multifactorial and highly contextual. It occurs under the broad constructs of task, supervisor, trainee, and environmental factors, and is well described in prior work. We also demonstrate that often what determines these broader factors is highly subjective, frequently independent of objective measures of trainee performance. Many decisions are based on personal characteristics, such as the perception of honesty, disposition, perceived confidence or perceived overconfidence of the trainee, prior experience, and expressed future field of specialty.
Our findings are consistent with prior research, but go further in describing and demonstrating the existence and innovative use of factors, other than clinical knowledge and skill, in the formation of a multidimensional construct of trust. Kennedy et al. identified 4 dimensions of trust knowledge and skill, discernment, conscientiousness, and truthfulness[15]and demonstrated that supervising physicians rely on specific processes to assess trainee trustworthiness, specifically the use of double checks and language cues. This is consistent with our results, which demonstrate that many attending physicians independently verify information, such as laboratory findings, to inform their perceptions of trainee honesty, attention to detail, and ability to follow orders reliably. Furthermore, our subthemes of communication and the demonstration of logical clinical reasoning correspond to Kennedy's use of language cues.[15] We found that language cues are used as markers of trustworthiness, particularly early on in the rotation, as a litmus test to gauge the trainee's integrity and ability to assess and treat patients unsupervised.
To date, much has been written about the importance of direct observation in the evaluation of trainees.[16, 17, 18, 19] Our results demonstrate that supervising clinicians use a multifactorial, highly nuanced, and subjective process despite validated performance‐based assessment methods, such as the objective structured clinical exam or mini‐clinical evaluation exercise, to assess competence and grant entrustement.[3] Several factors utilized to determine trustworthiness in addition to direct observation are subjective in nature, specifically the trainee's prior experience and expressed career choice.
It is encouraging that attending physicians make use of direct observations to inform decisions of entrustment, albeit in an informal and unstructured way. They also seem to take into account the context and setting in which the observation occurs, and consider both the environmental factors as well as factors that relate to the task itself.[20] For example, attendings and residents reported that team dynamics played a large role in influencing trust decisions. We also found that attending physicians rely on indirect observation and will inquire among their colleagues and other senior residents to gain information about their trainees abilities and integrity. Evaluation tools that facilitate sharing of trainees' level of preparedness, prior feedback, and experience could facilitate the determination of readiness to complete EPAs as well as the reporting of achieved milestones in accordance with the ACGME NAS.
Sharing knowledge about trainees among attendings is common and of increasing importance in the context of attending physicians' shortened exposure to trainees due to the residency work‐hour restrictions and growing productivity pressures. In our study, attending physicians described work‐hour restrictions as detrimental to trainee trustworthiness, either in the context of decreased accountability for patient care or as intrinsic to the nature of forced absences that kept trainees from fully participating in daily ward activities and knowing their patients. Attending physicians felt that trainees did not know their patients well enough to be able to make independent decisions about care. The increased transition to a shift‐based structure of inpatient medicine may result in increasingly less time for direct observation and make it more difficult for attendings to justify their decisions about engendering trust. In addition, the increased fragmentation that is noted in training secondary to the work‐hour regulations may in fact have consequences on the development of clinical skill and decision making, such that increased attention to the need for supervision and longer lead to entrustment may be needed in certain circumstances. Attendings need guidance on how to improve their ability to observe trainees in the context of the new work environment, and how to role model decision making more effectively in the compressed time exposure to housestaff.
Our study has several limitations. The organizational structure and culture of our institution are unique to 1 academic setting. This may undermine our ability to generalize these research findings and analysis to the population at large.[21] In addition, recall bias may have played into the interpretation of the interview content given the timing with which they were performed after the conclusion of the rotation. The study interviews took place in 2006, and it is reasonable to believe that some perceptions concerning duty‐hour restrictions and competency‐based graduate medical education have changed. However, from our ongoing research over the past 5 years[4] and our personal experience with entrustment factors, we believe that the participants' perceptions of trust and competency are valid and have largely remained unchanged, given the similarity in findings to the accepted ten Cate framework. In addition, this work was done following the first iteration of the work‐hour regulations but prior to the implementation of explicit supervisory levels, so it may indeed represent a truer state of the supervisory relationship before external regulations were applied. Finally, this work represents an internal medicine residency training program and may not be generalizable to other specialties that posses different cultural factors that impact the decision for entrustment. However, the congruence of our data with that of the original work of ten Cate, which was done in gynecology,[6] and that of Sterkenberg et al. in anesthesiology,[4] supports our key factors being ubiquitous to all training programs.
In conclusion, we provide new insights into subjective factors that inform the perceptions of trust and entrustment decisions by supervising physicians, specifically subjective trainee characteristics, team dynamics, and informal observation. There was agreement among attendings about which elements of competence are considered most important in their entrustment decisions related to trainee, supervisor, task, and environmental factors. Rather than undervaluing the use of personal factors in the determination of trust, we believe that acknowledgement and appreciation of these factors may be important to give supervisors more confidence and better tools to assess resident physicians, and to understand how their personality traits relate to and impact their professional competence. Our findings are relevant for the development of assessment instruments to evaluate whether medical graduates are ready for safe practice without supervision.
ACKNOWLEDGEMENTS
Disclosures: Dr. Kevin Choo was supported by Scholarship and Discovery, University of Chicago, while in his role as a fourth‐year medical student. This study received institutional review board approval prior to evaluation of our human participants. Portions of this study were presented as an oral abstract at the 35th Annual Meeting of the Society of General Internal Medicine, Orlando, Florida, May 912, 2012.
- Accreditation Council for Graduate Medical Education Common Program Requirements. Available at: http://www.acgme.org/acgmeweb/tabid/429/ProgramandInstitutionalAccreditation/CommonProgramRequirements.aspx, Accessed November 30, 2013.
- , , . Measurement of the general competencies of the Accreditation Council for Graduate Medical Education: a systematic review. Acad Med. 2009;84:301–309.
- , , , , . Toward authentic clinical evaluation: pitfalls in the pursuit of competency. Acad Med. 2010;85(5):780–786.
- , , , , . When do supervising physicians decide to entrust residents with unsupervised tasks? Acad Med. 2010;85(9):1408–1417.
- , , , . The next GME accreditation system—rationale and benefits. N Eng J Med. 2012;366(11):1051–1056.
- . Trust, competence and the supervisor's role in postgraduate training. BMJ. 2006;333:748–751.
- , , , , . Clinical Decision Making and impact on patient care: a qualitative study. Qual Saf Health Care. 2008;17(2):122–126.
- , , , et al. Strategies for effective on call supervision for internal medicine residents: the superb/safety model. J Grad Med Educ. 2010;2(1):46–52.
- , , , , . On‐call supervision and resident autonomy: from micromanager to absentee attending. Am J Med. 2009;122(8):784–788.
- . The critical incident technique. Psychol Bull. 1954;51.4:327–359.
- , . Critical evaluation of appreciative inquiry: bridging an apparent paradox. Action Res. 2006;4(4):401–418.
- , . Basics of Qualitative Research. 2nd ed. Thousand Oaks, CA: Sage Publications; 1998.
- , . How to Design and Evaluate Research in Education. New York, NY: McGraw Hill; 2003.
- , . Qualitative Data Analysis. Thousand Oaks, CA: Sage; 1994.
- , , , . Point‐of‐care assessment of medical trainee competence for independent clinical work. Acad Med. 2008;84:S89–S92.
- , . Viewpoint: competency‐based postgraduate training: can we bridge the gap between theory and clinical practice? Acad Med. 2007;82(6):542–547.
- , , , et al. Assessment of competence and progressive independence in postgraduate clinical training. Med Educ. 2009;43:1156–1165.
- , , . Tools for direct observation and assessment of clinical skills of medical trainees: a systematic review. JAMA. 2009;302(12):1316–1326.
- . Assessment in medical education. N Engl J Med. 2007;356:387–396.
- , , , , . . A prospective study of paediatric cardiac surgical microsystems: assessing the relationships between non‐routine events, teamwork and patient outcomes. BMJ Qual Saf. 2011;20(7):599–603.
- . Generalizability and transferability of meta‐synthesis research findings. J Adv Nurs. 2010;66(2):246–254.
Determining when residents are independently prepared to perform clinical care tasks safely is not easy or understood. Educators have struggled to identify robust ways to evaluate trainees and their preparedness to treat patients while unsupervised. Trust allows the trainee to experience increasing levels of participation and responsibility in the workplace in a way that builds competence for future practice. The breadth of knowledge and skills required to become a competent and safe physician, coupled with the busy workload confound this challenge. Notably, a technically proficient trainee may not have the clinical judgment to treat patients without supervision.
The Accreditation Council of Graduate Medical Education (ACGME) has previously outlined 6 core competencies for residency training: patient care, medical knowledge, practice‐based learning and improvement, interpersonal and communication skills, professionalism, and systems‐based practice.[1] A systematic literature review suggests that traditional trainee evaluation tools are difficult to use and unreliable in measuring the competencies independently from one another, whereas certain competencies are consistently difficult to quantify in a reliable and valid way.[2] The evaluation of trainees' clinical performance despite efforts to create objective tools remain strongly influenced by subjective measures and continues to be highly variable among different evaluators.[3] Objectively measuring resident autonomy and readiness to supervise junior colleagues remains imprecise.[4]
The ACGME's Next Accreditation System (NAS) incorporates educational milestones as part of the reporting of resident training outcomes.[5] The milestones allow for the translation of the core competencies into integrative and observable abilities. Furthermore, the milestone categories are stratified into tiers to allow progress to be measured longitudinally and by task complexity using a novel assessment strategy.
The development of trust between supervisors and trainees is a critical step in decisions to allow increased responsibility and the provision of autonomous decision making, which is an important aspect of physician training. Identifying the factors that influence the supervisors' evaluation of resident competency and capability is at the crux of trainee maturation as well as patient safety.[4] Trust, defined as believability and discernment by attendings of resident physicians, plays a large role in attending evaluations of residents during their clinical rotations.[3] Trust impacts the decisions of successful performance of entrustable professional activities (EPAs), or those tasks that require mastery prior to completion of training milestones.[6] A study of entrustment decisions made by attending anesthesiologists identified the factors that contribute to the amount of autonomy given to residents, such as trainee trustworthiness, medical knowledge, and level of training.[4] The aim of our study, building on this study, was 2‐fold: (1) use deductive qualitative analysis to apply this framework to existing resident and attending data, and (2) define the categories within this framework and describe how internal medicine attending and resident physician perceptions of trust can impact clinical decision making and patient care.
METHODS
We are reporting on a secondary data analysis of interview transcripts from a study conducted on the inpatient general medicine service at the University of Chicago, an academic tertiary care medical center. The methods for data collection and full consent have been outlined previously.[7, 8, 9] The institutional review board of the University of Chicago approved this study.
Briefly, between January 2006 and November 2006, all eligible internal medicine resident physicians, postgraduate year (PGY)‐2 or PGY‐3, and attending physicians, either generalists or hospitalists, were privately interviewed within 1 week of their final call night on the inpatient general medicine rotation to assess decision making and clinical supervision during the rotation. All interviews were conducted by 1 investigator (J.F.), and discussions were audio taped and transcribed for analysis. Interviews were conducted at the conclusion of the rotation to prevent any influence on resident and attending behavior during the rotation.
The critical incident technique, a procedure used for collecting direct observations of human behavior that have critical significance on the decision‐making process, was used to solicit examples of ineffective supervision, inquiring about 2 to 3 important clinical decisions made on the most recent call night, with probes to identify issues of trust, autonomy, and decision making.[10] A critical incident can be described as one that makes a significant contribution, either positively or negatively, on the process.
Appreciative inquiry, a technique that aims to uncover the best things about the clinical encounter being explored, was used to solicit examples of effective supervision. Probes are used to identify factors, either personal or situational, that influenced the withholding or provision of resident autonomy during periods of clinical care delivery.[11]
All identifiable information was removed from the interview transcripts to protect participant and patient confidentiality. Deductive qualitative analysis was performed using the conceptual EPA framework, which describes several factors that influence the attending physicians' decisions to deem a resident trustworthy to independently fulfill a specific clinical task.[4] These factors include (1) the nature of the task, (2) the qualities of the supervisor, (3) the qualities of the trainee and the quality of the relationship between the supervisor and the trainee, and (4) the circumstances surrounding the clinical task.
The deidentified, anonymous transcripts were reviewed by 2 investigators (K.J.C., J.M.F.) and analyzed using the constant comparative methods to deductively map the content to the existing framework and generate novel sub themes.[12, 13, 14] Novel categories within each of the domains were inductively generated. Two reviewers (K.J.C., J.M.F.) independently applied the themes to a randomly selected 10% portion of the interview transcripts to assess the inter‐rater reliability. The inter‐rater agreement was assessed using the generalized kappa statistic. The discrepancies between reviewers regarding assignment of codes were resolved via discussion and third party adjudication until consensus was achieved on thematic structure. The codes were then applied to the entire dataset.
RESULTS
Between January 2006 and November 2006, 46 of 50 (88%) attending physicians and 44 of 50 (92%) resident physicians were interviewed following the conclusion of their general medicine inpatient rotation. Of attending physicians, 55% were male, 45% were female, and 38% were academic faculty hospitalists. Of the residents who completed interviews, 47% were male, 53% were female, 52% were PGY‐2, and 45% were PGY‐3.
A total of 535 mentions of trust were abstracted from the transcripts. The 4 major domains that influence trusttrainee factors (Table 1), supervisor factors (Table 2), task factors (Table 3), and systems factors (Table 4)were deductively coded with several emerging novel categories and subthemes. The domains were consistent across the postgraduate year of trainee. No differences in themes were noted, other than those explicitly stated, between the postgraduate years.
| Domain (N) | Category (N) | Subtheme (N) | Definition and Representative Comment |
|---|---|---|---|
| |||
| Trainee factors (170); characteristics specific to the trainee that either promote or discourage trust. | Personal characteristics (78); traits that impact attendings' decision regarding trust/allowance of autonomy. | Confidence and overconfidence (29) | Displayed level of comfort when approaching specific clinical situations. I think I havea personality and presenting style [that] people think that I know what I am talkingabout and they just let me run with it. (R) |
| Accountability (18) | Sense of responsibility, including ability to follow‐up on details regarding patient care. [What] bothered me the most was that that kind of lack of accountability for patient careand it makes the whole dynamic of rounds much more stressful. I ended up asking him to page me every day to run the list. (A) | ||
| Familiarity/ reputation (18) | Comfort with trainee gained through prior working experience, or reputation of the trainee based on discussion with other supervisors. I do have to get to know someone a little to develop that level of trust, to know that it is okay to not check the labs every day, okay to not talk to them every afternoon. (A) | ||
| Honesty (13) | Sense trainee is not withholding information in order to impact decision making toward a specific outcome. [The residents] have more information than I do and they can clearly spin that information, and it is very difficult to unravelunless you treat them like a hostile witness on the stand.(A) | ||
| Clinical attributes (92); skills demonstrated in the context of patient care that promote or inhibit trust. | Leadership (19) | Ability to organize, teach, and manage coresidents, interns, and students. I want them to be in chargedeciding the plan and sitting down with the team before rounds. (A) | |
| Communication (12) | Establishing and encouraging conversation with supervisor regarding decision making.Some residents call me regularly and let me know what's going on and others don't, and those who don't I really have trouble withif you're not calling to check in, then I don't trust your judgment. (A) | ||
| Specialty (6) | Trainee future career plans. Whether it's right or wrong, nonmedicine interns may not be as attentive to smaller details, and so I had to be attentive to smaller details on [his] patients. (R2) | ||
| Medical knowledge (39) | Ability to display appropriate level of clinical acumen and apply evidence‐based medicine. I definitelygo on my own gestalt of talking with them and deciding if what they do is reasonable. If they can't explain things to me, that's when I worry. (A) | ||
| Recognition of limitations (16) | Trainee's ability to recognize his/her own weaknesses, accept criticism, and solicit help when appropriate. The first thing is that they know their limits and ask for help either in rounds or outside of rounds. That indicates to me that as they are out there on their own they are less likely to do things that they don't understand. (A) | ||
| Domain (N) | Major Category (N) | Subtheme (N) | Definition and Representative Comment |
|---|---|---|---|
| |||
| Supervisor factors (120); characteristics specific to the supervisor which either promote or discourage trust. | Approachability (34); personality traits, such as approachability, which impact the trainees' perception regarding trust/allowance of autonomy. | Sense that the attending physician is available to and receptive to questions from trainees. I think [attending physicians] being approachable and available to you if you need them is really helpful. (R) | |
| Clinical attributes (86); skills demonstrated in the context of patient care that promote or inhibit trust. | Institutional obligation (17) | Attending physician is the one contractually and legally responsible for the provision of high‐quality and appropriate patient care. If [the residents] have a good reason I can be argued out of my position. I am ultimately responsible andhave to choose if there is some serious dispute. (A) | |
| Experience and expertise (29) | Clinical experience, area of specialty, and research interests of the attending physician. You have to be confident in your own clinical skills and knowledge, confident enough that you can say its okay for me to let go a little bit. (A) | ||
| Observation‐based evaluation (27) | Evaluation of trainee decision‐making ability during the early part of the attending/trainee relationship. It's usually the first post‐call day experience, the first on‐call and post‐call day experience. One of the big things is [if they can] tell if a patient is sick or not sickif they are missing at that level then I get very nervous. I really get a sense [of] how they think about patients. (A) | ||
| Educational obligation (13) | Acknowledging the role of the attending as clinical teacher. My theory with the interns was that they should do it because that's how you learn. (R) | ||
| Domain (N) | Major Category (N) | Subtheme (N) | Definition |
|---|---|---|---|
| |||
| Task factors (146); details or characteristics of the task that encouraged or impeded contacting the supervisor. | Clinical characteristics (103) | Case complexity (25) | Evaluation of the level of difficulty in patient management. I don't expect to be always looking over [the resident's] shoulder, I don't check labs everyday, and I don't call them if I see potassium of 3; I assume that they are going to take care of it. |
| Family/ethical dilemma (10) | Uncertainty regarding respecting the wishes of patients and other ethical dilemmas. There was 1 time I called because we had a very sick patient who had a lot of family asking for more aggressive measures, and I called to be a part of the conversation. | ||
| Interdepartment collaboration (18) | Difficulties when treating patients managed by multiple consult services. I have called [the attending] when I have had trouble pushing things through the systemif we had trouble getting tests or trouble with a particular consult team I would call him. | ||
| Urgency/severity of illness (13) | Clinical condition of patient requires immediate or urgent intervention. If I have something that is really pressing I would probably page my attending. If it's a question [of] just something that I didn't know the answer to [or] wasn't that urgent I could turn to my fellow residents. | ||
| Transitions of care (37) | Communication with supervisor because of concern/uncertainty regarding patient transition decisions. We wanted to know if it was okay to discharge somebody or if something changes where something in the plan changes. I usually text page her or call her. | ||
| Situation or environment characteristics (49) | Proximity of attending physicians and support staff (10) | Availability of attending physicians and staff resources . I have been called in once or twice to help with a lumbar puncture or paracentesis, but not too often. The procedure service makes life much easier than it used to be. | |
| Team culture (33) | Presence or absence of a collaborative and supportive group environment. I had a team that I did trust. I think we communicated well; we were all sort of on the same page. | ||
| Time of day (6) | Time of the task. Once its past 11 pm, I feel like I shouldn't call, the threshold is higherthe patient has to be sicker. | ||
| Domain (N) | Major Categories (N) | Definition |
|---|---|---|
| ||
| Systems factors (99); unmodifiable factors not related to personal characteristics or knowledge of trainee or supervisor. | Workload (15) | Increasing trainee clinical workload results in a more intensive experience. They [residents] get 10 patients within a pretty concentrated timeso they really have to absorb a lot of information in a short period of time. |
| Institutional culture (4) | Anticipated quality of the trainee because of the status of the institution. I assume that our residents and interns are top notch, so I go in with this real assumption that I expect the best of them because we are [the best]. | |
| Clinical experience of trainee (36) | Types of clinical experience prior to supervisor/trainee interaction. The interns have done as much [general inpatient medicine] months as I havethey had both done like 2 or 3 months really close together, so they were sort of at their peak knowledge. | |
| Level of training (25) | Postgraduate year of trainee. It depends on the experience level of the resident. A second year who just finished internship, I am going to supervise more closely and be more detail oriented; a fourth year medicine‐pediatrics resident who is almost done, I will supervise a lot less. | |
| Duty hours/efficiency pressures (5) | Absence of residents due to other competing factors, including compliance with work‐hour restrictions. Before the work‐hour [restrictions], when [residents] were here all the time and knew everything about the patients, I found them to be a lot more reliableand now they are still supposed to be in charge, but hell I am here more often than they are. I am here every day, I have more information than they do. How can you run the show if you are not here every day? | |
| Philosophy of medical education (14) | Belief that trainees learn by the provision of completely autonomous decision making. When you are not around, [the residents] have autonomy, they are the people making the initial decisions and making the initial assessments. They are the ones who are there in the middle of the night, the ones who are there at 3 o'clock in the afternoon. The resident is supposed to have room to make decisions. When I am not there, it's not my show. | |
Trainee Factors
Attending and resident physicians both cited trainee factors as major determinants of granting entrustment (Table 1). Within the domain, the categories described included trainee personal characteristics and clinical characteristics. Of the subthemes noted within the major category of personal characteristics, the perceived confidence or overconfidence of the trainee was most often mentioned. Other subthemes included accountability, familiarity, and honesty. Attending physicians reported using perceived resident confidence as a gauge of the trainee's true ability and comfort. Conversely, some attending physicians reported that perceived overconfidence was a red flag that warranted increased scrutiny. Overconfidence was identified by faculty as trainees with an inability to recognize their limitations in either technical skill or knowledge. Confidence was noted in trainees that recognized their own limitations while also enacting effective management plans, and those physicians that prioritized the patient needs over their personal needs.
The clinical attributes of trainees described by attendings included: leadership skills, communication skills, anticipated specialty, medical knowledge, and perceived recognition of limitations. All participants expressed that the possession of adequate medical knowledge was the most important clinical skills‐related factor in the development of trust. Trainee demonstration of judgment, including applying evidence‐based practice, was used to support attending physician's decision to give residents more autonomy in managing patients. Many attending physicians described a specific pattern of observation and evaluation, in which they would rely on impressions shaped early in the rotation to inform their decisions of entrustment throughout the rotation. The use of this early litmus test was highlighted by several attending physicians. This litmus test described the importance of behavior on the first day/call night and postcall interactions as particularly important opportunities to gauge the ability of a resident to triage new patient admissions, manage their anxiety and uncertainty, and demonstrate maturity and professionalism. Several faculty members discussed examples of their litmus test including checking and knowing laboratory data prior to rounds but not mentioning their findings until they had noted the resident was unaware ([I]f I see a 2 g hemoglobin drop when I check the [electronic medical record {EMR}] and they don't bring it up, I will bring it to their attention, and then I'll get more involved.) or assessing the management of both straightforward and complex patients. They would then use this initial impression to determine their degree of involvement in the care of the patient.
The quality and nature of the communication skills, particularly the increased frequency of contact between resident and attending, was used as a barometer of trainee judgment. Furthermore, attending physicians expressed that they would often micromanage patient care if they did not trust a trainee's ability to reliably and frequently communicate patient status as well as the attendings concerns and uncertainty about future decisions. Some level of uncertainty was generally seen in a positive light by attending physicians, because it signaled that trainees had a mature understanding of their limitations. Finally, the trainee's expressed future specialty, especially if the trainee was a preliminary PGY‐1 resident, or a more senior resident anticipating subspecialty training in a procedural specialty, impacted the degree of autonomy provided.
Supervisor Factors
Supervisor characteristics were further categorized into their approachability and clinical attributes (Table 2). Approachability as a proxy for quality of the relationship, was cited as the personality characteristic that most influenced trust by the residents. This was often described by both attending and resident physicians as the presence of a supportive team atmosphere created through explicit declaration of availability to help with patient care tasks. Some attending physicians described the importance of expressing enthusiasm when receiving queries from their team to foster an atmosphere of nonjudgmental collaboration.
The clinical experience and knowledge base of the attending physician played a role in the provision of autonomy, particularly in times of disagreement about particular clinical decisions. Conversely, attending physicians who had spent less time on inpatient general medicine were more willing to yield to resident suggestions.
Task Factors
The domain of task factors was further divided into the categories that pertained to the clinical aspects of the task and those that pertained to the context, that is the environment in which the entrustment decisions were made (Table 3). Clinical characteristics included case complexity, presence of an ethical dilemma, interdepartmental collaboration, urgency/severity of situation, and transitions of care. The environmental characteristics included physical proximity of supervisors/support, team culture, and time of day. Increasing case complexity, especially the coexistence of legal and/or ethical dilemmas, was often mentioned as a factor driving greater attending involvement. Conversely, straightforward clinical decisions, such as electrolyte repletion, were described as sufficiently easy to allow limited attending involvement. Transitions of care, such as patient discharge or transfer, required greater communication and attending involvement or guidance, regardless of case complexity.
Attending and resident physicians reported that the team dynamics played a large role in the development, granting, or discouragement of trust. Teams with a positive rapport reported a collaborative environment that fostered increased trust by the attending and led to greater resident autonomy. Conversely, team discord that influenced the supervisor‐trainee relationship, often defined as toxic attitudes within the team, was often singled out as the reason attending physicians would feel the need to engage more directly in patient care and by extension have less trust in residents to manage their patients.
Systems Factors
Systems factors were described as the nonmodifiable factors, unrelated to either the characteristics of the supervisor, trainee, or the clinical task (Table 4). The subthemes that emerged included workload, institutional culture, trainee experience, level of training, and duty hours/efficiency pressures. Residents and attending physicians noted that trainee PGY and clinical experience commonly influenced the provision of autonomy and supervision by attendings. Participants reported that the importance of adequate clinical experience was of greater concern given the new duty‐hour restrictions, increased workload, as well as efficiency pressures. Attending physicians noted that trainee absences, even when required to comply with duty‐hour restrictions, had a negative effect on entrustment‐granting decisions. Many attendings felt that a trainee had to be physically present to make informed decisions on the inpatient medicine service.
DISCUSSION
Clinical supervisors must hold the quality of care constant while balancing the amount of supervision and autonomy provided to learners in procedural tasks and clinical decision making. We found that the development of trust is multifactorial and highly contextual. It occurs under the broad constructs of task, supervisor, trainee, and environmental factors, and is well described in prior work. We also demonstrate that often what determines these broader factors is highly subjective, frequently independent of objective measures of trainee performance. Many decisions are based on personal characteristics, such as the perception of honesty, disposition, perceived confidence or perceived overconfidence of the trainee, prior experience, and expressed future field of specialty.
Our findings are consistent with prior research, but go further in describing and demonstrating the existence and innovative use of factors, other than clinical knowledge and skill, in the formation of a multidimensional construct of trust. Kennedy et al. identified 4 dimensions of trust knowledge and skill, discernment, conscientiousness, and truthfulness[15]and demonstrated that supervising physicians rely on specific processes to assess trainee trustworthiness, specifically the use of double checks and language cues. This is consistent with our results, which demonstrate that many attending physicians independently verify information, such as laboratory findings, to inform their perceptions of trainee honesty, attention to detail, and ability to follow orders reliably. Furthermore, our subthemes of communication and the demonstration of logical clinical reasoning correspond to Kennedy's use of language cues.[15] We found that language cues are used as markers of trustworthiness, particularly early on in the rotation, as a litmus test to gauge the trainee's integrity and ability to assess and treat patients unsupervised.
To date, much has been written about the importance of direct observation in the evaluation of trainees.[16, 17, 18, 19] Our results demonstrate that supervising clinicians use a multifactorial, highly nuanced, and subjective process despite validated performance‐based assessment methods, such as the objective structured clinical exam or mini‐clinical evaluation exercise, to assess competence and grant entrustement.[3] Several factors utilized to determine trustworthiness in addition to direct observation are subjective in nature, specifically the trainee's prior experience and expressed career choice.
It is encouraging that attending physicians make use of direct observations to inform decisions of entrustment, albeit in an informal and unstructured way. They also seem to take into account the context and setting in which the observation occurs, and consider both the environmental factors as well as factors that relate to the task itself.[20] For example, attendings and residents reported that team dynamics played a large role in influencing trust decisions. We also found that attending physicians rely on indirect observation and will inquire among their colleagues and other senior residents to gain information about their trainees abilities and integrity. Evaluation tools that facilitate sharing of trainees' level of preparedness, prior feedback, and experience could facilitate the determination of readiness to complete EPAs as well as the reporting of achieved milestones in accordance with the ACGME NAS.
Sharing knowledge about trainees among attendings is common and of increasing importance in the context of attending physicians' shortened exposure to trainees due to the residency work‐hour restrictions and growing productivity pressures. In our study, attending physicians described work‐hour restrictions as detrimental to trainee trustworthiness, either in the context of decreased accountability for patient care or as intrinsic to the nature of forced absences that kept trainees from fully participating in daily ward activities and knowing their patients. Attending physicians felt that trainees did not know their patients well enough to be able to make independent decisions about care. The increased transition to a shift‐based structure of inpatient medicine may result in increasingly less time for direct observation and make it more difficult for attendings to justify their decisions about engendering trust. In addition, the increased fragmentation that is noted in training secondary to the work‐hour regulations may in fact have consequences on the development of clinical skill and decision making, such that increased attention to the need for supervision and longer lead to entrustment may be needed in certain circumstances. Attendings need guidance on how to improve their ability to observe trainees in the context of the new work environment, and how to role model decision making more effectively in the compressed time exposure to housestaff.
Our study has several limitations. The organizational structure and culture of our institution are unique to 1 academic setting. This may undermine our ability to generalize these research findings and analysis to the population at large.[21] In addition, recall bias may have played into the interpretation of the interview content given the timing with which they were performed after the conclusion of the rotation. The study interviews took place in 2006, and it is reasonable to believe that some perceptions concerning duty‐hour restrictions and competency‐based graduate medical education have changed. However, from our ongoing research over the past 5 years[4] and our personal experience with entrustment factors, we believe that the participants' perceptions of trust and competency are valid and have largely remained unchanged, given the similarity in findings to the accepted ten Cate framework. In addition, this work was done following the first iteration of the work‐hour regulations but prior to the implementation of explicit supervisory levels, so it may indeed represent a truer state of the supervisory relationship before external regulations were applied. Finally, this work represents an internal medicine residency training program and may not be generalizable to other specialties that posses different cultural factors that impact the decision for entrustment. However, the congruence of our data with that of the original work of ten Cate, which was done in gynecology,[6] and that of Sterkenberg et al. in anesthesiology,[4] supports our key factors being ubiquitous to all training programs.
In conclusion, we provide new insights into subjective factors that inform the perceptions of trust and entrustment decisions by supervising physicians, specifically subjective trainee characteristics, team dynamics, and informal observation. There was agreement among attendings about which elements of competence are considered most important in their entrustment decisions related to trainee, supervisor, task, and environmental factors. Rather than undervaluing the use of personal factors in the determination of trust, we believe that acknowledgement and appreciation of these factors may be important to give supervisors more confidence and better tools to assess resident physicians, and to understand how their personality traits relate to and impact their professional competence. Our findings are relevant for the development of assessment instruments to evaluate whether medical graduates are ready for safe practice without supervision.
ACKNOWLEDGEMENTS
Disclosures: Dr. Kevin Choo was supported by Scholarship and Discovery, University of Chicago, while in his role as a fourth‐year medical student. This study received institutional review board approval prior to evaluation of our human participants. Portions of this study were presented as an oral abstract at the 35th Annual Meeting of the Society of General Internal Medicine, Orlando, Florida, May 912, 2012.
- Accreditation Council for Graduate Medical Education Common Program Requirements. Available at: http://www.acgme.org/acgmeweb/tabid/429/ProgramandInstitutionalAccreditation/CommonProgramRequirements.aspx, Accessed November 30, 2013.
- , , . Measurement of the general competencies of the Accreditation Council for Graduate Medical Education: a systematic review. Acad Med. 2009;84:301–309.
- , , , , . Toward authentic clinical evaluation: pitfalls in the pursuit of competency. Acad Med. 2010;85(5):780–786.
- , , , , . When do supervising physicians decide to entrust residents with unsupervised tasks? Acad Med. 2010;85(9):1408–1417.
- , , , . The next GME accreditation system—rationale and benefits. N Eng J Med. 2012;366(11):1051–1056.
- . Trust, competence and the supervisor's role in postgraduate training. BMJ. 2006;333:748–751.
- , , , , . Clinical Decision Making and impact on patient care: a qualitative study. Qual Saf Health Care. 2008;17(2):122–126.
- , , , et al. Strategies for effective on call supervision for internal medicine residents: the superb/safety model. J Grad Med Educ. 2010;2(1):46–52.
- , , , , . On‐call supervision and resident autonomy: from micromanager to absentee attending. Am J Med. 2009;122(8):784–788.
- . The critical incident technique. Psychol Bull. 1954;51.4:327–359.
- , . Critical evaluation of appreciative inquiry: bridging an apparent paradox. Action Res. 2006;4(4):401–418.
- , . Basics of Qualitative Research. 2nd ed. Thousand Oaks, CA: Sage Publications; 1998.
- , . How to Design and Evaluate Research in Education. New York, NY: McGraw Hill; 2003.
- , . Qualitative Data Analysis. Thousand Oaks, CA: Sage; 1994.
- , , , . Point‐of‐care assessment of medical trainee competence for independent clinical work. Acad Med. 2008;84:S89–S92.
- , . Viewpoint: competency‐based postgraduate training: can we bridge the gap between theory and clinical practice? Acad Med. 2007;82(6):542–547.
- , , , et al. Assessment of competence and progressive independence in postgraduate clinical training. Med Educ. 2009;43:1156–1165.
- , , . Tools for direct observation and assessment of clinical skills of medical trainees: a systematic review. JAMA. 2009;302(12):1316–1326.
- . Assessment in medical education. N Engl J Med. 2007;356:387–396.
- , , , , . . A prospective study of paediatric cardiac surgical microsystems: assessing the relationships between non‐routine events, teamwork and patient outcomes. BMJ Qual Saf. 2011;20(7):599–603.
- . Generalizability and transferability of meta‐synthesis research findings. J Adv Nurs. 2010;66(2):246–254.
© 2014 Society of Hospital Medicine
Ponatinib back on the market
Less than 3 months after it was pulled from the market due to safety concerns, ponatinib (Iclusig) is once again commercially available in the US.
Ariad Pharmaceuticals, Inc., has begun shipping the drug to Biologics, Inc., its exclusive specialty pharmacy. And the pharmacy has started filling prescriptions and distributing ponatinib to patients in need.
The drug is approved by the US Food and Drug Administration (FDA) to treat chronic myeloid leukemia (CML) or Philadelphia chromosome-positive acute lymphoblastic leukemia (Ph+ ALL) that is resistant to or intolerant of other tyrosine kinase inhibitors (TKIs).
Safety concerns prompt action
Last October, the latest results of the phase 2 PACE trial revealed that ponatinib can increase a patient’s risk of arterial and venous thrombotic events. So all trials of the drug were placed on partial clinical hold, with the exception of the phase 3 EPIC trial, which was discontinued.
Then, the FDA suspended sales and marketing of ponatinib, pending results of a safety evaluation. But in December, the agency decided the drug could return to the market if new safety measures were implemented.
The FDA approved revised prescribing information and a communications Risk Evaluation and Mitigation Strategy for ponatinib. The prescribing information includes a revised indication statement and boxed warning, updated safety information, and recommendations regarding dosing considerations for prescribers.
Now, ponatinib is indicated for the treatment of:
- Adults with T315I-positive CML (chronic, accelerated, or blast phase)
- Adults with T315I-positive Ph+ ALL
- Adults with CML (chronic, accelerated, or blast phase) who cannot receive another TKI
- Adults with Ph+ ALL who cannot receive another TKI.
The starting dose of ponatinib remains 45 mg daily.
IND program
On November 1, 2013, there were approximately 640 patients receiving ponatinib through commercial channels in the US. Since then, the drug was only made available through emergency and single-patient investigational new drug (IND) applications, which were reviewed and approved by the FDA on a case-by-case basis.
The FDA has approved more than 370 INDs since early November, and more than 300 patients have received ponatinib at no cost through this process.
Ariad expects most of these patients, many of whom received a 3-month supply of ponatinib, to transition from the IND program to commercial therapy by the end of the first quarter of 2014. The IND program is now closed to new patients with Ph+ leukemias.
Ponatinib is currently priced in the US at approximately $125,000 per year. For more information on the drug, visit www.iclusig.com. ![]()
Committee votes against rivaroxaban for ACS

Credit: Mass. General Hospital
A US Food and Drug Administration (FDA) advisory committee has voted against expanding the indication for the anticoagulant rivaroxaban (Xarelto).
The drug’s developers are seeking approval for rivaroxaban to be used in combination with standard antiplatelet therapy to reduce the risk of thrombotic cardiovascular events in patients with acute coronary syndrome (ACS). The proposed dose is 2.5 mg twice daily for 90 days.
But the FDA’s Cardiovascular and Renal Drugs Advisory Committee voted—nearly unanimously (with 1 abstention)—against this approval.
And the FDA will take this recommendation into account when deciding whether or not to expand rivaroxaban’s indication. This will be the FDA’s third time reviewing the drug for the aforementioned indication.
Rivaroxaban is currently FDA-approved to reduce the risk of stroke and thrombosis in patients with non-valvular atrial fibrillation, treat patients with venous thromboembolism (VTE), reduce the risk of recurrent VTE, and reduce the risk of VTE in patients who have undergone knee replacement surgery or hip replacement surgery.
Headed for a third rejection?
The advisory committee’s recommendation was based on a review of data from the phase 3 ATLAS ACS 2 TIMI 51 trial, which were published in NEJM in January 2012.
The study showed that rivaroxaban, given in combination with standard antiplatelet therapy, reduced the composite endpoint of cardiovascular death, myocardial infarction, and stroke in ACS patients. But it also increased the risk of major bleeding and intracranial hemorrhage.
Based on these results, rivaroxaban’s developers—Janssen Research & Development, LLC, and Bayer HealthCare—filed for FDA approval of rivaroxaban to treat patients with ACS.
In June 2012, the FDA rejected the application, a month after an advisory committee voted against the approval. The committee had expressed concerns about the risks of bleeding associated with rivaroxaban, as well as reservations about missing data from the ATLAS ACS 2 TIMI 51 trial.
Though Janssen and Bayer went on to submit the missing data, the FDA rejected the drug again in March 2013. However, the FDA suggested the companies apply for approval using rivaroxaban for a limited time after ACS development, as the drug might be safer and more effective when given this way.
So the companies submitted an application for rivaroxaban given within the first 90 days of ACS diagnosis.
The advisory committee voted against this use of the drug, however, saying it seems the benefits of this treatment still do not outweigh the risks for this patient population.
A representative from Janssen said the company still believes rivaroxaban can be useful for patients with ACS, and Janssen and Bayer will work with the FDA to address the issues the committee raised.
For more details and data on rivaroxaban, see the briefing information compiled for the advisory committee’s meeting. ![]()
New chemo regimen is active against recalcitrant neuroendocrine tumors
SAN FRANCISCO – A new chemotherapy regimen of capecitabine and temozolomide was highly active against advanced treatment-resistant neuroendocrine tumors, based on the interim results of a phase II trial.
Tumors shrank in 43% of the 28 patients with various types of differentiated metastatic neuroendocrine tumors given the regimen, which is abbreviated CAPTEM. Disease stabilized in 54%.
Responses were durable, with a median progression-free survival approaching 2 years, reported lead investigator Dr. Robert Fine of the department of medicine at New York Presbyterian Hospital–Columbia University Medical Center.

"In this study, we’re seeing patients who had been given 6 months to live and are still alive 8 years after starting CAPTEM," he said in a prepared statement. "The regimen was effective even in patients with tumors that hadn’t responded to any other standard treatment, including chemotherapy, high-dose octreotide, small molecule inhibitors, radiation, or surgery."
For example, 42% of the patients with carcinoid tumors had a complete or partial response, and the others had stabilization of their disease. Median progression-free survival in this subset exceeded 31 months.
"Pituitary tumors were extraordinarily sensitive – end-stage people on respirators who were intubated with pituitary masses [compressing the spinal cord] were 100% responsive to the regimen, he said. Two of three patients had a complete response and were able to come off the ventilator and remain disease free with ongoing treatment at nearly 4 years out. The other patient had a partial response.
Toxicities were mild, and none of the patients had to be hospitalized or died as a result of the treatment, Dr. Fine commented in a press briefing before the results were presented at the annual Gastrointestinal Cancers Symposium sponsored by the American Society of Clinical Oncology.
Dr. Smitha S. Krishnamurthi of Case Western Reserve University, Cleveland, who was the press briefing moderator, concurred that the regimen offers a new treatment option to patients who have exhausted the standard options.
"This regimen of CAPTEM vs. TEM (temozolomide) is under study now in a cooperative group trial for patients with pancreatic neuroendocrine cancer," she noted.
Dr. Fine and his team enrolled patients in the trial who had well- or moderately differentiated neuroendocrine tumors and either experienced progression despite standard therapy with high-dose octreotide (Sandostatin) or were ineligible for this treatment because of a negative octreotide scan. Other prior treatments, with the exception of the two drugs being studied, were allowed.
CAPTEM contains capecitabine (Xeloda), currently approved by the Food and Drug Administration for the treatment of breast and colorectal cancers, and temozolomide (Temodar), currently approved for the treatment of anaplastic astrocytoma and glioblastoma multiforme.
The drugs are given in sequence to maximize efficacy, according to Dr. Fine, as the capecitabine depletes tumor thymidine stores, which dramatically potentiates the antitumor effect of the temozolomide.
Of the 28 patients, 12 had carcinoid tumors, 11 had pancreatic tumors, 3 had pituitary tumors, and 2 had medullary thyroid tumors.
The patients were treated with CAPTEM on 28-day cycles, with capecitabine alone for 9 days, both capecitabine and temozolomide for 5 days, and the next 14 days off.
Overall, 11% of patients had a complete response, 32% had a partial response, 54% had stable disease, and 3% had progressive disease. These values translated to a response rate of 43% and a clinical benefit rate of 97%.
Median progression-free survival exceeded 22 months, and median overall survival, although still maturing, exceeded 29 months.
"The toxicities were extraordinarily light," commented Dr. Fine, who disclosed that he receives research funding from Merck.
The most common grade 3 or 4 toxicities were lymphopenia (seen in 35% of patients), hyperglycemia (6%), thrombocytopenia (3%), and diarrhea (3%).
None of the patients were hospitalized, developed opportunistic infections, or died as a result of CAPTEM treatment.
SAN FRANCISCO – A new chemotherapy regimen of capecitabine and temozolomide was highly active against advanced treatment-resistant neuroendocrine tumors, based on the interim results of a phase II trial.
Tumors shrank in 43% of the 28 patients with various types of differentiated metastatic neuroendocrine tumors given the regimen, which is abbreviated CAPTEM. Disease stabilized in 54%.
Responses were durable, with a median progression-free survival approaching 2 years, reported lead investigator Dr. Robert Fine of the department of medicine at New York Presbyterian Hospital–Columbia University Medical Center.
"In this study, we’re seeing patients who had been given 6 months to live and are still alive 8 years after starting CAPTEM," he said in a prepared statement. "The regimen was effective even in patients with tumors that hadn’t responded to any other standard treatment, including chemotherapy, high-dose octreotide, small molecule inhibitors, radiation, or surgery."
For example, 42% of the patients with carcinoid tumors had a complete or partial response, and the others had stabilization of their disease. Median progression-free survival in this subset exceeded 31 months.
"Pituitary tumors were extraordinarily sensitive – end-stage people on respirators who were intubated with pituitary masses [compressing the spinal cord] were 100% responsive to the regimen, he said. Two of three patients had a complete response and were able to come off the ventilator and remain disease free with ongoing treatment at nearly 4 years out. The other patient had a partial response.
Toxicities were mild, and none of the patients had to be hospitalized or died as a result of the treatment, Dr. Fine commented in a press briefing before the results were presented at the annual Gastrointestinal Cancers Symposium sponsored by the American Society of Clinical Oncology.
Dr. Smitha S. Krishnamurthi of Case Western Reserve University, Cleveland, who was the press briefing moderator, concurred that the regimen offers a new treatment option to patients who have exhausted the standard options.
"This regimen of CAPTEM vs. TEM (temozolomide) is under study now in a cooperative group trial for patients with pancreatic neuroendocrine cancer," she noted.
Dr. Fine and his team enrolled patients in the trial who had well- or moderately differentiated neuroendocrine tumors and either experienced progression despite standard therapy with high-dose octreotide (Sandostatin) or were ineligible for this treatment because of a negative octreotide scan. Other prior treatments, with the exception of the two drugs being studied, were allowed.
CAPTEM contains capecitabine (Xeloda), currently approved by the Food and Drug Administration for the treatment of breast and colorectal cancers, and temozolomide (Temodar), currently approved for the treatment of anaplastic astrocytoma and glioblastoma multiforme.
The drugs are given in sequence to maximize efficacy, according to Dr. Fine, as the capecitabine depletes tumor thymidine stores, which dramatically potentiates the antitumor effect of the temozolomide.
Of the 28 patients, 12 had carcinoid tumors, 11 had pancreatic tumors, 3 had pituitary tumors, and 2 had medullary thyroid tumors.
The patients were treated with CAPTEM on 28-day cycles, with capecitabine alone for 9 days, both capecitabine and temozolomide for 5 days, and the next 14 days off.
Overall, 11% of patients had a complete response, 32% had a partial response, 54% had stable disease, and 3% had progressive disease. These values translated to a response rate of 43% and a clinical benefit rate of 97%.
Median progression-free survival exceeded 22 months, and median overall survival, although still maturing, exceeded 29 months.
"The toxicities were extraordinarily light," commented Dr. Fine, who disclosed that he receives research funding from Merck.
The most common grade 3 or 4 toxicities were lymphopenia (seen in 35% of patients), hyperglycemia (6%), thrombocytopenia (3%), and diarrhea (3%).
None of the patients were hospitalized, developed opportunistic infections, or died as a result of CAPTEM treatment.
AT THE GASTROINTESTINAL CANCERS SYMPOSIUM
Major finding: The overall response rate was 43% and the clinical benefit rate was 97%.
Data source: A randomized phase II trial among 28 patients with progressive, metastatic, differentiated neuroendocrine tumors
Disclosures: Dr. Fine disclosed that he receives research funding from Merck.
‘Blood-Type Diet’ theory doesn’t hold up
Credit: Juan D. Alfonso
The theory behind the “Blood-Type Diet”—which claims an individual’s nutritional needs vary by blood type—is not valid, according to a study published in PLOS ONE.
The study showed that 3 of the 4 blood-type-specific diets conferred positive effects. But these benefits occurred independently of a person’s ABO genotype.
“The way an individual responds to any one of these diets has absolutely nothing to do with their blood type and has everything to do with their ability to stick to a sensible vegetarian or low-carbohydrate diet,” said study author Ahmed El-Sohemy, PhD, of the University of Toronto in Ontario, Canada.
About the diet(s)
The Blood-Type Diet was popularized in the book Eat Right for Your Type, written by Peter D’Adamo, ND. His theory is that people with different blood types process food differently, and the ABO blood type should match the dietary habits of our ancestors.
According to the theory, individuals adhering to a blood-type-specific diet can improve their health and decrease the risk of chronic illness such as cardiovascular disease.
The Type-A diet recommends that subjects consume mostly grains, fruits, and vegetables. The Type-B diet promotes a high intake of dairy products and a moderate intake of other food groups.
The Type-AB diet is similar to the Type-B diet but has more restrictions on specific foods. And the Type-O diet recommends that subjects consume mostly meat and avoid grain products.
Study results
To test that Blood-Type Diet theory, Dr El-Sohemy and his colleagues analyzed a population of 1455 adults aged 20 to 29 years. Subjects provided detailed information about their usual diets, as well as fasting blood samples.
The researchers used the samples to determine subjects’ ABO blood type and their level of cardiometabolic risk factors, such as insulin, cholesterol, and triglycerides.
The team also calculated diet scores based on the food items listed in Eat Right for Your Type to determine subjects’ relative adherence to each of the 4 blood-type diets.
Subjects whose diets closely resembled the Type-A diet had a lower body mass index and waist circumference, as well as reduced blood pressure, serum cholesterol, triglycerides, insulin, HOMA-IR, and HOMA-Beta (P<0.05). But these effects were seen regardless of the individual’s blood type.
Subjects whose diets resembled the Type-AB diet had reduced blood pressure, serum cholesterol, triglycerides, insulin, HOMA-IR, and HOMA-Beta (P<0.05), regardless of their blood type.
Adhering to the recommendations of the Type-O diet was associated with lower triglyceride levels (P<0.0001), regardless of blood type.
And there were no significant associations for subjects whose eating habits corresponded to the Type-B diet.
“[W]e found no evidence to support the Blood-Type Diet theory,” Dr El-Sohemy said. “It was an intriguing hypothesis, so we felt we should put it to the test. We can now be confident in saying that the Blood-Type Diet hypothesis is false.” ![]()
Histone discovery may have implications for blood cancers

Credit: Eric Smith
Investigators have uncovered an unanticipated mechanism underlying trimethylation of a histone that activates gene expression.
And this finding could have implications for the treatment of leukemias and lymphomas.
Ali Shilatifard, PhD, of the Stowers Institute for Medical Research in Kansas City, Missouri, and his colleagues described the discovery in Genes & Development.
Histones, which come in 4 subtypes—H2A, H2B, H3, and H4—can either coil DNA into inaccessible, silent regions or untwist it to allow gene expression. And small chemical flags, such as methyl groups, affect whether histones silence or activate genes.
Among activator histones is a form of H3 decorated at a precise location with 3 methyl groups, known as H3K4me3.
Previous research showed that the presence of H2B exhibiting a single ubiquitin molecule stimulated the methylase that modifies H3K4, thereby increasing H3K4me3 levels.
But how the methylase’s activity was directed toward the appropriate targets was unclear.
Now, Dr Shilatifard and his colleagues have discovered a mechanism underlying H3K4 trimethylation. Their research explains why H3K4me3 is deposited adjacent to a target gene promoter rather than haphazardly across the entire gene.
The team said this finding is significant because mutations in the human gene encoding the methylase responsible for H3K4me3 are associated with leukemias, lymphomas, and other malignancies.
The methylase in question, named SET1 in yeast and MLL in mammals, is part of a protein aggregate called COMPASS (COMplex of Proteins ASsociated with Set1). Dr Shilatifard was the first to define the role of COMPASS in chromatin modification.
“Over a decade ago, our lab used yeast to show that COMPASS was an H3 methylase,” he said. “Since these fundamental systems are highly conserved from yeast to Drosophila to humans, we took advantage of the awesome power of yeast genetics to identify what regulates H3K4 methylation activity.”
Part of his group’s latest paper addresses SET1/MLL regulation by different proteins within yeast COMPASS.
The investigators knew that if more than half of SET1’s front end was removed, levels of DNA-bound trimethylated H3K4 in cells harboring the remaining “stub” were equal to those in cells containing the full-length protein when analyzed in bulk.
This finding led some researchers to presume that the entire front end of SET1/MLL, as well as factors that interact with it, must not be needed to regulate H3K4me3 activity.
But Dr Shilatifard and his colleagues found evidence suggesting this presumption is incorrect.
The team first employed biochemical methods to capture every piece of DNA bound to H3K4me3 in the genome of yeast harboring either full-length SET1 or the stub missing the front end. They then sequenced all of those DNA fragments and mapped their position in the yeast genome.
Results showed that even though H3K4me3 levels in bulk were equivalent in normal and mutant cells, H3K4me3 was differentially distributed throughout the genome.
In normal cells, H3K4me3 complexes sat primarily on DNA promoter regions. By contrast, the DNA of cells harboring the stub exhibited DNA-binding H3K4me3 complexes in the middle of or between genes.
The work shows that COMPASS factors that bind to the SET1/MLL front end limit H3K4me3 deposition to the correct genomic sites (the promoter regions), while factors that bind the SET1/MLL stub increase the protein’s half-life.
The investigators also discovered how H2B ubiquitin modification machineries stimulate the entire process.
The team said understanding COMPASS regulation is essential, as genes encoding factors in the complex are mutant in numerous cancers. ![]()
FDA committee votes in favor of vorapaxar

Credit: Andre E.X. Brown
An advisory committee is recommending that the US Food and Drug Administration (FDA) approve the antiplatelet agent vorapaxar as prophylaxis for atherothrombotic events in patients with a history of myocardial infarction.
The committee voted 10-1 in favor of vorapaxar, saying trial data suggest the drug’s potential benefits outweigh the risks for this patient population.
The FDA will take this opinion into account when deciding whether or not to approve the drug.
The committee evaluated data from the TRA 2P-TIMI 50 and TRACER trials.
In the TRACER study, researchers compared vorapaxar to placebo in 12,944 patients who had acute coronary syndromes without ST-segment elevation.
The trial was terminated early due to a significantly increased risk of bleeding in patients receiving vorapaxar. Rates of moderate and severe bleeding were 7.2% in the vorapaxar arm and 5.2% in the placebo arm (P<0.001). And the rates of intracranial hemorrhage were 1.1% and 0.2%, respectively (P<0.001).
The TRA 2P-TIMI 50 trial also showed an increased risk of bleeding with vorapaxar. In that study, investigators compared the drug to placebo in 26,449 patients with a history of myocardial infarction, ischemic stroke, or peripheral arterial disease.
Moderate or severe bleeding occurred in 4.2% of vorapaxar-treated patients and 2.5% of patients in the placebo arm (P<0.001). The rates of intracranial hemorrhage were 1.0% and 0.5%, respectively (P<0.001).
However, data from this trial also showed that vorapaxar can prevent thrombosis and decrease the likelihood of cardiac events.
And a subgroup analysis of patients with a history of myocardial infarction suggested the drug can reduce vascular events in these patients without increasing the risk of intracranial hemorrhage, although it did increase the risk of moderate or severe bleeding.
These results prompted the drug’s developer, Merck, to file a New Drug Application for vorapaxar to treat patients with a history of myocardial infarction, and not those with a history of ischemic stroke or peripheral arterial disease.
The FDA advisory committee agreed with the company’s decision to exclude patients with a history of ischemic stroke, but not those with peripheral arterial disease, as there were no significant safety issues in this population.
The committee also expressed concerns about some of the trial data, including analyses suggesting worse outcomes with vorapaxar in patients weighing less than 60 kg.
Nevertheless, the committee concluded that, overall, the benefits of vorapaxar outweigh the risks.
For more details and vorapaxar data, see the briefing information compiled for the advisory committee’s meeting. ![]()
Case raises questions about BRAF inhibitor’s mechanism

Credit: University of Leicester
Results of a case study suggest the BRAF inhibitor vemurafenib does not treat hairy cell leukemia (HCL) in the way researchers thought.
The BRAF V600E mutation is present in nearly all cases of HCL, so it’s not surprising that vemurafenib has elicited responses in patients with the disease.
Researchers thought the drug did this by inhibiting phosphorylation of extracellular signal-regulated kinase (ERK) and mitogen-activated protein–ERK kinase (MEK).
But new results in a patient with HCL suggest otherwise.
Salvador Macip, MD, PhD, of the University of Leicester in the UK, and his colleagues described this case in a letter to NEJM.
The patient had purine analogue-refractory disease, biallelic BRAF V600E mutations, and a high leukemic burden. Because the patient had such high numbers of circulating HCL cells, the researchers were able to study the effects of vemurafenib in vivo.
They found that vemurafenib cleared malignant cells from the patient’s blood and led to a complete clinical recovery within days of treatment initiation.
But BRAF inhibition was not associated with major changes in phosphorylation of MEK or ERK.
“[T]he drug did not work in the way we expected it to,” Dr Macip said. “Whilst it successfully blocked BRAF and killed the cancerous cells, there was no ability to block the downstream cascade of signals.”
The researchers said they could not rule out the possibility that BRAF inhibition eventually resulted in suppression of ERK activation in some anatomical compartment other than the blood. But they believe this is unlikely.
A more plausible explanation is that an alternative signaling pathway may be affected by vemurafenib, either directly or through BRAF inhibition.
“[M]ore research is required to better understand how this drug works, to ensure we are able to use it in the best possible way,” Dr Macip concluded. ![]()