User login
Methylation patterns can predict survival in AML, team says
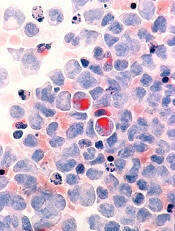
Credit: Lance Liotta
Researchers have found evidence to suggest that methylation patterns in hematopoietic stem cells (HSCs) can be used to determine prognosis in patients with acute myeloid leukemia (AML).
The team discovered that patients with methylation patterns resembling those of healthy individuals lived longer than patients with substantially different patterns.
If validated in clinical trials, this finding could be used to help physicians tailor treatment according to a patient’s needs.
Ulrich Steidl, MD, PhD, of the Albert Einstein College of Medicine in New York, and his colleagues described this research in The Journal of Clinical Investigation.
The investigators knew that aberrations in HSC methylation can prevent the cells from differentiating into mature blood cells, which leads to AML.
So they speculated that comparing how closely the methylation patterns in cells from AML patients resemble the patterns found in healthy individuals’ HSCs might foretell the patients’ response to treatment.
To find out, the researchers first looked at methylation patterns in HSCs from healthy individuals. The team found that most cytosines are methylated in healthy HSCs.
And where demethylation occurs, it’s mainly limited to one particular stage of HSC differentiation—the commitment step from short-term HSC to common myeloid progenitor.
The investigators then set out to identify loci with the most significant methylation changes across differentiation stages. Their analysis revealed a set of 561 loci that distinguished between the 4 stages of HSC development they investigated.
The team next wanted to determine whether the methylation status of these loci was affected in AML. So they developed an epigenetic signature score based on loci methylation. A patient’s score increased the more his methylation pattern differed from that of a healthy individual.
The researchers tested their scoring method using data from 3 cohorts of AML patients. In each of these groups, patients with low scores had approximately twice the median survival time of patients with high scores.
Specifically, the investigators evaluated AML patients in a trial testing 2 different doses of daunorubicin (Fernandez et al, NEJM 2009).
Among patients receiving lower-dose daunorubicin, those with lower epigenetic signature scores had a median overall survival (OS) of 19 months, compared with 10.8 months for patients with higher scores (P=0.0165).
The researchers observed similar results in the patients receiving a higher dose of daunorubicin. The median OS in the group with low epigenetic signature scores was 25.4 months, compared with 13.2 months in the group with high scores (P=0.0062).
Likewise, in a third cohort of AML patients, those with a low epigenetic signature score had significantly better OS than those with a high score—a median of 28.1 months and 14.9 months, respectively (P=0.0150).
The investigators performed the same analyses using a commitment-associated gene-expression signature. And they found their epigenetic signature was more effective at predicting patient survival.
Dr Steidl and his colleagues are now studying the genes found in the aberrant epigenetic signatures to determine if they play a role in causing AML. ![]()
FDA approves system for GVHD prophylaxis
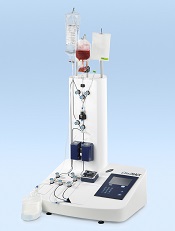
Credit: Miltenyi Biotec
The US Food and Drug Administration (FDA) has granted approval for a device system that can prevent graft-vs-host disease (GVHD).
The CliniMACS CD34 Reagent System is intended for use in patients with acute myeloid leukemia who are in first complete remission and undergoing stem cell transplant (SCT) from a matched, related donor.
This in vitro system enriches CD34+ hematopoietic stem cells from a donated apheresis product, while depleting other cells that can cause GVHD.
The system employs a reagent consisting of a CD34 antibody conjugated to an iron-containing nanoparticle. It enriches CD34+ cells by passing the antibody/nanoparticle-labeled cell suspension through a magnetic separation column, which is provided as part of a single-use, disposable tubing set.
Magnetically labeled CD34+ target cells are retained within the separation column, while the unlabeled cells flow through. The CD34+ cells can be recovered by removing the magnetic field and eluting the targeted CD34+ cells into a collection bag.
The FDA’s approval of this system was based on data from a phase 2 study (BMT CTN 0303) conducted by the Blood and Marrow Transplant Clinical Trials Network (Pasquini et al, JCO 2012).
The trial included 128 patients undergoing SCT from a matched, sibling donor. Forty-four patients received grafts that were T-cell depleted (TCD) using the CliniMACS system as the sole form of immune suppression. The other 84 patients received T-cell-replete grafts and pharmacologic immune suppression therapy (IST).
The 2 groups were largely similar, although more patients in the TCD arm received treatment regimens that included radiation—100% vs 50%.
Neutrophil engraftment was similar between the 2 groups. At 28 days, 96% of patients in the IST arm and 100% in the TCD arm had achieved engraftment.
Patients in the TCD arm had a significantly lower rate of chronic GVHD than those in the IST arm. The TCD patients also had a lower rate of acute GVHD, but the difference was not significant.
At 100 days, the rates of grade 2-4, acute GVHD were 39% with IST and 23% with TCD grafts (P=0.07). At 2 years, the rates of chronic GVHD were 19% with TCD grafts and 50% with IST (P<0.001).
There were no significant differences between the 2 groups with regard to graft rejection, leukemia relapse, treatment-related mortality, disease-free survival, or overall survival. However, patients in the TCD arm had a higher rate of GVHD-free survival at 2 years—41% vs 19% (P=0.006).
The CliniMACS CD34 Reagent System is manufactured by Miltenyi Biotec. For more information on the system, see the company’s website. ![]()
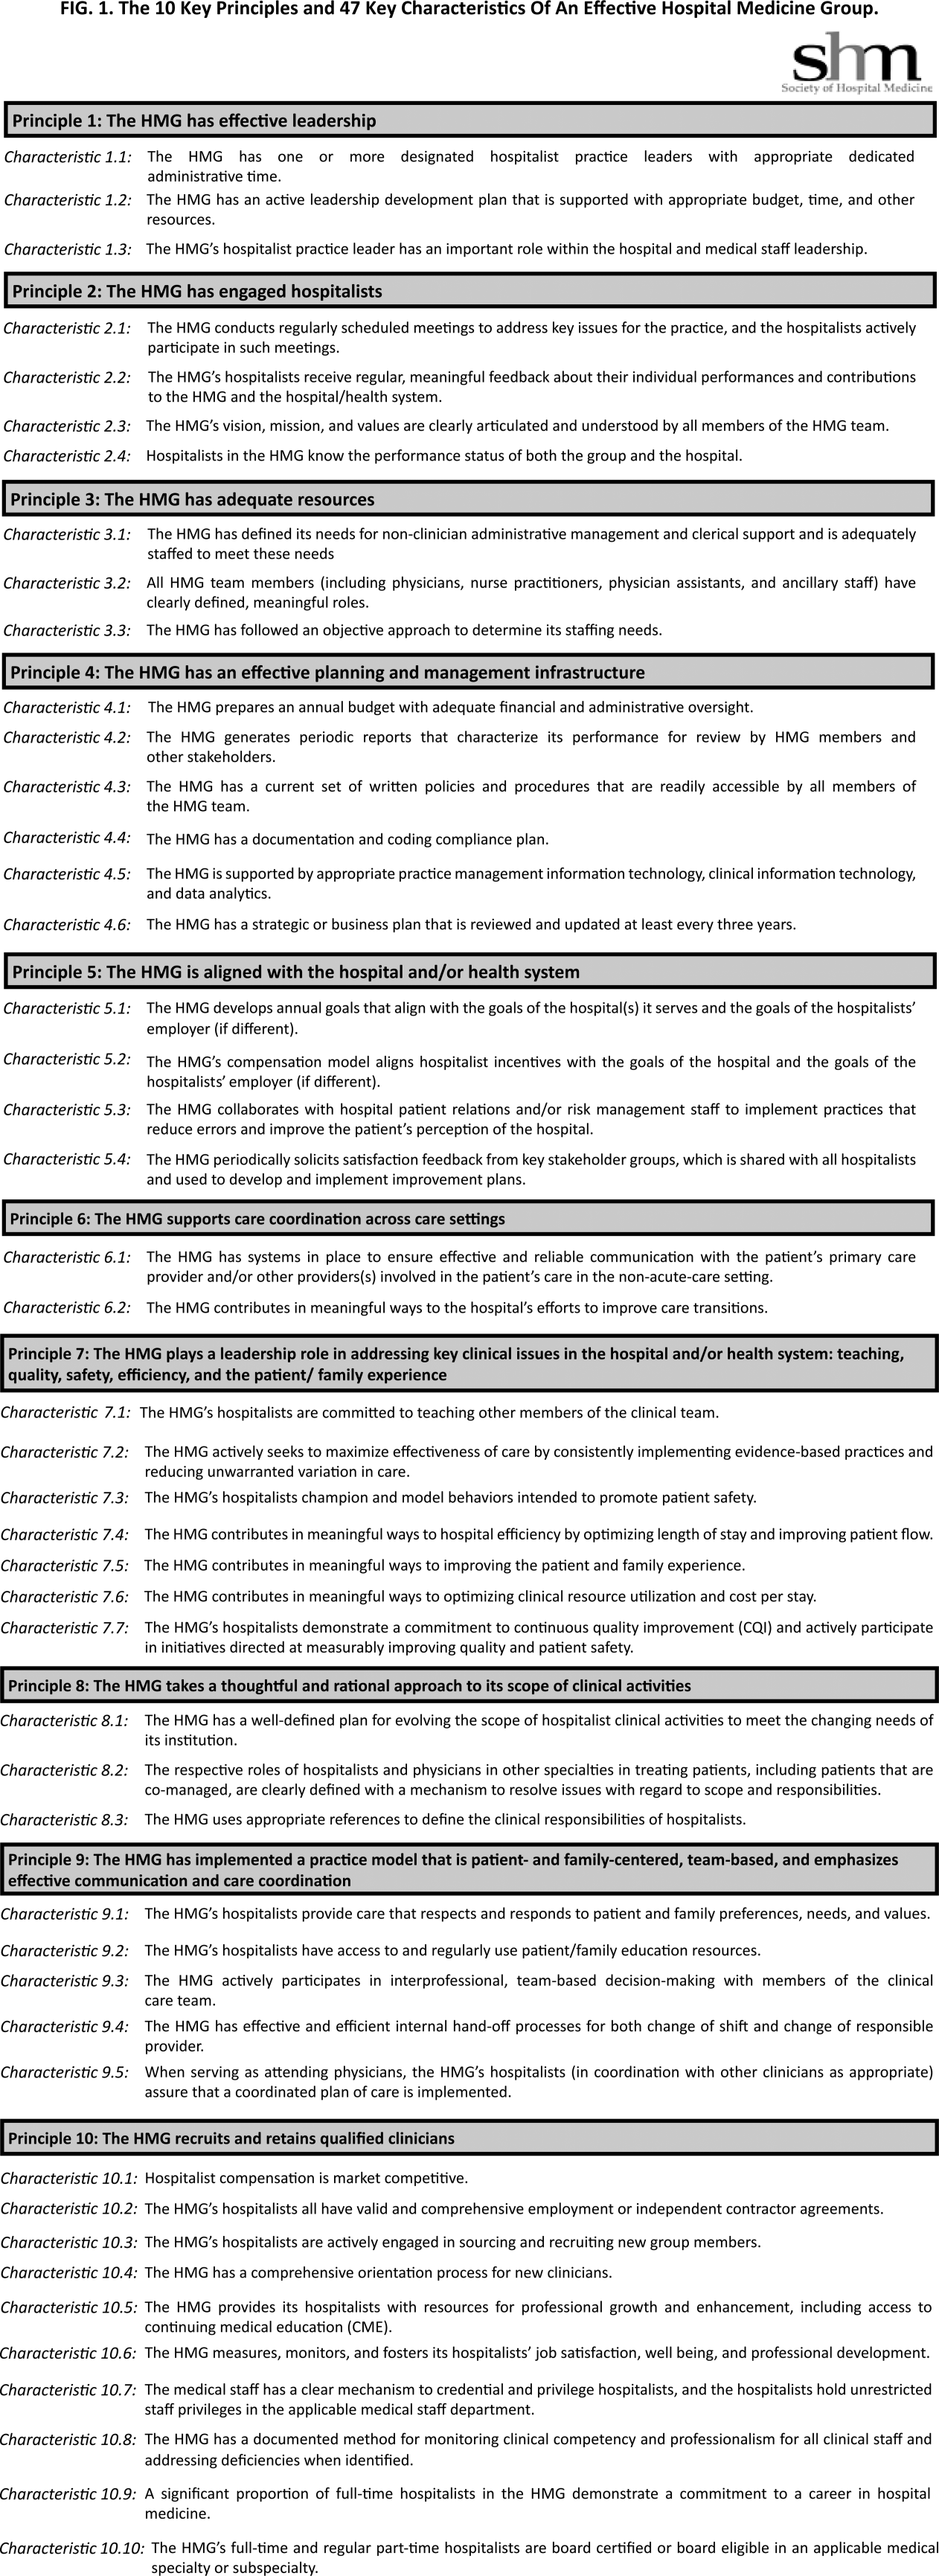
Principles and Characteristics of an HMG
With the continuing growth of the specialty of hospital medicine, the capabilities and performance of hospital medicine groups (HMGs) varies significantly. There are few guidelines that HMGs can reference as tools to guide self‐improvement. To address this deficiency, the Society of Hospital Medicine (SHM) Board of Directors authorized a process to identify the key principles and characteristics of an effective HMG.
METHODS
Topic Development and Validation Prework
In providing direction to this effort, the SHM board felt that the principles and characteristics should be directed at both hospitals and hospitalists, addressing the full range of managerial, organizational, clinical, and quality activities necessary to achieve effectiveness. Furthermore, the board defined effectiveness as consisting of 2 components. First, the HMG must assure that the patients managed by hospitalists receive high‐quality care that is sensitive to their needs and preferences. Second, the HMG must understand that the central role of the hospitalist is to coordinate patient care and foster interdisciplinary communication across the care continuum to provide optimal patient outcomes.
The SHM board appointed an HMG Characteristics Workgroup consisting of individuals who have experience with a wide array of HMG models and who could offer expert opinions on the subject. The HMG Characteristics Workgroup felt it important to review the work of other organizations that develop and administer criteria, standards, and/or requirements for healthcare organizations. Examples cited were the American College of Surgeons[1]; The Joint Commission[2]; American Nurse Credentialing Center[3]; the National Committee for Quality Assurance[4]; the American Medical Group Association[5]; and the American Association of Critical‐Care Nurses.[6]
In March 2012 and April 2012, SHM staff reviewed the websites and published materials of these organizations. For each program, information was captured on the qualifications of applicants, history of the program, timing of administering the program, the nature of recognition granted, and the program's keys to success. The summary of these findings was shared with the workgroup.
Background research and the broad scope of characteristics to be addressed led to the workgroup's decision to develop the principles and characteristics using a consensus process, emphasizing expert opinion supplemented by feedback from a broad group of stakeholders.
Initial Draft
During April 2012 and May 2012, the HMG Characteristics Workgroup identified 3 domains for the key characteristics: (1) program structure and operations, (2) clinical care delivery, and (3) organizational performance improvement. Over the course of several meetings, the HMG Characteristics Workgroup developed an initial draft of 83 characteristics, grouped into 29 subgroups within the 3 domains.
From June 2012 to November 2012, this initial draft was reviewed by a broad cross section of the hospital medicine community including members of SHM's committees, a group of academic hospitalists, focus groups in 2 communities (Philadelphia and Boston), and the leaders of several regional and national hospitalist management companies. Quantitative and qualitative feedback was obtained.
In November 2012, the SHM Board of Directors held its annual leadership meeting, attended by approximately 25 national hospitalist thought leaders and chairpersons of SHM committees. At this meeting, a series of exercises were conducted in which these leaders of the hospital medicine movement, including the SHM board members, were each assigned individual characteristics and asked to review and edit them for clarity and appropriateness.
As a result of feedback at that meeting and subsequent discussion by the SHM board, the workgroup was asked to modify the characteristics in 3 ways. First, the list should be streamlined, reducing the number of characteristics. Second, the 3 domains should be eliminated, and a better organizing framework should be created. Third, additional context should be added to the list of characteristics.
Second Draft
During the period from November 2012 to December 2012, the HMG Characteristics Workgroup went through a 2‐step Delphi process to consolidate characteristics and/or eliminate characteristics that were redundant or unnecessary. In the first step, members of the workgroup rated each characteristic from 1 to 3. A rating of 1 meant not important; good quality, but not required for an effective HMG. A rating of 2 meant important; most effective HMGs will meet requirement. A rating of 3 meant highly important; mandatory for an effective HMG. In the second step, members of the workgroup received feedback on the scores for each characteristic and came to a consensus on which characteristics should be eliminated or merged with other characteristics.
As a result, the number of characteristics was reduced and consolidated from 83 to 47, and a new framing structure was defined, replacing the 3 domains with 10 organizing principles. Finally, a rationale for each characteristic was added, defending its inclusion in the list. In addition, consideration was given to including a section describing how an HMG could demonstrate that their organization met each characteristic. However, the workgroup and the board decided that these demonstration requirements should be vetted before they were published.
From January 2013 to June 2013, the revised key principles and characteristics were reviewed by selected chairpersons of SHM committees and by 2 focus groups of HMG leaders. These reviews were conducted at the SHM Annual Meeting. Finally, in June 2013, the Committee on Clinical Leadership of the American Hospital Association reviewed and commented on the draft of the principles and characteristics.
In addition, based on feedback received from the reviewers, the wording of many of the characteristics went through revisions to assure precision and clarity. Before submission to the Journal of Hospital Medicine, a professional editor was engaged to assure that the format and language of the characteristics were clear and consistent.
Final Approval
The final draft of the 10 principles and 47 characteristics was approved for publication at a meeting of the SHM Board of Directors in September 2013 (Figure 1).

RESULTS
A recurring issue that the workgroup addressed was the applicability of the characteristics from 1 practice setting to another. Confounding factors include the HMG's employment/organizational model (eg, hospital employed, academic, multispecialty group, private practice, and management company), its population served (eg, adult vs pediatric, more than 1 hospital), and the type of hospital served (eg, academic vs community, the hospital has more than 1 HMG). The workgroup has made an effort to assure that all 47 characteristics can be applied to every type of HMG.
In developing the 10 principles, the workgroup attempted to construct a list of the basic ingredients needed to build and sustain an effective HMG. These 10 principles stand on their own, independent of the 47 key characteristics, and include issues such as effective leadership, clinician engagement, adequate resources, management infrastructure, key hospitalist roles and responsibilities, alignment with the hospital, and the recruitment and retention of qualified hospitalists.
A more detailed version of the Key Principles and Characteristics of an Effective HMG is available in the online version of this article (see Supporting Information, Appendix, in the online version of this article). The online Appendix includes the rationales for each of the characteristics, guidance on how to provide feedback to the SHM on the framework, and the SHM's plan for further development of the key principles and characteristics.
DISCUSSION
To address the variability in capabilities and performance of HMGs, these principles and characteristics are designed to provide a framework for HMGs seeking to conduct self‐assessments and develop pathways for improvement.
Although there may be HMG arrangements that do not directly involve the hospital and its executive team, and therefore alternative approaches may make sense, for most HMGs hospitals are directly involved with the HMG as either an employer or a contractor. For that reason, the Key Principles and Characteristics of an Effective HMG is written for 2 audiences: the executive leadership of the hospital (most specifically the chief medical officer or a similar role) and the hospitalists in the HMG (most specifically the practice medical director). To address the key characteristics requires the active participation of both parties. For the hospital executives, the framework establishes expectations for the HMG. For the hospitalists, the framework provides guidance in the development of an improvement plan.
Hospital executives and hospitalists can use the key characteristics in a broad spectrum of ways. The easiest and least formalized approach would be to use the framework as the basis of an ongoing dialogue between the hospital leadership and the HMG. A more formal approach would be to use the framework to guide the planning and budgeting activities of the HMG. Finally, a hospital or health system can use the key principles and characteristics as a way to evaluate their affiliated HMG(s)for example, the HMG must address 80% of the 47 characteristics.
The Key Principles and Characteristics of an Effective HMG should be considered akin to the Core Competencies in Hospital Medicine previously published in the Journal of Hospital Medicine.[7] However, instead of focusing on the competencies of individual physicians, this framework focuses on the characteristics of hospitalist groups. Just as a physician or other healthcare provider is not expected to demonstrate competency for every element in the core competencies document, an HMG does not need to have all 47 characteristics to be effective. Effective hospitalists may have skills other than those listed in the Core Competencies in Hospital Medicine. Similarly, the 47 characteristics do not represent an exhaustive list of every desirable HMG attribute. In general, effective HMGs should possess most of the characteristics.
In applying the framework, the HMG should not simply attempt to evaluate each characteristic with a yes or no assessment. For HMGs responding yes, there may be a wide range of performancefrom meeting the bare minimum requirements to employing sophisticated, expansive measures to excel in the characteristic.
SHM encourages hospital leaders and HMG leaders to use these characteristics to perform an HMG self‐assessment and to develop a plan. The plan could address implementation of selected characteristics that are not currently being addressed by the HMG or the development of additional behaviors, tools, resources, and capabilities that more fully incorporate those characteristics for which the HMG meets only minimum requirements. In addition, the plan could address the impact that a larger organization (eg, health system, hospital, or employer) may have on a given characteristic.
As outlined above, the process used to develop the Key Principles and Characteristics of an Effective HMG was grounded in expert opinion and extensive review and feedback. HMGs that use the framework should recognize that others might have a different opinion. For example, characteristic 5.2 states, The HMG's compensation model aligns hospitalist incentives with the goals of the hospital and the goals of the hospitalist's employer (if different). There are likely to be experienced hospitalist leaders who believe that an effective HMG does not need to have an incentive compensation system. However, the consensus process employed to develop the key characteristics led to the conclusion that an effective HMG should have an incentive compensation system.
The publication of the Key Principles and Characteristics of an Effective HMG may lead to negative and/or unintended consequences. A self‐assessment by an HMG using this framework could require a significant level of effort on behalf of the HMG, whereas implementing remedial efforts to address the characteristics could require an investment of time and money that could take away from other important issues facing the HMG. Many HMGs may be held accountable for addressing these characteristics without the necessary financial support from their hospital or medical group. Finally, the publication of the document could create a backlash from members of the hospitalist community who do not think that the SHM should be in the business of defining what characterizes an effective HMG, rather that this definition should be left to the marketplace.
Despite these concerns, the leadership of the SHM expects that the publication of the Key Principles and Characteristics of an Effective HMG will lead to overall improvement in the capabilities and performance of HMGs.
CONCLUSIONS
The Key Principles and Characteristics of an Effective HMG have been designed to be aspirational, helping to raise the bar for the specialty of hospital medicine. These principles and characteristics could provide a framework for HMGs seeking to conduct self‐assessments, outlining a pathway for improvement, and better defining the central role of hospitalists in coordinating team‐based, patient‐centered care in the acute care setting.
Acknowledgments
Disclosures: Patrick Cawley, MD: none; Steven Deitelzweig, MD: none; Leslie Flores, MHA: provides consulting to hospital medicine groups; Joseph A. Miller, MS: none; John Nelson, MD: provides consulting to hospital medicine groups; Scott Rissmiller, MD: none; Laurence Wellikson, MD: none; Winthrop F. Whitcomb, MD: provides consulting to hospital medicine groups.
- American College of Surgeons. New verification site visit outcomes. Available at: http://www.facs.org/trauma/verifivisitoutcomes.html. Accessed September 3, 2013.
- Hospital accreditation standards 2012. Oakbrook Terrace, IL: The Joint Commission; 2012. Available at: Amazon.com: http://www.amazon.com/Hospital‐Accreditation‐Standards‐Joint‐Commission/dp/1599404257
- The magnet model: components and sources of evidence. Silver Spring, MD: American Nurse Credentialing Center; 2011. Available at: Amazon.com: http://www.amazon.com/Magnet‐Model‐Components‐Sources‐Evidence/dp/1935213229.
- Patient Centered Medical Home Standards and Guidelines. National Committee for Quality Assurance. Available at: https://inetshop01.pub.ncqa.org/Publications/deptCate.asp?dept_id=21(suppl 1):2–95.
With the continuing growth of the specialty of hospital medicine, the capabilities and performance of hospital medicine groups (HMGs) varies significantly. There are few guidelines that HMGs can reference as tools to guide self‐improvement. To address this deficiency, the Society of Hospital Medicine (SHM) Board of Directors authorized a process to identify the key principles and characteristics of an effective HMG.
METHODS
Topic Development and Validation Prework
In providing direction to this effort, the SHM board felt that the principles and characteristics should be directed at both hospitals and hospitalists, addressing the full range of managerial, organizational, clinical, and quality activities necessary to achieve effectiveness. Furthermore, the board defined effectiveness as consisting of 2 components. First, the HMG must assure that the patients managed by hospitalists receive high‐quality care that is sensitive to their needs and preferences. Second, the HMG must understand that the central role of the hospitalist is to coordinate patient care and foster interdisciplinary communication across the care continuum to provide optimal patient outcomes.
The SHM board appointed an HMG Characteristics Workgroup consisting of individuals who have experience with a wide array of HMG models and who could offer expert opinions on the subject. The HMG Characteristics Workgroup felt it important to review the work of other organizations that develop and administer criteria, standards, and/or requirements for healthcare organizations. Examples cited were the American College of Surgeons[1]; The Joint Commission[2]; American Nurse Credentialing Center[3]; the National Committee for Quality Assurance[4]; the American Medical Group Association[5]; and the American Association of Critical‐Care Nurses.[6]
In March 2012 and April 2012, SHM staff reviewed the websites and published materials of these organizations. For each program, information was captured on the qualifications of applicants, history of the program, timing of administering the program, the nature of recognition granted, and the program's keys to success. The summary of these findings was shared with the workgroup.
Background research and the broad scope of characteristics to be addressed led to the workgroup's decision to develop the principles and characteristics using a consensus process, emphasizing expert opinion supplemented by feedback from a broad group of stakeholders.
Initial Draft
During April 2012 and May 2012, the HMG Characteristics Workgroup identified 3 domains for the key characteristics: (1) program structure and operations, (2) clinical care delivery, and (3) organizational performance improvement. Over the course of several meetings, the HMG Characteristics Workgroup developed an initial draft of 83 characteristics, grouped into 29 subgroups within the 3 domains.
From June 2012 to November 2012, this initial draft was reviewed by a broad cross section of the hospital medicine community including members of SHM's committees, a group of academic hospitalists, focus groups in 2 communities (Philadelphia and Boston), and the leaders of several regional and national hospitalist management companies. Quantitative and qualitative feedback was obtained.
In November 2012, the SHM Board of Directors held its annual leadership meeting, attended by approximately 25 national hospitalist thought leaders and chairpersons of SHM committees. At this meeting, a series of exercises were conducted in which these leaders of the hospital medicine movement, including the SHM board members, were each assigned individual characteristics and asked to review and edit them for clarity and appropriateness.
As a result of feedback at that meeting and subsequent discussion by the SHM board, the workgroup was asked to modify the characteristics in 3 ways. First, the list should be streamlined, reducing the number of characteristics. Second, the 3 domains should be eliminated, and a better organizing framework should be created. Third, additional context should be added to the list of characteristics.
Second Draft
During the period from November 2012 to December 2012, the HMG Characteristics Workgroup went through a 2‐step Delphi process to consolidate characteristics and/or eliminate characteristics that were redundant or unnecessary. In the first step, members of the workgroup rated each characteristic from 1 to 3. A rating of 1 meant not important; good quality, but not required for an effective HMG. A rating of 2 meant important; most effective HMGs will meet requirement. A rating of 3 meant highly important; mandatory for an effective HMG. In the second step, members of the workgroup received feedback on the scores for each characteristic and came to a consensus on which characteristics should be eliminated or merged with other characteristics.
As a result, the number of characteristics was reduced and consolidated from 83 to 47, and a new framing structure was defined, replacing the 3 domains with 10 organizing principles. Finally, a rationale for each characteristic was added, defending its inclusion in the list. In addition, consideration was given to including a section describing how an HMG could demonstrate that their organization met each characteristic. However, the workgroup and the board decided that these demonstration requirements should be vetted before they were published.
From January 2013 to June 2013, the revised key principles and characteristics were reviewed by selected chairpersons of SHM committees and by 2 focus groups of HMG leaders. These reviews were conducted at the SHM Annual Meeting. Finally, in June 2013, the Committee on Clinical Leadership of the American Hospital Association reviewed and commented on the draft of the principles and characteristics.
In addition, based on feedback received from the reviewers, the wording of many of the characteristics went through revisions to assure precision and clarity. Before submission to the Journal of Hospital Medicine, a professional editor was engaged to assure that the format and language of the characteristics were clear and consistent.
Final Approval
The final draft of the 10 principles and 47 characteristics was approved for publication at a meeting of the SHM Board of Directors in September 2013 (Figure 1).
RESULTS
A recurring issue that the workgroup addressed was the applicability of the characteristics from 1 practice setting to another. Confounding factors include the HMG's employment/organizational model (eg, hospital employed, academic, multispecialty group, private practice, and management company), its population served (eg, adult vs pediatric, more than 1 hospital), and the type of hospital served (eg, academic vs community, the hospital has more than 1 HMG). The workgroup has made an effort to assure that all 47 characteristics can be applied to every type of HMG.
In developing the 10 principles, the workgroup attempted to construct a list of the basic ingredients needed to build and sustain an effective HMG. These 10 principles stand on their own, independent of the 47 key characteristics, and include issues such as effective leadership, clinician engagement, adequate resources, management infrastructure, key hospitalist roles and responsibilities, alignment with the hospital, and the recruitment and retention of qualified hospitalists.
A more detailed version of the Key Principles and Characteristics of an Effective HMG is available in the online version of this article (see Supporting Information, Appendix, in the online version of this article). The online Appendix includes the rationales for each of the characteristics, guidance on how to provide feedback to the SHM on the framework, and the SHM's plan for further development of the key principles and characteristics.
DISCUSSION
To address the variability in capabilities and performance of HMGs, these principles and characteristics are designed to provide a framework for HMGs seeking to conduct self‐assessments and develop pathways for improvement.
Although there may be HMG arrangements that do not directly involve the hospital and its executive team, and therefore alternative approaches may make sense, for most HMGs hospitals are directly involved with the HMG as either an employer or a contractor. For that reason, the Key Principles and Characteristics of an Effective HMG is written for 2 audiences: the executive leadership of the hospital (most specifically the chief medical officer or a similar role) and the hospitalists in the HMG (most specifically the practice medical director). To address the key characteristics requires the active participation of both parties. For the hospital executives, the framework establishes expectations for the HMG. For the hospitalists, the framework provides guidance in the development of an improvement plan.
Hospital executives and hospitalists can use the key characteristics in a broad spectrum of ways. The easiest and least formalized approach would be to use the framework as the basis of an ongoing dialogue between the hospital leadership and the HMG. A more formal approach would be to use the framework to guide the planning and budgeting activities of the HMG. Finally, a hospital or health system can use the key principles and characteristics as a way to evaluate their affiliated HMG(s)for example, the HMG must address 80% of the 47 characteristics.
The Key Principles and Characteristics of an Effective HMG should be considered akin to the Core Competencies in Hospital Medicine previously published in the Journal of Hospital Medicine.[7] However, instead of focusing on the competencies of individual physicians, this framework focuses on the characteristics of hospitalist groups. Just as a physician or other healthcare provider is not expected to demonstrate competency for every element in the core competencies document, an HMG does not need to have all 47 characteristics to be effective. Effective hospitalists may have skills other than those listed in the Core Competencies in Hospital Medicine. Similarly, the 47 characteristics do not represent an exhaustive list of every desirable HMG attribute. In general, effective HMGs should possess most of the characteristics.
In applying the framework, the HMG should not simply attempt to evaluate each characteristic with a yes or no assessment. For HMGs responding yes, there may be a wide range of performancefrom meeting the bare minimum requirements to employing sophisticated, expansive measures to excel in the characteristic.
SHM encourages hospital leaders and HMG leaders to use these characteristics to perform an HMG self‐assessment and to develop a plan. The plan could address implementation of selected characteristics that are not currently being addressed by the HMG or the development of additional behaviors, tools, resources, and capabilities that more fully incorporate those characteristics for which the HMG meets only minimum requirements. In addition, the plan could address the impact that a larger organization (eg, health system, hospital, or employer) may have on a given characteristic.
As outlined above, the process used to develop the Key Principles and Characteristics of an Effective HMG was grounded in expert opinion and extensive review and feedback. HMGs that use the framework should recognize that others might have a different opinion. For example, characteristic 5.2 states, The HMG's compensation model aligns hospitalist incentives with the goals of the hospital and the goals of the hospitalist's employer (if different). There are likely to be experienced hospitalist leaders who believe that an effective HMG does not need to have an incentive compensation system. However, the consensus process employed to develop the key characteristics led to the conclusion that an effective HMG should have an incentive compensation system.
The publication of the Key Principles and Characteristics of an Effective HMG may lead to negative and/or unintended consequences. A self‐assessment by an HMG using this framework could require a significant level of effort on behalf of the HMG, whereas implementing remedial efforts to address the characteristics could require an investment of time and money that could take away from other important issues facing the HMG. Many HMGs may be held accountable for addressing these characteristics without the necessary financial support from their hospital or medical group. Finally, the publication of the document could create a backlash from members of the hospitalist community who do not think that the SHM should be in the business of defining what characterizes an effective HMG, rather that this definition should be left to the marketplace.
Despite these concerns, the leadership of the SHM expects that the publication of the Key Principles and Characteristics of an Effective HMG will lead to overall improvement in the capabilities and performance of HMGs.
CONCLUSIONS
The Key Principles and Characteristics of an Effective HMG have been designed to be aspirational, helping to raise the bar for the specialty of hospital medicine. These principles and characteristics could provide a framework for HMGs seeking to conduct self‐assessments, outlining a pathway for improvement, and better defining the central role of hospitalists in coordinating team‐based, patient‐centered care in the acute care setting.
Acknowledgments
Disclosures: Patrick Cawley, MD: none; Steven Deitelzweig, MD: none; Leslie Flores, MHA: provides consulting to hospital medicine groups; Joseph A. Miller, MS: none; John Nelson, MD: provides consulting to hospital medicine groups; Scott Rissmiller, MD: none; Laurence Wellikson, MD: none; Winthrop F. Whitcomb, MD: provides consulting to hospital medicine groups.
- American College of Surgeons. New verification site visit outcomes. Available at: http://www.facs.org/trauma/verifivisitoutcomes.html. Accessed September 3, 2013.
- Hospital accreditation standards 2012. Oakbrook Terrace, IL: The Joint Commission; 2012. Available at: Amazon.com: http://www.amazon.com/Hospital‐Accreditation‐Standards‐Joint‐Commission/dp/1599404257
- The magnet model: components and sources of evidence. Silver Spring, MD: American Nurse Credentialing Center; 2011. Available at: Amazon.com: http://www.amazon.com/Magnet‐Model‐Components‐Sources‐Evidence/dp/1935213229.
- Patient Centered Medical Home Standards and Guidelines. National Committee for Quality Assurance. Available at: https://inetshop01.pub.ncqa.org/Publications/deptCate.asp?dept_id=21(suppl 1):2–95.
A Special Supplement on Women’s Health
While better appreciated than 2 decades ago, gender-related differences remain an important issue in clinical practice. This supplement includes 8 articles that focus on the needs and considerations in providing care to women. Four articles focus on cardiometabolic diseases: acute coronary syndrome, coronary heart disease, obesity, and diabetes mellitus. Additional topics include the early management of rheumatoid arthritis and the pharmacologic management of nausea and vomiting of pregnancy.
The last 2 articles each offer the opportunity to earn 1 free CME credit: The Pharmacologic Management of Idiopathic Overactive Bladder in Primary Care and Chronic Migraine in Women. Credit is awarded for successful completion of the quizzes at the links below; these links may also be found in the Women’s Health supplement on the first page of each article.
The Pharmacologic Management of Idiopathic Overactive Bladder in Primary Care www.pceconsortium.org/oab
Chronic Migraine in Women www.pceconsortium.org/migraine
Expert calls pegloticase a powerhouse gout drug not to be feared
SNOWMASS, COLO. – Pegloticase (Krystexxa) is a gout drug that’s expensive, inconveniently administered by intravenous infusion every 2 weeks, and saddled with a substantial rate of immunogenicity, with infusion reactions that can include anaphylaxis.
So why does gout authority Dr. Michael H. Pillinger call pegloticase "a greatly underestimated and underutilized drug"? And why do the current American College of Rheumatology gout guidelines recommend pegloticase for refractory gout?
"Nothing else we have will get rid of tophi the way this drug gets rid of tophi," Dr. Pillinger explained at the Winter Rheumatology Symposium sponsored by the American College of Rheumatology.
"Why do we care about that? Because tophi are erosive, they’re damaging, and also because they’re much more extensive than we think they are," said Dr. Pillinger, a rheumatologist and director of the crystal diseases study group at New York University.
Besides, the safety concern regarding this powerhouse urate-lowering drug has been resolved. The infusion reactions are readily avoidable. Pegloticase is not a drug rheumatologists should be scared of, he emphasized.

Dr. Pillinger cited an eye-opening study that demonstrated just how much larger gout patients’ total body urate burden actually is compared with what’s apparent clinically. Investigators at the University of British Columbia, Vancouver, used dual-energy CT to assess urate deposits in 20 consecutive patients with tophaceous gout and 10 controls with other arthritic conditions. Physical evaluation of the gout patients turned up 111 areas of urate deposition; dual-energy CT revealed 440 such areas. The mean total urate volume was a hefty 40.2 cm3 (Ann. Rheum. Dis. 2009;68:1609-12).
"There’s a lot more tophi under the surface," Dr. Pillinger commented.
Pegloticase is a recombinant porcine uricase that’s modified with a baboon N-terminus. It’s pegylated to reduce immunogenicity to the uricase and increase stability and half-life. Paradoxically, the drug is still quite immunogenic because many patients develop antibodies to the polyethylene glycol used in pegylation.
The drug’s urate-lowering effect is unmatched. Within 12-24 hours of the first dose, the plasma uric acid level plummets to almost nothing.
"What happens is that very, very quickly these patients are going to split into two groups. For one group this is the greatest drug in the world; their uric acid remains almost undetectable – and that’s in our sickest refractory patients. And then there’s another group that starts to fail. It’s in the neighborhood of 30%-40% of patients, so it’s a real problem. We know they’re failing because their uric acid level starts rising. They’re making antibodies and inactivating the drug every time it’s given. And they’re the ones who get bad infusion reactions," the rheumatologist explained.
The solution to using pegloticase safely is to routinely measure serum urate 1-2 days before each infusion. If the serum urate climbs to 6 mg/dL on one or two occasions, it’s time to discontinue the drug.
"For everybody else, they’re going to do really, really well," Dr. Pillinger said.
A key point emphasized in the 2012 ACR gout guidelines (Arthritis Care Res. 2012;64:1431-46; 1447-61) is that when patients go on pegloticase, all other urate-lowering therapies must be stopped as a matter of safety. Otherwise, it’s impossible to use the pre-infusion plasma urate measurement to determine if pegloticase has stopped working.
The ACR guidelines recommend pegloticase as third-line urate-lowering therapy in patients who are not at target despite maximum-dose therapy with a xanthine oxidase inhibitor plus second-line therapy with probenecid, losartan, or fenofibrate.
Dr. Pillinger reported having received research grants from Savient, which markets pegloticase, and Takeda.
SNOWMASS, COLO. – Pegloticase (Krystexxa) is a gout drug that’s expensive, inconveniently administered by intravenous infusion every 2 weeks, and saddled with a substantial rate of immunogenicity, with infusion reactions that can include anaphylaxis.
So why does gout authority Dr. Michael H. Pillinger call pegloticase "a greatly underestimated and underutilized drug"? And why do the current American College of Rheumatology gout guidelines recommend pegloticase for refractory gout?
"Nothing else we have will get rid of tophi the way this drug gets rid of tophi," Dr. Pillinger explained at the Winter Rheumatology Symposium sponsored by the American College of Rheumatology.
"Why do we care about that? Because tophi are erosive, they’re damaging, and also because they’re much more extensive than we think they are," said Dr. Pillinger, a rheumatologist and director of the crystal diseases study group at New York University.
Besides, the safety concern regarding this powerhouse urate-lowering drug has been resolved. The infusion reactions are readily avoidable. Pegloticase is not a drug rheumatologists should be scared of, he emphasized.
Dr. Pillinger cited an eye-opening study that demonstrated just how much larger gout patients’ total body urate burden actually is compared with what’s apparent clinically. Investigators at the University of British Columbia, Vancouver, used dual-energy CT to assess urate deposits in 20 consecutive patients with tophaceous gout and 10 controls with other arthritic conditions. Physical evaluation of the gout patients turned up 111 areas of urate deposition; dual-energy CT revealed 440 such areas. The mean total urate volume was a hefty 40.2 cm3 (Ann. Rheum. Dis. 2009;68:1609-12).
"There’s a lot more tophi under the surface," Dr. Pillinger commented.
Pegloticase is a recombinant porcine uricase that’s modified with a baboon N-terminus. It’s pegylated to reduce immunogenicity to the uricase and increase stability and half-life. Paradoxically, the drug is still quite immunogenic because many patients develop antibodies to the polyethylene glycol used in pegylation.
The drug’s urate-lowering effect is unmatched. Within 12-24 hours of the first dose, the plasma uric acid level plummets to almost nothing.
"What happens is that very, very quickly these patients are going to split into two groups. For one group this is the greatest drug in the world; their uric acid remains almost undetectable – and that’s in our sickest refractory patients. And then there’s another group that starts to fail. It’s in the neighborhood of 30%-40% of patients, so it’s a real problem. We know they’re failing because their uric acid level starts rising. They’re making antibodies and inactivating the drug every time it’s given. And they’re the ones who get bad infusion reactions," the rheumatologist explained.
The solution to using pegloticase safely is to routinely measure serum urate 1-2 days before each infusion. If the serum urate climbs to 6 mg/dL on one or two occasions, it’s time to discontinue the drug.
"For everybody else, they’re going to do really, really well," Dr. Pillinger said.
A key point emphasized in the 2012 ACR gout guidelines (Arthritis Care Res. 2012;64:1431-46; 1447-61) is that when patients go on pegloticase, all other urate-lowering therapies must be stopped as a matter of safety. Otherwise, it’s impossible to use the pre-infusion plasma urate measurement to determine if pegloticase has stopped working.
The ACR guidelines recommend pegloticase as third-line urate-lowering therapy in patients who are not at target despite maximum-dose therapy with a xanthine oxidase inhibitor plus second-line therapy with probenecid, losartan, or fenofibrate.
Dr. Pillinger reported having received research grants from Savient, which markets pegloticase, and Takeda.
EXPERT ANALYSIS FROM THE WINTER RHEUMATOLOGY SYMPOSIUM

Protein ‘critical’ for function of HSCs, LSCs

(endoplasmic reticulum in
green, mitochondria in red,
and chromosomes in blue)
Wellcome Images
The dynein-binding protein Lis1 is critical for hematopoietic stem cell (HSC) function and blood formation, according to a paper published in Nature Genetics.
Investigators found that Lis1 regulates asymmetric division of HSCs, ensuring the cells correctly differentiate to provide an adequate supply of new blood cells.
The research also indicated that Lis1 plays a key role in leukemias, as leukemic stem cells rely on the protein to regulate and sustain their growth.
“[Asymmetric division] is very important for the proper generation of all the cells needed for the development and function of many normal tissues,” said study author Tannishtha Reya, PhD, of the University of California, San Diego School of Medicine.
When cells divide, Lis1 controls orientation of the mitotic spindle, an apparatus of subcellular fibers that segregates chromosomes during cell division.
“During division, the spindle is attached to a particular point on the cell membrane, which also determines the axis along which the cell will divide,” Dr Reya said. “Because proteins are not evenly distributed throughout the cell, the axis of division, in turn, determines the types and amounts of proteins that get distributed to each daughter cell.”
When the investigators deleted Lis1 from mouse HSCs, differentiation was radically altered. Asymmetric division increased and accelerated differentiation.
This led to an oversupply of specialized cells and an ever-diminishing reserve of undifferentiated stem cells, which eventually resulted in a bloodless mouse.
“What we found was that a large part of the defect in blood formation was due to a failure of stem cells to expand,” Dr Reya said.
“Instead of undergoing symmetric divisions to generate 2 stem cell daughters, they predominantly underwent asymmetric division to generate more specialized cells. As a result, the mice were unable to generate enough stem cells to sustain blood cell production.”
The investigators next looked at how leukemic stem cells in mice behaved when the Lis1 signaling pathway was blocked. And the team discovered that these cells also lost the ability to renew and propagate.
“In this sense, the effect Lis1 has on leukemic self-renewal parallels its role in normal stem cell self-renewal,” Dr Reya said.
She added that these findings shed new light on the fundamental regulators of cell growth, both in normal development and in cancer.
“Our work shows that elimination of Lis1 potently inhibits cancer growth and identifies Lis1 and other regulators of protein inheritance as a new class of molecules that could be targeted in cancer therapy,” she said.
However, it remains to be seen whether inhibiting Lis1 in cancer cells would produce unacceptable consequences in normal cells as well.
“Agents that target Lis1 might be more specific and less toxic [than chemotherapy],” Dr Reya said, “which would give them significant clinical value.” ![]()
Immune surveillance prevents DLBCL

Walter and Eliza Hall Institute
Preclinical research indicates that immune cells undergo daily, spontaneous changes that could lead to diffuse large B-cell lymphoma (DLBCL), if not for the diligent surveillance of the immune system.
Experiments in mice revealed that T cells are responsible for eliminating potentially cancerous B cells in their early stages, before they develop into DLBCL.
This immune surveillance may account for what the researchers call the “surprising rarity” of DLBCL in humans, given how often these spontaneous changes occur.
The team believes their discovery could eventually help physicians identify patients at high risk of developing DLBCL, thereby enabling preventative treatment.
Axel Kallies, PhD, of the Walter and Eliza Hall Institute of Medical Research in Victoria, Australia, and his colleagues conducted this research and recounted their findings in Nature Medicine.
The researchers knew that many DLBCL cases are characterized by deregulated expression of the oncogene BCL6 or loss of function of the tumor suppressor gene PRDM1 (also known as BLIMP1).
But mice with mutations in either gene infrequently develop lymphoma, and, if they do, the process is slow. The same is true for humans with BCL6 mutations.
To investigate this phenomenon, the team conducted experiments in mice. The results showed that T cells prevent lymphoma development caused by Blimp1 deficiency or overexpression of Bcl6. But impairing T-cell control removed this protection.
“[W]e ‘disabled’ the T cells to suppress the immune system and, to our surprise, found that lymphoma developed in a matter of weeks, where it would normally take years,” Dr Kallies said.
The researchers also found that the DLBCL-like disease the mice developed could be eliminated by polyclonal CD8+ T cells. But deletion of the B-lymphoma cells was dependent upon the T-cell receptor, co-stimulation via CD28, and expression of the Fas ligand.
These results suggest that malignant transformation of mature B cells—in mice and perhaps in humans—is only possible when T-cell-mediated tumor surveillance is disabled.
“Each and every one of us has spontaneous mutations in our immune B cells that occur as a result of their normal function,” Dr Kallies said. “It is then somewhat of a paradox that B-cell lymphoma is not more common in the population.”
“Our finding that immune surveillance by T cells enables early detection and elimination of these cancerous and pre-cancerous cells provides an answer to this puzzle and proves that immune surveillance is essential to preventing the development of this blood cancer.”
Study author David Tarlinton, PhD, also of the Walter and Eliza Hall Institute, said this research could be used to help scientists identify pre-cancerous cells in the initial stages of their development, thereby enabling early intervention for patients at risk of developing DLBCL.
“In the majority of patients, the first sign that something is wrong is finding an established tumor, which, in many cases, is difficult to treat,” he noted.
“Now that we know B-cell lymphoma is suppressed by the immune system, we could use this information to develop a diagnostic test that identifies people in early stages of this disease, before tumors develop and they progress to cancer. There are already therapies that could remove these aberrant B cells in at-risk patients, so once a test is developed, it can be rapidly moved towards clinical use.” ![]()
Comanagement Following CRC Surgery
Colorectal cancer (CRC) is the second most common malignancy in the United States. In 2013, an estimated 142,820 men and women will be newly diagnosed, and 50,830 patients will die from colon or rectal cancer.[1] The majority of patients are aged 65 years or older at diagnosis, and with a growing elderly population, the CRC burden assumes increasing importance in this patient population.[1] Surgery remains the most important treatment option; however, surgical management of older CRC patients is often complicated because of the attendant comorbidities.[2, 3]
Recently, comanagement of surgical patients during their hospital stay has increased substantially in an effort to provide care to complex patients.[4, 5] Comanagement includes daily assessment of acute issues and comorbidities, and communication with surgeons by physicians including hospitalists and internists.[6] The presumed benefits of this comanaged approach to patient care include increased prescribing of evidence‐based treatments,[7] reduced time to surgery,[8] fewer transfers to an intensive care unit,[9] fewer postoperative complications,[9, 10, 11] shortened length of hospital stay,[12, 13] and lower readmission rates.[7] Information regarding detailed characteristics of patients receiving comanagement during hospitalization, specifically for CRC surgery, is lacking. This is an important consideration because comanagement may be particularly beneficial for CRC patients, who tend to be older at diagnosis and may have multiple comorbidities.[5] Hospitalists may be especially important for postoperative management of CRC patients, depending upon the complexity of the surgery and also the need for close medical and surgical monitoring in the perioperative setting, particularly among older CRC patients. Many CRC patients develop complications following surgery,[14] and it is possible that these patients may be rescued by comanagement with hospitalist physicians. Our aim was to assess the use of and characteristics associated with comanagement of patients undergoing surgical intervention for CRC.
METHODS
We obtained data from an existing linkage of 2000 to 2005 National Cancer Institute's Surveillance, Epidemiology, and End Results (SEER) program data with 1999 to 2005 Medicare claim files from the Centers for Medicare and Medicaid Services (CMS).[15] In this study, data from 16 tumor registries and 1242 hospitals were included, covering approximately 28% of the US population. We selected patients aged 66 years or older with a first primary stage I to III colon or rectal cancer diagnosis between 2000 and 2005. Patients were eligible for inclusion when they had both Medicare parts A and B coverage and underwent surgical treatment for CRC. We excluded patients identified from autopsy or death certificate only, patients for whom the month of diagnosis was not available, and patients who were members of a Health Maintenance Organization and thereby lacking Medicare claims data. We excluded patients who were only eligible for Medicare because they were disabled or had end‐stage renal disease (ie, patients younger than 65 years of age). The age restriction of 66 years of age or older allowed for 1 year of Medicare claims data prior to CRC diagnosis to determine preexisting comorbidity. We used 1999 Medicare data to obtain information about comorbidity for CRC patients who were diagnosed in 2000. Definitive surgery for CRC was measured by searching inpatient, outpatient, and carrier claims using previously identified Healthcare Common Procedure Coding System and/or International Classification of Diseases, 9th Revision (ICD‐9). In the event of multiple surgical interventions in 1 patient record, the date on which the most invasive surgery was performed was used.[16]
Comanagement Use
The outcome of interest was whether or not CRC patients received comanaged care during hospitalization following surgical treatment (comanagement prior to surgery was not included). Comanagement was defined as having a relevant physician (ie, internal medicine hospitalist/generalist) submit a claim for evaluation and management services on 70% or more of the days of hospitalization of the patient, including partial days of admission and discharge. To identify inpatient physician claims, we used the Common Procedure TerminologyEvaluation and Management codes 99221 to 99223, 99251 to 99255, and 99231 to 99233.[5, 17]
Covariates
Characteristics potentially associated with comanagement use included patient, tumor, treatment, and hospital characteristics based on previous work.[4, 5] Patient sociodemographic characteristics included sex, age, race/ethnicity, comorbidity, dual eligibility for Medicare and Medicaid, and year of CRC diagnosis. Comorbidity was measured by searching inpatient or carrier claims for multiple chronic diseases occurring 1 to 12 months prior to diagnosis. We categorized comorbidity as a score of 0, 1, or 2 or more and computed an index score[18] to examine nonlinear trends. Dual MedicareMedicaid participation was present if a patient had Medicaid coverage for at least 1 month during the year before diagnosis. We used census‐tract poverty rate as a measure of neighborhood economic condition, Which was defined as the percentage of the population living in poverty in the census tract of the patient's residence at the time of diagnosis and was derived from the 2000 census. Tumor characteristics included American Joint Commission on Cancer (AJCC) tumor stage, grade, location, and histology. Treatment characteristics included mode of presentation, type of surgery, length of hospital stay, and presence of complications during hospitalization.[19, 20] Complications (eg, postoperative pneumonia, surgical‐site infection, deep vein thrombosis) during hospitalization but following CRC surgery were identified from Medicare data using a previously developed algorithm.[19] The complications algorithm was developed by clinical experts and consists of ICD‐9 diagnosis and procedure codes representing CRC‐resection complications and their treatment, including additional operations. Surgical interventions after emergency admission were defined as emergency surgery; all other surgical treatments were classified as elective. Additionally, characteristics of the hospital where the patient's surgery took place included number of hospital beds, obtained from the Healthcare Cost Report and the Provider of Service files from CMS, and surgeon caseload, based on the number of CRC surgeries performed during the study period. The hospital's surgery volume was calculated using the number of CRC surgeries performed during the study period and categorized into quartiles.
Statistical Analysis
Proportions of comanaged patients were calculated for each covariate. Univariable logistic regression analyses were performed to assess the association between comanagement use and each covariate separately. All analyses were adjusted for nesting of CRC patients within hospitals, using a 2‐level model with a random intercept. Next, we fitted a multivariable model that included covariates associated with comanagement in univariable analysis based on the likelihood ratio test (P < 0.05). Inclusion of covariates in the final multivariable model was based on statistically significant associations with comanagement. Adjusted odds ratios (ORs) were calculated with 95% confidence intervals. Variability across hospitals was calculated using the intraclass coefficient (ICC) for logistic regression.[21] The ICC ranges from 0.0 (no variability across hospitals) to 1.0 (extreme variability across hospitals). In addition, we calculated adjusted values for comanagement to describe the hospital variability. These adjusted values were computed based on the multivariable model by averaging the patient‐level probabilities for all patients who resided in that hospital. We conducted a series of analyses to challenge the robustness of our results. To investigate the potential effect of a different definition of comanagement, we defined comanagement as both (1) having a relevant physician submit a claim for evaluation and management services on 50% or more of the days of the patient's hospitalization, and (2) having a relevant hospitalist or generalist physician submit a claim for evaluation and management services on 100% of the days of hospitalization. All analyses were performed using Stata (version 12.0; StataCorp, College Station, TX).
RESULTS
There were 47,828 patients aged 66 years or older who were diagnosed with a first primary CRC between 2000 and 2005, had both Medicare parts A and B, and were not members of a Health Maintenance Organization during the study period. We excluded patients for whom we were unable to calculate complications (n = 2649), surgery or hospital volume (n = 6415), or who had missing data (n = 238). Finally, we excluded CRC patients with in situ, stage IV, or missing stage information, resulting in 37,065 patients in the study population. Patients in the study population were typically aged 75 to 84 years, were female, had 1 or more comorbid condition, lived in areas with the population poverty rate <10%, were diagnosed with AJCC stage II, had elective surgery, and were treated with partial colectomy (Table 1). During 2000 to 2005, 10,230 (27.6%) of 37,065 patients were comanaged during hospitalization for CRC surgery. In a model with no covariates, variability of comanagement across hospitals was significant (ICC = 0.382). All patient and hospital characteristics except for sex and race/ethnicity were significantly associated with comanagement use, when adjusted for clustering within hospitals. The most common characteristics associated with comanagement were emergency surgery (40.4%), complications (39.7%), and having 2 or more comorbid conditions (37.1%). Comanagement was less common among those with no comorbidity (21.0%), unknown tumor grade (21.9%), and other surgery (18.6%). Furthermore, comanagement increased from 24.8% in 2000 to 30.1% in 2005 (P for trend < 0.001; Table 1).
| Covariates | Total, N = 37,065 | Comanaged, n (%), n = 10,230 (27.6%) |
|---|---|---|
| ||
| Sociodemographics | ||
| Age, y | ||
| 6674 | 13,197 | 3,014 (22.8) |
| 7584 | 6,958 | 4,736 (27.9) |
| 85+ | 6,910 | 2,480 (35.9) |
| Sex | ||
| Male | 15,744 | 4,345 (27.6) |
| Female | 21,321 | 5,885 (27.6) |
| Racea | ||
| White | 31,958 | 8,579 (26.8) |
| African American | 2,641 | 745 (28.2) |
| Other | 2,466 | 906 (36.7) |
| Comorbiditya | ||
| 0 | 15,905 | 3,342 (21.0) |
| 1 | 10,860 | 3,068 (28.3) |
| 2+ | 10,300 | 3,820 (37.1) |
| Medicaida | ||
| No | 31,099 | 8,000 (25.7) |
| Yes | 5,966 | 2,230 (37.4) |
| Year of diagnosisa | ||
| 2000 | 6,041 | 1,497 (24.8) |
| 2001 | 6,193 | 1,624 (26.2) |
| 2002 | 6,289 | 1,692 (26.9) |
| 2003 | 6,489 | 1,829 (28.2) |
| 2004 | 6,219 | 1,832 (29.5) |
| 2005 | 5,834 | 1,756 (30.1) |
| Neighborhood characteristic | ||
| Poverty ratea | ||
| <10% | 21,772 | 5,698(26.2) |
| 10%19% | 9,458 | 2,722(28.8) |
| 20% | 5,835 | 1,810(31.0) |
| Tumor characteristics | ||
| AJCC stagea | ||
| I | 9,996 | 2,402 (24.0) |
| II | 14,662 | 4,287 (29.2) |
| III | 12,407 | 3,541 (28.5) |
| Tumor grade/differentiationa | ||
| Well | 3,278 | 799 (24.4) |
| Moderate | 25,129 | 6,905 (27.5) |
| Poor | 6,898 | 2,107 (30.6) |
| Undifferentiated | 350 | 110 (31.4) |
| Unknown | 1,410 | 309 (21.9) |
| Tumor locationa | ||
| Rectum | 6,977 | 1,616 (23.2) |
| Proximal colon | 14,811 | 4,252 (28.7) |
| Transverse colon | 5,650 | 1,679 (27.9) |
| Distal colon | 9,627 | 2,683 (23.2) |
| Tumor histologya | ||
| Mucinous adenocarcinoma | 32,109 | 8,766 (27.3) |
| Other adenocarcinoma | 4,761 | 1,407 (29.6) |
| Nonadenocarcinoma | 195 | 57 (29.2) |
| Treatment characteristics | ||
| Mode of presentationa | ||
| Elective | 28,673 | 6,836 (23.8) |
| Emergency | 8,392 | 3,394 (40.4) |
| Type of surgerya | ||
| Total (procto)colectomy | 1,475 | 372 (25.2) |
| Subtotal (hemi)colectomy | 18,840 | 5,367 (28.5) |
| Partial colectomyb | 16,017 | 4,298 (26.8) |
| Colectomy NOS | 647 | 177 (27.4) |
| Other surgery | 86 | 16 (18.6) |
| Length of stay, daysa, c | 12.8 (8.3) | |
| Complications during hospitalization | ||
| None | 28,580 | 6,863 (24.0) |
| Yes | 8,485 | 3,367 (39.7) |
| Hospital characteristics | ||
| Hospital volume (no. of beds)a | ||
| 1199 | 9,326 | 2,382 (25.5) |
| 200349 | 10,446 | 3,153 (30.2) |
| 350499 | 8,963 | 2,590 (28.9) |
| 500+ | 8,330 | 2,105 (25.3) |
| Hospital surgery volumea | ||
| 120 | 8,429 | 2,445 (29.0) |
| 2138 | 8,294 | 2,389 (28.8) |
| 3965 | 8,115 | 2,257 (27.8) |
| 66+ | 8,453 | 2,013 (23.8) |
| Unknown | 3,774 | 1,126 (29.8) |
Table 2 shows the adjusted ORs of the covariates associated with comanagement. This model includes only variables independently associated with comanagement. Increasing age was associated with increased odds of receiving comanagement, with OR = 1.22 for patients aged between 75 and 84 years, and OR = 1.52 for patients aged 85 years and older. Comorbidity scores of 1 or 2 or more were associated with increased odds of comanagement use following CRC surgery compared to patients without comorbidities (OR = 1.39 and OR = 1.92, respectively). Patients who received Medicaid were more likely to receive comanagement (OR = 1.11) compared with patients without Medicaid insurance. Higher AJCC stage was associated with increased use of comanagement, as was poor tumor differentiation. Patients undergoing surgery for colon versus rectal cancer were more likely to be comanaged during their hospital stay (OR = 1.23). Surgery after emergency admission was associated with an increased use of comanagement (OR = 1.95). The odds of comanagement increased slightly with increasing length of hospital stay (OR = 1.03), but were higher for patients who developed 1 or more complications during hospitalization compared with patients without complications (OR = 1.38). Compared with CRC patients treated in small hospitals (<200 beds), patients treated in hospitals with 200 to 349 beds were more likely to receive comanaged care (OR = 1.51), whereas patients treated in high‐volume hospitals with 500 beds were less likely to receive comanaged care during hospitalization (OR = 0.65). While census‐tract poverty rate was associated with comanagement in univariable analysis, no significant association was observed when adjusting for other covariates in the multivariable model. In a model with all covariates listed (Table 2), variability of comanagement across hospitals was significant (ICC = 0.376), suggesting that extensive variability across hospitals remained. The adjusted value of CRC patients receiving comanaged care varied widely, from 1.9% to 83.2% across hospitals. Our sensitivity analysis showed that odds ratios and confidence intervals were generally unchanged when using different definitions of comanagement.
| Covariates | OR | 95% CI |
|---|---|---|
| ||
| Age, y | ||
| 6674 | 1.00 | |
| 7584 | 1.22 | 1.151.30 |
| 85+ | 1.52 | 1.421.64 |
| Comorbidity | ||
| 0 | 1.00 | |
| 1 | 1.39 | 1.301.48 |
| 2+ | 1.92 | 1.802.05 |
| Medicaid | ||
| No | 1.00 | |
| Yes | 1.11 | 1.031.20 |
| Year of diagnosis, per year | 1.07 | 1.061.09 |
| AJCC stage | ||
| I | 1.00 | |
| II | 1.11 | 1.041.19 |
| III | 1.10 | 1.021.18 |
| Tumor grade/differentiation | ||
| Well | 1.00 | |
| Moderate | 1.08 | 0.981.19 |
| Poor | 1.17 | 1.041.31 |
| Undifferentiated | 1.14 | 0.851.52 |
| Unknown | 0.89 | 0.751.06 |
| Tumor location | ||
| Rectal | 1.00 | |
| Colon | 1.23 | 1.151.32 |
| Mode of presentation | ||
| Elective | 1.00 | |
| Emergency | 1.95 | 1.842.08 |
| Length of stay, per day | 1.03 | 1.021.03 |
| Complications during stay | ||
| No | 1.00 | |
| Yes | 1.38 | 1.291.48 |
| Hospital volume (no. of beds) | ||
| 1199 | 1.00 | |
| 200349 | 1.51 | 1.221.86 |
| 350499 | 1.26 | 0.981.62 |
| 500+ | 0.65 | 0.490.86 |
DISCUSSION
In all, 27.6% of CRC patients were comanaged during hospitalization, but large disparities existed across patient, hospital, and geographic characteristics. Our finding that more complex patients are more likely to receive comanaged care (eg, increasing age and comorbidity, higher tumor stage and grade, emergency presentation, and complications) are in line with other studies.[5] Importantly, there was a wide range in hospital use of comanagement; the variability across hospitals accounted for 37.6% of the total variability in comanagement use. In some hospitals, almost none of the patients received comanaged care, whereas in other hospitals 83.2% of patients received such care. One reason for the large variability across hospitals may be the lack of evidence about the effectiveness of comanagement. Although comanaged care may benefit orthopedic patients,[7, 8, 9, 10, 11] to our knowledge, no studies have shown benefit to CRC patients. Typically, procedures for which there is more ambiguity about its effectiveness show greater variability across hospitals and geographic areas.[22] Similar to a previous study,[5] we found that patients treated in midsize hospitals were more likely to receive comanagement, and patients treated at high‐volume hospitals were less likely to receive comanagement compared to smaller hospitals. However, because the variability was similar between the model without any variables and the full multivariable model, other variables not available in SEERMedicare data likely played a role in explaining this large interhospital variability. Quality of cancer care may be improved by reducing variation in underuse of effective and necessary care, variation that indicates misuse of preference‐sensitive care (ie, care that offers equivalent options to be chosen by the patient), and variation that indicates overuse of supply‐sensitive care (ie, care influenced by medical capacity).[23] Examining and reducing variability in medical care has been an important policy consideration for almost 30 years.[24, 25] Future studies should examine additional reasons for variability in comanagement across hospitals, including variables at the level of the patient, provider, and hospital. Cost‐effective interventions should subsequently target modifiable factors to reduce use of unnecessary care among patients unlikely to benefit from comanagement.
Our study benefits from using a population‐based SEERMedicare cohort of older CRC patients, representing the diversity of geographic areas and hospitals across the United States. Furthermore, we were able to include a variety of covariates available in the SEERMedicare data, including patient, hospital, and area characteristics. Whereas most studies examining the use or effectiveness of comanagement include single institutions or a variety of surgical patients,[5, 8, 11, 17] we examined the use of and characteristics associated with comanagement throughout the United States for a specific patient population.
We recognize several limitations in this study. Our study specifically assessed comanagement among hospitalized CRC patients aged 65 years and older without managed care insurance. Generalizabilty of our findings to other surgical patients, to younger CRC patients, and those with managed care insurance may therefore be limited. With regard to the definition of comanagement, we used a cutoff point of submitting a claim for management and evaluation on 70% or more of the days of hospitalization for CRC. This cutoff is somewhat arbitrary, but different cutoffs did not influence the results. However, in a prior study, changes in the cutoff used in this definition only affected the proportion of comanaged patients and did not change the observation of increasing trends in the use of comanagement.[5] In addition, we examined a CRC population diagnosed between 2000 and 2005. Because an increasing trend in use of comanagement was observed, it is possible that comanagement use has increased further in more recent years. Our findings of lower use of comanaged care in larger hospitals may be related to the increased use of hospitalists as consultants, whose care may not be accurately or completely captured in claims data. We do not report data regarding the use of physician extenders (nurse practitioners and physician assistants). Although their use is increasing in some contexts, in our data, if we counted patients comanaged by physician extenders, we would only add 79 additional CRC patients (0.6%) to our analyses, which is unlikely to influence our findings.
In conclusion, more complex patients are more likely to receive comanaged care following CRC surgery. Extensive variability existed across patients and hospitals likely due to the lack of evidence about the clinical effectiveness of comanagement for patients undergoing CRC surgery. Future studies should examine additional reasons for variability in comanagement across hospitals, including variables at the level of the patient, provider, and hospital.
Acknowledgements
The authors gratefully acknowledge James Struthers for his data management and programming services, provided through the Health Behavior, Communication, and Outreach Core of the Alvin J. Siteman Cancer Center at Barnes‐Jewish Hospital and Washington University School of Medicine. The authors acknowledge the efforts of the Applied Research Program, NCI; the Office of Research, Development and Information, CMS; Information Management Services, Inc.; SEER Program tumor registries in the creation of the SEERMedicare database. The authors thank Dr. S. Hendren at the University of Michigan for the use of the SAS programming codes to identify complications.
Disclosures: This study used the linked SEERMedicare database. The interpretation and reporting of these data are the sole responsibility of the authors. This work was supported by grants from the National Institutes of Health National Cancer Institute (R01 CA137750 and P30 CA091842). Dr. Davidson was supported in part through National Institutes of Health grants HL‐38180, DK‐56260, and Digestive Disease Research Core Center DK‐52574.
- , , . Cancer statistics, 2013. CA Cancer J Clin. 2013;63(1):11–30.
- , , , , , . Comorbidity in older surgical cancer patients: influence on patient care and outcome. Eur J Cancer. 2007;43(15):2179–2193.
- , , , et al. Which comorbid conditions predict complications after surgery for colorectal cancer? World J Surg. 2007;31(1):192–199.
- , , , . Growth in the care of older patients by hospitalists in the United States. N Engl J Med. 2009;360(11):1102–1112.
- , , , , . Comanagement of hospitalized surgical patients by medicine physicians in the United States. Arch Intern Med. 2010;170(4):363–368.
- , . Surgical comanagement: a natural evolution of hospitalist practice. J Hosp Med. 2008;3(5):394–397.
- , , , , , . Outcomes for older patients with hip fractures: the impact of orthopedic and geriatric medicine cocare. J Orthop Trauma. 2006;20(3):172–178; discussion 179–180.
- , , , et al. Effects of a hospitalist model on elderly patients with hip fracture. Arch Intern Med. 2005;165(7):796–801.
- , , , . Hip fractures in geriatric patients. Results of an interdisciplinary hospital care program. Clin Orthop Relat Res. 1992;(274):213–225.
- , , , . Impact of a comanaged Geriatric Fracture Center on short‐term hip fracture outcomes. Arch Intern Med. 2009;169(18):1712–1717.
- , , , et al. Medical and surgical comanagement after elective hip and knee arthroplasty: a randomized, controlled trial. Ann Intern Med. 2004;141(1):28–38.
- , . Effect of hospitalists on length of stay in the Medicare population: variation according to hospital and patient characteristics. J Am Geriatr Soc. 2010;58(9):1649–1657.
- , , , et al. The impact of hospitalists on length of stay and costs: systematic review and meta‐analysis. Am J Manag Care. 2012;18(1):e23–e30.
- , , , et al. Hospital and geographic variability in two colorectal cancer surgery outcomes: complications and mortality after complications. Ann Surg Onc. In press.
- , , , , . Overview of the SEER‐Medicare data: content, research applications, and generalizability to the United States elderly population. Med Care. 2002;40 (8 suppl):IV–3–18.
- , , , , , . Use of SEER‐Medicare data for measuring cancer surgery. Med Care. 2002;40(8 suppl):IV–43–48.
- , , , . Variation in length of stay and outcomes among hospitalized patients attributable to hospitals and hospitalists. J Gen Intern Med. 2013;28(3):370–376.
- , , , . Development of a comorbidity index using physician claims data. J Clin Epidemiol. 2000;53(12):1258–1267.
- , , , , , . Surgical complications are associated with omission of chemotherapy for stage III colorectal cancer. Dis Colon Rectum. 2010;53(12):1587–1593.
- , , , , , . Major postoperative complications and survival for colon cancer elderly patients. BMC Surgery. 2012;12(suppl 1):S20.
- , . Multilevel Analysis. An Introduction to Basic and Advanced Multilevel Modeling. London, UK: Sage Publications; 1999.
- , , , , , . The implications of regional variations in Medicare spending. Part 2: health outcomes and satisfaction with care. Ann Intern Med. 2003;138(4):288–298.
- . Tracking Medicine: A Researcher's Quest to Understand Health Care. Oxford, UK: Oxford University Press; 2010.
- . Understanding geographic variations in health care delivery. N Engl J Med. 1999;340:52–53.
- . Reducing variation in health care: the rhetorical politics of a policy idea. J Health Polit Policy Law. 2013;38(1):5–26.
Colorectal cancer (CRC) is the second most common malignancy in the United States. In 2013, an estimated 142,820 men and women will be newly diagnosed, and 50,830 patients will die from colon or rectal cancer.[1] The majority of patients are aged 65 years or older at diagnosis, and with a growing elderly population, the CRC burden assumes increasing importance in this patient population.[1] Surgery remains the most important treatment option; however, surgical management of older CRC patients is often complicated because of the attendant comorbidities.[2, 3]
Recently, comanagement of surgical patients during their hospital stay has increased substantially in an effort to provide care to complex patients.[4, 5] Comanagement includes daily assessment of acute issues and comorbidities, and communication with surgeons by physicians including hospitalists and internists.[6] The presumed benefits of this comanaged approach to patient care include increased prescribing of evidence‐based treatments,[7] reduced time to surgery,[8] fewer transfers to an intensive care unit,[9] fewer postoperative complications,[9, 10, 11] shortened length of hospital stay,[12, 13] and lower readmission rates.[7] Information regarding detailed characteristics of patients receiving comanagement during hospitalization, specifically for CRC surgery, is lacking. This is an important consideration because comanagement may be particularly beneficial for CRC patients, who tend to be older at diagnosis and may have multiple comorbidities.[5] Hospitalists may be especially important for postoperative management of CRC patients, depending upon the complexity of the surgery and also the need for close medical and surgical monitoring in the perioperative setting, particularly among older CRC patients. Many CRC patients develop complications following surgery,[14] and it is possible that these patients may be rescued by comanagement with hospitalist physicians. Our aim was to assess the use of and characteristics associated with comanagement of patients undergoing surgical intervention for CRC.
METHODS
We obtained data from an existing linkage of 2000 to 2005 National Cancer Institute's Surveillance, Epidemiology, and End Results (SEER) program data with 1999 to 2005 Medicare claim files from the Centers for Medicare and Medicaid Services (CMS).[15] In this study, data from 16 tumor registries and 1242 hospitals were included, covering approximately 28% of the US population. We selected patients aged 66 years or older with a first primary stage I to III colon or rectal cancer diagnosis between 2000 and 2005. Patients were eligible for inclusion when they had both Medicare parts A and B coverage and underwent surgical treatment for CRC. We excluded patients identified from autopsy or death certificate only, patients for whom the month of diagnosis was not available, and patients who were members of a Health Maintenance Organization and thereby lacking Medicare claims data. We excluded patients who were only eligible for Medicare because they were disabled or had end‐stage renal disease (ie, patients younger than 65 years of age). The age restriction of 66 years of age or older allowed for 1 year of Medicare claims data prior to CRC diagnosis to determine preexisting comorbidity. We used 1999 Medicare data to obtain information about comorbidity for CRC patients who were diagnosed in 2000. Definitive surgery for CRC was measured by searching inpatient, outpatient, and carrier claims using previously identified Healthcare Common Procedure Coding System and/or International Classification of Diseases, 9th Revision (ICD‐9). In the event of multiple surgical interventions in 1 patient record, the date on which the most invasive surgery was performed was used.[16]
Comanagement Use
The outcome of interest was whether or not CRC patients received comanaged care during hospitalization following surgical treatment (comanagement prior to surgery was not included). Comanagement was defined as having a relevant physician (ie, internal medicine hospitalist/generalist) submit a claim for evaluation and management services on 70% or more of the days of hospitalization of the patient, including partial days of admission and discharge. To identify inpatient physician claims, we used the Common Procedure TerminologyEvaluation and Management codes 99221 to 99223, 99251 to 99255, and 99231 to 99233.[5, 17]
Covariates
Characteristics potentially associated with comanagement use included patient, tumor, treatment, and hospital characteristics based on previous work.[4, 5] Patient sociodemographic characteristics included sex, age, race/ethnicity, comorbidity, dual eligibility for Medicare and Medicaid, and year of CRC diagnosis. Comorbidity was measured by searching inpatient or carrier claims for multiple chronic diseases occurring 1 to 12 months prior to diagnosis. We categorized comorbidity as a score of 0, 1, or 2 or more and computed an index score[18] to examine nonlinear trends. Dual MedicareMedicaid participation was present if a patient had Medicaid coverage for at least 1 month during the year before diagnosis. We used census‐tract poverty rate as a measure of neighborhood economic condition, Which was defined as the percentage of the population living in poverty in the census tract of the patient's residence at the time of diagnosis and was derived from the 2000 census. Tumor characteristics included American Joint Commission on Cancer (AJCC) tumor stage, grade, location, and histology. Treatment characteristics included mode of presentation, type of surgery, length of hospital stay, and presence of complications during hospitalization.[19, 20] Complications (eg, postoperative pneumonia, surgical‐site infection, deep vein thrombosis) during hospitalization but following CRC surgery were identified from Medicare data using a previously developed algorithm.[19] The complications algorithm was developed by clinical experts and consists of ICD‐9 diagnosis and procedure codes representing CRC‐resection complications and their treatment, including additional operations. Surgical interventions after emergency admission were defined as emergency surgery; all other surgical treatments were classified as elective. Additionally, characteristics of the hospital where the patient's surgery took place included number of hospital beds, obtained from the Healthcare Cost Report and the Provider of Service files from CMS, and surgeon caseload, based on the number of CRC surgeries performed during the study period. The hospital's surgery volume was calculated using the number of CRC surgeries performed during the study period and categorized into quartiles.
Statistical Analysis
Proportions of comanaged patients were calculated for each covariate. Univariable logistic regression analyses were performed to assess the association between comanagement use and each covariate separately. All analyses were adjusted for nesting of CRC patients within hospitals, using a 2‐level model with a random intercept. Next, we fitted a multivariable model that included covariates associated with comanagement in univariable analysis based on the likelihood ratio test (P < 0.05). Inclusion of covariates in the final multivariable model was based on statistically significant associations with comanagement. Adjusted odds ratios (ORs) were calculated with 95% confidence intervals. Variability across hospitals was calculated using the intraclass coefficient (ICC) for logistic regression.[21] The ICC ranges from 0.0 (no variability across hospitals) to 1.0 (extreme variability across hospitals). In addition, we calculated adjusted values for comanagement to describe the hospital variability. These adjusted values were computed based on the multivariable model by averaging the patient‐level probabilities for all patients who resided in that hospital. We conducted a series of analyses to challenge the robustness of our results. To investigate the potential effect of a different definition of comanagement, we defined comanagement as both (1) having a relevant physician submit a claim for evaluation and management services on 50% or more of the days of the patient's hospitalization, and (2) having a relevant hospitalist or generalist physician submit a claim for evaluation and management services on 100% of the days of hospitalization. All analyses were performed using Stata (version 12.0; StataCorp, College Station, TX).
RESULTS
There were 47,828 patients aged 66 years or older who were diagnosed with a first primary CRC between 2000 and 2005, had both Medicare parts A and B, and were not members of a Health Maintenance Organization during the study period. We excluded patients for whom we were unable to calculate complications (n = 2649), surgery or hospital volume (n = 6415), or who had missing data (n = 238). Finally, we excluded CRC patients with in situ, stage IV, or missing stage information, resulting in 37,065 patients in the study population. Patients in the study population were typically aged 75 to 84 years, were female, had 1 or more comorbid condition, lived in areas with the population poverty rate <10%, were diagnosed with AJCC stage II, had elective surgery, and were treated with partial colectomy (Table 1). During 2000 to 2005, 10,230 (27.6%) of 37,065 patients were comanaged during hospitalization for CRC surgery. In a model with no covariates, variability of comanagement across hospitals was significant (ICC = 0.382). All patient and hospital characteristics except for sex and race/ethnicity were significantly associated with comanagement use, when adjusted for clustering within hospitals. The most common characteristics associated with comanagement were emergency surgery (40.4%), complications (39.7%), and having 2 or more comorbid conditions (37.1%). Comanagement was less common among those with no comorbidity (21.0%), unknown tumor grade (21.9%), and other surgery (18.6%). Furthermore, comanagement increased from 24.8% in 2000 to 30.1% in 2005 (P for trend < 0.001; Table 1).
| Covariates | Total, N = 37,065 | Comanaged, n (%), n = 10,230 (27.6%) |
|---|---|---|
| ||
| Sociodemographics | ||
| Age, y | ||
| 6674 | 13,197 | 3,014 (22.8) |
| 7584 | 6,958 | 4,736 (27.9) |
| 85+ | 6,910 | 2,480 (35.9) |
| Sex | ||
| Male | 15,744 | 4,345 (27.6) |
| Female | 21,321 | 5,885 (27.6) |
| Racea | ||
| White | 31,958 | 8,579 (26.8) |
| African American | 2,641 | 745 (28.2) |
| Other | 2,466 | 906 (36.7) |
| Comorbiditya | ||
| 0 | 15,905 | 3,342 (21.0) |
| 1 | 10,860 | 3,068 (28.3) |
| 2+ | 10,300 | 3,820 (37.1) |
| Medicaida | ||
| No | 31,099 | 8,000 (25.7) |
| Yes | 5,966 | 2,230 (37.4) |
| Year of diagnosisa | ||
| 2000 | 6,041 | 1,497 (24.8) |
| 2001 | 6,193 | 1,624 (26.2) |
| 2002 | 6,289 | 1,692 (26.9) |
| 2003 | 6,489 | 1,829 (28.2) |
| 2004 | 6,219 | 1,832 (29.5) |
| 2005 | 5,834 | 1,756 (30.1) |
| Neighborhood characteristic | ||
| Poverty ratea | ||
| <10% | 21,772 | 5,698(26.2) |
| 10%19% | 9,458 | 2,722(28.8) |
| 20% | 5,835 | 1,810(31.0) |
| Tumor characteristics | ||
| AJCC stagea | ||
| I | 9,996 | 2,402 (24.0) |
| II | 14,662 | 4,287 (29.2) |
| III | 12,407 | 3,541 (28.5) |
| Tumor grade/differentiationa | ||
| Well | 3,278 | 799 (24.4) |
| Moderate | 25,129 | 6,905 (27.5) |
| Poor | 6,898 | 2,107 (30.6) |
| Undifferentiated | 350 | 110 (31.4) |
| Unknown | 1,410 | 309 (21.9) |
| Tumor locationa | ||
| Rectum | 6,977 | 1,616 (23.2) |
| Proximal colon | 14,811 | 4,252 (28.7) |
| Transverse colon | 5,650 | 1,679 (27.9) |
| Distal colon | 9,627 | 2,683 (23.2) |
| Tumor histologya | ||
| Mucinous adenocarcinoma | 32,109 | 8,766 (27.3) |
| Other adenocarcinoma | 4,761 | 1,407 (29.6) |
| Nonadenocarcinoma | 195 | 57 (29.2) |
| Treatment characteristics | ||
| Mode of presentationa | ||
| Elective | 28,673 | 6,836 (23.8) |
| Emergency | 8,392 | 3,394 (40.4) |
| Type of surgerya | ||
| Total (procto)colectomy | 1,475 | 372 (25.2) |
| Subtotal (hemi)colectomy | 18,840 | 5,367 (28.5) |
| Partial colectomyb | 16,017 | 4,298 (26.8) |
| Colectomy NOS | 647 | 177 (27.4) |
| Other surgery | 86 | 16 (18.6) |
| Length of stay, daysa, c | 12.8 (8.3) | |
| Complications during hospitalization | ||
| None | 28,580 | 6,863 (24.0) |
| Yes | 8,485 | 3,367 (39.7) |
| Hospital characteristics | ||
| Hospital volume (no. of beds)a | ||
| 1199 | 9,326 | 2,382 (25.5) |
| 200349 | 10,446 | 3,153 (30.2) |
| 350499 | 8,963 | 2,590 (28.9) |
| 500+ | 8,330 | 2,105 (25.3) |
| Hospital surgery volumea | ||
| 120 | 8,429 | 2,445 (29.0) |
| 2138 | 8,294 | 2,389 (28.8) |
| 3965 | 8,115 | 2,257 (27.8) |
| 66+ | 8,453 | 2,013 (23.8) |
| Unknown | 3,774 | 1,126 (29.8) |
Table 2 shows the adjusted ORs of the covariates associated with comanagement. This model includes only variables independently associated with comanagement. Increasing age was associated with increased odds of receiving comanagement, with OR = 1.22 for patients aged between 75 and 84 years, and OR = 1.52 for patients aged 85 years and older. Comorbidity scores of 1 or 2 or more were associated with increased odds of comanagement use following CRC surgery compared to patients without comorbidities (OR = 1.39 and OR = 1.92, respectively). Patients who received Medicaid were more likely to receive comanagement (OR = 1.11) compared with patients without Medicaid insurance. Higher AJCC stage was associated with increased use of comanagement, as was poor tumor differentiation. Patients undergoing surgery for colon versus rectal cancer were more likely to be comanaged during their hospital stay (OR = 1.23). Surgery after emergency admission was associated with an increased use of comanagement (OR = 1.95). The odds of comanagement increased slightly with increasing length of hospital stay (OR = 1.03), but were higher for patients who developed 1 or more complications during hospitalization compared with patients without complications (OR = 1.38). Compared with CRC patients treated in small hospitals (<200 beds), patients treated in hospitals with 200 to 349 beds were more likely to receive comanaged care (OR = 1.51), whereas patients treated in high‐volume hospitals with 500 beds were less likely to receive comanaged care during hospitalization (OR = 0.65). While census‐tract poverty rate was associated with comanagement in univariable analysis, no significant association was observed when adjusting for other covariates in the multivariable model. In a model with all covariates listed (Table 2), variability of comanagement across hospitals was significant (ICC = 0.376), suggesting that extensive variability across hospitals remained. The adjusted value of CRC patients receiving comanaged care varied widely, from 1.9% to 83.2% across hospitals. Our sensitivity analysis showed that odds ratios and confidence intervals were generally unchanged when using different definitions of comanagement.
| Covariates | OR | 95% CI |
|---|---|---|
| ||
| Age, y | ||
| 6674 | 1.00 | |
| 7584 | 1.22 | 1.151.30 |
| 85+ | 1.52 | 1.421.64 |
| Comorbidity | ||
| 0 | 1.00 | |
| 1 | 1.39 | 1.301.48 |
| 2+ | 1.92 | 1.802.05 |
| Medicaid | ||
| No | 1.00 | |
| Yes | 1.11 | 1.031.20 |
| Year of diagnosis, per year | 1.07 | 1.061.09 |
| AJCC stage | ||
| I | 1.00 | |
| II | 1.11 | 1.041.19 |
| III | 1.10 | 1.021.18 |
| Tumor grade/differentiation | ||
| Well | 1.00 | |
| Moderate | 1.08 | 0.981.19 |
| Poor | 1.17 | 1.041.31 |
| Undifferentiated | 1.14 | 0.851.52 |
| Unknown | 0.89 | 0.751.06 |
| Tumor location | ||
| Rectal | 1.00 | |
| Colon | 1.23 | 1.151.32 |
| Mode of presentation | ||
| Elective | 1.00 | |
| Emergency | 1.95 | 1.842.08 |
| Length of stay, per day | 1.03 | 1.021.03 |
| Complications during stay | ||
| No | 1.00 | |
| Yes | 1.38 | 1.291.48 |
| Hospital volume (no. of beds) | ||
| 1199 | 1.00 | |
| 200349 | 1.51 | 1.221.86 |
| 350499 | 1.26 | 0.981.62 |
| 500+ | 0.65 | 0.490.86 |
DISCUSSION
In all, 27.6% of CRC patients were comanaged during hospitalization, but large disparities existed across patient, hospital, and geographic characteristics. Our finding that more complex patients are more likely to receive comanaged care (eg, increasing age and comorbidity, higher tumor stage and grade, emergency presentation, and complications) are in line with other studies.[5] Importantly, there was a wide range in hospital use of comanagement; the variability across hospitals accounted for 37.6% of the total variability in comanagement use. In some hospitals, almost none of the patients received comanaged care, whereas in other hospitals 83.2% of patients received such care. One reason for the large variability across hospitals may be the lack of evidence about the effectiveness of comanagement. Although comanaged care may benefit orthopedic patients,[7, 8, 9, 10, 11] to our knowledge, no studies have shown benefit to CRC patients. Typically, procedures for which there is more ambiguity about its effectiveness show greater variability across hospitals and geographic areas.[22] Similar to a previous study,[5] we found that patients treated in midsize hospitals were more likely to receive comanagement, and patients treated at high‐volume hospitals were less likely to receive comanagement compared to smaller hospitals. However, because the variability was similar between the model without any variables and the full multivariable model, other variables not available in SEERMedicare data likely played a role in explaining this large interhospital variability. Quality of cancer care may be improved by reducing variation in underuse of effective and necessary care, variation that indicates misuse of preference‐sensitive care (ie, care that offers equivalent options to be chosen by the patient), and variation that indicates overuse of supply‐sensitive care (ie, care influenced by medical capacity).[23] Examining and reducing variability in medical care has been an important policy consideration for almost 30 years.[24, 25] Future studies should examine additional reasons for variability in comanagement across hospitals, including variables at the level of the patient, provider, and hospital. Cost‐effective interventions should subsequently target modifiable factors to reduce use of unnecessary care among patients unlikely to benefit from comanagement.
Our study benefits from using a population‐based SEERMedicare cohort of older CRC patients, representing the diversity of geographic areas and hospitals across the United States. Furthermore, we were able to include a variety of covariates available in the SEERMedicare data, including patient, hospital, and area characteristics. Whereas most studies examining the use or effectiveness of comanagement include single institutions or a variety of surgical patients,[5, 8, 11, 17] we examined the use of and characteristics associated with comanagement throughout the United States for a specific patient population.
We recognize several limitations in this study. Our study specifically assessed comanagement among hospitalized CRC patients aged 65 years and older without managed care insurance. Generalizabilty of our findings to other surgical patients, to younger CRC patients, and those with managed care insurance may therefore be limited. With regard to the definition of comanagement, we used a cutoff point of submitting a claim for management and evaluation on 70% or more of the days of hospitalization for CRC. This cutoff is somewhat arbitrary, but different cutoffs did not influence the results. However, in a prior study, changes in the cutoff used in this definition only affected the proportion of comanaged patients and did not change the observation of increasing trends in the use of comanagement.[5] In addition, we examined a CRC population diagnosed between 2000 and 2005. Because an increasing trend in use of comanagement was observed, it is possible that comanagement use has increased further in more recent years. Our findings of lower use of comanaged care in larger hospitals may be related to the increased use of hospitalists as consultants, whose care may not be accurately or completely captured in claims data. We do not report data regarding the use of physician extenders (nurse practitioners and physician assistants). Although their use is increasing in some contexts, in our data, if we counted patients comanaged by physician extenders, we would only add 79 additional CRC patients (0.6%) to our analyses, which is unlikely to influence our findings.
In conclusion, more complex patients are more likely to receive comanaged care following CRC surgery. Extensive variability existed across patients and hospitals likely due to the lack of evidence about the clinical effectiveness of comanagement for patients undergoing CRC surgery. Future studies should examine additional reasons for variability in comanagement across hospitals, including variables at the level of the patient, provider, and hospital.
Acknowledgements
The authors gratefully acknowledge James Struthers for his data management and programming services, provided through the Health Behavior, Communication, and Outreach Core of the Alvin J. Siteman Cancer Center at Barnes‐Jewish Hospital and Washington University School of Medicine. The authors acknowledge the efforts of the Applied Research Program, NCI; the Office of Research, Development and Information, CMS; Information Management Services, Inc.; SEER Program tumor registries in the creation of the SEERMedicare database. The authors thank Dr. S. Hendren at the University of Michigan for the use of the SAS programming codes to identify complications.
Disclosures: This study used the linked SEERMedicare database. The interpretation and reporting of these data are the sole responsibility of the authors. This work was supported by grants from the National Institutes of Health National Cancer Institute (R01 CA137750 and P30 CA091842). Dr. Davidson was supported in part through National Institutes of Health grants HL‐38180, DK‐56260, and Digestive Disease Research Core Center DK‐52574.
- , , . Cancer statistics, 2013. CA Cancer J Clin. 2013;63(1):11–30.
- , , , , , . Comorbidity in older surgical cancer patients: influence on patient care and outcome. Eur J Cancer. 2007;43(15):2179–2193.
- , , , et al. Which comorbid conditions predict complications after surgery for colorectal cancer? World J Surg. 2007;31(1):192–199.
- , , , . Growth in the care of older patients by hospitalists in the United States. N Engl J Med. 2009;360(11):1102–1112.
- , , , , . Comanagement of hospitalized surgical patients by medicine physicians in the United States. Arch Intern Med. 2010;170(4):363–368.
- , . Surgical comanagement: a natural evolution of hospitalist practice. J Hosp Med. 2008;3(5):394–397.
- , , , , , . Outcomes for older patients with hip fractures: the impact of orthopedic and geriatric medicine cocare. J Orthop Trauma. 2006;20(3):172–178; discussion 179–180.
- , , , et al. Effects of a hospitalist model on elderly patients with hip fracture. Arch Intern Med. 2005;165(7):796–801.
- , , , . Hip fractures in geriatric patients. Results of an interdisciplinary hospital care program. Clin Orthop Relat Res. 1992;(274):213–225.
- , , , . Impact of a comanaged Geriatric Fracture Center on short‐term hip fracture outcomes. Arch Intern Med. 2009;169(18):1712–1717.
- , , , et al. Medical and surgical comanagement after elective hip and knee arthroplasty: a randomized, controlled trial. Ann Intern Med. 2004;141(1):28–38.
- , . Effect of hospitalists on length of stay in the Medicare population: variation according to hospital and patient characteristics. J Am Geriatr Soc. 2010;58(9):1649–1657.
- , , , et al. The impact of hospitalists on length of stay and costs: systematic review and meta‐analysis. Am J Manag Care. 2012;18(1):e23–e30.
- , , , et al. Hospital and geographic variability in two colorectal cancer surgery outcomes: complications and mortality after complications. Ann Surg Onc. In press.
- , , , , . Overview of the SEER‐Medicare data: content, research applications, and generalizability to the United States elderly population. Med Care. 2002;40 (8 suppl):IV–3–18.
- , , , , , . Use of SEER‐Medicare data for measuring cancer surgery. Med Care. 2002;40(8 suppl):IV–43–48.
- , , , . Variation in length of stay and outcomes among hospitalized patients attributable to hospitals and hospitalists. J Gen Intern Med. 2013;28(3):370–376.
- , , , . Development of a comorbidity index using physician claims data. J Clin Epidemiol. 2000;53(12):1258–1267.
- , , , , , . Surgical complications are associated with omission of chemotherapy for stage III colorectal cancer. Dis Colon Rectum. 2010;53(12):1587–1593.
- , , , , , . Major postoperative complications and survival for colon cancer elderly patients. BMC Surgery. 2012;12(suppl 1):S20.
- , . Multilevel Analysis. An Introduction to Basic and Advanced Multilevel Modeling. London, UK: Sage Publications; 1999.
- , , , , , . The implications of regional variations in Medicare spending. Part 2: health outcomes and satisfaction with care. Ann Intern Med. 2003;138(4):288–298.
- . Tracking Medicine: A Researcher's Quest to Understand Health Care. Oxford, UK: Oxford University Press; 2010.
- . Understanding geographic variations in health care delivery. N Engl J Med. 1999;340:52–53.
- . Reducing variation in health care: the rhetorical politics of a policy idea. J Health Polit Policy Law. 2013;38(1):5–26.
© 2014 Society of Hospital Medicine
Rounding Practices and AGME Competencies
In 1999, the Accreditation Council for Graduate Medical Education (ACGME) established the requirement for residency programs to assess trainees' competencies in 6 core domains: patient care, medical knowledge, practice‐based learning, systems‐based practice, interpersonal and communication skills, and professionalism.[1] With the rollout of the Next Accreditation System (NAS), and a focus of graduate medical education turning to the assessment of milestones within the ACGME core competencies, it is essential for clinician educators to reflect on how current educational activities meet the needs of our learners and enable compliance with the new recommendations.[1]
On internal medicine services in the inpatient setting, clinician educators routinely supervise and teach trainees during attending rounds. The long‐standing practice of rounding innately offers a forum for making patient care decisions and for sharing medical knowledge.[2] However, the rounding process may also afford clinician educators opportunities to teach material relevant to the other 4 ACGME core competencies.[3] Despite the ubiquitous presence of rounds on internal medicine services, rounding practices vary markedly among and within institutions.[4, 5] Furthermore, there is no consensus with respect to best practices for rounds in general, or more specifically as they pertain to graduate medical education and teaching within the 6 core competencies.
We have conducted a multicenter survey study of internal medicine rounding practices at academic institutions from all US regions. As part of a larger investigation of rounding practices, we surveyed attending physicians regarding the frequency with which they participated in different rounding models (card‐flipping rounds [CFR], hallway rounds [HR], or bedside rounds [BR]), and the perceived capacity of each of these models to promote teaching of material relevant to the 6 ACGME core competencies.
METHODS
Sites and Subjects
We disseminated a survey using internal medicine educational leadership and hospital medicine clinical leadership electronic mailing lists (eg, the Society of General Internal Medicine [SGIM] and the Society of Hospital Medicine [SHM]). These listservs gave us access to leaders in the field at institutions affiliated with residency programs. Our initial survey distribution included attending physicians from 58 institutions. We asked these leaders for their assistance in distributing the survey within their respective institutions to physicians who attend on inpatient medicine teaching services.
Survey Development and Domains
The survey was composed of 24 multiple‐choice questions and 1 open‐ended question, and was adapted with permission from a survey created by Mittal and colleagues.[6] We initially piloted the survey with attending physicians in the Division of Hospital Medicine at the University of California, San Francisco. We defined the following 3 models for attending rounds based on our review of the literature, as well as interviews with inpatient clinician educators and internal medicine residency leadership at 3 different institutions: (1) BR, where the discussion of the patient and care plan occur in the presence of the patient with his or her active participation; (2) HR, where the discussion of the patient and care plan occurs partially outside the patient's room and partially at the patient's bedside in the presence of the patient; and (3) CFR, where the discussion of the patient and care plan occurs entirely outside of the patient's room and the team does not see the patient together. The survey asked respondents for their perceptions about how well each model promotes teaching content relevant to the 6 ACGME core competencies (options: very poorly, poorly, neutral, well, very well).
Survey Process
The survey was administered electronically using SurveyMonkey (SurveyMonkey, Menlo Park, CA). We sent an initial survey request to 58 institutional contacts. These contacts were designated clinical and educational leaders in the SHM and SGIM, and were an invited working group. Those leaders were asked to reach out to physicians within their institutions who attended on teaching services. We left the survey open for accrual for a total period of 80 days. Participants received 2 reminder emails asking for their assistance in distributing the survey. The study received approval by our institutional review board.
Data Analysis
We employed means and standard deviations to classify rounding model preference and prevalence. We used Pearson's [2] test to assess the association among the 3 rounding models and the perceptions of how well they worked for teaching material relevant to the ACGME competencies. We dichotomized measures with well and very well, forming the well category. All analysis was conducted using Stata 11.0 (StateCorp, College Station, TX).
RESULTS
Attending Characteristics
We received 153 completed surveys from attending physicians representing 34 unique institutions. All respondents were internal medicine physicians who attend on inpatient medicine teaching services. Institutions spanned all regions of the United States. The characteristics of the surveyed population are described in Table 1.
| Variable | Category | Percent |
|---|---|---|
| ||
| Age, y | 40 | 62% |
| 4150 | 21% | |
| 5160 | 13% | |
| >60 | 3% | |
| Sex | Female | 46% |
| Male | 54% | |
| Job description | Hospitalist | 61% |
| Outpatient internist | 10% | |
| Mixed internist* | 14% | |
| Specialist | 15% | |
| Experience, y | 2 | 21% |
| 3+ | 79% | |
| Months teaching/year | 3 | 50% |
| 3+ | 50% | |
| Decisions requiring attending input | 30% | 40% |
| >30% | 60% | |
| Team cap | <20 | 47% |
| 20 | 53% | |
| Average daily census | 10 | 51% |
| >10 | 49% | |
| Region | Midwest | 8% |
| Northeast | 19% | |
| South | 28% | |
| West | 44% | |
| Hospital type | University | 82% |
| Community | 8% | |
| Hospital size, beds | <300 | 23% |
| 300500 | 32% | |
| >500 | 55% | |
Rounding Characteristics
HR proved to be the model employed most frequently for both new and established patients (61% and 43%, respectively) (Table 2). The next most frequently utilized rounding models were CFR for established patients (36%) and BR for new patients (22%). Of attending physicians, 53% never used BR for established patients, and 46% never used them at all. When asked about barriers to bedside rounding, respondents cited time constraints, patient psychosocial complexities, and patient privacy as the most significant barriers to performing BR (64%, 39%, and 38%, respectively). Only 6% felt that patient preference was a barrier to bedside rounding.
| New Patients | Old Patients | |
|---|---|---|
| Card‐flipping rounds | 17% (12%22%) | 36% (31%42%) |
| Hallway rounds | 61% (55%68%) | 43% (37%48%) |
| Bedside rounds | 22% (16%27%) | 21% (15%26%) |
Rounding Models and Core Competencies
Most attending physicians surveyed perceived CFR to perform well or very well for teaching medical knowledge (78%), practice‐based learning (59%), and systems‐based practice (53%). Conversely, a minority thought CFR performed well or very well with respect to teaching patient care (21%), professionalism (27%), or interpersonal skills and communication (16%).
The majority of respondents perceived HR to perform well or very well across all ACGME domains, including teaching patient care (91%), medical knowledge (87%), practice‐based learning (74%), systems‐based practice (69%), professionalism (87%), and interpersonal skills and communication (90%).
Most attending physicians surveyed felt BR performed well or very well with respect to teaching patient care (88%), medical knowledge (58%), professionalism (92%), and interpersonal skills and communication (95%). A minority of participants perceived BR to perform well or very well in teaching practice‐based learning (47%) or systems‐based practice (47%).
Compared with CFR, both HR and BR were perceived to be significantly more effective in teaching patient care, professionalism, and interpersonal skills and communication (Figure 1). Respondents rated BR as significantly inferior to both CFR and HR in teaching medical knowledge. In addition, BR was perceived to be inferior to HR with respect to teaching systems‐based practice and practice‐based learning.
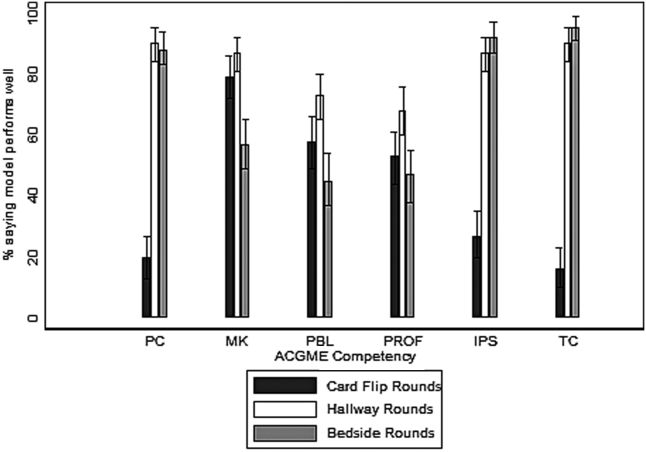
DISCUSSION
In the inpatient setting, attending rounds may offer a primary means for attending physician teaching of trainees. Although all trainees are assessed by their knowledge and skills within the 6 ACGME core competencies, little attention has been paid as to how various rounding models support resident education across these domains.[4] To our knowledge, this is the first cross‐national, multicenter survey study that examines how well the 3 most commonly employed internal medicine rounding practices promote teaching of material relevant to the 6 ACGME core competencies. We found that significant heterogeneity exists in current rounding practices, and different models are perceived to perform variably in their promotion of teaching content within the educational competencies.
In general, with respect to teaching across ACGME domains, CFR were perceived to be less effective compared with HR or BR, and significantly less so in the teaching of patient care, professionalism, and interpersonal skills and communication. Yet, CFR remain widely employed and are used by 17% of attending physicians for new patients and more than 36% for old patients. The reason for their ongoing use was not assessed by our survey; however, this practice does not appear to be driven by educational objectives. The prevalence of CFR may be related to a perception of improved efficiency and a frequent preference among trainees and attending physicians to do this model of rounding. There may be other perceived benefits, including physical comfort of providers or access to the electronic health record, but these qualities were not captured in this study. To our knowledge, there are no prior studies specifically examining CFR as a rounding model.
HR was the most commonly utilized rounding method for the majority of respondents. Attending physicians considered HR particularly effective in teaching patient care, medical knowledge, professionalism, and interpersonal skills and communication. The perceived value of HR may be related to the bimodal nature of the encounter. The discussion of the patient and the care plan outside of the room may include, but is not limited to, formulating the care plan through the formal oral case presentation, focusing on the patient management component of patient care, and sharing medical knowledge without fear of provoking patient anxiety or causing confusion. Subsequently, the time spent in the room may allow for observation and instruction of the physical examination, observation and modeling of professionalism in the patient interaction, and observation and modeling of effective communication with the patient and family members.
We found it interesting that attending physicians also considered HR superior to BR in their capacity to teach practice‐based learning and systems‐based practice. This requires further exploration, as it would seem that increased patient involvement in care plans could offer advantages for the teaching of both of these competencies. Despite the popularity of this rounding structure, there is little prior evidence examining the pros and cons of HR.
Conversely, there is significant literature exploring BR as a rounding model. Prior research has elucidated the multiple benefits of bedside rounding including, but not limited to, teaching history taking, physical examination skills, and clinical ethics; modeling humanism and professionalism; and promoting effective communication.[3, 7, 8, 9, 10, 11] Furthermore, the majority of patients may prefer bedside presentations.[11, 12, 13] Despite their apparent merits, roughly half of attendings surveyed never conduct BR. This may reflect the trend reported in the literature of diminishing bedside teaching, and more specifically, reports that in the United States, less than 5% of time is spent on observing learners' clinical skills and correcting faulty exam techniques.[2, 14] The perception that HR and CFR were superior to BR in teaching medical knowledge suggests that attending physicians value the teaching that occurs away from the patient's bedside. Prior studies suggest that, of the core clinical skills taught on the wards, trainees may find teaching of differential diagnosis to be most challenged by BR, and residents may not appreciate the educational benefits of BR in general.[11, 13] Although time constraints were cited as a significant barrier to BR, recent studies have suggested that BR do not necessarily take more time overall.[15] The notion that patient psychosocial complexities may limit BR has been reflected in the literature,[16, 17, 18, 19, 20] but these situations may also afford unique bedside teaching opportunities.[21] Finally, faculty, and in particular more junior attendings, may be uncomfortable teaching in the presence of the patient.[13] This barrier may be overcome through faculty development efforts.[15]
As internal medicine training transitions to the NAS and a milestone‐based assessment framework,[1] residency programs will need to consider how rounding can be structured to help trainees achieve the required milestones, and to help programs meaningfully assess trainee performance. Our survey indicates that HR may be effective across all of the competencies and the potential for this should be further explored. Yet, HR may allow for a limited ability to observe learners with patients, as there may only be cursory data gathering from the patient, a brief physical exam, and limited communication with patients and/or family members. Furthermore, the patient‐centeredness of HR may be called into question, given restricted emphasis on shared decision making. Finally, as efficiency remains crucial in the wake of duty‐hour reform, HR may also prove to be more time consuming than BR, given that it often requires information shared outside of the patient's room to be repeated in the patient's presence. Ultimately, there may not be a 1 size fits all solution, and institutions should ensure the organization and structure of their rounding models are optimally designed to enable the achievement and assessment of ACGME milestones.
Our study has several limitations. Due to our employment of snowball sampling, we could not calculate a response rate. We also recruited a self‐selected sample of internal medicine attending physicians, raising the possibility of selection bias. However, we captured a wide range of experience and opinion, and do not have reason to believe that any particular viewpoints are over‐ or under‐represented. Further, our study may have been influenced by sampling bias, reaching primarily attending physicians at university‐affiliated medical centers, calling into question the generalizability of our results and making any comparisons between academic and community health centers less meaningful. Nonetheless, we received responses from both large and small medical centers, as well as quaternary care and community‐based hospitals. The reported benefits and barriers were respondents' personal perceptions, rather than measured outcomes. Moreover, we focused primarily on the effectiveness of teaching of the ACGME competencies and did not explore other outcomes that could be impacted by rounding structure (eg, patient satisfaction, trainee satisfaction, length of stay, time of discharge). Our study also did not address the variety of complex factors that influence the location and methods of attending rounds. For example, the various institutions surveyed have a variety of team sizes and compositions, admitting schedules, geographic layouts, and time allotted for attending rounds, all of which can influence choices for rounding practices. Finally, we did not assess resident perceptions, an area of future study that would allow us to corroborate the findings of our survey.
In conclusion, in this cross‐national, multicenter survey study of the 3 most prevalent internal medicine rounding practices, respondents utilized HR most commonly and believed this model was effective in teaching across the 6 ACGME core competencies. Those surveyed identified the benefits and barriers to BR, and a substantial number continue to use CFR despite recognizing its educational limitations. Future studies should explore factors that promote various rounding models and assess the relationship between rounding structure and educational outcomes for trainees.
Disclosure: Nothing to report.
- , , , . The next GME accreditation system—rationale and benefits. N Engl J Med. 2012;366(11):1051–1056.
- , . Teaching the resident in internal medicine. Present practices and suggestions for the future. JAMA. 1986;256(6):725–729.
- , , , . Attending rounds and bedside case presentations: medical student and medicine resident experiences and attitudes. Teach Learn Med. 2009;21(2):105–110.
- , , , et al. Attending rounds in the current era: what is and is not happening. JAMA Intern Med. 2013;173(12):1084–1089.
- , , , . Relationships of the location and content of rounds to specialty, institution, patient‐census, and team size. PLoS One. 2010;5(6):e11246.
- , , , et al. Family‐centered rounds on pediatric wards: a PRIS network survey of US and Canadian hospitalists. Pediatrics. 2010;126(1):37–43.
- . Educational strategies to promote clinical diagnostic reasoning. N Engl J Med. 2006;355(21):2217–2225.
- , , , , . Role modeling humanistic behavior: learning bedside manner from the experts. Acad Med. 2006;81(7):661–667.
- . Teaching approaches that reflect and promote professionalism. Acad Med. 2003;78(7):709–713.
- . Bedside rounds revisited. N Engl J Med. 1997;336(16):1174–1175.
- , . Sounding boards. The case of bedside rounds. N Engl J Med. 1980;303(21):1230–1233.
- , , , , . The effect of bedside case presentations on patients' perceptions of their medical care. N Engl J Med. 1997;336(16):1150–1155.
- , , . Student and patient perspectives on bedside teaching. Med Educ. 1997;31(5):341–346.
- , , , , . An observational study of attending rounds. J Gen Intern Med. 1992;7(6):646–648.
- , , , . The return of bedside rounds: an educational intervention. J Gen Intern Med. 2010;25(8):792–798.
- , , . The attending physician as teacher. N Engl J Med. 1983;308(19):1129–1132.
- , , , , . Bedside case presentations: why patients like them but learners don't. J Gen Intern Med. 1989;4(4):284–287.
- . On bedside teaching. Ann Intern Med. 1997;126(3):217–220.
- , . Teaching at the bedside: a new model. Med Teach. 2003;25(2):127–130.
- . Twelve tips to improve bedside teaching. Med Teach. 2003;25(2):112–115.
- Wiese J, ed. Teaching in the Hospital. Philadelphia, PA: American College of Physicians; 2010.
In 1999, the Accreditation Council for Graduate Medical Education (ACGME) established the requirement for residency programs to assess trainees' competencies in 6 core domains: patient care, medical knowledge, practice‐based learning, systems‐based practice, interpersonal and communication skills, and professionalism.[1] With the rollout of the Next Accreditation System (NAS), and a focus of graduate medical education turning to the assessment of milestones within the ACGME core competencies, it is essential for clinician educators to reflect on how current educational activities meet the needs of our learners and enable compliance with the new recommendations.[1]
On internal medicine services in the inpatient setting, clinician educators routinely supervise and teach trainees during attending rounds. The long‐standing practice of rounding innately offers a forum for making patient care decisions and for sharing medical knowledge.[2] However, the rounding process may also afford clinician educators opportunities to teach material relevant to the other 4 ACGME core competencies.[3] Despite the ubiquitous presence of rounds on internal medicine services, rounding practices vary markedly among and within institutions.[4, 5] Furthermore, there is no consensus with respect to best practices for rounds in general, or more specifically as they pertain to graduate medical education and teaching within the 6 core competencies.
We have conducted a multicenter survey study of internal medicine rounding practices at academic institutions from all US regions. As part of a larger investigation of rounding practices, we surveyed attending physicians regarding the frequency with which they participated in different rounding models (card‐flipping rounds [CFR], hallway rounds [HR], or bedside rounds [BR]), and the perceived capacity of each of these models to promote teaching of material relevant to the 6 ACGME core competencies.
METHODS
Sites and Subjects
We disseminated a survey using internal medicine educational leadership and hospital medicine clinical leadership electronic mailing lists (eg, the Society of General Internal Medicine [SGIM] and the Society of Hospital Medicine [SHM]). These listservs gave us access to leaders in the field at institutions affiliated with residency programs. Our initial survey distribution included attending physicians from 58 institutions. We asked these leaders for their assistance in distributing the survey within their respective institutions to physicians who attend on inpatient medicine teaching services.
Survey Development and Domains
The survey was composed of 24 multiple‐choice questions and 1 open‐ended question, and was adapted with permission from a survey created by Mittal and colleagues.[6] We initially piloted the survey with attending physicians in the Division of Hospital Medicine at the University of California, San Francisco. We defined the following 3 models for attending rounds based on our review of the literature, as well as interviews with inpatient clinician educators and internal medicine residency leadership at 3 different institutions: (1) BR, where the discussion of the patient and care plan occur in the presence of the patient with his or her active participation; (2) HR, where the discussion of the patient and care plan occurs partially outside the patient's room and partially at the patient's bedside in the presence of the patient; and (3) CFR, where the discussion of the patient and care plan occurs entirely outside of the patient's room and the team does not see the patient together. The survey asked respondents for their perceptions about how well each model promotes teaching content relevant to the 6 ACGME core competencies (options: very poorly, poorly, neutral, well, very well).
Survey Process
The survey was administered electronically using SurveyMonkey (SurveyMonkey, Menlo Park, CA). We sent an initial survey request to 58 institutional contacts. These contacts were designated clinical and educational leaders in the SHM and SGIM, and were an invited working group. Those leaders were asked to reach out to physicians within their institutions who attended on teaching services. We left the survey open for accrual for a total period of 80 days. Participants received 2 reminder emails asking for their assistance in distributing the survey. The study received approval by our institutional review board.
Data Analysis
We employed means and standard deviations to classify rounding model preference and prevalence. We used Pearson's [2] test to assess the association among the 3 rounding models and the perceptions of how well they worked for teaching material relevant to the ACGME competencies. We dichotomized measures with well and very well, forming the well category. All analysis was conducted using Stata 11.0 (StateCorp, College Station, TX).
RESULTS
Attending Characteristics
We received 153 completed surveys from attending physicians representing 34 unique institutions. All respondents were internal medicine physicians who attend on inpatient medicine teaching services. Institutions spanned all regions of the United States. The characteristics of the surveyed population are described in Table 1.
| Variable | Category | Percent |
|---|---|---|
| ||
| Age, y | 40 | 62% |
| 4150 | 21% | |
| 5160 | 13% | |
| >60 | 3% | |
| Sex | Female | 46% |
| Male | 54% | |
| Job description | Hospitalist | 61% |
| Outpatient internist | 10% | |
| Mixed internist* | 14% | |
| Specialist | 15% | |
| Experience, y | 2 | 21% |
| 3+ | 79% | |
| Months teaching/year | 3 | 50% |
| 3+ | 50% | |
| Decisions requiring attending input | 30% | 40% |
| >30% | 60% | |
| Team cap | <20 | 47% |
| 20 | 53% | |
| Average daily census | 10 | 51% |
| >10 | 49% | |
| Region | Midwest | 8% |
| Northeast | 19% | |
| South | 28% | |
| West | 44% | |
| Hospital type | University | 82% |
| Community | 8% | |
| Hospital size, beds | <300 | 23% |
| 300500 | 32% | |
| >500 | 55% | |
Rounding Characteristics
HR proved to be the model employed most frequently for both new and established patients (61% and 43%, respectively) (Table 2). The next most frequently utilized rounding models were CFR for established patients (36%) and BR for new patients (22%). Of attending physicians, 53% never used BR for established patients, and 46% never used them at all. When asked about barriers to bedside rounding, respondents cited time constraints, patient psychosocial complexities, and patient privacy as the most significant barriers to performing BR (64%, 39%, and 38%, respectively). Only 6% felt that patient preference was a barrier to bedside rounding.
| New Patients | Old Patients | |
|---|---|---|
| Card‐flipping rounds | 17% (12%22%) | 36% (31%42%) |
| Hallway rounds | 61% (55%68%) | 43% (37%48%) |
| Bedside rounds | 22% (16%27%) | 21% (15%26%) |
Rounding Models and Core Competencies
Most attending physicians surveyed perceived CFR to perform well or very well for teaching medical knowledge (78%), practice‐based learning (59%), and systems‐based practice (53%). Conversely, a minority thought CFR performed well or very well with respect to teaching patient care (21%), professionalism (27%), or interpersonal skills and communication (16%).
The majority of respondents perceived HR to perform well or very well across all ACGME domains, including teaching patient care (91%), medical knowledge (87%), practice‐based learning (74%), systems‐based practice (69%), professionalism (87%), and interpersonal skills and communication (90%).
Most attending physicians surveyed felt BR performed well or very well with respect to teaching patient care (88%), medical knowledge (58%), professionalism (92%), and interpersonal skills and communication (95%). A minority of participants perceived BR to perform well or very well in teaching practice‐based learning (47%) or systems‐based practice (47%).
Compared with CFR, both HR and BR were perceived to be significantly more effective in teaching patient care, professionalism, and interpersonal skills and communication (Figure 1). Respondents rated BR as significantly inferior to both CFR and HR in teaching medical knowledge. In addition, BR was perceived to be inferior to HR with respect to teaching systems‐based practice and practice‐based learning.
DISCUSSION
In the inpatient setting, attending rounds may offer a primary means for attending physician teaching of trainees. Although all trainees are assessed by their knowledge and skills within the 6 ACGME core competencies, little attention has been paid as to how various rounding models support resident education across these domains.[4] To our knowledge, this is the first cross‐national, multicenter survey study that examines how well the 3 most commonly employed internal medicine rounding practices promote teaching of material relevant to the 6 ACGME core competencies. We found that significant heterogeneity exists in current rounding practices, and different models are perceived to perform variably in their promotion of teaching content within the educational competencies.
In general, with respect to teaching across ACGME domains, CFR were perceived to be less effective compared with HR or BR, and significantly less so in the teaching of patient care, professionalism, and interpersonal skills and communication. Yet, CFR remain widely employed and are used by 17% of attending physicians for new patients and more than 36% for old patients. The reason for their ongoing use was not assessed by our survey; however, this practice does not appear to be driven by educational objectives. The prevalence of CFR may be related to a perception of improved efficiency and a frequent preference among trainees and attending physicians to do this model of rounding. There may be other perceived benefits, including physical comfort of providers or access to the electronic health record, but these qualities were not captured in this study. To our knowledge, there are no prior studies specifically examining CFR as a rounding model.
HR was the most commonly utilized rounding method for the majority of respondents. Attending physicians considered HR particularly effective in teaching patient care, medical knowledge, professionalism, and interpersonal skills and communication. The perceived value of HR may be related to the bimodal nature of the encounter. The discussion of the patient and the care plan outside of the room may include, but is not limited to, formulating the care plan through the formal oral case presentation, focusing on the patient management component of patient care, and sharing medical knowledge without fear of provoking patient anxiety or causing confusion. Subsequently, the time spent in the room may allow for observation and instruction of the physical examination, observation and modeling of professionalism in the patient interaction, and observation and modeling of effective communication with the patient and family members.
We found it interesting that attending physicians also considered HR superior to BR in their capacity to teach practice‐based learning and systems‐based practice. This requires further exploration, as it would seem that increased patient involvement in care plans could offer advantages for the teaching of both of these competencies. Despite the popularity of this rounding structure, there is little prior evidence examining the pros and cons of HR.
Conversely, there is significant literature exploring BR as a rounding model. Prior research has elucidated the multiple benefits of bedside rounding including, but not limited to, teaching history taking, physical examination skills, and clinical ethics; modeling humanism and professionalism; and promoting effective communication.[3, 7, 8, 9, 10, 11] Furthermore, the majority of patients may prefer bedside presentations.[11, 12, 13] Despite their apparent merits, roughly half of attendings surveyed never conduct BR. This may reflect the trend reported in the literature of diminishing bedside teaching, and more specifically, reports that in the United States, less than 5% of time is spent on observing learners' clinical skills and correcting faulty exam techniques.[2, 14] The perception that HR and CFR were superior to BR in teaching medical knowledge suggests that attending physicians value the teaching that occurs away from the patient's bedside. Prior studies suggest that, of the core clinical skills taught on the wards, trainees may find teaching of differential diagnosis to be most challenged by BR, and residents may not appreciate the educational benefits of BR in general.[11, 13] Although time constraints were cited as a significant barrier to BR, recent studies have suggested that BR do not necessarily take more time overall.[15] The notion that patient psychosocial complexities may limit BR has been reflected in the literature,[16, 17, 18, 19, 20] but these situations may also afford unique bedside teaching opportunities.[21] Finally, faculty, and in particular more junior attendings, may be uncomfortable teaching in the presence of the patient.[13] This barrier may be overcome through faculty development efforts.[15]
As internal medicine training transitions to the NAS and a milestone‐based assessment framework,[1] residency programs will need to consider how rounding can be structured to help trainees achieve the required milestones, and to help programs meaningfully assess trainee performance. Our survey indicates that HR may be effective across all of the competencies and the potential for this should be further explored. Yet, HR may allow for a limited ability to observe learners with patients, as there may only be cursory data gathering from the patient, a brief physical exam, and limited communication with patients and/or family members. Furthermore, the patient‐centeredness of HR may be called into question, given restricted emphasis on shared decision making. Finally, as efficiency remains crucial in the wake of duty‐hour reform, HR may also prove to be more time consuming than BR, given that it often requires information shared outside of the patient's room to be repeated in the patient's presence. Ultimately, there may not be a 1 size fits all solution, and institutions should ensure the organization and structure of their rounding models are optimally designed to enable the achievement and assessment of ACGME milestones.
Our study has several limitations. Due to our employment of snowball sampling, we could not calculate a response rate. We also recruited a self‐selected sample of internal medicine attending physicians, raising the possibility of selection bias. However, we captured a wide range of experience and opinion, and do not have reason to believe that any particular viewpoints are over‐ or under‐represented. Further, our study may have been influenced by sampling bias, reaching primarily attending physicians at university‐affiliated medical centers, calling into question the generalizability of our results and making any comparisons between academic and community health centers less meaningful. Nonetheless, we received responses from both large and small medical centers, as well as quaternary care and community‐based hospitals. The reported benefits and barriers were respondents' personal perceptions, rather than measured outcomes. Moreover, we focused primarily on the effectiveness of teaching of the ACGME competencies and did not explore other outcomes that could be impacted by rounding structure (eg, patient satisfaction, trainee satisfaction, length of stay, time of discharge). Our study also did not address the variety of complex factors that influence the location and methods of attending rounds. For example, the various institutions surveyed have a variety of team sizes and compositions, admitting schedules, geographic layouts, and time allotted for attending rounds, all of which can influence choices for rounding practices. Finally, we did not assess resident perceptions, an area of future study that would allow us to corroborate the findings of our survey.
In conclusion, in this cross‐national, multicenter survey study of the 3 most prevalent internal medicine rounding practices, respondents utilized HR most commonly and believed this model was effective in teaching across the 6 ACGME core competencies. Those surveyed identified the benefits and barriers to BR, and a substantial number continue to use CFR despite recognizing its educational limitations. Future studies should explore factors that promote various rounding models and assess the relationship between rounding structure and educational outcomes for trainees.
Disclosure: Nothing to report.
- , , , . The next GME accreditation system—rationale and benefits. N Engl J Med. 2012;366(11):1051–1056.
- , . Teaching the resident in internal medicine. Present practices and suggestions for the future. JAMA. 1986;256(6):725–729.
- , , , . Attending rounds and bedside case presentations: medical student and medicine resident experiences and attitudes. Teach Learn Med. 2009;21(2):105–110.
- , , , et al. Attending rounds in the current era: what is and is not happening. JAMA Intern Med. 2013;173(12):1084–1089.
- , , , . Relationships of the location and content of rounds to specialty, institution, patient‐census, and team size. PLoS One. 2010;5(6):e11246.
- , , , et al. Family‐centered rounds on pediatric wards: a PRIS network survey of US and Canadian hospitalists. Pediatrics. 2010;126(1):37–43.
- . Educational strategies to promote clinical diagnostic reasoning. N Engl J Med. 2006;355(21):2217–2225.
- , , , , . Role modeling humanistic behavior: learning bedside manner from the experts. Acad Med. 2006;81(7):661–667.
- . Teaching approaches that reflect and promote professionalism. Acad Med. 2003;78(7):709–713.
- . Bedside rounds revisited. N Engl J Med. 1997;336(16):1174–1175.
- , . Sounding boards. The case of bedside rounds. N Engl J Med. 1980;303(21):1230–1233.
- , , , , . The effect of bedside case presentations on patients' perceptions of their medical care. N Engl J Med. 1997;336(16):1150–1155.
- , , . Student and patient perspectives on bedside teaching. Med Educ. 1997;31(5):341–346.
- , , , , . An observational study of attending rounds. J Gen Intern Med. 1992;7(6):646–648.
- , , , . The return of bedside rounds: an educational intervention. J Gen Intern Med. 2010;25(8):792–798.
- , , . The attending physician as teacher. N Engl J Med. 1983;308(19):1129–1132.
- , , , , . Bedside case presentations: why patients like them but learners don't. J Gen Intern Med. 1989;4(4):284–287.
- . On bedside teaching. Ann Intern Med. 1997;126(3):217–220.
- , . Teaching at the bedside: a new model. Med Teach. 2003;25(2):127–130.
- . Twelve tips to improve bedside teaching. Med Teach. 2003;25(2):112–115.
- Wiese J, ed. Teaching in the Hospital. Philadelphia, PA: American College of Physicians; 2010.
© 2014 Society of Hospital Medicine

Specialties Performing Paracentesis
Cirrhosis affects up to 3% of the population and is 1 of the 10 most common causes of death in the United States.[1, 2, 3, 4] Paracentesis procedures are frequently performed in patients with liver disease and ascites for diagnostic and/or therapeutic purposes. These procedures can be performed safely by trained clinicians at the bedside or referred to interventional radiology (IR).[2, 3, 4]
National practice patterns show that paracentesis procedures are increasingly referred to IR rather than performed at the bedside by internal medicine or gastroenterology clinicians.[5, 6, 7] In fact, a recent study of Medicare beneficiaries showed that inpatient and outpatient paracentesis procedures performed by radiologists increased by 964% from 1993 to 2008.[7] Reasons for the decline in bedside procedures include the increased availability of IR, lack of sufficient reimbursement, and the time required to perform paracentesis procedures.[5, 6, 7, 8] Surveys of internal medicine and family medicine residents and gastroenterology fellows show trainees often lack the confidence and experience needed to perform the procedure safely.[9, 10, 11] Additionally, many clinicians do not have expertise with ultrasound use and may not have access to necessary equipment.
Inconsistent certification requirements may also impact the competence and experience of physicians to perform paracentesis procedures. Internal medicine residents are no longer required by the American Board of Internal Medicine (ABIM) to demonstrate competency in procedures such as paracentesis for certification.[12] However, the Accreditation Council for Graduate Medical Education (ACGME) requirements state that internal medicine programs must offer residents the opportunity to demonstrate competence in the performance of procedures such as paracentesis, thoracentesis, and central venous catheter insertion.[13] The American Board of Family Medicine (ABFM) does not outline specific procedural competence for initial certification.[14] The ACGME states that family medicine residents must receive training to perform those clinical procedures required for their future practices but allows each program to determine which procedures to require.[15] Due to this uncertainty, practicing hospitalists are likely to have variable training and competence in bedside procedures such as paracentesis.
We previously showed that internal medicine residents rotating on the hepatology service of an academic medical center performed 59% of paracentesis procedures at the bedside.[16] These findings are in contrast to national data showing that 74% of paracentesis procedures performed on Medicare beneficiaries were performed by radiologists.[7] Practice patterns at university hospitals may not be reflected in this data because the study was limited to Medicare beneficiaries and included ambulatory patients.[7] In addition to uncertainty about who is performing this procedure in inpatient settings, little is known about the effect of specialty on postparacentesis clinical outcomes.[16, 17]
The current study had 3 aims: (1) evaluate which clinical specialties perform paracentesis procedures at university hospitals; (2) model patient characteristics associated with procedures performed at the bedside versus those referred to IR; and (3) among patients with a similar likelihood of IR referral, evaluate length of stay (LOS) and hospital costs of patients undergoing procedures performed by different specialties.
METHODS
We performed an observational administrative database review of patients who underwent paracentesis procedures in hospitals participating in the University HealthSystem Consortium (UHC) Clinical Database from January 2010 through December 2012. UHC is an alliance of 120 nonprofit academic medical centers and their 290 affiliated hospitals. UHC maintains databases containing clinical, operational, financial, and patient safety data from affiliated hospitals. Using the UHC database, we described the characteristics of all patients who underwent paracentesis procedures by clinical specialty performing the procedure. We then modeled the effects of patient characteristics on decision‐making about IR referral. Finally, among patients with a homogeneous predicted probability of IR referral, we compared LOS and direct costs by specialty performing the procedure. The Northwestern University institutional review board approved this study.
Procedure
We queried the UHC database for all patients over the age of 18 years who underwent paracentesis procedures (International Classification of Disease Revision 9 [ICD‐9] procedure code 54.91) and had at least 1 diagnosis code of liver disease (571.x). We excluded patients admitted to obstetrics. The query included patient and clinical characteristics such as admission, discharge, and procedure date; age, gender, procedure provider specialty, and intensive care unit (ICU) stay. We also obtained all ICD‐9 codes associated with the admission including obesity, severe liver disease, coagulation disorders, blood loss anemia, hyponatremia, hypotension, thrombocytopenia, liver transplant before or during the admission, awaiting liver transplant, and complications of liver transplant. We used ICD‐9 codes to calculate patients' Charlson score[18, 19] to assess severity of illness on admission.
LOS and total direct hospital costs were compared among patients with a paracentesis performed by a single clinical group and among patients with a similar predicted probability of IR referral. UHC generates direct cost estimates by applying Medicare Cost Report ratios of cost to charges with the labor cost further adjusted by the respective area wage index. Hospital costs were not available from 8.3% of UHC hospitals. We therefore based cost estimates on nonmissing data.
Paracentesis provider specialties were divided into 6 general categories: (1) IR (interventional and diagnostic radiology); (2) medicine (family medicine, general medicine, and hospital medicine); (3) subspecialty medicine (infectious disease, cardiology, nephrology, hematology/oncology, endocrinology, pulmonary, and geriatrics); (4) gastroenterology/hepatology (gastroenterology, hepatology, and transplant medicine); (5) general surgery (general surgery and transplant surgery); and (6) all other (included unclassified specialties). We present patient characteristics categorized by these specialty groups and for admissions in which multiple specialties performed procedures.
Study Design
To analyze an individual patient's likelihood of IR referral, we needed to restrict our sample to discharges where only 1 clinical specialty performed a paracentesis. Therefore, we excluded hybrid discharges with procedures performed by more than 1 specialty in a single admission as well as discharges with procedures performed by all other specialties. To compare LOS and direct cost outcomes, and to minimize selection bias among exclusively IR‐treated patients, we excluded hospitals without procedures done by both IR and medicine.
We modeled referral to IR as a function of patients' demographic and clinical variables, which we believed would affect the probability of referral. We then examined the IR referral model predicted probabilities (propensity score).[20] Finally, we examined mean differences in LOS and direct costs among discharges with a single clinical specialty group, while using the predicted probability of referral as a filter to compare these outcomes by specialty. We further tested specialty differences in LOS and direct costs controlling for demographic and clinical variables.
Statistical Analysis
To test the significance of differences between demographic and clinical characteristics of patients across specialties, we used 2 tests for categorical variables and analysis of variance or the Kruskal‐Wallis rank test for continuous variables. Random effects logistic regression, which adjusts standard errors for clustering by hospital, was used to model the likelihood of referral to IR. Independent variables included patient age, gender, obesity, coagulation disorders, blood loss anemia, hyponatremia, hypotension, thrombocytopenia, liver transplant before hospitalization, liver transplant during hospitalization, awaiting transplant, complications of liver transplant, ICU stay, Charlson score, and number of paracentesis procedures performed during the admission. Predicted probabilities derived from this IR referral model were used to investigate selection bias in our subsequent analyses of LOS and costs.[20]
We used random effects multiple linear regression to test the association of procedure specialty with hospital LOS and total direct costs, controlling for the same independent variables listed above. Analyses were conducted using both actual LOS in days and Medicare costs. We also performed a log transformation of LOS and costs to account for rightward skew. We only present actual LOS and cost results because results were virtually identical. We used SAS version 9 (SAS Institute Inc., Cary, NC) to extract data from the UHC Clinical Database. We performed all statistical analyses using Stata version 12 (StataCorp LP, College Station, TX).
RESULTS
Procedure and Discharge Level Results
There were 97,577 paracentesis procedures performed during 70,862 hospital admissions in 204 UHC hospitals during the study period. Table 1 shows specific specialty groups for each procedure. The all other category consisted of 17,558 subspecialty groups including 9,434 with specialty unknown. Twenty‐nine percent of procedures were performed in IR versus 27% by medicine, 11% by gastroenterology/hepatology, and 11% by subspecialty medicine.
| Specialty Group | No. | % |
|---|---|---|
| Interventional radiology | 28,414 | 29.1 |
| Medicine | 26,031 | 26.7 |
| Family medicine | 1,026 | 1.1 |
| General medicine | 21,787 | 22.3 |
| Hospitalist | 3,218 | 3.3 |
| Subspecialty medicine | 10,558 | 10.8 |
| Infectious disease | 848 | 0.9 |
| Nephrology | 615 | 0.6 |
| Cardiology | 991 | 1.0 |
| Hematology oncology | 795 | 0.8 |
| Endocrinology | 359 | 0.4 |
| Pulmonology | 6,605 | 6.8 |
| Geriatrics | 345 | 0.4 |
| Gastroenterology/hepatology | 11,143 | 11.4 |
| Transplant medicine | 99 | 0.1 |
| Hepatology | 874 | 0.9 |
| Gastroenterology | 10,170 | 10.4 |
| General surgery | 3,873 | 4.0 |
| Transplant surgery | 2,146 | 2.2 |
| General surgery | 1,727 | 1.8 |
| All other | 17,558 | 18.0 |
| Specialty unknown | 9,434 | 9.7 |
Table 2 presents patient characteristics for 70,862 hospital discharges with paracentesis procedures grouped by whether single or multiple specialties performed procedures. Patient characteristics were significantly different across specialty groups. Medicine, subspecialty medicine, and gastroenterology/hepatology patients were younger, more likely to be male, and more likely to have severe liver disease, coagulation disorders, hypotension, and hyponatremia than IR patients.
| All Discharges, N=70,862 | Interventional Radiology, n=9,348 | Medicine, n=13,789 | Subspecialty Medicine, n=5,085 | Gastroenterology/Hepatology, n=6,664 | General Surgery, n=1,891 | All Other, n=7,912 | Discharges With Multiple Specialties, n=26,173 | |
|---|---|---|---|---|---|---|---|---|
| ||||||||
| Age group, y (%) | ||||||||
| 1849 | 25.4 | 22.5 | 27.6 | 24.9 | 23.5 | 20.8 | 25.5 | 26.1 |
| 5059 | 39.8 | 39.8 | 40.9 | 39.4 | 41.5 | 40.3 | 40.0 | 38.7 |
| 6069 | 24.7 | 24.9 | 21.6 | 24.7 | 26.5 | 30.0 | 23.6 | 25.8 |
| 70+ | 10.1 | 12.9 | 9.9 | 11.1 | 8.4 | 8.9 | 11.0 | 9.4 |
| Male (%) | 65.5 | 64.2 | 67.6 | 67.5 | 65.7 | 66.6 | 65.7 | 64.2 |
| Severe liver disease (%)a | 73.7 | 65.3 | 67.8 | 71.0 | 75.3 | 66.6 | 67.6 | 82.1 |
| Obesity (BMI 40+) (%) | 6.3 | 6.1 | 5.3 | 5.7 | 5.1 | 5.8 | 5.2 | 7.6 |
| Any intensive care unit stay (%) | 31.0 | 10.9 | 16.8 | 50.5 | 16.9 | 36.7 | 22.3 | 47.8 |
| Coagulation disorders (%) | 24.3 | 14.8 | 20.2 | 29.9 | 16.1 | 19.0 | 17.8 | 33.1 |
| Blood loss anemia (%) | 3.4 | 1.3 | 2.8 | 2.7 | 2.7 | 1.9 | 2.1 | 5.2 |
| Hyponatremia (%) | 29.9 | 27.1 | 29.2 | 28.9 | 28.0 | 26.6 | 27.3 | 33.1 |
| Hypotension (%) | 9.8 | 7.0 | 8.0 | 11.0 | 7.7 | 10.5 | 8.1 | 12.4 |
| Thrombocytopenia (%) | 29.6 | 24.6 | 28.3 | 32.5 | 22.1 | 21.5 | 24.0 | 35.8 |
| Complication of transplant (%) | 3.3 | 2.1 | 1.1 | 2.4 | 4.0 | 10.3 | 2.7 | 4.7 |
| Awaiting liver transplant (%) | 7.6 | 6.4 | 4.0 | 5.4 | 12.8 | 16.0 | 7.8 | 8.2 |
| Prior liver transplant (%) | 0.5 | 0.8 | 0.3 | 0.3 | 0.7 | 0.7 | 0.4 | 0.6 |
| Liver transplant procedure (%) | 2.7 | 0.0 | 0.0 | 0.3 | 0.4 | 15.6 | 1.6 | 5.6 |
| Mean Charlson score (SD) | 4.51 (2.17) | 4.28 (2.26) | 4.16 (2.17) | 4.72 (2.30) | 4.30 (1.98) | 4.26 (2.22) | 4.36 (2.30) | 4.84 (2.07) |
| Mean paracentesis procedures per discharge (SD) | 1.38 (0.88) | 1.21 (0.56) | 1.26 (0.66) | 1.30 (0.76) | 1.31 (0.70) | 1.28 (0.78) | 1.22 (0.61) | 1.58 (1.13) |
IR Referral Model
We first excluded 6030/70,862 discharges (8.5%) from 59 hospitals without both IR and medicine procedures. We then further excluded 24,986/70,862 (35.3%) discharges with procedures performed by multiple specialties during the same admission. Finally, we excluded 5555/70,862 (7.8%) of discharges with procedure specialty coded as all other. Therefore, 34,291 (48.4%) discharges (43,337/97,577; 44.4% procedures) from 145 UHC hospitals with paracentesis procedures performed by a single clinical specialty group remained for the IR referral analysis sample. Among admissions with multiple specialty paracentesis performed within the same admission, 3128/26,606 admissions with any IR procedure (11.8%) had a different specialty ascribed to the first, second, or third paracentesis with a subsequent IR procedure.
Model results (Table 3) indicate that patients who were obese (odds ratio [OR]: 1.25; 95% confidence interval [CI]: 1.10‐1.43) or had a liver transplant on a prior admission (OR: 2.03; 95% CI: 1.40‐2.95) were more likely to be referred to IR. However, male patients (OR: 0.89; 95% CI: 0.83‐0.95), or patients who required an ICU stay (OR: 0.39; 95% CI: 0.36‐0.43) were less likely to have IR procedures. Other patient factors reducing the likelihood of IR referral included characteristics associated with higher severity of illness (coagulation disorders, hyponatremia, hypotension, and thrombocytopenia).
| Odds Ratio | 95% CI | ||
|---|---|---|---|
| Lower | Upper | ||
| |||
| Age group, y | |||
| 1849 | Reference | ||
| 5059 | 1.05 | 0.97 | 1.14 |
| 6069 | 1.12 | 1.02 | 1.22 |
| 70+ | 1.11 | 0.99 | 1.24 |
| Male | 0.89 | 0.83 | 0.95 |
| Obesity, BMI 40+ | 1.25 | 1.10 | 1.43 |
| ICU care | 0.39 | 0.36 | 0.43 |
| Coagulation disorders | 0.68 | 0.63 | 0.75 |
| Blood loss anemia | 0.52 | 0.41 | 0.66 |
| Hyponatremia | 0.85 | 0.80 | 0.92 |
| Hypotension | 0.83 | 0.74 | 0.93 |
| Thrombocytopenia | 0.94 | 0.87 | 1.01 |
| Prior liver transplant | 0.08 | 0.03 | 0.23 |
| Awaiting liver transplant | 0.86 | 0.76 | 0.98 |
| Complication of liver transplant | 1.07 | 0.88 | 1.31 |
| Liver transplant procedure | 2.03 | 1.40 | 2.95 |
| Charlson score | 1.00 | 0.99 | 1.01 |
| Number of paracentesis procedures | 0.90 | 0.85 | 0.95 |
Predicted Probabilities of IR Referral
Figure 1 presents the distribution of predicted probabilities for IR referral. Predicted probabilities were low overall, with very few patients having an equal chance of referralthe standard often used in comparative effectiveness analyses from observational data. Figure 1 indicates that IR referral probabilities were clustered in an unusual bimodal distribution. The cluster on the left, which centers around a 15% predicted probability of IR referral, consists of discharges with patient characteristics that were associated with a very low chance of an IR paracentesis. We therefore used this distribution to conduct comparative analyses of admission outcomes between clinical specialty groups, choosing to examine patients with a 20% or greater chance of IR referral.
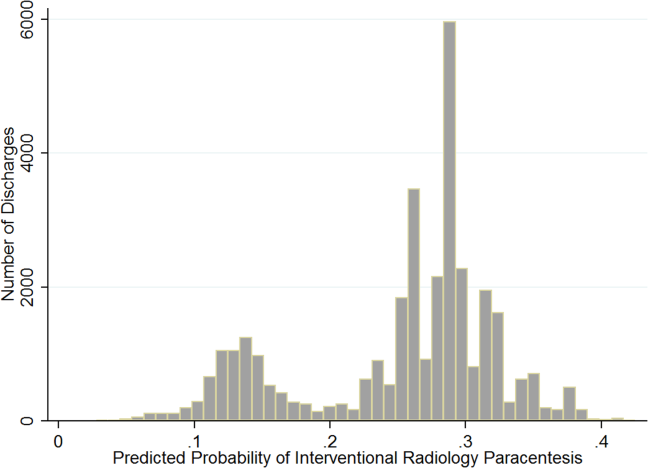
Post hoc analysis revealed that the biggest factor driving low predicted probability of IR referral was whether patients experienced an ICU stay at any time during hospitalization. Among the discharges with a predicted probability 0.2 (n=26,615 discharges), there were only 87 discharges with ICU stays (0.3%). For the discharges with predicted probability <0.2 (n=7676), 91.9% (n=7055) had an ICU admission. We therefore used a threshold of 0.2 or greater to present the most comparable LOS and direct cost differences.
LOS and Cost Comparisons by Specialty
Mean LOS and hospital direct costs by specialty for our final analysis sample can be found in Table 4; differences between specialties were significant (P<0.0001). Patients undergoing IR procedures had equivalent LOS and costs to medicine patients, but lower LOS and costs than other clinical specialty groups. Random effects linear regression showed that neither medicine nor gastroenterology/hepatology patients had significantly different LOS from IR patients, but subspecialty medicine was associated with 0.89 additional days and general surgery with 1.47 additional days (both P<0.0001; R2=0.10). In the direct cost regression model, medicine patients were associated with $1308 lower costs and gastroenterology/hepatology patients with $803 lower costs than IR patients (both P=0.0001), whereas subspecialty medicine and general surgery had higher direct costs per discharge of $1886 and $3039, respectively (both P<0.0001, R2=0.19). Older age, obesity, coagulopathy, hyponatremia, hypotension, thrombocytopenia, liver transplant status, ICU care, higher Charlson score, and higher number of paracentesis procedures performed were all significantly associated with higher LOS and hospital costs in these linear models.
| All Admissions n=26,615 | Interventional Radiology n=7,677 | Medicine n=10,413 | Medicine Subspecialties n=2,210 | Gastroenterology/ Hepatology n=5,182 | General Surgery n=1,133 | |
|---|---|---|---|---|---|---|
| All Admissions n=24,408 | Interventional Radiology n =7,265 | Medicine n=8,965, | Medicine Subspecialties n=2,064 | Gastroenterology/Hepatology n=5,031 | General Surgery n=1,083 | |
| ||||||
| Mean length of stay, d (SD) | 5.57 (5.63) | 5.20 (4.72) | 5.59 (5.85) | 6.28 (6.47) | 5.54 (5.31) | 6.67 (8.16) |
| Mean total direct cost, $ (SD)a | 11,447 (12,247) | 10,975 (9,723) | 10,517 (10,895) | 13,705 (16,591) | 12,000 (11,712) | 15,448 (23,807) |
DISCUSSION
This study showed that internal medicine‐ and family medicine‐trained clinicians perform approximately half of the inpatient paracentesis procedures at university hospitals and their affiliates. This confirms findings from our earlier single‐institution study[16] but contrasts with previously published reports involving Medicare data. The earlier report, using Medicare claims and including ambulatory procedures, revealed that primary care physicians and gastroenterologists only performed approximately 10% of US paracentesis procedures in 2008.[7] Our findings suggest that practices are different at university hospitals, where patients with severe liver disease often seek care. Because we used the UHC database, it was not possible to determine if the clinicians who performed paracentesis procedures in this study were internal medicine or family medicine residents, fellows, or attending physicians. However, findings from our own institution show that the vast majority of bedside paracentesis procedures are performed by internal medicine residents.[16]
Our findings have implications for certification of internal medicine and family medicine trainees. In 2008, the ABIM removed the requirement that internal medicine residents demonstrate competency in paracentesis.[12] This decision was informed by a lack of standardized methods to determine procedural competency and published surveys showing that internal medicine and hospitalist physicians rarely performed bedside procedures.[5, 6] Despite this policy change, our findings show that current clinical practice at university hospitals does not reflect national practice patterns or certification requirements, because many internal medicine‐ and family medicine‐trained clinicians still perform paracentesis procedures. This is concerning because internal medicine and family medicine trainees report variable confidence, experience, expertise, and supervision regarding performance of invasive procedures.[9, 10, 21, 22, 23, 24] Furthermore, earlier research also demonstrates that graduating residents and fellows are not able to competently perform common bedside procedures such as thoracentesis, temporary hemodialysis catheter insertion, and lumbar puncture.[25, 26, 27]
The American Association for the Study of Liver Diseases (AASLD) recommends that trained clinicians perform paracentesis procedures.[3, 4] However, the AASLD provides no definition for how training should occur. Because competency in this procedure is not specifically required by the ABIM, ABFM, or ACGME, a paradoxical situation occurs in which internal medicine and family medicine residents, and internal medicine‐trained fellows and faculty continue to perform paracentesis procedures on highly complex patients, but are no longer required to be competent to do so.
In earlier research we showed that simulation‐based mastery learning (SBML) was an effective method to boost internal medicine residents' paracentesis skills.[28] In SBML, all trainees must meet or exceed a minimum passing score on a simulated procedure before performing one on an actual patient.[29] This approach improves clinical care and outcomes in procedures such as central venous catheter insertion[30, 31] and advanced cardiac life support.[32] SBML‐trained residents also performed safe paracentesis procedures with shorter hospital LOS, fewer ICU transfers, and fewer blood product transfusions than IR procedures.[16] Based on the results of this study, AASLD guidelines regarding training, and our experience with SBML, we recommend that all clinicians complete paracentesis SBML training before performing procedures on patients.
Using our propensity model we identified patient characteristics that were associated with IR referral. Patients with a liver transplant were more likely to be cared for in IR. This may be due to a belief that postoperative procedures are anatomically more complex or because surgical trainees do not commonly perform this procedure. The current study confirms findings from earlier work that obese and female patients are more likely to be referred to IR.[16] IR referral of obese patients is likely to occur because paracentesis procedures are technically more difficult. We have no explanation why female patients were more likely to be referred to IR, because most decisions appear to be discretionary. Prospective studies are needed to determine evidence‐based recommendations regarding paracentesis procedure location. Patients with more comorbidities (eg, ICU stay, awaiting liver transplant, coagulation disorders) were more likely to undergo bedside procedures. The complexity of patients undergoing bedside paracentesis procedures reinforces the need for rigorous skill assessment for clinicians who perform them because complications such as intraperitoneal bleeding can be fatal.
Finally, we showed that LOS was similar but hospital direct costs were $800 to $1300 lower for patients whose paracentesis procedure was performed by medicine or gastroenterology/hepatology compared to IR. Medical subspecialties and surgery procedures were more expensive than IR, consistent with the higher LOS seen in these groups. IR procedures add costs due to facility charges for space, personnel, and equipment.[33] At our institution, the hospital cost of an IR paracentesis in 2012 was $361. If we use this figure, and assume costs are similar across university hospitals, the resultant cost savings would be $10,257,454 (for the procedure alone) if all procedures referred to IR in this 2‐year study were instead performed at the bedside. This estimate is approximate because it does not consider factors such as cost of clinician staffing models, which may differ across UHC hospitals. As hospitals look to reduce costs, potential savings due to appropriate use of bedside and IR procedures should be considered. This is especially important because there is no evidence that the extra expense of IR procedures is justified due to improved patient outcomes.
This study has several limitations. First, this was an observational study. Although the database was large, we were limited by coding accuracy and could not control for all potential confounding factors such as Model for End‐Stage Liver Disease score,[34, 35] other specific laboratory values, amount of ascites fluid removed, or bedside procedure failures later referred to IR. However, we do know that only a small number of second, third, or fourth procedures were subsequently referred to IR after earlier ones were performed at the bedside. Additionally the UHC database does not include patient‐specific data, and therefore we could not adjust for multiple visits or procedures by the same patient. Second, we were unable to determine the level of teaching involvement at each UHC affiliated hospital. Community hospitals where attendings managed most of the patients without trainees could not be differentiated from university hospitals where trainees were involved in most patients' care. Third, we did not have specialty information for 9434 (9.7%) procedures and had to exclude these cases. We also excluded a large number of paracentesis procedures in our final outcomes analysis. However, this was necessary because we needed to perform a patient‐level analysis to ensure the propensity and outcomes models were accurate. Finally, we did not evaluate inpatient mortality or 30‐day hospital readmission rates. Mortality and readmission from complications of a paracentesis procedure are rare events.[3, 4, 36] However, mortality and hospital readmission among patients with liver disease are relatively common.[37, 38] It was impossible to link these outcomes to a paracentesis procedure without the ability to perform medical records review.
In conclusion, paracentesis procedures are performed frequently by internal medicine‐ and family medicine‐trained clinicians in university hospitals. Because of these findings regarding current practice patterns, we believe the ACGME, ABIM, and ABFM should clarify their policies to require that residents are competent to perform paracentesis procedures before performing them on patients. This may improve supervision and training for paracentesis procedures that are already occurring and possibly encourage performance of additional, less costly bedside procedures.
Acknowledgements
The authors acknowledge Drs. Douglas Vaughan and Mark Williams for their support and encouragement of this work.
Disclosure: Nothing to report.
- . A primer on detecting cirrhosis and caring for these patients without causing harm. Int J Hepatol. 2011:801983.
- , , . Diagnosis and epidemiology of cirrhosis. Med Clin North Am. 2009;93(4):787–799.
- ; AASLD Practice Guidelines Committee. Management of adult patients with ascites due to cirrhosis: an update. Hepatology. 2009;49(6):2087–2107.
- ; AASLD Practice Guidelines Committee. Management of adult patients with ascites due to cirrhosis: update 2012. Hepatology. 2009;49:2087–2107. Available at: http://www.aasld.org/practiceguidelines/Documents/ascitesupdate2013.pdf. Accessed October 21, 2013.
- , , , , . Procedures performed by hospitalist and non‐hospitalist general internists. J Gen Intern Med. 2010;25(5):448–452.
- , . The declining number and variety of procedures done by general internists: a resurvey of members of the American College of Physicians. Ann Intern Med. 2007;146(5):355–360.
- , , . National fluid shifts: fifteen‐year trends in paracentesis and thoracentesis procedures. J Am Coll Radiol. 2010;7(11):859–864.
- , . What procedures should internists do? Ann Intern Med. 2007;146(5):392–393.
- , , , , , . Beyond the comfort zone: residents assess their comfort performing inpatient medicine procedures. Am J Med. 2006;119(1)71.e17–e24.
- , , . Perception of competency to perform procedures and future practice intent: a national survey of family practice residents. Acad Med. 2003;78(9):926–932.
- , , , . Utilization of and adherence to the gastroenterology core curriculum on hepatology training during a gastrointestinal fellowship. Clin Gastroenterol Hepatol. 2008;6(6):682–688.
- American Board of Internal Medicine. Internal medicine policies. Available at: http://www.abim.org/certification/policies/imss/im.aspx. Accessed December 21, 2013.
- A CGME program requirements for graduate medical education in internal medicine. Available at: http://acgme.org/acgmeweb/portals/0/PFassets/2013‐PR‐FAQ‐PIF/140_internal_medicine_07012013.pdf. Accessed December 17, 2013.
- American Board of Family Medicine residency requirements. Available at: https://www.theabfm.org/cert/guidelines.aspx. Accessed December 17, 2013.
- ACGME program requirements for graduate medical education in family medicine. Available at: http://www.acgme.org/acgmeweb/Portals/0/PFAssets/ProgramRequirements/120pr07012007.pdf. Accessed December 17, 2013.
- , , , , . Clinical outcomes after bedside and interventional radiology paracentesis procedures. Am J Med. 2013;126(4):349–356.
- , , , et al. Performance standards for therapeutic abdominal paracentesis. Hepatology. 2004;40(2):484–488.
- , , . Adapting a clinical comorbidity index for use with ICD‐9‐CM administrative databases. J Clin Epidemiol. 1992;45(6):613–619.
- , , . Adapting a clinical comorbidity index for use with ICD‐9‐CM administrative data: differing perspectives. J Clin Epidemiol. 1993;46(10):1075–1079; discussion 1081–1090.
- . The role of known effects in observational studies. Biometrics. 1998;45(2):557–569.
- , , , et al. A systematic review: the effect of clinical supervision on patient and residency education outcomes. Acad Med. 2012;87(4):428–442.
- , , , et al. Impact of a bedside procedure service on general medicine inpatients: a firm‐based trial. J Hosp Med. 2007;2(3):143–149.
- , , , , , . Effects of increased overnight supervision on resident education, decision‐making, and autonomy. J Hosp Med. 2012;7(8):606–610.
- , . Performance of procedures by nephrologists and nephrology fellows at U.S. nephrology training programs. Clin J Am Soc Nephrol. 2008;3(4):941–947.
- , , , , . Mastery learning of thoracentesis skills by internal medicine residents using simulation technology and deliberate practice. J Hosp Med. 2008;3:49–54.
- , , , , . Mastery learning of temporary dialysis catheter insertion skills by nephrology fellows using simulation technology and deliberate practice. Am J Kidney Dis. 2009;54:70–76.
- , , , , , . Simulation‐based education with mastery learning improves residents' lumbar puncture skills. Neurology. 2012;79:132–137.
- , , , , , . Simulation‐based education with mastery learning improves paracentesis skills. J Grad Med Educ. 2012;4(1):23–27.
- , , , , . Medical education featuring mastery learning with deliberate practice can lead to better health for individuals and populations. Acad Med. 2011; 86(11):e8–e9.
- , , , , . Simulation‐based mastery learning reduces complications during central venous catheter insertion in a medical intensive care unit. Crit Care Med. 2009;37(10):2697–2701.
- , , , , . Use of simulation‐based education to reduce catheter‐related bloodstream infections. Arch Intern Med. 2009;169(15):1420–1423.
- , , , et al. Progress toward improving the quality of cardiac arrest medical team responses at an academic teaching hospital. J Grad Med Educ. 2011;3(2):211–216.
- , , , et al. Technical cost of radiologic examinations: analysis across imaging modalities. Radiology. 2000;216(1):269–272.
- , , , et al. A model to predict survival in patients with end‐stage liver disease. Hepatology. 2001;33(2):464–470.
- , , , et al. Model for end‐stage liver disease (MELD) and allocation of donor livers. Gastroenterology. 2003;124(1):91–96.
- , , , . Videos in clinical medicine. Paracentesis. N Engl J Med. 2006;355(19):e21.
- Center for Disease Control and Prevention. Chronic liver disease or cirrhosis. National Hospital Discharge Survey: 2010 detailed diagnosis and procedure tables, number of first‐listed diagnoses (see ICD9‐CM code 571). Available at: http://www.cdc.gov/nchs/fastats/liverdis.htm. Accessed October 19, 2013.
- , , , et al. Incidence and predictors of 30‐day readmission among patients hospitalized for advanced liver disease. Clin Gastroenterol Hepatol. 2011;9(3):254–259.
Cirrhosis affects up to 3% of the population and is 1 of the 10 most common causes of death in the United States.[1, 2, 3, 4] Paracentesis procedures are frequently performed in patients with liver disease and ascites for diagnostic and/or therapeutic purposes. These procedures can be performed safely by trained clinicians at the bedside or referred to interventional radiology (IR).[2, 3, 4]
National practice patterns show that paracentesis procedures are increasingly referred to IR rather than performed at the bedside by internal medicine or gastroenterology clinicians.[5, 6, 7] In fact, a recent study of Medicare beneficiaries showed that inpatient and outpatient paracentesis procedures performed by radiologists increased by 964% from 1993 to 2008.[7] Reasons for the decline in bedside procedures include the increased availability of IR, lack of sufficient reimbursement, and the time required to perform paracentesis procedures.[5, 6, 7, 8] Surveys of internal medicine and family medicine residents and gastroenterology fellows show trainees often lack the confidence and experience needed to perform the procedure safely.[9, 10, 11] Additionally, many clinicians do not have expertise with ultrasound use and may not have access to necessary equipment.
Inconsistent certification requirements may also impact the competence and experience of physicians to perform paracentesis procedures. Internal medicine residents are no longer required by the American Board of Internal Medicine (ABIM) to demonstrate competency in procedures such as paracentesis for certification.[12] However, the Accreditation Council for Graduate Medical Education (ACGME) requirements state that internal medicine programs must offer residents the opportunity to demonstrate competence in the performance of procedures such as paracentesis, thoracentesis, and central venous catheter insertion.[13] The American Board of Family Medicine (ABFM) does not outline specific procedural competence for initial certification.[14] The ACGME states that family medicine residents must receive training to perform those clinical procedures required for their future practices but allows each program to determine which procedures to require.[15] Due to this uncertainty, practicing hospitalists are likely to have variable training and competence in bedside procedures such as paracentesis.
We previously showed that internal medicine residents rotating on the hepatology service of an academic medical center performed 59% of paracentesis procedures at the bedside.[16] These findings are in contrast to national data showing that 74% of paracentesis procedures performed on Medicare beneficiaries were performed by radiologists.[7] Practice patterns at university hospitals may not be reflected in this data because the study was limited to Medicare beneficiaries and included ambulatory patients.[7] In addition to uncertainty about who is performing this procedure in inpatient settings, little is known about the effect of specialty on postparacentesis clinical outcomes.[16, 17]
The current study had 3 aims: (1) evaluate which clinical specialties perform paracentesis procedures at university hospitals; (2) model patient characteristics associated with procedures performed at the bedside versus those referred to IR; and (3) among patients with a similar likelihood of IR referral, evaluate length of stay (LOS) and hospital costs of patients undergoing procedures performed by different specialties.
METHODS
We performed an observational administrative database review of patients who underwent paracentesis procedures in hospitals participating in the University HealthSystem Consortium (UHC) Clinical Database from January 2010 through December 2012. UHC is an alliance of 120 nonprofit academic medical centers and their 290 affiliated hospitals. UHC maintains databases containing clinical, operational, financial, and patient safety data from affiliated hospitals. Using the UHC database, we described the characteristics of all patients who underwent paracentesis procedures by clinical specialty performing the procedure. We then modeled the effects of patient characteristics on decision‐making about IR referral. Finally, among patients with a homogeneous predicted probability of IR referral, we compared LOS and direct costs by specialty performing the procedure. The Northwestern University institutional review board approved this study.
Procedure
We queried the UHC database for all patients over the age of 18 years who underwent paracentesis procedures (International Classification of Disease Revision 9 [ICD‐9] procedure code 54.91) and had at least 1 diagnosis code of liver disease (571.x). We excluded patients admitted to obstetrics. The query included patient and clinical characteristics such as admission, discharge, and procedure date; age, gender, procedure provider specialty, and intensive care unit (ICU) stay. We also obtained all ICD‐9 codes associated with the admission including obesity, severe liver disease, coagulation disorders, blood loss anemia, hyponatremia, hypotension, thrombocytopenia, liver transplant before or during the admission, awaiting liver transplant, and complications of liver transplant. We used ICD‐9 codes to calculate patients' Charlson score[18, 19] to assess severity of illness on admission.
LOS and total direct hospital costs were compared among patients with a paracentesis performed by a single clinical group and among patients with a similar predicted probability of IR referral. UHC generates direct cost estimates by applying Medicare Cost Report ratios of cost to charges with the labor cost further adjusted by the respective area wage index. Hospital costs were not available from 8.3% of UHC hospitals. We therefore based cost estimates on nonmissing data.
Paracentesis provider specialties were divided into 6 general categories: (1) IR (interventional and diagnostic radiology); (2) medicine (family medicine, general medicine, and hospital medicine); (3) subspecialty medicine (infectious disease, cardiology, nephrology, hematology/oncology, endocrinology, pulmonary, and geriatrics); (4) gastroenterology/hepatology (gastroenterology, hepatology, and transplant medicine); (5) general surgery (general surgery and transplant surgery); and (6) all other (included unclassified specialties). We present patient characteristics categorized by these specialty groups and for admissions in which multiple specialties performed procedures.
Study Design
To analyze an individual patient's likelihood of IR referral, we needed to restrict our sample to discharges where only 1 clinical specialty performed a paracentesis. Therefore, we excluded hybrid discharges with procedures performed by more than 1 specialty in a single admission as well as discharges with procedures performed by all other specialties. To compare LOS and direct cost outcomes, and to minimize selection bias among exclusively IR‐treated patients, we excluded hospitals without procedures done by both IR and medicine.
We modeled referral to IR as a function of patients' demographic and clinical variables, which we believed would affect the probability of referral. We then examined the IR referral model predicted probabilities (propensity score).[20] Finally, we examined mean differences in LOS and direct costs among discharges with a single clinical specialty group, while using the predicted probability of referral as a filter to compare these outcomes by specialty. We further tested specialty differences in LOS and direct costs controlling for demographic and clinical variables.
Statistical Analysis
To test the significance of differences between demographic and clinical characteristics of patients across specialties, we used 2 tests for categorical variables and analysis of variance or the Kruskal‐Wallis rank test for continuous variables. Random effects logistic regression, which adjusts standard errors for clustering by hospital, was used to model the likelihood of referral to IR. Independent variables included patient age, gender, obesity, coagulation disorders, blood loss anemia, hyponatremia, hypotension, thrombocytopenia, liver transplant before hospitalization, liver transplant during hospitalization, awaiting transplant, complications of liver transplant, ICU stay, Charlson score, and number of paracentesis procedures performed during the admission. Predicted probabilities derived from this IR referral model were used to investigate selection bias in our subsequent analyses of LOS and costs.[20]
We used random effects multiple linear regression to test the association of procedure specialty with hospital LOS and total direct costs, controlling for the same independent variables listed above. Analyses were conducted using both actual LOS in days and Medicare costs. We also performed a log transformation of LOS and costs to account for rightward skew. We only present actual LOS and cost results because results were virtually identical. We used SAS version 9 (SAS Institute Inc., Cary, NC) to extract data from the UHC Clinical Database. We performed all statistical analyses using Stata version 12 (StataCorp LP, College Station, TX).
RESULTS
Procedure and Discharge Level Results
There were 97,577 paracentesis procedures performed during 70,862 hospital admissions in 204 UHC hospitals during the study period. Table 1 shows specific specialty groups for each procedure. The all other category consisted of 17,558 subspecialty groups including 9,434 with specialty unknown. Twenty‐nine percent of procedures were performed in IR versus 27% by medicine, 11% by gastroenterology/hepatology, and 11% by subspecialty medicine.
| Specialty Group | No. | % |
|---|---|---|
| Interventional radiology | 28,414 | 29.1 |
| Medicine | 26,031 | 26.7 |
| Family medicine | 1,026 | 1.1 |
| General medicine | 21,787 | 22.3 |
| Hospitalist | 3,218 | 3.3 |
| Subspecialty medicine | 10,558 | 10.8 |
| Infectious disease | 848 | 0.9 |
| Nephrology | 615 | 0.6 |
| Cardiology | 991 | 1.0 |
| Hematology oncology | 795 | 0.8 |
| Endocrinology | 359 | 0.4 |
| Pulmonology | 6,605 | 6.8 |
| Geriatrics | 345 | 0.4 |
| Gastroenterology/hepatology | 11,143 | 11.4 |
| Transplant medicine | 99 | 0.1 |
| Hepatology | 874 | 0.9 |
| Gastroenterology | 10,170 | 10.4 |
| General surgery | 3,873 | 4.0 |
| Transplant surgery | 2,146 | 2.2 |
| General surgery | 1,727 | 1.8 |
| All other | 17,558 | 18.0 |
| Specialty unknown | 9,434 | 9.7 |
Table 2 presents patient characteristics for 70,862 hospital discharges with paracentesis procedures grouped by whether single or multiple specialties performed procedures. Patient characteristics were significantly different across specialty groups. Medicine, subspecialty medicine, and gastroenterology/hepatology patients were younger, more likely to be male, and more likely to have severe liver disease, coagulation disorders, hypotension, and hyponatremia than IR patients.
| All Discharges, N=70,862 | Interventional Radiology, n=9,348 | Medicine, n=13,789 | Subspecialty Medicine, n=5,085 | Gastroenterology/Hepatology, n=6,664 | General Surgery, n=1,891 | All Other, n=7,912 | Discharges With Multiple Specialties, n=26,173 | |
|---|---|---|---|---|---|---|---|---|
| ||||||||
| Age group, y (%) | ||||||||
| 1849 | 25.4 | 22.5 | 27.6 | 24.9 | 23.5 | 20.8 | 25.5 | 26.1 |
| 5059 | 39.8 | 39.8 | 40.9 | 39.4 | 41.5 | 40.3 | 40.0 | 38.7 |
| 6069 | 24.7 | 24.9 | 21.6 | 24.7 | 26.5 | 30.0 | 23.6 | 25.8 |
| 70+ | 10.1 | 12.9 | 9.9 | 11.1 | 8.4 | 8.9 | 11.0 | 9.4 |
| Male (%) | 65.5 | 64.2 | 67.6 | 67.5 | 65.7 | 66.6 | 65.7 | 64.2 |
| Severe liver disease (%)a | 73.7 | 65.3 | 67.8 | 71.0 | 75.3 | 66.6 | 67.6 | 82.1 |
| Obesity (BMI 40+) (%) | 6.3 | 6.1 | 5.3 | 5.7 | 5.1 | 5.8 | 5.2 | 7.6 |
| Any intensive care unit stay (%) | 31.0 | 10.9 | 16.8 | 50.5 | 16.9 | 36.7 | 22.3 | 47.8 |
| Coagulation disorders (%) | 24.3 | 14.8 | 20.2 | 29.9 | 16.1 | 19.0 | 17.8 | 33.1 |
| Blood loss anemia (%) | 3.4 | 1.3 | 2.8 | 2.7 | 2.7 | 1.9 | 2.1 | 5.2 |
| Hyponatremia (%) | 29.9 | 27.1 | 29.2 | 28.9 | 28.0 | 26.6 | 27.3 | 33.1 |
| Hypotension (%) | 9.8 | 7.0 | 8.0 | 11.0 | 7.7 | 10.5 | 8.1 | 12.4 |
| Thrombocytopenia (%) | 29.6 | 24.6 | 28.3 | 32.5 | 22.1 | 21.5 | 24.0 | 35.8 |
| Complication of transplant (%) | 3.3 | 2.1 | 1.1 | 2.4 | 4.0 | 10.3 | 2.7 | 4.7 |
| Awaiting liver transplant (%) | 7.6 | 6.4 | 4.0 | 5.4 | 12.8 | 16.0 | 7.8 | 8.2 |
| Prior liver transplant (%) | 0.5 | 0.8 | 0.3 | 0.3 | 0.7 | 0.7 | 0.4 | 0.6 |
| Liver transplant procedure (%) | 2.7 | 0.0 | 0.0 | 0.3 | 0.4 | 15.6 | 1.6 | 5.6 |
| Mean Charlson score (SD) | 4.51 (2.17) | 4.28 (2.26) | 4.16 (2.17) | 4.72 (2.30) | 4.30 (1.98) | 4.26 (2.22) | 4.36 (2.30) | 4.84 (2.07) |
| Mean paracentesis procedures per discharge (SD) | 1.38 (0.88) | 1.21 (0.56) | 1.26 (0.66) | 1.30 (0.76) | 1.31 (0.70) | 1.28 (0.78) | 1.22 (0.61) | 1.58 (1.13) |
IR Referral Model
We first excluded 6030/70,862 discharges (8.5%) from 59 hospitals without both IR and medicine procedures. We then further excluded 24,986/70,862 (35.3%) discharges with procedures performed by multiple specialties during the same admission. Finally, we excluded 5555/70,862 (7.8%) of discharges with procedure specialty coded as all other. Therefore, 34,291 (48.4%) discharges (43,337/97,577; 44.4% procedures) from 145 UHC hospitals with paracentesis procedures performed by a single clinical specialty group remained for the IR referral analysis sample. Among admissions with multiple specialty paracentesis performed within the same admission, 3128/26,606 admissions with any IR procedure (11.8%) had a different specialty ascribed to the first, second, or third paracentesis with a subsequent IR procedure.
Model results (Table 3) indicate that patients who were obese (odds ratio [OR]: 1.25; 95% confidence interval [CI]: 1.10‐1.43) or had a liver transplant on a prior admission (OR: 2.03; 95% CI: 1.40‐2.95) were more likely to be referred to IR. However, male patients (OR: 0.89; 95% CI: 0.83‐0.95), or patients who required an ICU stay (OR: 0.39; 95% CI: 0.36‐0.43) were less likely to have IR procedures. Other patient factors reducing the likelihood of IR referral included characteristics associated with higher severity of illness (coagulation disorders, hyponatremia, hypotension, and thrombocytopenia).
| Odds Ratio | 95% CI | ||
|---|---|---|---|
| Lower | Upper | ||
| |||
| Age group, y | |||
| 1849 | Reference | ||
| 5059 | 1.05 | 0.97 | 1.14 |
| 6069 | 1.12 | 1.02 | 1.22 |
| 70+ | 1.11 | 0.99 | 1.24 |
| Male | 0.89 | 0.83 | 0.95 |
| Obesity, BMI 40+ | 1.25 | 1.10 | 1.43 |
| ICU care | 0.39 | 0.36 | 0.43 |
| Coagulation disorders | 0.68 | 0.63 | 0.75 |
| Blood loss anemia | 0.52 | 0.41 | 0.66 |
| Hyponatremia | 0.85 | 0.80 | 0.92 |
| Hypotension | 0.83 | 0.74 | 0.93 |
| Thrombocytopenia | 0.94 | 0.87 | 1.01 |
| Prior liver transplant | 0.08 | 0.03 | 0.23 |
| Awaiting liver transplant | 0.86 | 0.76 | 0.98 |
| Complication of liver transplant | 1.07 | 0.88 | 1.31 |
| Liver transplant procedure | 2.03 | 1.40 | 2.95 |
| Charlson score | 1.00 | 0.99 | 1.01 |
| Number of paracentesis procedures | 0.90 | 0.85 | 0.95 |
Predicted Probabilities of IR Referral
Figure 1 presents the distribution of predicted probabilities for IR referral. Predicted probabilities were low overall, with very few patients having an equal chance of referralthe standard often used in comparative effectiveness analyses from observational data. Figure 1 indicates that IR referral probabilities were clustered in an unusual bimodal distribution. The cluster on the left, which centers around a 15% predicted probability of IR referral, consists of discharges with patient characteristics that were associated with a very low chance of an IR paracentesis. We therefore used this distribution to conduct comparative analyses of admission outcomes between clinical specialty groups, choosing to examine patients with a 20% or greater chance of IR referral.
Post hoc analysis revealed that the biggest factor driving low predicted probability of IR referral was whether patients experienced an ICU stay at any time during hospitalization. Among the discharges with a predicted probability 0.2 (n=26,615 discharges), there were only 87 discharges with ICU stays (0.3%). For the discharges with predicted probability <0.2 (n=7676), 91.9% (n=7055) had an ICU admission. We therefore used a threshold of 0.2 or greater to present the most comparable LOS and direct cost differences.
LOS and Cost Comparisons by Specialty
Mean LOS and hospital direct costs by specialty for our final analysis sample can be found in Table 4; differences between specialties were significant (P<0.0001). Patients undergoing IR procedures had equivalent LOS and costs to medicine patients, but lower LOS and costs than other clinical specialty groups. Random effects linear regression showed that neither medicine nor gastroenterology/hepatology patients had significantly different LOS from IR patients, but subspecialty medicine was associated with 0.89 additional days and general surgery with 1.47 additional days (both P<0.0001; R2=0.10). In the direct cost regression model, medicine patients were associated with $1308 lower costs and gastroenterology/hepatology patients with $803 lower costs than IR patients (both P=0.0001), whereas subspecialty medicine and general surgery had higher direct costs per discharge of $1886 and $3039, respectively (both P<0.0001, R2=0.19). Older age, obesity, coagulopathy, hyponatremia, hypotension, thrombocytopenia, liver transplant status, ICU care, higher Charlson score, and higher number of paracentesis procedures performed were all significantly associated with higher LOS and hospital costs in these linear models.
| All Admissions n=26,615 | Interventional Radiology n=7,677 | Medicine n=10,413 | Medicine Subspecialties n=2,210 | Gastroenterology/ Hepatology n=5,182 | General Surgery n=1,133 | |
|---|---|---|---|---|---|---|
| All Admissions n=24,408 | Interventional Radiology n =7,265 | Medicine n=8,965, | Medicine Subspecialties n=2,064 | Gastroenterology/Hepatology n=5,031 | General Surgery n=1,083 | |
| ||||||
| Mean length of stay, d (SD) | 5.57 (5.63) | 5.20 (4.72) | 5.59 (5.85) | 6.28 (6.47) | 5.54 (5.31) | 6.67 (8.16) |
| Mean total direct cost, $ (SD)a | 11,447 (12,247) | 10,975 (9,723) | 10,517 (10,895) | 13,705 (16,591) | 12,000 (11,712) | 15,448 (23,807) |
DISCUSSION
This study showed that internal medicine‐ and family medicine‐trained clinicians perform approximately half of the inpatient paracentesis procedures at university hospitals and their affiliates. This confirms findings from our earlier single‐institution study[16] but contrasts with previously published reports involving Medicare data. The earlier report, using Medicare claims and including ambulatory procedures, revealed that primary care physicians and gastroenterologists only performed approximately 10% of US paracentesis procedures in 2008.[7] Our findings suggest that practices are different at university hospitals, where patients with severe liver disease often seek care. Because we used the UHC database, it was not possible to determine if the clinicians who performed paracentesis procedures in this study were internal medicine or family medicine residents, fellows, or attending physicians. However, findings from our own institution show that the vast majority of bedside paracentesis procedures are performed by internal medicine residents.[16]
Our findings have implications for certification of internal medicine and family medicine trainees. In 2008, the ABIM removed the requirement that internal medicine residents demonstrate competency in paracentesis.[12] This decision was informed by a lack of standardized methods to determine procedural competency and published surveys showing that internal medicine and hospitalist physicians rarely performed bedside procedures.[5, 6] Despite this policy change, our findings show that current clinical practice at university hospitals does not reflect national practice patterns or certification requirements, because many internal medicine‐ and family medicine‐trained clinicians still perform paracentesis procedures. This is concerning because internal medicine and family medicine trainees report variable confidence, experience, expertise, and supervision regarding performance of invasive procedures.[9, 10, 21, 22, 23, 24] Furthermore, earlier research also demonstrates that graduating residents and fellows are not able to competently perform common bedside procedures such as thoracentesis, temporary hemodialysis catheter insertion, and lumbar puncture.[25, 26, 27]
The American Association for the Study of Liver Diseases (AASLD) recommends that trained clinicians perform paracentesis procedures.[3, 4] However, the AASLD provides no definition for how training should occur. Because competency in this procedure is not specifically required by the ABIM, ABFM, or ACGME, a paradoxical situation occurs in which internal medicine and family medicine residents, and internal medicine‐trained fellows and faculty continue to perform paracentesis procedures on highly complex patients, but are no longer required to be competent to do so.
In earlier research we showed that simulation‐based mastery learning (SBML) was an effective method to boost internal medicine residents' paracentesis skills.[28] In SBML, all trainees must meet or exceed a minimum passing score on a simulated procedure before performing one on an actual patient.[29] This approach improves clinical care and outcomes in procedures such as central venous catheter insertion[30, 31] and advanced cardiac life support.[32] SBML‐trained residents also performed safe paracentesis procedures with shorter hospital LOS, fewer ICU transfers, and fewer blood product transfusions than IR procedures.[16] Based on the results of this study, AASLD guidelines regarding training, and our experience with SBML, we recommend that all clinicians complete paracentesis SBML training before performing procedures on patients.
Using our propensity model we identified patient characteristics that were associated with IR referral. Patients with a liver transplant were more likely to be cared for in IR. This may be due to a belief that postoperative procedures are anatomically more complex or because surgical trainees do not commonly perform this procedure. The current study confirms findings from earlier work that obese and female patients are more likely to be referred to IR.[16] IR referral of obese patients is likely to occur because paracentesis procedures are technically more difficult. We have no explanation why female patients were more likely to be referred to IR, because most decisions appear to be discretionary. Prospective studies are needed to determine evidence‐based recommendations regarding paracentesis procedure location. Patients with more comorbidities (eg, ICU stay, awaiting liver transplant, coagulation disorders) were more likely to undergo bedside procedures. The complexity of patients undergoing bedside paracentesis procedures reinforces the need for rigorous skill assessment for clinicians who perform them because complications such as intraperitoneal bleeding can be fatal.
Finally, we showed that LOS was similar but hospital direct costs were $800 to $1300 lower for patients whose paracentesis procedure was performed by medicine or gastroenterology/hepatology compared to IR. Medical subspecialties and surgery procedures were more expensive than IR, consistent with the higher LOS seen in these groups. IR procedures add costs due to facility charges for space, personnel, and equipment.[33] At our institution, the hospital cost of an IR paracentesis in 2012 was $361. If we use this figure, and assume costs are similar across university hospitals, the resultant cost savings would be $10,257,454 (for the procedure alone) if all procedures referred to IR in this 2‐year study were instead performed at the bedside. This estimate is approximate because it does not consider factors such as cost of clinician staffing models, which may differ across UHC hospitals. As hospitals look to reduce costs, potential savings due to appropriate use of bedside and IR procedures should be considered. This is especially important because there is no evidence that the extra expense of IR procedures is justified due to improved patient outcomes.
This study has several limitations. First, this was an observational study. Although the database was large, we were limited by coding accuracy and could not control for all potential confounding factors such as Model for End‐Stage Liver Disease score,[34, 35] other specific laboratory values, amount of ascites fluid removed, or bedside procedure failures later referred to IR. However, we do know that only a small number of second, third, or fourth procedures were subsequently referred to IR after earlier ones were performed at the bedside. Additionally the UHC database does not include patient‐specific data, and therefore we could not adjust for multiple visits or procedures by the same patient. Second, we were unable to determine the level of teaching involvement at each UHC affiliated hospital. Community hospitals where attendings managed most of the patients without trainees could not be differentiated from university hospitals where trainees were involved in most patients' care. Third, we did not have specialty information for 9434 (9.7%) procedures and had to exclude these cases. We also excluded a large number of paracentesis procedures in our final outcomes analysis. However, this was necessary because we needed to perform a patient‐level analysis to ensure the propensity and outcomes models were accurate. Finally, we did not evaluate inpatient mortality or 30‐day hospital readmission rates. Mortality and readmission from complications of a paracentesis procedure are rare events.[3, 4, 36] However, mortality and hospital readmission among patients with liver disease are relatively common.[37, 38] It was impossible to link these outcomes to a paracentesis procedure without the ability to perform medical records review.
In conclusion, paracentesis procedures are performed frequently by internal medicine‐ and family medicine‐trained clinicians in university hospitals. Because of these findings regarding current practice patterns, we believe the ACGME, ABIM, and ABFM should clarify their policies to require that residents are competent to perform paracentesis procedures before performing them on patients. This may improve supervision and training for paracentesis procedures that are already occurring and possibly encourage performance of additional, less costly bedside procedures.
Acknowledgements
The authors acknowledge Drs. Douglas Vaughan and Mark Williams for their support and encouragement of this work.
Disclosure: Nothing to report.
- . A primer on detecting cirrhosis and caring for these patients without causing harm. Int J Hepatol. 2011:801983.
- , , . Diagnosis and epidemiology of cirrhosis. Med Clin North Am. 2009;93(4):787–799.
- ; AASLD Practice Guidelines Committee. Management of adult patients with ascites due to cirrhosis: an update. Hepatology. 2009;49(6):2087–2107.
- ; AASLD Practice Guidelines Committee. Management of adult patients with ascites due to cirrhosis: update 2012. Hepatology. 2009;49:2087–2107. Available at: http://www.aasld.org/practiceguidelines/Documents/ascitesupdate2013.pdf. Accessed October 21, 2013.
- , , , , . Procedures performed by hospitalist and non‐hospitalist general internists. J Gen Intern Med. 2010;25(5):448–452.
- , . The declining number and variety of procedures done by general internists: a resurvey of members of the American College of Physicians. Ann Intern Med. 2007;146(5):355–360.
- , , . National fluid shifts: fifteen‐year trends in paracentesis and thoracentesis procedures. J Am Coll Radiol. 2010;7(11):859–864.
- , . What procedures should internists do? Ann Intern Med. 2007;146(5):392–393.
- , , , , , . Beyond the comfort zone: residents assess their comfort performing inpatient medicine procedures. Am J Med. 2006;119(1)71.e17–e24.
- , , . Perception of competency to perform procedures and future practice intent: a national survey of family practice residents. Acad Med. 2003;78(9):926–932.
- , , , . Utilization of and adherence to the gastroenterology core curriculum on hepatology training during a gastrointestinal fellowship. Clin Gastroenterol Hepatol. 2008;6(6):682–688.
- American Board of Internal Medicine. Internal medicine policies. Available at: http://www.abim.org/certification/policies/imss/im.aspx. Accessed December 21, 2013.
- A CGME program requirements for graduate medical education in internal medicine. Available at: http://acgme.org/acgmeweb/portals/0/PFassets/2013‐PR‐FAQ‐PIF/140_internal_medicine_07012013.pdf. Accessed December 17, 2013.
- American Board of Family Medicine residency requirements. Available at: https://www.theabfm.org/cert/guidelines.aspx. Accessed December 17, 2013.
- ACGME program requirements for graduate medical education in family medicine. Available at: http://www.acgme.org/acgmeweb/Portals/0/PFAssets/ProgramRequirements/120pr07012007.pdf. Accessed December 17, 2013.
- , , , , . Clinical outcomes after bedside and interventional radiology paracentesis procedures. Am J Med. 2013;126(4):349–356.
- , , , et al. Performance standards for therapeutic abdominal paracentesis. Hepatology. 2004;40(2):484–488.
- , , . Adapting a clinical comorbidity index for use with ICD‐9‐CM administrative databases. J Clin Epidemiol. 1992;45(6):613–619.
- , , . Adapting a clinical comorbidity index for use with ICD‐9‐CM administrative data: differing perspectives. J Clin Epidemiol. 1993;46(10):1075–1079; discussion 1081–1090.
- . The role of known effects in observational studies. Biometrics. 1998;45(2):557–569.
- , , , et al. A systematic review: the effect of clinical supervision on patient and residency education outcomes. Acad Med. 2012;87(4):428–442.
- , , , et al. Impact of a bedside procedure service on general medicine inpatients: a firm‐based trial. J Hosp Med. 2007;2(3):143–149.
- , , , , , . Effects of increased overnight supervision on resident education, decision‐making, and autonomy. J Hosp Med. 2012;7(8):606–610.
- , . Performance of procedures by nephrologists and nephrology fellows at U.S. nephrology training programs. Clin J Am Soc Nephrol. 2008;3(4):941–947.
- , , , , . Mastery learning of thoracentesis skills by internal medicine residents using simulation technology and deliberate practice. J Hosp Med. 2008;3:49–54.
- , , , , . Mastery learning of temporary dialysis catheter insertion skills by nephrology fellows using simulation technology and deliberate practice. Am J Kidney Dis. 2009;54:70–76.
- , , , , , . Simulation‐based education with mastery learning improves residents' lumbar puncture skills. Neurology. 2012;79:132–137.
- , , , , , . Simulation‐based education with mastery learning improves paracentesis skills. J Grad Med Educ. 2012;4(1):23–27.
- , , , , . Medical education featuring mastery learning with deliberate practice can lead to better health for individuals and populations. Acad Med. 2011; 86(11):e8–e9.
- , , , , . Simulation‐based mastery learning reduces complications during central venous catheter insertion in a medical intensive care unit. Crit Care Med. 2009;37(10):2697–2701.
- , , , , . Use of simulation‐based education to reduce catheter‐related bloodstream infections. Arch Intern Med. 2009;169(15):1420–1423.
- , , , et al. Progress toward improving the quality of cardiac arrest medical team responses at an academic teaching hospital. J Grad Med Educ. 2011;3(2):211–216.
- , , , et al. Technical cost of radiologic examinations: analysis across imaging modalities. Radiology. 2000;216(1):269–272.
- , , , et al. A model to predict survival in patients with end‐stage liver disease. Hepatology. 2001;33(2):464–470.
- , , , et al. Model for end‐stage liver disease (MELD) and allocation of donor livers. Gastroenterology. 2003;124(1):91–96.
- , , , . Videos in clinical medicine. Paracentesis. N Engl J Med. 2006;355(19):e21.
- Center for Disease Control and Prevention. Chronic liver disease or cirrhosis. National Hospital Discharge Survey: 2010 detailed diagnosis and procedure tables, number of first‐listed diagnoses (see ICD9‐CM code 571). Available at: http://www.cdc.gov/nchs/fastats/liverdis.htm. Accessed October 19, 2013.
- , , , et al. Incidence and predictors of 30‐day readmission among patients hospitalized for advanced liver disease. Clin Gastroenterol Hepatol. 2011;9(3):254–259.
© 2014 Society of Hospital Medicine
