User login
West Nile virus has cost the United States nearly $800 million
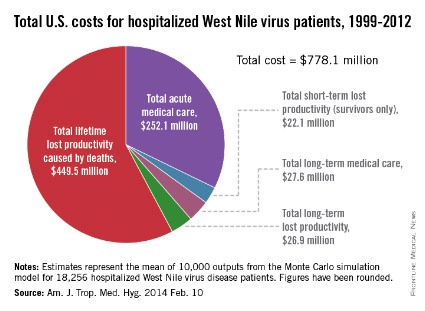
Since the West Nile virus was first detected in New York in 1999, hospitalized patients in the United States have cost an estimated $778.1 million in health care expenditures and lost productivity, according to a study published online Feb. 10 in the American Journal of Tropical Medicine and Hygiene.
Of that $778.1 million, the largest share – $449.5 million, or almost 58% – represents mean lifetime lost productivity from deaths caused by infection. Hospitalization for acute illness was estimated at $252.1 million, long-term medical care cost $27.6 million, long-term lost productivity cost $26.9 million, and short-term lost productivity (survivors only) totaled $22.1 million, investigators from the Centers for Disease Control and Prevention reported.
From 1999 through 2012, there were 37,088 cases of West Nile virus disease reported to the CDC’s ArboNET surveillance system, resulting in more than 18,000 hospitalizations and 1,529 deaths, the investigators said (Am. J. Trop. Med. Hyg. 2014 Feb. 10).
They determined the cost of initial hospitalization for 80 patients in a 2003 West Nile virus outbreak in Colorado, then calculated the cost of additional medical care and missed work for 38 patients who had 5 years of follow-up data available after the initial infection. These costs were then extrapolated to the total number of hospitalized cases in the United States since 1999.
FROM AMERICAN JOURNAL OF TROPICAL MEDICINE AND HYGIENE
Treatment of Postoperative Infection After Posterior Spinal Fusion and Instrumentation in a Patient With Neuromuscular Scoliosis

Is There a Role for Arthroscopy in the Treatment of Glenohumeral Arthritis?
This issue of The American Journal of Orthopedics focuses on the treatment of shoulder and elbow pathology in 2014. Treatment of shoulder arthritis in young or high-demand patients remains a significant challenge. Total shoulder arthroplasty (TSA) for glenohumeral arthritis can provide excellent pain relief and improved function in elderly, lower demand patients. In younger or higher demand patients, the long-term outcomes are less favorable—failure rates are higher, and revision surgery outcomes are unpredictable. Sperling and colleagues1 reported a survival rate of only 61% for TSA in patients younger than 50 at 10-year follow-up. In addition, postarthroplasty activity restrictions may be unacceptable for these younger, active patients. Concerns about poor shoulder arthroplasty durability and patient expectations of high activity have led to considerations for nonarthroplastic surgical options for shoulder arthritis in this patient population.
Some consider hemiarthroplasty an appropriate treatment option for shoulder arthritis in young patients and in patients who are too active for TSA, as hemiarthroplasty does not involve implantation of a glenoid component. However, compared with TSA, hemiarthroplasty is generally associated with inferior outcomes. Furthermore, when hemiarthroplasty fails and TSA revision becomes necessary, the outcomes of this revision are often inferior to those of primary TSA in the same population. For these reasons, hemiarthroplasty is considered a less optimal option for primary shoulder arthritis.
Biological resurfacing of the glenoid once was an exciting treatment alternative to TSA. Biological resurfacing includes interposition of soft tissue, whether fascia lata,
Achilles tendon, or lateral meniscus allograft, onto the native glenoid with a hemiarthroplasty of the humerus. Initial short-term outcomes of biological resurfacing were encouraging, but midterm outcomes were unsatisfactory, and attempts to reproduce initial published results were unsuccessful. Biological resurfacing has a very limited role now and is largely reserved for patients with localized humeral head articular cartilage loss with minimal involvement of the glenoid. In general, the glenoid remains the most significant treatment challenge in this group, and, other than for “ream and run” procedures, most biological
solutions for the glenoid are seldom used because of technical difficulty, surgical morbidity, and overall high failure rates.
Arthroscopic treatment of shoulder arthritis has emerged as an alternative to shoulder arthroplasty. Originally reported in 1982, initial attempts consisted mostly of arthroscopic joint lavage and loose body removal.2 More recently, arthroscopic procedures for the treatment of shoulder arthritis have been expanded to include extensive joint debridement with synovectomy and circumferential capsular release, chondroplasty, osteophyte excision, and treatment of associated pathology, such as biceps tendinopathy, subacromial bursitis, acromioclavicular arthrosis, and even neurolysis of the axillary nerve.
Published results of shoulder arthroscopy for arthritis are encouraging. In a recent systematic literature review, Namdari and colleagues3 found a clear trend of significant pain relief and improved function after shoulder arthroscopy for arthritis, despite lack of high-level evidence. Millett and colleagues4 reported 85% survivorship at 2-year follow-up for 30 shoulders (23 men, 6 women; mean age,
52 years). Overall, patients reported significant pain relief with daily activities, athletic or work activity, and ability to rest comfortably. Similarly, Van Thiel and colleagues5 reported excellent pain relief and improved validated shoulder and elbow scores at 27-month follow-up. In both studies, patients with severe joint-space narrowing (<2 mm on radiographs) or severe arthritic deformity had
inferior outcomes, but severity of arthroscopic grade of arthritis was not prognostic of clinical outcomes. Chondroplasty and osteophyte excision were shown to be helpful in reestablishing range-of-motion (ROM) and providing pain relief, but larger osteophytes associated with worse glenohumeral arthritis had poorer outcomes. In general, it should be assumed that, if the humeral head shape is preserved, if glenoid wear is concentric, and if the joint space is visible on radiographs, then the patient is likely to have improved pain and function with arthroscopic treatment.
Properly addressing associated shoulder pain generators at time of arthroscopic surgery is important. Patients with significant arthritic stiffness can have prolonged improvement in ROM and function after arthroscopic debridement and circumferential capsular release. Patients with symptoms of biceps tendinopathy should undergo biceps tenodesis or tenotomy. Acromioclavicular joint pain should
receive a distal clavicle excision. Subacromial debridement should be performed for subacromial symptoms, while acromioplasty can be reserved for type III acromion morphology. With careful preoperative evaluation, the clinician should be able to identify all possible pain generators in the arthritic shoulder and address these concomitantly to optimize pain relief and improved function.
In summary, shoulder arthroscopy should be considered a surgical alternative to shoulder arthroplasty in young or high-demand patients with mild to moderate arthritis. Pathology most responsive to shoulder arthroscopy includes shoulder stiffness caused by capsular tightness, chondral lesion less than 2 cm,3 less severe arthritis with preserved humeral head shape, and properly addressed associated
pathology, such as synovitis, biceps tendinopathy, and subacromial bursitis or acromioclavicular arthrosis. Although high-level evidence is lacking, study trends show improved ROM and pain relief and overall high patient satisfaction at short to midterm follow-up. Ultimately, more data are needed to provide precise surgical indications and prognostic factors. Currently, however, it appears that shoulder arthroscopy can play an important role in the treatment of shoulder arthritis and can provide high satisfaction in appropriately selected patients.
References
1. Sperling JW, Cofield RH, Rowland CM. Neer hemiarthroplasty and Neer
total shoulder arthroplasty in patients fifty years old or less. Long-term
results. J Bone Joint Surg Am. 1998;80(4):464-473.
2. McGinty JB. Arthroscopic removal of loose bodies. Ortho Clin North
Am. 1982;13(2):313-328.
3. Namdari S, Skelley N, Keener JD, Galatz LM, Yamaguchi K. What is the
role of arthroscopic debridement for glenohumeral arthritis? A critical
examination of the literature. Arthroscopy. 2013;29(8):1392-1398.
4. Millett PJ, Horan MP, Pennock AT, Rios D. Comprehensive arthroscopic
management (CAM) procedure: clinical results of a joint-preserving
arthroscopic treatment for young, active patients with advanced shoulder
osteoarthritis. Arthroscopy. 2013;29(3):440-448.
5. Van Thiel GS, Sheehan S, Frank RM, et al. Retrospective analysis of
arthroscopic management of glenohumeral degenerative disease.
Arthroscopy. 2010;26(11):1451-1455.

Ashiness
Dry skin occurs throughout the year, but for many people it’s most prevalent and problematic in winter. Cold temperatures, low humidity, and strong, harsh winds deplete the skin of its natural lipid layer, which would normally help keep the skin from drying out. Skin of color in particular, can become very flaky, dry, and "ashy" in the winter. Differences in the stratum corneum barrier in skin of color may contribute to the propensity toward ashiness.
The barrier function of the skin depends on the structure of the corneocytes, lipid content, and transepidermal water loss. Compared with skin in white people, black skin has more corneocyte layers and a more compact stratum corneum with greater intercellular cohesiveness. The epidermal barrier in darker skin has been shown to be stronger when exposed to mechanical or chemical challenge. Although the size of the individual corneocytes is the same in black and white skin, the desquamation rate in certain locations is higher in black skin. This is likely due to increased desquamatory enzyme levels such as cathepsin L2 in the lamellar granules of darker pigmented individuals leading to an ashy manifestation of the skin.
Black skin also has the highest sebum content of all ethnicities, but has the lowest ceramide level, and is thus the most susceptible to transepidermal water loss and xerosis of any ethnic group. Of note, one study has shown that the use of a certain type of fatty acid body wash or a synthetic "syndet" bar reduced ashiness.
Although no large, multiethnic group studies have been performed to examine the skin barrier physiologic properties and their relation to clinical signs of disease, these small studies do shed light on some of the ethnic variation in skin barrier function.
In clinical practice, these small variations should play a role in personalized treatment regimens for common conditions such as acne and atopic dermatitis. In my practice, black patients with acne often have high sebum content, but they cannot tolerate drying medications such as benzoyl peroxide because of their skin sensitivity and intolerance to skin drying. These patients often also present with ashy, dry skin in certain areas, and oily, acne-prone skin in other areas, leading to more complex skin care regimens. Understanding these basic concepts can help better tailor our basic skin treatments and education for skin of color patients in the winter and throughout the year.
Sources:
Talakoub L, Wesley NO. Differences in perceptions of beauty and cosmetic procedures performed in ethnic patients. Semin. Cutan. Med. Surg. 2009;28:115-29.
Feng L, Hawkins S. Reduction of "ashiness" in skin of color with a lipid-rich moisturizing body wash. J. Clin. Aesthet. Dermatol. 2011;4:41-4.
Dr. Wesley practices dermatology in Beverly Hills, Calif. Do you have questions about treating patients with dark skin? If so, send them to [email protected].

Ultrasound and Clinical Evaluation of Soft-Tissue Versus Hardware Biceps Tenodesis: Is Hardware Tenodesis Worth the Cost?

Sequencing reveals therapeutic target for leukemias

of General Medical Sciences
By analyzing the whole genomes of 3-year-old twin sisters—one healthy and one with multi-lineage leukemia (MLL)—researchers have identified a possible therapeutic target for leukemias.
Their research pointed to a molecular pathway involving the gene SETD2, which can mutate in blood cells as DNA is being transcribed and replicated.
The team confirmed the importance of this pathway via follow-up experiments using samples from leukemia patients and mouse models of the disease.
“We reasoned that monozygotic twins discordant for human leukemia would have identical inherited genetic backgrounds and well-matched tissue-specific events,” said Gang Huang, PhD, of Cincinnati Children’s Hospital Medical Center in Ohio.
“This provided a strong basis for comparison and analysis. We identified a gene mutation involving SETD2 that contributes to the initiation and progression of leukemia by promoting the self-renewal potential of leukemia stem cells.”
Dr Huang and his colleagues recounted this discovery in Nature Genetics.
The team showed that the onset of aggressive and acute leukemia is fueled by a spiraling cascade of multiple genetic mutations and chromosomal translocations.
In comparing data from the twins, the researchers identified a chromosomal translocation in the MLL-NRIP3 fusion gene.
When they activated MLL-NRIP3 in mouse models, the animals developed MLL, but it took a long period of time. This suggests that additional epigenetic and molecular events must be involved to induce full-blown leukemia.
The researchers went on to show that activation of MLL-NRIP3 cooperated with the molecular cascade (including mutations in SETD2) to cause leukemia.
The initial clue came when the team was looking for additional genomic alterations in the leukemic cells of the sick twin. They discovered that activation of MLL-NRIP3 started the molecular cascade that led to bi-allelic mutations in SETD2, a tumor suppressor that regulates the histone modification protein H3K36me3.
During transcriptional elongation, SETD2 and H3K36me3 normally mark the zone for accurate gene transcription along the DNA. In the case of the sick twin, the mutations and molecular cascade disrupted the H3K36me3 mark, leading to abnormal transcription and MLL.
To confirm the importance of these findings, the researchers analyzed blood samples from 241 patients—134 with acute myeloid leukemia and 107 with acute lymphoblastic leukemia. This revealed 19 somatic SETD2 mutations in 15 patients (6.2%).
SETD2 mutations were more common in patients with MLL rearrangements than those without—22.6% (6/27) and 4.6% (8/173), respectively. And patients with SETD2 mutations had decreased levels of global H3K36me3.
In follow-up tests on cell cultures of pre-leukemic cells and mouse models, the researchers saw the same progression of genetic mutations and related molecular events fuel the growth of leukemic cells.
The team also noticed that SETD2 mutation activated 2 genes—mTOR and JAK-STAT—that are known to contribute to leukemia and other cancers. So the researchers decided to test 2 mTOR inhibitors—Torin1 and rapamycin—on pre-leukemic cells generated by SETD2 mutations.
That treatment prompted a marked decrease in cell growth, indicating that SETD2 mutations activate numerous molecular pathways to generate leukemia.
Dr Huang said the tests also suggest there are multiple opportunities to find new molecular targets for developing more effective drugs—in particular, those that would target the MLL fusion-SETD2-H3K36me3 pathway to treat acute and aggressive leukemias.
The researchers are following up their current study by identifying additional pathways activated by mutations of SETD2. They also are looking for possible new molecular targets and therapeutic strategies to block disruptions in the SETD2-H3K36me3 pathway. ![]()
Team discovers global regulator of RNA editing

Credit: UC San Diego
School of Medicine
Scientists say they have identified a protein that broadly regulates how genetic information transcribed from DNA to messenger RNA (mRNA) is processed and ultimately translated into the myriad proteins necessary for life.
The group’s work shows that the protein ADR-1 binds to mRNA and then enhances RNA editing.
This process allows a gene to be present as multiple mRNAs that can each affect gene expression differently.
The research appears in Cell Reports.
“Problems with RNA editing show up in many human diseases, including those of neurodegeneration, cancer, and blood disorders,” said study author Gene Yeo, PhD, of the University of California, San Diego.
“This is the first time that a single protein has been identified that broadly regulates RNA editing. There are probably hundreds more. Our approach provides
a method to screen for them and opens up new ways to study human biology and disease.”
Using the model organism Caenorhabditis elegans, Dr Yeo and his colleagues identified more than 400 new mRNA editing sites. As the majority of them were regulated by ADR-1, the team declared the protein the first global regulator of RNA editing.
“What we’ve determined is that this protein’s ability to alter editing of mRNAs is not specific to just a few genes, but, instead, its ability to bind to mRNAs is required for proper RNA editing of most mRNAs,” said study author Michael C. Washburn, of Indiana University in Bloomington.
The group found that the region of ADR-1 protein that binds to target mRNAs in C elegans is required for regulating editing. This region is present in many human proteins, and a protein similar to ADR-1 is specifically expressed in human neurons.
“So it is likely that a similar mechanism exists to regulate editing in humans,” said study author Heather A. Hundley, PhD, also of Indiana University.
“Further work in our lab will be aimed at understanding the detailed mechanism of how these proteins regulate editing, in turn providing an inroad to developing therapeutics that modulate editing for the treatment of human diseases.”
C elegans, like humans, highly expresses a family of proteins in the nervous system called adenosine deaminases acting on RNA (ADARs), a family that includes ADR-1.
ADARs change specific nucleotides in RNA in a process called adenosine-to-inosine editing (A-to-I editing) that diversifies genetic information to specify different amino acids, splice sites, and structures.
Scientists currently estimate there are between 400,000 and 1 million A-to-I editing events in noncoding regions of the human transcriptome.
Newly synthesized RNA encodes the exact information found in DNA. But it’s when later RNA editing occurs that RNA gets altered, and this change is most often catalyzed by ADARs.
“One thing we also know is that ADAR protein levels are not altered in disease, implying that other mechanisms are also at work regulating ADAR-mediated RNA editing,” Dr Hundley said. “By identifying this major regulator of noncoding editing in C elegans, we can now focus on dissecting the regulatory mechanism and determining the conservation of this regulatory protein in human cells.” ![]()
Leaders agree on SGR bill but funding still a question

Credit: Lawrence Jackson
Leaders from the US Senate and House of Representatives have agreed on a plan to replace the Medicare sustainable growth rate (SGR) formula, but they must still agree on how to pay for it.
The group’s bill, called the SGR Repeal and Medicare Provider Payment Modernization Act of 2014, would remove the threat of a 23.7% cut in Medicare payments that is set to take effect on April 1.
And it would provide annual payment updates of 0.5% for the next 5 years, as Medicare transitions to a payment system designed to reward physicians based on care quality, not quantity.
“This is a significant step forward in our long-standing effort to replace the flawed physician update formula with a 21st-century system focused on quality and value rather than the quantity of services,” said House Ways and Means Committee Ranking Member Sander Levin (D-Mich.).
“For the first time in many years, we have agreement among the bipartisan leadership of the 3 committees that oversee Medicare. Now, we have to turn to the thorny issue of offsets.”
The Congressional Budget Office has estimated that the new plan would increase direct spending by $150.4 billion from 2014 to 2023, although other sources have said the cost would be about $126 billion for the same time period.
Repealing the SGR
The SGR calls for annual, automatic cuts in Medicare payments to physicians. It was established in 1997 to control physician spending, but, over the years, the necessary cuts have not occurred.
Since 2003, Congress has spent about $150 billion to provide short-term fixes to spare physicians from the cuts. Without another short-term fix or legislation to permanently eliminate the SGR, physicians would see a 23.7% cut in Medicare payments starting April 1.
For years, Congress has been trying to eliminate the SGR, but agreeing on a plan to do so—and a way to pay for it—has proven difficult. Now, Congress says it has brought “renewed commitment to repealing and replacing the flawed SGR update mechanism.”
Provisions of the bill
The SGR Repeal and Medicare Provider Payment Modernization Act of 2014 would institute a 0.5% annual payment increase for physicians from 2014 through 2018. According to Congress, this would help the transition to a merit-based incentive payment system (MIPS), beginning in 2018.
The MIPS consolidates the 3 existing incentive programs—the Physician Quality Reporting System, the Value-Based Payment Modifier, and the Meaningful Use of Electronic Health Records—into a single program that would reward providers who meet performance thresholds.
The bill would also give a 5% bonus to providers who receive a significant portion of their revenue from an alternative payment model (APM) or patient-centered medical home (PCMH). Participants would need to receive at least 25% of their Medicare revenue through an APM in 2018-2019, and this threshold would increase over time.
The bill would provide incentives for participation in private-payer APMs as well. And it would establish a technical advisory committee to review and recommend physician-developed APMs based on criteria developed through an open-comment process.
Finally, the bill would expand the use of Medicare data. Quality and utilization data would be posted on the Physician Compare website with the goal of helping patients to make more informed decisions about their care.
Furthermore, “qualified entities” would be allowed to provide analyses and underlying data to providers, although this provision is subject to privacy and security laws. And qualified clinical data registries would be allowed to purchase claims data.
To read the bill in full, visit Congress.gov. ![]()
Vibratory Angioedema in a Trumpet Professor

To let the punishment fit the crime
My object all sublime
I shall achieve in time –
To let the punishment fit the crime –
The punishment fit the crime.
–The Mikado
Gilbert and Sullivan
The Mikado’s ambition to give back in a jocular, but apt, way to the subjects who annoyed him is well known. Although I am no Mikado and don’t give back to anybody, aptly or otherwise, I have to admit that the impulse to do so does cross my mind. Maybe it crosses yours, too. Here are some people I sometimes meet. You might recognize them, and perhaps approve some of my suggested just deserts; punishments that fit the crime (PTFTC).
• The imaginary voice mail. "Call John Doe back right away," reads the message. "Use this number."
"You have reached 617-555-1234. This voice-mailbox has not yet been set up and cannot accept calls. Goodbye."
PTFTC: New outgoing message: "Dr. Rockoff is not actually a dermatologist yet. He will get back to you as soon as he becomes one."
• Playing with a full box. "You have reached 617-555-4321. This mailbox is full and cannot accept messages. Goodbye."
PTFTC: Outgoing message: "You have reached the doctor’s office. The doctor has filled his monthly quota of advice giving. Please call back next month, preferably before the 9th."
• Never mind who this is. "Doctor, please call me back right away. My itch is terrible and the medicine you prescribed doesn’t work at all." Click.
PTFTC: Outgoing message: Heavy breathing for 30 seconds. (Has to be for everyone, since we don’t know the number to call.)
• Mumbles. "Doctor, zy... Zyglub ... really need frtunsn mnidioos ... You ... to dhrsrsrs ... 617-96dlubgx ... Again, the number is zigd ... 52879 ... cloy."
PTFTC: Outgoing message. "Hello, Zyg! Glub Dr. Roc ... Bfflp! Yucca grapetz! ... Brgl nice day!"
• The anonymous e-mailer. "Hi, Doc! That cream is great! Can you call more into my pharmacy? Thanks! Skip ([email protected].)
PTFTC: Return e-mail: "Hey, Skip! Take care on that skateboard! Could I have your name? Thanks!"
• The mailed-scrip requester. "Please mail a prescription to Mr. Bean’s house," says the message. "It can’t be called or faxed in. It has to be mailed, with a 90-day supply and three refills."
PTFTC: "Dear Mr. Bean, Kindly send a detailed prescription request typed on an Underwood manual manufactured no later than 1936. Please include a stamped, self-addressed envelope with correct postage. Thank you."
• The walk-in scrip requester. "Doctor," says my front-desk person, catching me in the hall between patients. "Dimitriy is in the waiting room. He says he needs you to write out refills for the three medicines you gave him – the one for the scalp, the one for the body, and the one for the other part that he doesn’t want to tell me about. He says he’ll wait."
PTFTC: "Tell Dimitriy that I need to review his record in detail. I should be done first thing tomorrow morning."
• The highly-detailed-scrip requester. "Doctor, my insurer requires that my prescription be written in a specific way: ‘SuperDerm cream, six 45-gram tunes for a 90-day supply, apply twice a day, morning and night, substitution mandated on penalty of reporting to the Highest Authorities.’ After you’re done with that, I’ll instruct you on the correct way to write my three other prescriptions."
PTFTC: "Here are four blank prescription forms. Please fill them out exactly as your insurer requires. I will return in 21 minutes to review and sign them."
Turnabout is of course fair play. I am sure that many patients, mine and yours, could readily generate lists of our infractions along with appropriate penalties. For instance:
• The doctor kept me waiting so long that I got a parking ticket.
• He called in the solution when I specifically asked for the cream.
• I rearranged my whole schedule and hired a babysitter to keep my appointment, and then her office called the day before and canceled it.
To show my even-handedness, I have set up a Let-the-Punishment-Fit-the-Crime hotline for any patients reading this article. To take these calls, I have rented a special office just outside Fargo, North Dakota, at 701-555-6789, although I’m rarely there.
Oh yes, the voice mail hasn’t been set up yet.
Dr. Rockoff practices dermatology in Brookline, Mass. He is on the clinical faculty at Tufts University School of Medicine, Boston, and has taught senior medical students and other trainees for 30 years. Dr. Rockoff has contributed to the Under My Skin column in Skin & Allergy News since January 2002.