User login
On the Go Education: Mobile software in cardiothoracic training
In nearly every facet of our lives, our mobile devices have taken over. Managing our calendars, organizing our contacts, and planning our driving directions -- our devices have become invaluable and ubiquitously present. While the ease of use of smartphones and tablets puts the power of portable computing in the hands of everyone, mobile software seems to be particularly appreciated by young professionals, who seek the convenience of on-the-go functionality and feel comfortable with computing in the palms of their hands. Throughout the world of education and a breadth of academic fields, advanced software programs have gained momentum, recognized for their ability to provide up-to-date, on-the-ground information.
In recent years, there has been an explosion of new software programs applicable to the field of cardiothoracic surgery, and these applications have been well received by modern trainees.

"Mobile apps are incredibly convenient because they provide a means of accessing information while on the go," states Jonathan Spicer, a thoracic trainee at M.D. Anderson Cancer Center in Houston.
He continues, "Having the capacity to look up helpful information from my phone while in the operating room, on the ward, or in transit is particularly helpful."
In this article, we aim to highlight some of the more exciting and innovative mobile software programs available today for those interested in expanding their knowledge in cardiothoracic surgery or looking for an easy-to-access resource.
iBronch (Edward Bender), $0.99: iBronch is one of the many outstanding thoracic surgical apps developed by Ed Bender. This program aims to guide learners through the basic anatomy of the trachea and bronchial tree, with correlation of simultaneous images from a fiberoptic bronchoscope and along an anatomic airway diagram. Branches of the pulmonary tree are labeled on the schematic and the bronchoscopy images. This app is particularly useful for those trainees gaining comfort with bronchoscopic procedures; however, its utility may be less significant for more advanced learners. Regardless, this is a great program, quite helpful for the intended audience.
Thoracic Lymph Node Map (RADIOLOGiQ, LLC), Free: This app provides a color-coded lymph node map, associated with computed tomography images and adapted from the International Association for the Study of Lung Cancer (IASLC) lung cancer project. This program provides excellent illustrations of the anatomic definitions for each of the intrathoracic lymph node stations. This is helpful both in examining imaging studies of actual patients and in the operating room.
CT Journals (Edward Bender), Free: This software program serves as a scholarly journal aggregator for the field of cardiothoracic surgery. The app displays feeds for journals of interest, with inclusion of those relevant periodicals with the most readership and highest impact factors. Not only can one access the articles while online, abstracts can be saved for future use offline. This is a great resource, but users should be aware that access to the full articles is available only for those who have active accounts providing them access to the specific journals.
CTSNetWiki (Edward Bender), Free: Cardiothoracic Surgery Notes is an online review developed and maintained by residents in thoracic surgical training. This resource is a tremendous repository of information, compiling graphics, text, and other multimedia content on a breadth of topics. This app allows general review of a wide variety of cardiothoracic surgical problems and is appropriate for both the novice learner and as a review for those who are further along in their training.
SESATS IX (Edward Bender), Free: Perhaps the most valuable mobile software application out there, the Self Education Self Assessment in Thoracic Surgery (SESATS) IX application contains actual questions from previous versions of the SESATS. The mobile app even includes the associated images, videos, and CT scans that correspond with the questions. Although the program does not contain the latest version of SESATS, the utility of this app cannot be overestimated. This program is enormously helpful for self-testing, on-the-go topic-specific learning, and exam preparation. This is a real gem of a find, and it comes with a strong recommendation to all trainees for its download and use.
TSRA Primer of Cardiothoracic Surgery (Thoracic Surgery Residents' Association), $4.99: Produced by CT residents for CT residents, this is probably the most useful resource for the intern, junior resident, or new fellow who needs to brush up on the basics before rounds, in between consults, and before assisting in the OR. It's not comprehensive, but it is full of clinical pearls covering all the major divisions of cardiothoracic surgery. Many cardiac residents, especially younger integrated residents, have been waiting for a straightforward, practical tutorial like this for years. Beautiful and often interactive illustrations and videos really make this iBook memorable.
NCCN Guidelines (TIP Medical Communications), Free: Available for Android and iOS, this compendium of NCCN guidelines for 56 cancers and cancer-related topics is indispensible for trainees. The utility of having up-to-date, in-depth guidelines for diagnosis and staging of all commonly encountered malignancies cannot be overstated. Additional topics ranging from management of cancer-related emesis to lung cancer screening guidelines polish it off. A must have for anyone who treats cancer, not just thoracic surgeons.
CathSource (ECGSource, LLC), $3.99: Available for Android and iOS, CathSource is a mobile app that aims to teach cardiovascular medicine fellows about coronary anatomy, angiogram projections, and catheter-based hemodynamic measurements. Luckily, CT trainees stand to benefit from the app as well. It seems to be most helpful for learning coronary anatomy on the different projections, but it also has exhaustive hemodynamic formulae and tracings for more detailed review. The app has over 30 videos of normal and abnormal findings.
EchoSource (ECGSource, LLC), $4.99:It's the same idea as above, but -- you guessed it -- for echocardiography. Both are good tools, especially for residents who teach. Both apps take simple, conceptual drawings to start and expand them with real imaging. Residents who have spent a good deal of time in learning cath and echo may find these apps less useful.
Pocket Heart (PocketAnatomy), $9.99: This is an interactive, 3D heart model with a fairly detailed presentation of cardiac anatomy and added features such as pinning quizzes and case studies. While cardiothoracic residents ought to have the anatomy down, the app can be used to teach patients and families about various anatomical aspects of cardiac disease. The graphics leave a little to be desired, but anyone who teaches medical students or patients frequently will enjoy having this easy-to-understand tool handy.

This list of cardiothoracic-specific mobile applications is by no means exhaustive. Each physician's needs will be different, and the options are countless. Countless risk calculators, mnemonic databases, formula compendiums, and pharmacologic formularies clutter the app store. Note-taking suites such as OneNote and Evernote (personal favorite of both of the authors) can help turn the most hare-brained resident into a paragon of organizational excellence. Journal citation managers such as EndNote, Dropbox, Mendeley, and Yep can help organize and manage that virtual pile of unread but probably important journal articles that keeps building up in your inbox. Even the humble iBooks app can be used to read and mark up pdf files on the fly, all while syncing with your library on your home computer. Many hospital EMRs have mobile platforms with various levels of functionality for tablets and smartphones.
What is obvious is that mobile computing technology is rapidly changing medicine and surgery in many ways. Although each one of us strives to be a complete physician, utterly self-reliant and assured of one's clinical knowledge, we all must learn the basics first. Whether at the bus stop, in a resident lounge, or in the operating room, these mobile technologies help us to learn more efficiently while on the go.
If there are any gems we have forgotten to highlight, please send an e-mail to Thoracic Surgery News and we will try to present them in the future. We hope that the residents reading this column can find a new app they didn't know they needed, one that will energize them and push their learning to a new height. Just don't forget to look up once in a while.
Dr. Antonoff is a 2nd-year, Thoracic-track trainee at Washington University in St Louis. Dr. Zeigler is a 3rd-year, integrated Cardiothoracic Surgery trainee at Stanford (Calif.) University. They reported no relevant financial conflicts.
In nearly every facet of our lives, our mobile devices have taken over. Managing our calendars, organizing our contacts, and planning our driving directions -- our devices have become invaluable and ubiquitously present. While the ease of use of smartphones and tablets puts the power of portable computing in the hands of everyone, mobile software seems to be particularly appreciated by young professionals, who seek the convenience of on-the-go functionality and feel comfortable with computing in the palms of their hands. Throughout the world of education and a breadth of academic fields, advanced software programs have gained momentum, recognized for their ability to provide up-to-date, on-the-ground information.
In recent years, there has been an explosion of new software programs applicable to the field of cardiothoracic surgery, and these applications have been well received by modern trainees.
"Mobile apps are incredibly convenient because they provide a means of accessing information while on the go," states Jonathan Spicer, a thoracic trainee at M.D. Anderson Cancer Center in Houston.
He continues, "Having the capacity to look up helpful information from my phone while in the operating room, on the ward, or in transit is particularly helpful."
In this article, we aim to highlight some of the more exciting and innovative mobile software programs available today for those interested in expanding their knowledge in cardiothoracic surgery or looking for an easy-to-access resource.
iBronch (Edward Bender), $0.99: iBronch is one of the many outstanding thoracic surgical apps developed by Ed Bender. This program aims to guide learners through the basic anatomy of the trachea and bronchial tree, with correlation of simultaneous images from a fiberoptic bronchoscope and along an anatomic airway diagram. Branches of the pulmonary tree are labeled on the schematic and the bronchoscopy images. This app is particularly useful for those trainees gaining comfort with bronchoscopic procedures; however, its utility may be less significant for more advanced learners. Regardless, this is a great program, quite helpful for the intended audience.
Thoracic Lymph Node Map (RADIOLOGiQ, LLC), Free: This app provides a color-coded lymph node map, associated with computed tomography images and adapted from the International Association for the Study of Lung Cancer (IASLC) lung cancer project. This program provides excellent illustrations of the anatomic definitions for each of the intrathoracic lymph node stations. This is helpful both in examining imaging studies of actual patients and in the operating room.
CT Journals (Edward Bender), Free: This software program serves as a scholarly journal aggregator for the field of cardiothoracic surgery. The app displays feeds for journals of interest, with inclusion of those relevant periodicals with the most readership and highest impact factors. Not only can one access the articles while online, abstracts can be saved for future use offline. This is a great resource, but users should be aware that access to the full articles is available only for those who have active accounts providing them access to the specific journals.
CTSNetWiki (Edward Bender), Free: Cardiothoracic Surgery Notes is an online review developed and maintained by residents in thoracic surgical training. This resource is a tremendous repository of information, compiling graphics, text, and other multimedia content on a breadth of topics. This app allows general review of a wide variety of cardiothoracic surgical problems and is appropriate for both the novice learner and as a review for those who are further along in their training.
SESATS IX (Edward Bender), Free: Perhaps the most valuable mobile software application out there, the Self Education Self Assessment in Thoracic Surgery (SESATS) IX application contains actual questions from previous versions of the SESATS. The mobile app even includes the associated images, videos, and CT scans that correspond with the questions. Although the program does not contain the latest version of SESATS, the utility of this app cannot be overestimated. This program is enormously helpful for self-testing, on-the-go topic-specific learning, and exam preparation. This is a real gem of a find, and it comes with a strong recommendation to all trainees for its download and use.
TSRA Primer of Cardiothoracic Surgery (Thoracic Surgery Residents' Association), $4.99: Produced by CT residents for CT residents, this is probably the most useful resource for the intern, junior resident, or new fellow who needs to brush up on the basics before rounds, in between consults, and before assisting in the OR. It's not comprehensive, but it is full of clinical pearls covering all the major divisions of cardiothoracic surgery. Many cardiac residents, especially younger integrated residents, have been waiting for a straightforward, practical tutorial like this for years. Beautiful and often interactive illustrations and videos really make this iBook memorable.
NCCN Guidelines (TIP Medical Communications), Free: Available for Android and iOS, this compendium of NCCN guidelines for 56 cancers and cancer-related topics is indispensible for trainees. The utility of having up-to-date, in-depth guidelines for diagnosis and staging of all commonly encountered malignancies cannot be overstated. Additional topics ranging from management of cancer-related emesis to lung cancer screening guidelines polish it off. A must have for anyone who treats cancer, not just thoracic surgeons.
CathSource (ECGSource, LLC), $3.99: Available for Android and iOS, CathSource is a mobile app that aims to teach cardiovascular medicine fellows about coronary anatomy, angiogram projections, and catheter-based hemodynamic measurements. Luckily, CT trainees stand to benefit from the app as well. It seems to be most helpful for learning coronary anatomy on the different projections, but it also has exhaustive hemodynamic formulae and tracings for more detailed review. The app has over 30 videos of normal and abnormal findings.
EchoSource (ECGSource, LLC), $4.99:It's the same idea as above, but -- you guessed it -- for echocardiography. Both are good tools, especially for residents who teach. Both apps take simple, conceptual drawings to start and expand them with real imaging. Residents who have spent a good deal of time in learning cath and echo may find these apps less useful.
Pocket Heart (PocketAnatomy), $9.99: This is an interactive, 3D heart model with a fairly detailed presentation of cardiac anatomy and added features such as pinning quizzes and case studies. While cardiothoracic residents ought to have the anatomy down, the app can be used to teach patients and families about various anatomical aspects of cardiac disease. The graphics leave a little to be desired, but anyone who teaches medical students or patients frequently will enjoy having this easy-to-understand tool handy.
This list of cardiothoracic-specific mobile applications is by no means exhaustive. Each physician's needs will be different, and the options are countless. Countless risk calculators, mnemonic databases, formula compendiums, and pharmacologic formularies clutter the app store. Note-taking suites such as OneNote and Evernote (personal favorite of both of the authors) can help turn the most hare-brained resident into a paragon of organizational excellence. Journal citation managers such as EndNote, Dropbox, Mendeley, and Yep can help organize and manage that virtual pile of unread but probably important journal articles that keeps building up in your inbox. Even the humble iBooks app can be used to read and mark up pdf files on the fly, all while syncing with your library on your home computer. Many hospital EMRs have mobile platforms with various levels of functionality for tablets and smartphones.
What is obvious is that mobile computing technology is rapidly changing medicine and surgery in many ways. Although each one of us strives to be a complete physician, utterly self-reliant and assured of one's clinical knowledge, we all must learn the basics first. Whether at the bus stop, in a resident lounge, or in the operating room, these mobile technologies help us to learn more efficiently while on the go.
If there are any gems we have forgotten to highlight, please send an e-mail to Thoracic Surgery News and we will try to present them in the future. We hope that the residents reading this column can find a new app they didn't know they needed, one that will energize them and push their learning to a new height. Just don't forget to look up once in a while.
Dr. Antonoff is a 2nd-year, Thoracic-track trainee at Washington University in St Louis. Dr. Zeigler is a 3rd-year, integrated Cardiothoracic Surgery trainee at Stanford (Calif.) University. They reported no relevant financial conflicts.

Reconsidering comfort care
Recently, members of our palliative care team participated in the care of a man approaching the end of his life. The patient had suffered an in-hospital cardiac arrest 4 weeks earlier, and though he had survived the immediate event, it resulted in anoxic encephalopathy, which rendered him incapable of making decisions.
When it became clear that the patient was declining despite full support, the hospital’s ethics committee was convened to determine goals of care and next steps, as the patient had no family or surrogate decision maker. After determination that the hospital staff had exercised due diligence in attempting to locate a surrogate, the physicians involved reviewed the patient’s case and recommended a change in goals to comfort care. More than one member of the committee expressed confusion as to what interventions are and are not included in comfort care, including medically administered nutrition and hydration (MANH).
Comfort care has traditionally included medications for distressing symptoms (pain, dyspnea, nausea), personal care for hygiene, and choice of place of death (home, hospital, nursing facility), usually with the assistance of a hospice agency.
As the number and complexity of interventions used near the end of life expand, clinicians and hospital staff report confusion about whether these interventions, generally considered to be life-sustaining treatments, can also be considered comfort care. We generally find that when interventions are considered in the context of the patient’s goals of care, the dilemma is clarified. Often the situation is made more complicated by considering the interventions before settling on goals. Broadly speaking, goals of care are derived from a careful consideration (by patient, physician, and family) of the natural history of the illness, expected course and prognosis, and patient preferences.
In the case of the above-referenced patient, we were unable to ascertain his goals because of neurological impairment. We did know, however, that the patient had steadfastly avoided hospitals and medical care of any kind. The attending hospitalist, pulmonologist, and palliative care physician agreed that the patient’s clinical status was declining despite all available interventions, and that his constellation of medical problems constituted a terminal condition. The physicians agreed that future ICU admission, resuscitation, and other new interventions would only prolong his dying process, but not permit him to live outside the hospital. At that time, the patient was receiving nutrition and hydration via a Dobhoff tube, and was tolerating enteral nutrition without excessive residuals or pulmonary secretions.
As with other interventions, whether or not to consider MANH a part of comfort care is individualized. In this patient’s case, in the absence of evidence that he would not want MANH, it was continued. Other patients have expressed the wish that they would under no circumstances accept MANH while receiving comfort care. Both are correct as long as they reflect that patient’s wishes.
With respect to other interventions – including but not limited to BiPAP, inotrope infusion, chemotherapy, radiation therapy, and transfusions – whether or not they provide comfort is a decision to be made jointly by the patient and physician(s). As advances in medicine allow patients to live longer with serious illness, the definition of comfort care must also expand.
Dr. Fredholm and Dr. Bekanich are codirectors of Seton Palliative Care, part of the University of Texas Southwestern Residency Programs in Austin.

Peptides
Peptides have recently generated interest as biologically active compounds incorporated into cosmeceutical products intended to treat aging skin. Peptides are composed of chains of amino acids, which are derived from DNA transcription. In typical cellular settings, peptides communicate or signal between DNA and the cellular network. Consequently, they are thought to be capable of being used or exploited to direct cells to maintain youthful behavior, yielding a stable, nonaging manifestation. In addition, peptides can be rendered by protein degradation, thus forming an essential feedback inhibition and upregulation loop (Facial Plast. Surg. 2009;25:285-9). Downregulation of metalloproteinases (MMPs), notably collagenase, by peptides is a good example, as well as a window into why peptides have sparked interest within antiaging research (Dermatol. Surg. 2005;31[7 Pt 2]:832-6, discussion 836).
Researchers at the University of Tennessee, Memphis, performed some of the seminal work that has paved the way for understanding how to harness the activity of natural peptides by showing that the production of the extracellular matrix in fibroblasts is fostered by a pentapeptide subfragment of propeptide of type I collagen (J. Biol. Chem. 1993;268:9941-4).
But the foundational work setting the stage for development of cosmeceutical peptides has been in the research for ameliorating wounds, which dates back several decades and can be traced to the use of yeast extracts for wound care in the 1930s, later leading to the extraction of a usable protein fraction (Dermatol. Ther. 2007;20:343-9; Clin. Ther. 1991;13:430-4). Signal peptides, enzyme-inhibitor peptides, neurotransmitter-inhibitor peptides (or neuropeptides), and carrier peptides are the four primary classes of topical or cosmeceutical peptides. This column will offer a brief summary of each and acknowledge additional recent research. Future columns may address each of these peptide categories pertinent to antiaging cosmeceuticals.
Signal peptides
Specific bioactive amino acid chains have been discovered in recent years that promote human skin dermal fibroblast growth in vitro and in vivo, and reduce the length and depth of wrinkles (Dermatol. Ther. 2007;20:343-9). The most popular signal peptide is the lysine-threonine-threonine-lysine-serine (KTTKS) located on type 1 procollagen. To enhance epidermal delivery, it has been linked to palmitic acid, thus the marketed version (Matrixyl) is a palmitoyl pentapeptide, which has been shown to augment the synthesis of collagen by fibroblasts and yield reductions in fine lines and wrinkles, according to quantitative analysis and self-reports (J. Biol. Chem. 1993;268:9941-4; Int. J. Cosmet. Sci. 2005;27:155-60).
New signal peptides are expected to be stronger and better targeted than those presently marketed (Facial Plast. Surg. 2009;25:285-9). Signal peptides promote the synthesis of matrix proteins, collagen in particular, which leads to firmer, younger looking skin, and also augments levels of elastin, proteoglycans, glycosaminoglycans, and fibronectin (Int. J. Cosmet. Sci. 2009;31:327-45).
Enzyme-inhibitor peptides
These peptides suppress enzymatic activity either directly or indirectly. Enzyme-inhibiting peptides extracted from soybeans have been incorporated into antiaging, moisturizing, and cleansing products as well as hair care formulations (Int. J. Cosmet. Sci. 2009;31:327-45). In a small study in 10 white females, a 2% soya biopeptide performed better than did placebo in collagen and glycosaminoglycan promotion (Int. J. Cosmet. Sci. 1999;21:299-311).
More recently, a rice peptide derived from germinated black rice, which has been used in traditional Asian medicines, was found to block MMP activity and dose-dependently stimulate hyaluronan synthase 2 gene expression (a twofold increase) in human keratinocytes (J. Microbiol. Biotechnol. 2007;17:271-9). Such peptides are found in antiaging and hair products.
In addition, antioxidant activity, a high affinity to chelate with copper, and the capacity to suppress tyrosinase activity and keratinocyte apoptosis have been displayed by the enzyme-inhibiting peptide sericin, derived from the silkworm Bombyx mori (Int. J. Cosmet. Sci. 2009;31:327-45). Sericin also has been shown to facilitate the intrinsic moisturization of skin by restoring amino acids and imparting an occlusive effect (J. Cosmet. Dermatol. 2005;4:250-7).
Neuropeptides
Neuropeptides are known to mediate skin inflammation and, thus, contribute as an underlying aspect of reactive skin conditions (Eur. J. Dermatol. 2010;20:731-7). Also known as neurotransmitter-affecting peptides, these compounds are included in cosmeceuticals to mimic the action of botulinum toxin A. Essentially, they inhibit acetylcholine release at the neuromuscular junction.
The best known of these is acetyl hexapeptide-3, marketed as Argireline. Attached to acetic acid residue, this synthetic peptide, based on the N-terminal end of the synaptosomal-associated protein (SNAP)–25 that blocks soluble N-ethylmaleimide-sensitive factor attachment protein receptor (SNARE) complex development and catecholamine release (Int. J. Cosmet. Sci. 2009;31:327-45), is thought to suppress the release of neurotransmitters, easing facial tension, and thus reducing wrinkles. Evidence of its effectiveness has appeared largely in proprietary studies. Much more research is necessary to establish the suitability of this form of peptide for topical antiaging applications.
Carrier peptides
Carrier peptides stabilize and transport trace elements essential for healing wounds and enzymatic processes (Dermatol. Ther. 2007;20:343-9). Although it also confers signal peptide effects, glycyl-L-histidyl-L-lysine (GHK), a naturally occurring tripeptide initially isolated from human plasma (Nat. New Biol. 1973;243:85-7), is known mainly as a carrier peptide. It is typically linked with copper, given its high affinity for it, and several studies have shown that copper peptide molecules using GHK (glycyl-L-histidyl-L-lysine-Cu2+ or GHK-Cu) deliver varied restorative effects, including the improvement in the appearance of fine lines and wrinkles (Dermatol. Ther. 2007;20:343-9). This tripeptide complex has been used for many years to accelerate wound healing and is found in several moisturizers. Significantly, the GHK-Cu complex also has been shown to stimulate collagen synthesis (FEBS Lett. 1988;238:343-6) and to augment sulfated proteoglycans levels in fibroblast cultures as well as experimental animal wound models (J. Clin. Invest. 1993;92:2368-76). GHK-Cu also influences tissue remodeling by raising the levels of MMP-2 and tissue inhibitors of metalloproteinases (TIMP-1 and TIMP-2) (Life Sci. 2000;67:2257-65). More research is necessary to ascertain the efficacy of copper peptide as an antiaging agent.
Recent general research findings
A double-blind clinical study in 2004 of 20 healthy women volunteers between 40 and 62 years of age revealed that a gel formula containing 3% of a collagen-like hexapeptide significantly reduced the total surface of wrinkles as well as the number and average depth of wrinkles (Int. J. Tissue React. 2004;26:105-11).
In 2005, a literature review of studies published on the effects and practical applications of peptides as topical agents for skin improvement showed that peptide cosmeceuticals seem to exhibit the potential to blunt the visual effects of aging on the skin, and that formulations must be stable, absorbed into the skin, and biologically active (Dermatol. Surg. 2005;31[7 Pt 2]:832-6, discussion 836).
In 2007, investigators reported on the development of a new hand care formulation derived from wool peptides. The keratin fraction from wool was shown through long-term in vivo studies to enhance cutaneous hydration, water-holding capacity, and elasticity in volunteers with dry skin. In addition, the researchers found that the keratin peptide preparation blunted some of the adverse effects due to surfactant exposure (J. Cosmet. Sci. 2007;58:99-107).
That same year, researchers reported that they prepared two stable cosmetic formulations, an emulsion with an external aqueous phase for normal-to-dry skin and a gel for oily skin, with acetyl hexapeptide-8 (Argireline) as the active ingredient (J. Cosmet. Sci. 2007;58:157-71).
Previously, Argireline was shown in healthy women volunteers, in a skin topography analysis of an oil/water (O/W) emulsion containing 10% of the hexapeptide, to have decreased wrinkle depth up to 30% after 30 days of treatment. Researchers determined that the synthetic hexapeptide significantly suppresses neurotransmitter release comparably to botulinum toxin A, with fewer side effects but lower efficacy. They also noted that Argireline displayed no in vivo oral toxicity and evoked no irritation at high doses, suggesting that the peptide is a topical nontoxic antiwrinkle alternative to botulinum toxins (Int. J. Cosmet. Sci. 2002;24:303-10).
In 2008, investigators tested a hydrolyzed keratin peptide derived from wool on skin in two different formulations. Long-term in vivo studies yielded significant differences between the control and treated sites, with the treated areas exhibiting an increase in hydration and elasticity because of keratin peptide application. The investigators also noted measurements showing that the keratin formulations supported skin barrier integrity, enhancing its water-holding capacity. In particular, the formulation combining keratin peptide with internal wool lipids in a liposome suspension showed promising effects that they deemed appropriate for new cosmetic products (Skin Res. Technol. 2008;14:243-8).
Conclusion
Peptide cosmeceuticals represent a new and popular choice for consumers shopping for antiaging products. Are they worthy options? As always, the capacity of topical products to penetrate the skin and exert a biologic impact is of great significance. Some products appear to exert antiaging effects, but most evidence of effectiveness has emerged from in vitro studies or small in vivo investigations. More research, in the form of large randomized controlled trials, is necessary to establish the effectiveness of these intriguing products. As it is, though, numerous products are on the market and this area of research and product development shows promise.
Dr. Baumann is chief executive officer of the Baumann Cosmetic & Research Institute in Miami Beach. She founded the cosmetic dermatology center at the University of Miami in 1997. Dr. Baumann wrote the textbook "Cosmetic Dermatology: Principles and Practice" (McGraw-Hill, April 2002), and a book for consumers, "The Skin Type Solution" (Bantam, 2006). She has contributed to the Cosmeceutical Critique column in Skin & Allergy News since January 2001 and joined the editorial advisory board in 2004. Dr. Baumann has received funding for clinical grants from Allergan, Aveeno, Avon Products, Galderma, Mary Kay, Medicis Pharmaceuticals, Neutrogena, Philosophy, Stiefel, Topix Pharmaceuticals, and Unilever.

FDA approves ibrutinib for previously treated CLL

Credit: Rhoda Baer
The US Food and Drug Administration (FDA) has expanded the indication for the Bruton’s tyrosine kinase inhibitor ibrutinib (Imbruvica).
Last November, the drug gained accelerated approval as a “breakthrough therapy” for patients with mantle cell lymphoma who had received at least 1 prior therapy.
Now, ibrutinib has been granted accelerated approval to treat patients with chronic lymphocytic leukemia (CLL) who have received at least 1 prior therapy.
The accelerated approval process allows the FDA to approve a drug based on a surrogate or intermediate endpoint that is reasonably likely to predict clinical benefit. Both approvals of ibrutinib are based on observed benefits in overall response rates.
Ibrutinib also received priority review and orphan-product designation for CLL.
Trial results
The accelerated approval of ibrutinib is based on results of a phase 1b/2 study, which included 48 patients with relapsed or refractory CLL. The patients had been diagnosed an average of 6.7 years prior to study enrollment and had received 4 prior therapies.
All patients received 420 mg of ibrutinib orally until disease progression or the development of unacceptable toxicity.
The overall response rate was 58.3%, and all of these were partial responses. The median duration of response was not reached (range, 5.6 months to more than 24.2 months).
Study investigators have not established whether ibrutinib confers improvements in survival or disease-related symptoms.
The median treatment duration was 15.6 months. Ten percent of patients (n=5) discontinued treatment due to adverse events. Three of these patients developed infections, and 2 had subdural hematomas. Thirteen percent of patients experienced adverse events that led to dose reductions.
The most commonly occurring adverse events (all grades and grade 3/4, respectively) included thrombocytopenia (71%, 10%), diarrhea (63%, 4%), bruising (54%, 2%), neutropenia (54%, 27%), anemia (44%, 0%), upper respiratory tract infection (48%, 26%), fatigue (31%, 4%), musculoskeletal pain (27%, 6%), rash (27%, 0%), pyrexia (25%, 2%), constipation (23%, 2%), peripheral edema (23%, 0%), arthralgia (23%, 0%), nausea (21%, 2%), stomatitis (21%, 0%), sinusitis (21%, 6%), and dizziness (21%, 0%).
Ibrutinib is being developed and commercialized by Pharmacyclics and Janssen Biotech, Inc. For full prescribing information, visit http://www.imbruvica.com/downloads/Prescribing_Information.pdf. ![]()
New insight into megakaryocytic leukemias

Researchers have linked a mutation causing Down syndrome-associated leukemias to developmental abnormalities in megakaryocytes.
Experiments showed that the leukemia-associated GATA1 mutant, GATA1s, interferes with the enzyme calpain 2, which acts as an initial trigger for a chain of reactions that determines the size and shape of megakaryocytes.
This interference hinders the normal process of cellular enlargement and platelet production.
“It’s like there’s a long pipeline and there’s a clog,” explained study author Adam N. Goldfarb, MD, of the University of Virginia School of Medicine in Charlottesville.
“We think it’s this pipeline that’s getting clogged in this disease and other diseases.”
Dr Goldfarb and his colleagues explained this discovery in Developmental Cell.
The researchers found that leukemia cells with the GATA1s mutation display a critical deficiency of calpain 2. And the enzyme’s absence leaves them stuck in an early stage of development, contributing to the development of Down syndrome-associated leukemias.
That could be the case in other forms of leukemia as well, Dr Goldfarb noted.
“These leukemias in Down syndrome aren’t that common,” he said, “but this finding has implications for other leukemias in that it lets us understand basic growth and development patterns.”
The team discovered that restoring calpain 2 expression in affected cells fixed the problem and allowed normal megakaryocyte development to resume.
As such, the researchers speculate that calpain deficiency could be a key defect in Down syndrome-associated leukemias, which provides a potential target for therapeutic development.
The findings might also help us find a way to mimic the natural process that allows a subset of Down syndrome-associated leukemias to disappear spontaneously. ![]()
Study shows parents well-adjusted after child’s SCT

Credit: George Hodan
Although they initially show signs of psychological distress, parents of children undergoing stem cell transplant (SCT) are as resilient as the children themselves, new research suggests.
Investigators evaluated psychological adjustment in 171 children undergoing SCT and their parents.
Results in the children, which were previously reported in Pediatrics, suggested they were well-adjusted after SCT, whether or not they had received therapy to promote psychological well-being.
Results in the parents, which are now available in Biology of Blood and Marrow Transplantation, are similar.
“The aim of the study was to examine an intervention to promote positive adjustment of patients and their parents,” said study author Jennifer Lindwall, PhD, of St Jude Children’s Research Hospital and Children’s Hospital of Colorado.
The 171 parent/child pairs were randomized to receive a child-targeted intervention, a child and parent intervention, or standard care. The child intervention consisted of massage and humor therapy, and the parent intervention included massage and relaxation/imagery training.
The investigators measured psychological distress and positive affect from the time of admission for a child’s SCT until 6 weeks after the procedure.
The team also measured depression, post-traumatic stress disorder (PTSD), and benefit-finding (potential positive outcomes that result from enduring a difficult experience) at the time of admission and 24 weeks after.
There were no significant differences among the 3 groups with regard to measures of parental distress. And distress decreased significantly from baseline to week 6.
Improvements also occurred over time with regard to positive affect. However, parents in the child/parent-intervention group and child-only-intervention group experienced significant benefits over the standard-care group.
On the other hand, there were no significant differences among the 3 groups with regard to depression, PTSD, and benefit-finding.
Parents from all groups experienced significant decreases in depression and PTSD from baseline to the 24-week mark. And they showed significant increases in benefit-finding.
“In many respects, a parent’s distress parallels the child’s distress,” Dr Lindwall said. “As things get better for the child, they get better for the parent as well.”
Dr Lindwall noted that, although this study suggests resiliency is the norm, there are parents who remain distressed as a result of their child’s illness.
“Our challenge now is to predict which parents are at the highest risk for difficulties,” she said, “and to design interventions that can help these parents cope during their child’s medical challenges.” ![]()
Mutant HSCs appear to drive AML
A new study has shown that hematopoietic stem cells (HSCs) can acquire mutations in DNMT3A, and this may be the first step in initiating acute myeloid leukemia (AML).
These HSCs also appear to be a means of treatment resistance and may trigger relapse in patients with AML, investigators reported in Nature.
“Our discovery lays the groundwork to detect and target the pre-leukemic stem cell and thereby potentially stop the disease at a very early stage, when it may be more amenable to treatment,” said study author John Dick, PhD, of the University of Toronto in Ontario, Canada.
“Now, we have a potential tool for earlier diagnosis that may allow early intervention before the development of full AML. We can also monitor remission and initiate therapy to target the pre-leukemic stem cell to prevent relapse.”
Dr Dick and his colleagues analyzed 71 samples from AML patients and discovered that 17 of them (24%) carried mutations in DNMT3A. Fifteen of those samples (88%) also had mutated NPM1.
Both mutations were present in patients’ blasts. But 12 patients (70.5%) had T cells that contained DNMT3A mutations but no NPM1 mutations. FLT3-ITD mutations were also present in blasts but not T cells in 2 patients.
These results suggest DNMT3A mutations arise earlier than NPM1 and FLT3-ITD mutations, the researchers said.
To determine the origin of mutated DNMT3A, they analyzed hematopoietic stem and progenitor cell populations from 11 patients with DNMT3A and NPM1 mutations.
While both types of mutations were present in CD33+ blasts, mutant DNMT3A was present without mutant NPM1 across the spectrum of mature and progenitor cell populations.
Experiments in mice revealed that DNMT3A-mutant HSCs had a multilineage repopulation advantage over non-mutant HSCs. This, the investigators said, establishes the mutant cells as pre-leukemic HSCs.
The team also found the pre-leukemic HSCs in samples taken from AML patients in remission, which showed that the cells survived chemotherapy.
The researchers therefore concluded that DNMT3A mutations arise early in AML evolution and lead to a clonally expanded pool of pre-leukemic HSCs from which AML develops.
“By peering into the ‘black box’ of how cancer develops during the months and years prior to when it is first diagnosed, we have demonstrated a unique finding,” Dr Dick said. “People tend to think relapse after remission means chemotherapy didn’t kill all the cancer cells.”
“Our study suggests that, in some cases, the chemotherapy does, in fact, eradicate AML. What it does not touch are the pre-leukemic stem cells that can trigger another round of AML development and, ultimately, disease relapse.”
Dr Dick believes this finding could spawn accelerated drug development to specifically target DNMT3A. The discovery should also provide impetus for researchers to look for pre-cancerous cells in AML patients with other mutations. ![]()
Progress on Reducing Readmissions
The Hospital Readmission Reduction Program (HRRP)[1] contained within the Affordable Care Act focused national and local attention on hospital resources and efforts to reduce hospital readmissions. Driven by the Centers for Medicare and Medicaid Services' (CMS) desire to pay for value instead of volume, the response of hospitals and health systems appears to be yielding change across the United States.[2] A number of recent publications in the Journal of Hospital Medicine (JHM) exemplify the keen interest in reducing readmissions, while providing guidance regarding interventions and where we might target future research. Evidence from an exemplary systematic review of the pediatric literature confirms some experience in adults regarding effective interventionsall studies were multifacetedand highlights the importance of identifying a single healthcare provider or centrally coordinated hub to assume responsibility for extended care transition and follow‐up.[3] Notably, studies of pediatric patients and their families document the effectiveness of enhanced inpatient education and engagement while in the hospital.[3] Unfortunately, a study among adults at a top‐ranked academic institution indicates poor communication among nurses and physicians regarding patient discharge education.[4] Efforts to improve nursephysician communication by redesigning the hospitalist model of care delivery at a Veterans Affairs (VA) institution appeared to enhance perceptions of communication among the care team members and reduced length of stay, but disappointingly there was no reduction in readmission rates.[5] Studies such as this are essential in identifying which specific interventions may actually change outcomes such as readmission rates.
In 1984, a diminutive elderly woman provocatively squawked Where's the beef?, launching a highly successful advertising campaign for Wendy's hamburger chain.[6] This catchphrase may aptly describe Bradley and colleague's survey study of the State Action on Avoidable Rehospitalization (STAAR) and Hospital‐to‐Home (H2H) campaigns.[7] Auerbach and colleagues eloquently stated in a 2007 New England Journal of Medicine perspective[8] how they had witnessed recent initiatives that emphasize dissemination of innovative but unproven strategies, an approach that runs counter to the principle of following the evidence[9] in selecting interventions that meet quality and safety goals.[10] I firmly agree with this assessment, and 6 years later believe we should be more thoughtful about potentially repeating implementation of unproven strategies.
Do we know if the interventions recommended by H2H and STAAR are what hospital care teams should be attempting? Even the authors mention that definitive evidence on their effectiveness is lacking. The H2H and STAAR programs certainly encourage some theoretically laudable activitiesmedication reconciliation by nurses, alerting outpatient physicians within 48 hours of patient discharge, and providing skilled nursing facilities the direct contact number of the inpatient treating physician for patients transferred. However, do these efforts actually improve patient outcomes? Before embarking on state or national campaigns to improve care, we should consider carefully what are the best evidence‐based interventions. Remarkably, some prior evidence indicates that direct communication between the hospital‐based physician and primary care provider (PCP) may not actually impact patient outcomes.[11] Newer research published in JHM confirms my belief that the PCP needs to be engaged by hospitalists during a hospitalization. Lindquist's research group at Northwestern nicely demonstrated how communication between a patient's PCP and the admitting hospitalist, complemented by contact between the PCP and patient within 24 hours postdischarge, reduced the probability of a medication discrepancy by 70%.[12] Although no evaluation of the effect on readmissions was reported, this study may provide information on causality related to the importance of PCP involvement in the care of hospitalized patients.
Numerous publications now document research on successfully implemented programs that lowered hospital readmissions, and are cited by CMS as evidence‐based interventions.[13] Projects Re‐Engineered Discharge (RED)[14] and Better Outcomes by Optimizing Safe Transitions[15] target the hospital discharge process, and both appear to lower hospital readmission rates. The Care Transitions Intervention (CTI),[16] Transitional Care Model (TCM),[17] and the Guided Care model[18] all leverage nurse practitioners or nurses to protect elderly patients during what can be a perilous care transition from hospital to home. CTI and TCM have been further validated in effectiveness studies.[19, 20] Two recent systematic reviews provide further insight into the complexity of efforts to reduce 30‐day rehospitalizations, but unfortunately do not reveal a desired silver bullet. The first focused exclusively on interventions to reduce 30‐day rehospitalization, and concluded that no single intervention was successful alone, but identified interventions bridging the hospital‐to‐home transition (eg, CTI), and a bundle of interventions such as Project RED as showing efficacy.[21] The second review more broadly sought to evaluate the effectiveness of hospital‐initiated strategies to prevent postdischarge adverse events (AEs) such as readmissions and emergency department visits,[22] stating Because of scant evidence, no conclusions could be reached on methods to prevent postdischarge AEs. The researchers' sobering conclusion stated that strategies to improve patient safety at hospital discharge remain unclear.
With rising federal penalties for higher‐than‐expected readmission rates, many hospital leaders eagerly join collaboratives aiming to reduce hospital readmissions. H2H appears to be among the largest, reporting >600 hospital participants, and STAAR has been active since 2009, with a recently published qualitative study identifying gaps in evidence for effective interventions, and deficits in quality improvement capabilities among some organizations as implementation challenges.[23] Notably, the survey by Bradley and colleagues documented that just half of the hospitals had a quality improvement (QI) team focused on reducing readmissions. Although laudable in their goals, H2H and STAAR may represent expensive commitments of staff and time to efforts that may not improve outcomes. Importantly, recently published research evaluating QI studies showed concerning results among patients with chronic obstructive pulmonary disease (COPD). A randomized controlled trial (RCT) conducted at 6 Glasgow hospitals evaluated supported self‐management (home visits by nurses and thorough education) by patients with moderate to severe COPD, but documented no changes in hospitalization or mortality.[24]Another RCT at 20 sites evaluated a comprehensive care management program to prevent hospitalizations among 960 VA patients with COPD.[25] It had to be stopped early due to elevated all‐cause mortality in the intervention group, and there was no difference in hospitalization rates.
Moving forward, QI efforts to reduce hospital readmissions should utilize proven interventions unless they are part of a rigorous trial. The emerging field of implementation science (the scientific study of methods to promote the systematic uptake of research findings and other evidence‐based practices into routine practice, and hence, to improve the quality and effectiveness of health services[26]) needs to be applied to additional research in this area.[27] Another consideration would be for CMS and funders such as the Commonwealth Foundation or The Robert Wood Johnson Foundation to encourage and fund merging of current initiatives to move away from competition and provide clarity to community hospitals. Regardless, such collaboration should still undertake formal evaluation to discern best approaches to implementation. I applaud the authors for recognizing that Input from hospitalists who are often critical links among inpatient and outpatient care and between patients and their families is strongly needed to ensure hospitals focus on what strategies are most effective for successful transitions from hospital to home. Yet, I wonder why neither of the large STAAR and H2H initiatives actively partnered with hospitalists and their specialty society (Society of Hospital Medicine) directly in the leadership of these initiatives? On the other hand, why not ask medical societies engaged in delivery of primary care (eg, American Academy for Family Practice, American College of Physicians, or Society of General Internal Medicine), especially to elderly patients (American Geriatric Society), to contribute directly? Involvement on an advisory board is likely not sufficient. Prior efforts document the willingness of these organizations to collaborate and achieve consensus on principles for transitions of care.[28] As powerfully articulated 6 years ago, [W]e must pursue the solutions to quality and safety problems in a way that does not blind us to harms, squander scarce resources, or delude us about the effectiveness of our efforts.[8]
Acknowledgments
Disclosure: Dr. Williams is principal investigator for Project BOOST (
- Centers for Medicare and Medicaid Services. Readmissions reduction program. Available at: http://www.cms.gov/Medicare/Medicare‐Fee‐for‐service‐Payment/AcuteInpatientPPS/Readmissions‐Reduction‐Program.html. Accessed December 30, 2013.
- , , , , , . Medicare readmission rates showed meaningful decline in 2012. Medicare Medicaid Res Rev. 2013;3(2):E1–E12.
- , , , . Pediatric hospital discharge interventions to reduce subsequent utilization: a systematic review [published online ahead of print December 20, 2013]. J Hosp Med. doi: 10.1002/jhm.2134.
- , , . Communicating discharge instructions to patients: a survey of nurse, intern, and hospitalist practices. J Hosp Med. 2013;8:36–41.
- , , , et al. An academic hospitalist model to improve healthcare work communication and learner education: results from a quasi‐experimental study at a Veterans Affairs medical center. J Hosp Med. 2013;8:702–710.
- Wikipedia website. Where's the beef? Available at: http://en.wikipedia.org/wiki/Where's_the_beef%3F. Accessed November 4, 2013.
- , , , , , . Quality collaboratives and campaigns to reduce readmissions: what strategies are hospitals using? J Hosp Med. 2013;8(11):601–608.
- , , . The tension between needing to improve care and knowing how to do it. N Engl J Med. 2007;357(6):608–613.
- , , , . Accidental deaths, saved lives, and improved quality. N Engl J Med. 2005;353(13):1405–1409.
- , , . Clinical Improvement Action Guide. Oak Brook, IL: Joint Commission Resources; 1998.
- , , , et al. Association of communication between hospital‐based physicians and primary care providers with patient outcomes. J Gen Int Med. 2009;24(3):381–386.
- , , , , . Primary care physician communication a hospital discharge reduces medication discrepancies. J Hosp Med. 2013;8:672–677.
- Centers for Medicare 150(3):178–187.
- , , , et al. Project BOOST: effectiveness of a multihospital effort to reduce rehospitalization. J Hosp Med. 2013;8(8):421–427.
- , , , . The care transitions intervention: results of a randomized controlled trial. Arch Intern Med. 2006;166(17):1822–1828.
- , , , et al. Comprehensive discharge planning and home follow‐up of hospitalized elders: a randomized clinical trial. JAMA. 1999;281(7):613–620.
- , , , et al. The effect of guided care teams on the use of health services: results from a cluster‐randomized controlled trial. Arch Intern Med. 2011;171(5):460–466.
- , , , et al. Effectiveness and cost of a transitional care program for heart failure: a prospective study with concurrent controls. Arch Intern Med. 2011;171(14):1238–1243.
- , , , , , . The care transitions intervention: translating from efficacy to effectiveness. Arch Intern Med. 2011;171(14):1232–1237.
- , , , , . Interventions to reduce 30‐day rehospitalization: a systematic review. Ann Int Med. 2011;155(8):520–528.
- , , , , , . Hospital‐initiated transitional care interventions as a patient safety strategy: a systematic review. Ann Int Med. 2013;158(5 pt 2):433–440.
- , , , , , . Turning readmission reduction policies into results: some lessons from a multistate initiative to reduce readmissions. Popul Health Manag. 2013;16(4):255–260.
- , , , et al. Glasgow supported self‐management trial (GSuST) for patients with moderate to severe COPD: randomised controlled trial. BMJ. 2013;344:e1060.
- , , , et al. A comprehensive care management program to prevent chronic obstructive pulmonary disease hospitalizations: a randomized controlled trial. Ann Int Med. 2012;156(10):673–683.
- , . Welcome to implementation science. Implement Sci. 2006;1:1.
- , . Moving comparative effectiveness research into practice: implementation science and the role of academic medicine. Health Aff (Millwood). 2010;29(10):1901–1905.
- , , , et al.; American College of Physicians; Society of General Internal Medicine; Society of Hospital Medicine; American Geriatrics Society; American College of Emergency Physicians; Society of Academic Emergency Medicine. Transitions of care consensus policy statement American College of Physicians‐Society of General Internal Medicine‐Society of Hospital Medicine‐American Geriatrics Society‐American College of Emergency Physicians‐Society of Academic Emergency Medicine. J Gen Int Med. 2009;24(8):971–976.
The Hospital Readmission Reduction Program (HRRP)[1] contained within the Affordable Care Act focused national and local attention on hospital resources and efforts to reduce hospital readmissions. Driven by the Centers for Medicare and Medicaid Services' (CMS) desire to pay for value instead of volume, the response of hospitals and health systems appears to be yielding change across the United States.[2] A number of recent publications in the Journal of Hospital Medicine (JHM) exemplify the keen interest in reducing readmissions, while providing guidance regarding interventions and where we might target future research. Evidence from an exemplary systematic review of the pediatric literature confirms some experience in adults regarding effective interventionsall studies were multifacetedand highlights the importance of identifying a single healthcare provider or centrally coordinated hub to assume responsibility for extended care transition and follow‐up.[3] Notably, studies of pediatric patients and their families document the effectiveness of enhanced inpatient education and engagement while in the hospital.[3] Unfortunately, a study among adults at a top‐ranked academic institution indicates poor communication among nurses and physicians regarding patient discharge education.[4] Efforts to improve nursephysician communication by redesigning the hospitalist model of care delivery at a Veterans Affairs (VA) institution appeared to enhance perceptions of communication among the care team members and reduced length of stay, but disappointingly there was no reduction in readmission rates.[5] Studies such as this are essential in identifying which specific interventions may actually change outcomes such as readmission rates.
In 1984, a diminutive elderly woman provocatively squawked Where's the beef?, launching a highly successful advertising campaign for Wendy's hamburger chain.[6] This catchphrase may aptly describe Bradley and colleague's survey study of the State Action on Avoidable Rehospitalization (STAAR) and Hospital‐to‐Home (H2H) campaigns.[7] Auerbach and colleagues eloquently stated in a 2007 New England Journal of Medicine perspective[8] how they had witnessed recent initiatives that emphasize dissemination of innovative but unproven strategies, an approach that runs counter to the principle of following the evidence[9] in selecting interventions that meet quality and safety goals.[10] I firmly agree with this assessment, and 6 years later believe we should be more thoughtful about potentially repeating implementation of unproven strategies.
Do we know if the interventions recommended by H2H and STAAR are what hospital care teams should be attempting? Even the authors mention that definitive evidence on their effectiveness is lacking. The H2H and STAAR programs certainly encourage some theoretically laudable activitiesmedication reconciliation by nurses, alerting outpatient physicians within 48 hours of patient discharge, and providing skilled nursing facilities the direct contact number of the inpatient treating physician for patients transferred. However, do these efforts actually improve patient outcomes? Before embarking on state or national campaigns to improve care, we should consider carefully what are the best evidence‐based interventions. Remarkably, some prior evidence indicates that direct communication between the hospital‐based physician and primary care provider (PCP) may not actually impact patient outcomes.[11] Newer research published in JHM confirms my belief that the PCP needs to be engaged by hospitalists during a hospitalization. Lindquist's research group at Northwestern nicely demonstrated how communication between a patient's PCP and the admitting hospitalist, complemented by contact between the PCP and patient within 24 hours postdischarge, reduced the probability of a medication discrepancy by 70%.[12] Although no evaluation of the effect on readmissions was reported, this study may provide information on causality related to the importance of PCP involvement in the care of hospitalized patients.
Numerous publications now document research on successfully implemented programs that lowered hospital readmissions, and are cited by CMS as evidence‐based interventions.[13] Projects Re‐Engineered Discharge (RED)[14] and Better Outcomes by Optimizing Safe Transitions[15] target the hospital discharge process, and both appear to lower hospital readmission rates. The Care Transitions Intervention (CTI),[16] Transitional Care Model (TCM),[17] and the Guided Care model[18] all leverage nurse practitioners or nurses to protect elderly patients during what can be a perilous care transition from hospital to home. CTI and TCM have been further validated in effectiveness studies.[19, 20] Two recent systematic reviews provide further insight into the complexity of efforts to reduce 30‐day rehospitalizations, but unfortunately do not reveal a desired silver bullet. The first focused exclusively on interventions to reduce 30‐day rehospitalization, and concluded that no single intervention was successful alone, but identified interventions bridging the hospital‐to‐home transition (eg, CTI), and a bundle of interventions such as Project RED as showing efficacy.[21] The second review more broadly sought to evaluate the effectiveness of hospital‐initiated strategies to prevent postdischarge adverse events (AEs) such as readmissions and emergency department visits,[22] stating Because of scant evidence, no conclusions could be reached on methods to prevent postdischarge AEs. The researchers' sobering conclusion stated that strategies to improve patient safety at hospital discharge remain unclear.
With rising federal penalties for higher‐than‐expected readmission rates, many hospital leaders eagerly join collaboratives aiming to reduce hospital readmissions. H2H appears to be among the largest, reporting >600 hospital participants, and STAAR has been active since 2009, with a recently published qualitative study identifying gaps in evidence for effective interventions, and deficits in quality improvement capabilities among some organizations as implementation challenges.[23] Notably, the survey by Bradley and colleagues documented that just half of the hospitals had a quality improvement (QI) team focused on reducing readmissions. Although laudable in their goals, H2H and STAAR may represent expensive commitments of staff and time to efforts that may not improve outcomes. Importantly, recently published research evaluating QI studies showed concerning results among patients with chronic obstructive pulmonary disease (COPD). A randomized controlled trial (RCT) conducted at 6 Glasgow hospitals evaluated supported self‐management (home visits by nurses and thorough education) by patients with moderate to severe COPD, but documented no changes in hospitalization or mortality.[24]Another RCT at 20 sites evaluated a comprehensive care management program to prevent hospitalizations among 960 VA patients with COPD.[25] It had to be stopped early due to elevated all‐cause mortality in the intervention group, and there was no difference in hospitalization rates.
Moving forward, QI efforts to reduce hospital readmissions should utilize proven interventions unless they are part of a rigorous trial. The emerging field of implementation science (the scientific study of methods to promote the systematic uptake of research findings and other evidence‐based practices into routine practice, and hence, to improve the quality and effectiveness of health services[26]) needs to be applied to additional research in this area.[27] Another consideration would be for CMS and funders such as the Commonwealth Foundation or The Robert Wood Johnson Foundation to encourage and fund merging of current initiatives to move away from competition and provide clarity to community hospitals. Regardless, such collaboration should still undertake formal evaluation to discern best approaches to implementation. I applaud the authors for recognizing that Input from hospitalists who are often critical links among inpatient and outpatient care and between patients and their families is strongly needed to ensure hospitals focus on what strategies are most effective for successful transitions from hospital to home. Yet, I wonder why neither of the large STAAR and H2H initiatives actively partnered with hospitalists and their specialty society (Society of Hospital Medicine) directly in the leadership of these initiatives? On the other hand, why not ask medical societies engaged in delivery of primary care (eg, American Academy for Family Practice, American College of Physicians, or Society of General Internal Medicine), especially to elderly patients (American Geriatric Society), to contribute directly? Involvement on an advisory board is likely not sufficient. Prior efforts document the willingness of these organizations to collaborate and achieve consensus on principles for transitions of care.[28] As powerfully articulated 6 years ago, [W]e must pursue the solutions to quality and safety problems in a way that does not blind us to harms, squander scarce resources, or delude us about the effectiveness of our efforts.[8]
Acknowledgments
Disclosure: Dr. Williams is principal investigator for Project BOOST (
- Centers for Medicare and Medicaid Services. Readmissions reduction program. Available at: http://www.cms.gov/Medicare/Medicare‐Fee‐for‐service‐Payment/AcuteInpatientPPS/Readmissions‐Reduction‐Program.html. Accessed December 30, 2013.
- , , , , , . Medicare readmission rates showed meaningful decline in 2012. Medicare Medicaid Res Rev. 2013;3(2):E1–E12.
- , , , . Pediatric hospital discharge interventions to reduce subsequent utilization: a systematic review [published online ahead of print December 20, 2013]. J Hosp Med. doi: 10.1002/jhm.2134.
- , , . Communicating discharge instructions to patients: a survey of nurse, intern, and hospitalist practices. J Hosp Med. 2013;8:36–41.
- , , , et al. An academic hospitalist model to improve healthcare work communication and learner education: results from a quasi‐experimental study at a Veterans Affairs medical center. J Hosp Med. 2013;8:702–710.
- Wikipedia website. Where's the beef? Available at: http://en.wikipedia.org/wiki/Where's_the_beef%3F. Accessed November 4, 2013.
- , , , , , . Quality collaboratives and campaigns to reduce readmissions: what strategies are hospitals using? J Hosp Med. 2013;8(11):601–608.
- , , . The tension between needing to improve care and knowing how to do it. N Engl J Med. 2007;357(6):608–613.
- , , , . Accidental deaths, saved lives, and improved quality. N Engl J Med. 2005;353(13):1405–1409.
- , , . Clinical Improvement Action Guide. Oak Brook, IL: Joint Commission Resources; 1998.
- , , , et al. Association of communication between hospital‐based physicians and primary care providers with patient outcomes. J Gen Int Med. 2009;24(3):381–386.
- , , , , . Primary care physician communication a hospital discharge reduces medication discrepancies. J Hosp Med. 2013;8:672–677.
- Centers for Medicare 150(3):178–187.
- , , , et al. Project BOOST: effectiveness of a multihospital effort to reduce rehospitalization. J Hosp Med. 2013;8(8):421–427.
- , , , . The care transitions intervention: results of a randomized controlled trial. Arch Intern Med. 2006;166(17):1822–1828.
- , , , et al. Comprehensive discharge planning and home follow‐up of hospitalized elders: a randomized clinical trial. JAMA. 1999;281(7):613–620.
- , , , et al. The effect of guided care teams on the use of health services: results from a cluster‐randomized controlled trial. Arch Intern Med. 2011;171(5):460–466.
- , , , et al. Effectiveness and cost of a transitional care program for heart failure: a prospective study with concurrent controls. Arch Intern Med. 2011;171(14):1238–1243.
- , , , , , . The care transitions intervention: translating from efficacy to effectiveness. Arch Intern Med. 2011;171(14):1232–1237.
- , , , , . Interventions to reduce 30‐day rehospitalization: a systematic review. Ann Int Med. 2011;155(8):520–528.
- , , , , , . Hospital‐initiated transitional care interventions as a patient safety strategy: a systematic review. Ann Int Med. 2013;158(5 pt 2):433–440.
- , , , , , . Turning readmission reduction policies into results: some lessons from a multistate initiative to reduce readmissions. Popul Health Manag. 2013;16(4):255–260.
- , , , et al. Glasgow supported self‐management trial (GSuST) for patients with moderate to severe COPD: randomised controlled trial. BMJ. 2013;344:e1060.
- , , , et al. A comprehensive care management program to prevent chronic obstructive pulmonary disease hospitalizations: a randomized controlled trial. Ann Int Med. 2012;156(10):673–683.
- , . Welcome to implementation science. Implement Sci. 2006;1:1.
- , . Moving comparative effectiveness research into practice: implementation science and the role of academic medicine. Health Aff (Millwood). 2010;29(10):1901–1905.
- , , , et al.; American College of Physicians; Society of General Internal Medicine; Society of Hospital Medicine; American Geriatrics Society; American College of Emergency Physicians; Society of Academic Emergency Medicine. Transitions of care consensus policy statement American College of Physicians‐Society of General Internal Medicine‐Society of Hospital Medicine‐American Geriatrics Society‐American College of Emergency Physicians‐Society of Academic Emergency Medicine. J Gen Int Med. 2009;24(8):971–976.
Tablet Computers to Engage Patients
BACKGROUND
Many hospitals have initiated intense efforts to improve transitions of care[1] such as discharge coordinators or transition coaches,[2, 3] but use of mobile devices as approaches to add or extend the value of human interventions have been understudied.[4] Additionally, many hospitalized patients experience substantial inactive time between provider visits, tests, and treatments. This time could be used to engage patients in their care through interactive health education modules and by learning to use their PHR to manage medications and postdischarge appointments.
Greater understanding of the advantages and limitations of mobile devices may be important for improving transitions of care and may help leverage existing hospital personnel resources. However, prior studies have focused on healthcare provider uses of tablet computers for medical education,[5] to collect clinical registration data,[6] or to do clinical work (eg, check labs, write notes)[7, 8, 9] primarily in outpatient settings; few studies have focused on patient uses for this technology in hospital settings.[10, 11] To address these knowledge gaps, we conducted a pilot project to explore inpatient satisfaction with bedside tablets and barriers to usability. Additionally, we evaluated use of these devices to deliver 2 specific Web‐based programs: (1) an interactive video to improve inpatient education about hospital safety, and (2) PHR access to promote inpatient engagement in discharge planning.
METHODS
Study Design, Patient Selection, and Devices/Programs
We conducted a prospective study of tablet computers to engage patients in their care and discharge planning through Web‐based interactive health education modules and use of PHRs. We used 2 tablets, distributed daily by research assistants (RAs) to eligible patients after morning rounds. Inclusion criteria for patients were ability to speak English and admission to the medical (hospitalist) service at University of California San Francisco (UCSF) Medical Center. Exclusion criteria were intensive care unit admission, contact isolation, or inability to complete the consent process due to altered mental status or cognitive impairment.
RAs screened patients for inclusion/exclusion via the electronic medical record and then approached them after rounds for enrollment (11:00 am1:00 pm). RAs then performed a tiered orientation tailored to individual patient experience and needs. First, they delivered a brief tutorial focused on the tablet itself and its basic functions (touchscreen, keypad, and Internet browser use). Second, RAs showed patients how to access the online educational health module and how to navigate content within the module. RAs next explained what the PHR is and demonstrated how to login, how to navigate tabs within the PHR, and how to perform basic tasks (view/refill medications, view/modify appointments, and view/send messages to providers). The RAs left devices with patients for 3 to 5 hours and returned to collect them and perform debriefing interviews. After each device was returned, RAs cleaned devices with disinfectant wipes available in patient rooms and checked for physical damage or software malfunctions (eg, unable to turn on or unlock). Finally, RAs used the reset function to erase any personal data or setting modifications made by patients and docked the devices overnight to resynchronize the original settings and recharge the batteries.
We used the 16 gigabyte Apple iPad2 (Apple Inc., Cupertino, CA) without any enclosures, cases, or security devices. Our educational health module was Patient Safety in the Hospital, which was professionally developed by Emmi Solutions (
Survey Instruments and Data Collection
We developed pre‐ and postintervention surveys to characterize patients' demographics, device ownership, and health‐related Internet activities in the last year based on questions used in the Centers for Disease Control and Prevention National Health Interview Study (
Analyses
We used frequency analysis to describe patient demographics, ability to complete online health educational modules, and utilization of their PHR. We performed bivariate analyses (Fisher exact test) to assess correlations between demographics (age, device ownership, Internet use) and key pilot program performance measures (orientation time 15 minutes, online health module completion, and completion of 1 essential function in the PHR). All analyses were performed in SAS 9.2 (SAS Institute Inc., Cary, NC). The institutional review board of record for UCSF approved this study.
RESULTS
As shown in Table 1, we enrolled 30 patients. Most participants (60%) were aged 40 years or older, and most (87%) owned a mobile device; 70% owned a laptop and 60% owned a smartphone, but few (22%) owned a computer tablet. Most participants accessed the Internet daily, but fewer reported Internet use for health tasks; about half (52%) communicated with a provider, but few refilled a prescription (27%) or scheduled an appointment (21%) online over the last year.
| Characteristic | No. (%) |
|---|---|
| Age, y | |
| 1839 | 11 (38%) |
| 4049 | 5 (18%) |
| 5059 | 4 (14%) |
| 6069 | 5 (18%) |
| 7079 | 3 (10%) |
| Gender, female | 17 (60%) |
| Device ownership | |
| Desktop computer | 12 (44%) |
| Laptop computer | 19 (70%) |
| Smart phone | 17 (60%) |
| Tablet computer | 6 (22%) |
| Any mobile device (laptop, smartphone, or tablet) | 26 (87%) |
| Internet use | |
| Daily | 21 (72%) |
| Several times a week | 3 (10%) |
| Once a week or less | 5 (18%) |
| Prestudy online health tasks | |
| Looked up health information | 21 (72%) |
| Communicated with provider | 15 (52%) |
| Refilled prescription | 8 (27%) |
| Scheduled medical appointment | 6 (21%) |
Nearly all participants (90%) were satisfied or very satisfied with their experience using the tablet in the hospital (Figure 1). Most (87%) required 30 minutes or less for basic orientation, and 70% required only 15 minutes or less. Most participants (83%) were able to independently complete an interactive health education module on hospital safety and were highly satisfied with the module. Despite the fact that 73% of participants were first‐time users of our PHR, the majority were able to login and independently access their medication list, verify scheduled appointments, or send a secure message to their primary care provider.
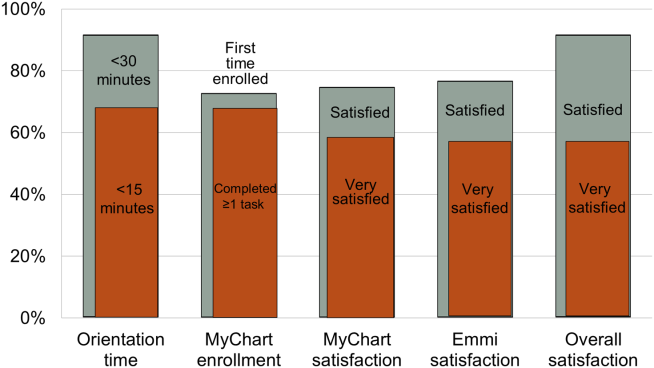
Participants aged 50 years or older were less likely to complete orientation in 15 minutes or less compared to those under 50 years old (25% vs 79%, P=0.025); however, age was not a significant factor in ability to complete the online health educational module or perform at least 1 essential PHR function. Other demographic features, such as device ownership and daily Internet use, did not correlate with shorter orientation time, educational module completion, or PHR use (data available on request).
Participants also made suggestions for improvement during the debrief interviews. Several suggested applications for entertainment (gaming, magazines, or music) and 2 suggested that all patients should be introduced to their PHR during hospitalization (data available on request). No device software malfunction (eg, device freezes, Internet connection failures), hardware issues (eg, damage from falls, wetness, or repeated disinfectant exposure), or theft or misappropriation were reported by patients or observed by the RAs to date.
DISCUSSION
Our pilot study suggests that tablet‐based access to educational modules and PHRs can increase inpatient engagement in care with high satisfaction and minimal time for orientation. Surprisingly, even older patients and those who might be considered less tech savvy in terms of Internet use and device ownership were equally able to utilize our tablet interventions. Furthermore, we did not experience any hardware issues in the harsh physical environment of inpatient wards. These preliminary findings suggest the potential utility of tablets for clinically meaningful tasks by inpatients with a low rate of technical issues.
From a technical standpoint, our experience suggests several next steps. First, although orientation time was minimal, it might be even less if patients used their own mobile devices because most patients already owned one. This bring your own device (BYOD) approach could also promote postdischarge patient engagement. Second, the flexibility of a BYOD approach raises the question of whether to also allow patients a choice of application‐based versus browser‐based platforms for specific programs such as the PHR and educational video we used. Indeed, although we used a browser‐based approach, several other teams have developed patient‐facing engagement applications (or apps) for mobile devices,[4, 12] and hospitalists could prescribe apps at discharge as a more providers are now doing in outpatient settings.[13] Of course, maximizing flexibility for BYOD and Web‐based versus app‐based approaches would likely increase patient engagement but would come at the cost of more time and effort for hospital providers to vet apps/websites and educate patients about their use. Third, regardless of the devices and programs used, broader engagement of patients, nurses, hospitalists, and other providers will be needed in the future to identify key areas for development to avoid overburdening patients and providers.
From a quality‐improvement perspective, recent literature has considered broad clinical uses for tablets by hospital providers,[14, 15] but our experience suggests more specific opportunities to improve transitions of care though direct patient engagement. Tablets and other mobile devices may help improve discharge education for patients taking high‐risk medications such as warfarin or insulin using interactive educational modules similar to the hospital safety modules we used. Additionally, clinical staff, such as nurses and pharmacists, can be trained to deliver mobile device interventions such as education on high‐risk medications.[16] Ultimately, scale up for our intervention will require that mobile devices and content eventually improve and replace current practices by hospital staff (especially nurses) in a way that streamlines, rather than compounds, current workflow. This could increase efficiency in these discharge tasks and extend contributions of these providers to high‐quality transitions.
Our study has several limitations. First, although this is a pilot study with only 30 patients, it adds needed scale to much smaller (N=58) published feasibility studies of tablet computer use by inpatients.[11, 12] Beyond more robust feasibility testing, our study adds new data about mobile device use for specific clinical tasks in the hospital such as patient education and PHR use. Second, we did not track postdischarge outcomes to test the effects of our intervention on transition care quality; this will be a focus of our future research. Third, we used existing platforms for interactive educational modules and PHR access at our site; participant satisfaction in our study may not generalize to other platforms. Furthermore, most PHR platforms (including ours) are not optimally configured to engage patients during transitions of care, but we plan to integrate existing functions (such as ability to refill medications or change appointments) into discharge education and planning. Finally, we have not engaged caregivers as surrogates for cognitively impaired patients or adapted our platform for non‐English speakers; these are areas for development in our ongoing work. Overall, our pilot results help set the stage to deploy mobile devices for better patient monitoring, engagement, and quality of care in the inpatient setting.[17]
In conclusion, our pilot project demonstrates that tablet computers can be used to improve inpatient education and patient engagement in discharge planning. Inpatients are highly satisfied with the use of tablets to complete health education modules and access their PHR, with minimal time required for patient training and device management by hospital staff. Tablets and other mobile devices have significant potential to improve patients' education and engagement in their hospital care.
Acknowledgements
The authors thank the UCSF mHealth group and Center for Digital Health Innovation for advice and for providing tablet computers for this pilot project.
Disclosures: This article was presented as a finalist in the Research, Innovations, and Clinical Vignettes competition (Innovations category) at the 2013 Annual Meeting of the Society for Hospital Medicine. Dr. Auerbach was supported by grant K24HL098372 (NHLBI). Dr. Greysen was supported by a career development award (KL‐2) from the UCSF Clinical Translational Sciences Institute. The authors have declared they have no financial, personal, or other conflicts of interest relevant to this study.
- , . Hospital readmissions and the Affordable Care Act: paying for coordinated quality care. JAMA. 2011;306(16):1794–1795.
- , , , et al. A reengineered hospital discharge program to decrease re‐hospitalization. Ann Intern Med. 2009;150:178–187.
- , , , . The care transitions intervention: results of a randomized controlled trial. Arch Intern Med. 2006;166:1822–1828.
- Project RED. Meet Louise…and virtual patient advocates. Available at: http://www.bu.edu/fammed/projectred/publications/VirtualPatientAdvocateWebsiteInfo2.pdf. Accessed July 12, 2013.
- , , , . Use of handheld computers in medical education. A systematic review. J Gen Intern Med. 2006;21(5):531–537.
- , , , . Ongoing evaluation of ease‐of‐use and usefulness of wireless tablet computers within an ambulatory care unit. Stud Health Tech Inform. 2009;143:459–464.
- . Use of a tablet personal computer to enhance patient care on multidisciplinary rounds. Am J Health Syst Pharm. 2009;66(21):1909–1911.
- , . Experiences incorporating Tablet PCs into clinical pharmacists' workflow. J Healthc Inf Manag. 2005;19(4):32–37.
- , , . The impact of mobile handheld technology on hospital physicians' work practices and patient care: a systematic review. J Am Med Inform Assoc. 2009;16(6):792–801.
- , , , et al. An investigation of the efficacy of electronic consenting interfaces of research permissions management system in a hospital setting. Int J Med Inform. 2013;82(9):854–863.
- , , , et al. A tablet computer application for patients to participate in their hospital care. AMIA Annu Symp Proc. 2011;2011:1428–1435.
- , , , et al. Building and testing a patient‐centric electronic bedside communication center. J Gerontol Nurs. 2013;39(1):15–19.
- . How apps are changing family medicine. J Fam Pract. 2013Jul;62(7):362–367.
- . The iPad: gadget or medical godsend? Ann Emerg Med. 2010;56(1):A21–A22.
- , , , et al. How might the iPad change healthcare? J R Soc Med. 2012;105(6):233–241.
- . Keeping the patient focus: using tablet technology to enhance education and practice. J Contin Educ Nurs. 2012;43(6):249–250.
- , , , et al. Advancing the science of mHealth. J Health Commun. 2012;17(suppl 1):5–10.
BACKGROUND
Many hospitals have initiated intense efforts to improve transitions of care[1] such as discharge coordinators or transition coaches,[2, 3] but use of mobile devices as approaches to add or extend the value of human interventions have been understudied.[4] Additionally, many hospitalized patients experience substantial inactive time between provider visits, tests, and treatments. This time could be used to engage patients in their care through interactive health education modules and by learning to use their PHR to manage medications and postdischarge appointments.
Greater understanding of the advantages and limitations of mobile devices may be important for improving transitions of care and may help leverage existing hospital personnel resources. However, prior studies have focused on healthcare provider uses of tablet computers for medical education,[5] to collect clinical registration data,[6] or to do clinical work (eg, check labs, write notes)[7, 8, 9] primarily in outpatient settings; few studies have focused on patient uses for this technology in hospital settings.[10, 11] To address these knowledge gaps, we conducted a pilot project to explore inpatient satisfaction with bedside tablets and barriers to usability. Additionally, we evaluated use of these devices to deliver 2 specific Web‐based programs: (1) an interactive video to improve inpatient education about hospital safety, and (2) PHR access to promote inpatient engagement in discharge planning.
METHODS
Study Design, Patient Selection, and Devices/Programs
We conducted a prospective study of tablet computers to engage patients in their care and discharge planning through Web‐based interactive health education modules and use of PHRs. We used 2 tablets, distributed daily by research assistants (RAs) to eligible patients after morning rounds. Inclusion criteria for patients were ability to speak English and admission to the medical (hospitalist) service at University of California San Francisco (UCSF) Medical Center. Exclusion criteria were intensive care unit admission, contact isolation, or inability to complete the consent process due to altered mental status or cognitive impairment.
RAs screened patients for inclusion/exclusion via the electronic medical record and then approached them after rounds for enrollment (11:00 am1:00 pm). RAs then performed a tiered orientation tailored to individual patient experience and needs. First, they delivered a brief tutorial focused on the tablet itself and its basic functions (touchscreen, keypad, and Internet browser use). Second, RAs showed patients how to access the online educational health module and how to navigate content within the module. RAs next explained what the PHR is and demonstrated how to login, how to navigate tabs within the PHR, and how to perform basic tasks (view/refill medications, view/modify appointments, and view/send messages to providers). The RAs left devices with patients for 3 to 5 hours and returned to collect them and perform debriefing interviews. After each device was returned, RAs cleaned devices with disinfectant wipes available in patient rooms and checked for physical damage or software malfunctions (eg, unable to turn on or unlock). Finally, RAs used the reset function to erase any personal data or setting modifications made by patients and docked the devices overnight to resynchronize the original settings and recharge the batteries.
We used the 16 gigabyte Apple iPad2 (Apple Inc., Cupertino, CA) without any enclosures, cases, or security devices. Our educational health module was Patient Safety in the Hospital, which was professionally developed by Emmi Solutions (
Survey Instruments and Data Collection
We developed pre‐ and postintervention surveys to characterize patients' demographics, device ownership, and health‐related Internet activities in the last year based on questions used in the Centers for Disease Control and Prevention National Health Interview Study (
Analyses
We used frequency analysis to describe patient demographics, ability to complete online health educational modules, and utilization of their PHR. We performed bivariate analyses (Fisher exact test) to assess correlations between demographics (age, device ownership, Internet use) and key pilot program performance measures (orientation time 15 minutes, online health module completion, and completion of 1 essential function in the PHR). All analyses were performed in SAS 9.2 (SAS Institute Inc., Cary, NC). The institutional review board of record for UCSF approved this study.
RESULTS
As shown in Table 1, we enrolled 30 patients. Most participants (60%) were aged 40 years or older, and most (87%) owned a mobile device; 70% owned a laptop and 60% owned a smartphone, but few (22%) owned a computer tablet. Most participants accessed the Internet daily, but fewer reported Internet use for health tasks; about half (52%) communicated with a provider, but few refilled a prescription (27%) or scheduled an appointment (21%) online over the last year.
| Characteristic | No. (%) |
|---|---|
| Age, y | |
| 1839 | 11 (38%) |
| 4049 | 5 (18%) |
| 5059 | 4 (14%) |
| 6069 | 5 (18%) |
| 7079 | 3 (10%) |
| Gender, female | 17 (60%) |
| Device ownership | |
| Desktop computer | 12 (44%) |
| Laptop computer | 19 (70%) |
| Smart phone | 17 (60%) |
| Tablet computer | 6 (22%) |
| Any mobile device (laptop, smartphone, or tablet) | 26 (87%) |
| Internet use | |
| Daily | 21 (72%) |
| Several times a week | 3 (10%) |
| Once a week or less | 5 (18%) |
| Prestudy online health tasks | |
| Looked up health information | 21 (72%) |
| Communicated with provider | 15 (52%) |
| Refilled prescription | 8 (27%) |
| Scheduled medical appointment | 6 (21%) |
Nearly all participants (90%) were satisfied or very satisfied with their experience using the tablet in the hospital (Figure 1). Most (87%) required 30 minutes or less for basic orientation, and 70% required only 15 minutes or less. Most participants (83%) were able to independently complete an interactive health education module on hospital safety and were highly satisfied with the module. Despite the fact that 73% of participants were first‐time users of our PHR, the majority were able to login and independently access their medication list, verify scheduled appointments, or send a secure message to their primary care provider.
Participants aged 50 years or older were less likely to complete orientation in 15 minutes or less compared to those under 50 years old (25% vs 79%, P=0.025); however, age was not a significant factor in ability to complete the online health educational module or perform at least 1 essential PHR function. Other demographic features, such as device ownership and daily Internet use, did not correlate with shorter orientation time, educational module completion, or PHR use (data available on request).
Participants also made suggestions for improvement during the debrief interviews. Several suggested applications for entertainment (gaming, magazines, or music) and 2 suggested that all patients should be introduced to their PHR during hospitalization (data available on request). No device software malfunction (eg, device freezes, Internet connection failures), hardware issues (eg, damage from falls, wetness, or repeated disinfectant exposure), or theft or misappropriation were reported by patients or observed by the RAs to date.
DISCUSSION
Our pilot study suggests that tablet‐based access to educational modules and PHRs can increase inpatient engagement in care with high satisfaction and minimal time for orientation. Surprisingly, even older patients and those who might be considered less tech savvy in terms of Internet use and device ownership were equally able to utilize our tablet interventions. Furthermore, we did not experience any hardware issues in the harsh physical environment of inpatient wards. These preliminary findings suggest the potential utility of tablets for clinically meaningful tasks by inpatients with a low rate of technical issues.
From a technical standpoint, our experience suggests several next steps. First, although orientation time was minimal, it might be even less if patients used their own mobile devices because most patients already owned one. This bring your own device (BYOD) approach could also promote postdischarge patient engagement. Second, the flexibility of a BYOD approach raises the question of whether to also allow patients a choice of application‐based versus browser‐based platforms for specific programs such as the PHR and educational video we used. Indeed, although we used a browser‐based approach, several other teams have developed patient‐facing engagement applications (or apps) for mobile devices,[4, 12] and hospitalists could prescribe apps at discharge as a more providers are now doing in outpatient settings.[13] Of course, maximizing flexibility for BYOD and Web‐based versus app‐based approaches would likely increase patient engagement but would come at the cost of more time and effort for hospital providers to vet apps/websites and educate patients about their use. Third, regardless of the devices and programs used, broader engagement of patients, nurses, hospitalists, and other providers will be needed in the future to identify key areas for development to avoid overburdening patients and providers.
From a quality‐improvement perspective, recent literature has considered broad clinical uses for tablets by hospital providers,[14, 15] but our experience suggests more specific opportunities to improve transitions of care though direct patient engagement. Tablets and other mobile devices may help improve discharge education for patients taking high‐risk medications such as warfarin or insulin using interactive educational modules similar to the hospital safety modules we used. Additionally, clinical staff, such as nurses and pharmacists, can be trained to deliver mobile device interventions such as education on high‐risk medications.[16] Ultimately, scale up for our intervention will require that mobile devices and content eventually improve and replace current practices by hospital staff (especially nurses) in a way that streamlines, rather than compounds, current workflow. This could increase efficiency in these discharge tasks and extend contributions of these providers to high‐quality transitions.
Our study has several limitations. First, although this is a pilot study with only 30 patients, it adds needed scale to much smaller (N=58) published feasibility studies of tablet computer use by inpatients.[11, 12] Beyond more robust feasibility testing, our study adds new data about mobile device use for specific clinical tasks in the hospital such as patient education and PHR use. Second, we did not track postdischarge outcomes to test the effects of our intervention on transition care quality; this will be a focus of our future research. Third, we used existing platforms for interactive educational modules and PHR access at our site; participant satisfaction in our study may not generalize to other platforms. Furthermore, most PHR platforms (including ours) are not optimally configured to engage patients during transitions of care, but we plan to integrate existing functions (such as ability to refill medications or change appointments) into discharge education and planning. Finally, we have not engaged caregivers as surrogates for cognitively impaired patients or adapted our platform for non‐English speakers; these are areas for development in our ongoing work. Overall, our pilot results help set the stage to deploy mobile devices for better patient monitoring, engagement, and quality of care in the inpatient setting.[17]
In conclusion, our pilot project demonstrates that tablet computers can be used to improve inpatient education and patient engagement in discharge planning. Inpatients are highly satisfied with the use of tablets to complete health education modules and access their PHR, with minimal time required for patient training and device management by hospital staff. Tablets and other mobile devices have significant potential to improve patients' education and engagement in their hospital care.
Acknowledgements
The authors thank the UCSF mHealth group and Center for Digital Health Innovation for advice and for providing tablet computers for this pilot project.
Disclosures: This article was presented as a finalist in the Research, Innovations, and Clinical Vignettes competition (Innovations category) at the 2013 Annual Meeting of the Society for Hospital Medicine. Dr. Auerbach was supported by grant K24HL098372 (NHLBI). Dr. Greysen was supported by a career development award (KL‐2) from the UCSF Clinical Translational Sciences Institute. The authors have declared they have no financial, personal, or other conflicts of interest relevant to this study.
- , . Hospital readmissions and the Affordable Care Act: paying for coordinated quality care. JAMA. 2011;306(16):1794–1795.
- , , , et al. A reengineered hospital discharge program to decrease re‐hospitalization. Ann Intern Med. 2009;150:178–187.
- , , , . The care transitions intervention: results of a randomized controlled trial. Arch Intern Med. 2006;166:1822–1828.
- Project RED. Meet Louise…and virtual patient advocates. Available at: http://www.bu.edu/fammed/projectred/publications/VirtualPatientAdvocateWebsiteInfo2.pdf. Accessed July 12, 2013.
- , , , . Use of handheld computers in medical education. A systematic review. J Gen Intern Med. 2006;21(5):531–537.
- , , , . Ongoing evaluation of ease‐of‐use and usefulness of wireless tablet computers within an ambulatory care unit. Stud Health Tech Inform. 2009;143:459–464.
- . Use of a tablet personal computer to enhance patient care on multidisciplinary rounds. Am J Health Syst Pharm. 2009;66(21):1909–1911.
- , . Experiences incorporating Tablet PCs into clinical pharmacists' workflow. J Healthc Inf Manag. 2005;19(4):32–37.
- , , . The impact of mobile handheld technology on hospital physicians' work practices and patient care: a systematic review. J Am Med Inform Assoc. 2009;16(6):792–801.
- , , , et al. An investigation of the efficacy of electronic consenting interfaces of research permissions management system in a hospital setting. Int J Med Inform. 2013;82(9):854–863.
- , , , et al. A tablet computer application for patients to participate in their hospital care. AMIA Annu Symp Proc. 2011;2011:1428–1435.
- , , , et al. Building and testing a patient‐centric electronic bedside communication center. J Gerontol Nurs. 2013;39(1):15–19.
- . How apps are changing family medicine. J Fam Pract. 2013Jul;62(7):362–367.
- . The iPad: gadget or medical godsend? Ann Emerg Med. 2010;56(1):A21–A22.
- , , , et al. How might the iPad change healthcare? J R Soc Med. 2012;105(6):233–241.
- . Keeping the patient focus: using tablet technology to enhance education and practice. J Contin Educ Nurs. 2012;43(6):249–250.
- , , , et al. Advancing the science of mHealth. J Health Commun. 2012;17(suppl 1):5–10.

Sodium and Mortality in Orthopedics
Sodium is the predominant extracellular cation and a major determinant of serum osmolality. As such, the serum sodium (SNa) concentration in humans is closely maintained by sensitive homeostatic mechanisms. However, disorders of sodium homeostasis are relatively common in selected patient populations, resulting in hyponatremia (<135 mmol/L) or hypernatremia (>144 mmol/L).[1, 2]
The presence of hyponatremia is independently associated with greater mortality in hospitalized individuals,[3] including patients with congestive heart failure[4] and cancer.[5] In prior subgroup analyses of patients with musculoskeletal disorders undergoing surgery, hyponatremia (<135 mmol/L) at the time of hospital admission was associated with a 2.31‐fold greater risk of death, compared with normonatremic individuals (135144 mmol/L).[3] Hyponatremia is also associated with increased fracture risk[6, 7] and disturbances of gait8; however, controversy remains as to whether this association is causal or simply a marker of comorbid disease. On the other hand, hypernatremia has been associated with greater risk of mortality in critically ill patients9; however, there is a relative paucity of data regarding clinical associations in the orthopedic population.
We aimed to examine the relationship of the perioperative SNa (corrected for glucose) with length of stay and 30‐day mortality in patients undergoing major orthopedic surgery. We hypothesized that both hypo‐ and hypernatremia would be associated with greater length of stay and greater 30‐day mortality.
METHODS
Study Population
Administrative and laboratory data were obtained from individuals admitted to 2 major hospitals in Boston, Massachusetts. Brigham and Women's Hospital is a 793‐bed academic medical center; Massachusetts General Hospital is a 907‐bed academic medical center. These hospitals provide care to an ethnically and socioeconomically diverse population within eastern Massachusetts and the surrounding region. The study was deemed exempt by the Partners Institutional Review Board.
The Research Patient Data Registry serves as a central data warehouse for over 1.8 million inpatients and outpatients; it contains information on patient demographics, diagnoses, procedures, medications, inpatient and outpatient encounters, and laboratory results. The database has been accessed previously for clinical studies.[3, 10] Between January 1, 2006 and January 27, 2011, data from the index admission of adult individuals undergoing major orthopedic procedures were abstracted from the Research Patient Data Registry (n=21,663). Those without availability of simultaneous measurements of SNa and glucose within 6 days of surgery (to minimize iatrogenic influences on SNa) were excluded (n=4995), leaving 16,668 admissions available for analysis. Reasons for exclusion included a length of stay 1 day (n=137) and/or age <18 years (n=327). The final cohort consisted of 16,206 unique individuals.
The following data were retrieved: age, race, sex, length of stay, vital status (linked to the Social Security Death Index), International Classification of Diseases, 9th Revision, Clinical Modification (ICD‐9‐CM) diagnosis codes (up to 10 per patient), and inpatient sodium and glucose measurements. The Deyo modification of the Charlson Comorbidity Index (D‐CI) was used to estimate comorbid disease status (sum of the weighted number of comorbid conditions based on 17 diagnostic categories identified from ICD‐9‐CM diagnosis codes).[11]
Exposures and Outcomes
The primary exposure of interest was the serum sodium concentration during hospitalization most proximal to the day of surgery. All serum sodium measurements were corrected for concomitant serum glucose >100 mg/dL in the following manner: corrected sodium (SNa)=measured sodium+(measured glucose‐100/100)*1.6.12 SNa was then categorized into moderate/severe hyponatremia (130 mmol/L), mild hyponatremia (131134 mmol/L), normonatremia (135143 mmol/L), or hypernatremia (144 mmol/L). The primary outcomes of interest were hospital length of stay and 30‐day mortality. Length of stay was log‐transformed due to the highly right‐skewed distribution. For mortality analyses, at‐risk time was considered from the date of laboratory measurement of SNa until death or 30 days later, whichever came first.
Statistical Analysis
Continuous variables were examined graphically and recorded as means ( standard deviations); comparisons were made using t tests. Categorical variables were examined by frequency distribution, recorded as proportions, and comparisons were made using the [2] test.
The association between log‐transformed length of stay and category of SNa was assessed by linear regression models; the association with all‐cause mortality was assessed by fitting Cox proportional hazards models. Initially unadjusted models were fit. To explore the extent of confounding, case‐mix adjusted models were fit as follows: model 1 was adjusted for age, race (black vs nonblack), sex (male vs female), and clinical center. Model 2 was adjusted for the same variables as model 1, in addition to the D‐CI score (1, 2, or 3) and diagnosis of fracture; model 3 was adjusted for the same covariates as model 2 plus individual covariate terms for congestive heart failure (CHF), diabetes, cancer, and liver disease. To further assess for the presence of nonlinear relationships in mortality analyses, restricted and adjusted cubic splines were fit with knots corresponding to SNa values of 135, 137, 139, 141, and 143 mmol/L (approximately the 10th, 25th, 50th, 75th, and 90th percentiles). The linearity assumption for continuous variables was assessed by comparative model fit diagnostics using Akaike's information criterion. The proportionality assumption was assessed by Schoenfeld residual testing.
Subgroup analyses were performed according to the presence or absence of a diagnostic code for fracture. As the majority of patients had their SNa measured on the same day as surgery, sensitivity analyses were performed that restricted inclusion to those individuals with SNa measured within 60 days prior to admission.
Two‐tailed P values <0.05 were considered statistically significant. Analyses were performed with SAS version 9.2 (SAS Institute, Cary, NC) and Stata 10MP (StataCorp, College Station, TX).
RESULTS
Baseline Characteristics
The primary cohort consisted of 16,206 individuals. Mean age was 62.5 years (16.6), 44.8% were male, 4.6% were black, 4.9% had CHF, and 12.4% were diabetic. The mean SNa was 138.52.9 mmol/L; 1.2% had moderate/severe hyponatremia, 6.4% had mild hyponatremia, and 2.5% were hypernatremic. Those with lower SNa tended to be older, female, and more likely to have CHF, cancer, liver disease, and higher comorbidity scores than those with normonatremia (Table 1).
| Perioperative SNa (mmol/L) | |||||
|---|---|---|---|---|---|
| 130, n=198 | 131134, n=1,036 | 135143, n=15,563 | 144, n=409 | Pb | |
| |||||
| Age (y) | 72.514.9 | 66.817.1 | 62.616.5 | 65.117.0 | <0.001 |
| Male (%) | 32.3 | 45.5 | 45.2 | 37.2 | <0.001 |
| Black (%) | 1.6 | 4.2 | 4.7 | 5.3 | 0.18 |
| CHF (%) | 13.1 | 9.2 | 4.5 | 6.6 | <0.001 |
| DM (%) | 10.1 | 13.3 | 12.4 | 12.0 | 0.61 |
| Cancer (%) | 14.1 | 10.8 | 4.5 | 4.4 | <0.001 |
| COPD (%) | 13.1 | 14.4 | 13.1 | 14.2 | 0.63 |
| Hypothyroid (%) | 12.1 | 11.0 | 10.5 | 10.3 | 0.84 |
| Liver disease (%) | 2.0 | 1.1 | 0.6 | 0.5 | 0.02 |
| D‐CI score | <0.001 | ||||
| 0 | 43.4 | 48.0 | 61.5 | 60.6 | |
| 12 | 41.4 | 38.6 | 31.9 | 33.8 | |
| 3 | 15.2 | 13.4 | 6.6 | 6.6 | |
| Glucose (mg/dL) | 142100 | 13657 | 13342 | 147108 | <0.001 |
Hospital Length of Stay
The median length of stay was 4 days (interquartile range, 36 days). The unadjusted length of stay was greater for those with hypo‐ and hypernatremia compared with those who were normonatremic. In multivariable adjusted models this pattern persisted, with evidence for a J‐shaped association for categories of SNa with greater length of stay (Table 2). In adjusted subgroup analyses, similar J‐shaped patterns of association (model 3) were evident in those with and without a diagnosis of fracture.
| Difference (95% CI) in LOS in Days According to Category of Perioperative SNab | ||||
|---|---|---|---|---|
| 130 mmol/L, n=198 | 131134 mmol/L, n=1,036 | 135143 mmol/L, n=14,563 | 144 mmol/L, n=409 | |
| ||||
| Median LOS in days [IQR] | 6 [49] | 5 [48] | 4 [36] | 5 [47] |
| Unadjusted | 2.2 (1.9‐2.6) P<0.001 | 1.8 (1.6‐1.9) P<0.001 | REF | 1.5 (1.3‐1.7) P<0.001 |
| Model 1 | 2.2 (1.8‐2.6) P<0.001 | 1.7 (1.6‐1.9) P<0.001 | REF | 1.5 (1.3‐1.7) P<0.001 |
| Model 2 | 1.7 (1.4‐2.0) P<0.001 | 1.4 (1.3‐1.5) P<0.001 | REF | 1.4 (1.2‐1.5) P<0.001 |
| Model 3 | 1.6 (1.4‐1.9) P<0.001 | 1.4 (1.3‐1.5) P<0.001 | REF | 1.4 (1.2‐1.5) P<0.001 |
| Fracturec | ||||
| Present, n=5,296 | 1.4 (1.1‐1.9) P=0.02 | 1.2 (1.01.4) P=0.01 | REF | 1.7 (1.3‐2.1) P<0.001 |
| Absent, n=10,910 | 1.8 (1.5‐2.2) P<0.001 | 1.5 (1.4‐1.7) P<0.001 | REF | 1.2 (1.01.3) P=0.02 |
In sensitivity analyses restricted to individuals with SNa available within 60 days prior to admission, the effect estimates for the relationships between categories of hyponatremia and length of stay were qualitatively unchanged (see Supporting Information, Table A, in the online version of this article).
30‐Day Mortality
Overall, patients contributed 1325 years of at‐risk time, during which 208 deaths were recorded within 30 days of orthopedic surgery. In both unadjusted and case‐mix adjusted models, there was evidence for the presence of a J‐shaped association for categories of SNa with greater 30‐day mortality (Table 3). Restricted cubic spline analyses provided additional evidence for the presence of a nonlinear relationship, with hypo‐ and hypernatremia being associated with greater 30‐day mortality (Figure 1). In adjusted subgroup analyses, mild hyponatremia and hypernatremia remained associated with greater mortality in those with fracture, whereas only moderate/severe hyponatremia remained associated with greater mortality in those without a diagnosis of fracture.
| Hazard Ratio (95% CI) for 30‐Day Mortality According to Category of Perioperative SNa | ||||
|---|---|---|---|---|
| <130 mmol/L, n= 198 | 131134 mmol/L, n=1,036 | 135143 mmol/L, n=14,563 | 144 mmol/L, n=409 | |
| ||||
| Unadjusted | 5.73 (3.11‐10.6) | 3.48 (2.40‐5.04) | REF | 4.90 (3.037.91) |
| Model 1 | 3.49 (1.88‐6.49) | 2.36 (1.60‐3.50) | REF | 3.83 (2.31‐6.35) |
| Model 2 | 2.89 (1.56‐5.35) | 1.96 (1.33‐2.90) | REF | 3.14 (1.88‐5.21) |
| Model 3 | 2.47 (1.33‐4.59) | 1.80 (1.21‐2.66) | REF | 2.99 (1.79‐4.98) |
| Fractureb | ||||
| Present, n=5,296 | 1.94 (0.84‐4.47) | 1.83 (1.13‐2.97) | REF | 3.12 (1.72‐5.66) |
| Absent, n=10,910 | 3.85 (1.53‐9.68) | 1.58 (0.80‐3.14) | REF | 2.73 (0.98‐7.62) |
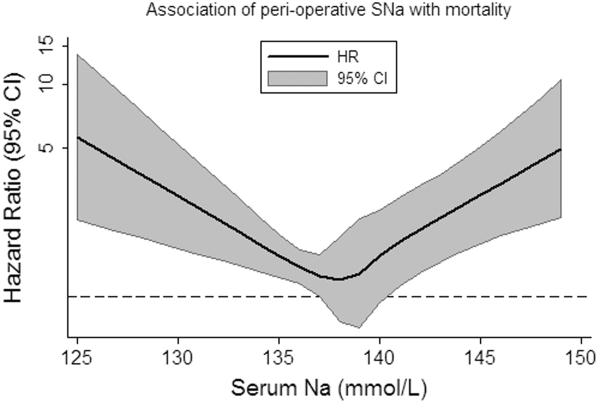
In sensitivity analyses, when restricted to individuals with SNa available within 60 days prior to admission, the effect estimates for the relationships between categories of hyponatremia and length of stay were qualitatively unchanged (see Supporting Information, Table B, in the online version of this article).
DISCUSSION
In this study of hospitalized patients undergoing major orthopedic procedures, we report that abnormal preadmission and perioperative SNa during hospitalization are: (1) present in approximately 10% of patients, (2) associated with greater hospital length of stay, and (3) associated with greater 30‐day mortality.
The incidence of perioperative hyponatremia (<135 mmol/L) in prior studies ranges from 9.1% to 26.5% in studies of patients over 65 years of age admitted to the hospital with large bone fractures.[13, 14] In our study, the overall incidence of hyponatremia (SNa <135 mmol/L) was 7.6%. Of note, our sample included individuals aged 18 years and was not limited to individuals with fractures, which may partly explain why the incidence was lower than that previously reported.
Few studies have examined the association of perioperative hyponatremia with length of stay in the hospitalized orthopedic surgery population. We found that both hyponatremia and hypernatremia (corrected for glucose) were independently associated with greater adjusted hospital length of stay, compared with normonatremic individuals. This has important implications for healthcare costs and resource utilization. However, it is unclear if dysnatremia is associated with other metrics of postoperative recovery that could delay discharge, or whether dysnatremia alone is responsible for the decision to delay discharge (despite other measures of recovery being deemed adequate).
Leung et al. recently examined the association of preoperative hyponatremia (<135 mmol/L, uncorrected and measured within 90 days of surgery) with 30‐day mortality in 964,263 patients from the American College of Surgeons National Surgical Quality Improvement Program (ACS NSQIP) dataset.[15] They found that preoperative hyponatremia was associated with 44% greater adjusted odds (odds ratio [OR]: 1.44, 95% CI: 1.38‐1.50) of 30‐day mortality in the whole cohort and with 56% greater adjusted odds (OR: 1.56, 95% CI: 1.22‐1.99) in the subgroup of orthopedic patients. Waikar et al. also reported that hyponatremia is associated with greater in‐hospital and long‐term mortality in the subgroup of hospitalized patients who were admitted for musculoskeletal problems requiring surgery.[3] Our analyses support these findings and provide greater confidence by specifically focusing on patients admitted for major orthopedic surgery. We also expand the current knowledge base by correcting for serum glucose concentrations and by reporting associations of moderate/severe hyponatremia with adverse clinical outcomes.
The incidence of perioperative hypernatremia in our study was 2.5%, which compares to 1.0% to 2.6% in other studies of orthopedic patients.[14, 16] Hypernatremia has previously been associated with greater mortality in hospitalized patients in the intensive care unit (ICU) setting at the time of admission,[17] during the ICU stay,[9] in older patients (>60 years),[18] and in those with decompensated liver disease.[19] More recently, Leung et al. performed further analyses using data from the ACS NSQIP, reporting that preoperative hypernatremia (>144 mmol/L, uncorrected and measured within 90 days of surgery) is associated with 44% greater adjusted odds (OR: 1.44, 95% CI: 1.33‐1.56) of 30‐day mortality, but was not significantly associated with greater mortality in the orthopedic subgroup.[20] We extend the literature by examining glucose‐corrected SNa and again by focusing specifically on those undergoing major orthopedic surgery, reporting an association of perioperative hypernatremia with greater length of stay and 30‐day mortality. In our study, when we specifically examined the association of preoperative SNa values, we noted attenuation of the effect estimates and loss of statistical significance, confirming the subgroup findings of Leung et al.[20] The reasons for this are not clear, but may relate to the possibility that perioperative hypernatremia (as opposed to preoperative) is a stronger marker of concurrent illness severity and therefore more closely associates with adverse clinical outcomes.
As with most observational studies in this area, the question of whether dysnatremia is causative or merely a marker of comorbidity remains. In this regard, there are some unique points that deserve mention in this cohort of patients. Hyponatremia has previously been associated with several musculoskeletal abnormalities, including a greater risk of fracture,[7, 16, 21] which may contribute to the observed associations with greater morbidity and mortality. For example, Verbalis et al. reported that the induction and maintenance of hyponatremia by administration of 1‐deamino8‐d‐arginine vasopressin in rodent models is associated with reduced bone mineral density in excised rat femurs, which may predispose to greater fracture risk.[22] In humans, the same authors reported that hyponatremia (<135 mmol/L) was independently associated with greater odds of having osteoporosis at the femoral neck in individuals aged 50 years or older (OR: 2.87, 95% CI: 1.41‐5.81), compared with normonatremic individuals (135145 mmol/L).[22] On the other hand, Kinsella et al. found that hyponatremia (<135 mmol/L) associated with greater odds of having a fracture (OR: 2.25, 95% CI: 1.24‐4.09), independent of the presence of osteoporosis as measured by hip and vertebral T‐scores, suggesting an association between hyponatremia and fracture, independent of osteoporosis.[6] Other potential confounders of these associations may include gait disturbance and unsteadiness, which could contribute to greater fall and fracture risk.[7, 8, 21] Additional proposed mechanisms for the association of hyponatremia with adverse outcomes include the development of cerebral edema,[23] abnormal nerve conduction,[24] and predisposition to infection,[25] perhaps via altered immune functioning in the presence of hypo‐osmolality. Unfortunately, due to data limitations, we were unable to investigate these hypotheses further in our present study. In relation to hypernatremia, associations with impairment in neurologic,[26] myocardial,[27] and immune functioning have been reported previously, which may contribute to some of the excess risk associated with this condition.
There are several limitations of this study that deserve further mention. We used ICD‐9 and diagnosis‐related group codes to ascertain data on primary diagnoses and comorbid conditions, raising the possibility of some degree of misclassification of covariates in this study. We were unable to differentiate between elective versus urgent/emergent procedures. Given the large sample size and intrinsic data limitations, we were unable to ascertain the underlying causes of dysnatremia, or examine practice differences between the 2 institutions from which the sample was sourced. The majority of our sample had perioperative SNa measurements performed on the same day as their major orthopedic procedure. Although we were unable to confirm the timing of SNa measurements relative to the operation, it is not uncommon for elective cases to have initial hospitalization labs drawn in the recovery room, as opposed to preoperatively. In sensitivity analyses, we found similar patterns of association for hyponatremia with outcomes, but not for hypernatremia, when we examined the SNa measurement within 60 days prior to admission as the exposure of interest. Although these analyses were underpowered, they provide some modicum of reassurance that the observed associations of perioperative hyponatremia with adverse outcomes are robust. Whether perioperative dysnatremia, measured in the recovery room, has associations with clinical outcomes that are distinct from immediate preoperative dysnatremia requires further research. The possibility of residual confounding (eg, administration of fluids, medications, severity of illness) that was not captured by the D‐CI index, functional status and infection remain important considerations. Finally, caution must be applied before generalizing our results from 2 large academic centers to the general hospitalized orthopedic population.
In conclusion, we report that dysnatremia on admission for patients requiring major orthopedic surgery is present in approximately 10% of patients and is associated with greater length of stay and all‐cause mortality. Further research is required to assess whether dysnatremia is a mediator or marker for increased morbidity and mortality, and whether perioperative correction of hypo‐ or hypernatremia will improve clinical outcomes in these patients.
Acknowledgments
Disclosures: Dr. Mc Causland had full access to all the data in the study and takes responsibility for the integrity of the data and the accuracy of the data analysis. Dr. McCausland was supported by a Clinical Fellowship Grant from the National Kidney Foundation (20112013). Dr. Wright has no relevant disclosures. This work was supported by an investigator‐initiated grant from Otsuka to Dr. Waikar. Otsuka had no role in the design, conduct, management, analysis or interpretation of these data. In addition to investigator‐initiated funding from Otsuka for the present study, Dr. Waikar previously received grant support from Astellas for an investigator‐initiated study of hyponatremia and participated in an advisory board meeting for Otsuka. He is supported by National Institutes of Health grants U01DK085660 and RO1DK093574.
- . Hypernatremia. Semin Nephrol. 1998;18(1):20–30.
- , , . Incidence and prevalence of hyponatremia. Am J Med. 2006;119(7suppl 1):S30–S35.
- , , . Mortality after hospitalization with mild, moderate, and severe hyponatremia. Am J Med. 2009;122(9):857–865.
- , , , , , . Predicting mortality among patients hospitalized for heart failure: derivation and validation of a clinical model. JAMA. 2003;290(19):2581–2587.
- , , . A prospective study on hyponatraemia in medical cancer patients: epidemiology, aetiology and differential diagnosis. Support Care Cancer. 2000;8(3):192–197.
- , , , , . Hyponatremia independent of osteoporosis is associated with fracture occurrence. Clin J Am Soc Nephrol. 2010;5(2):275–280.
- , , , et al. Mild hyponatremia as a risk factor for fractures: the Rotterdam Study. J Bone Miner Res. 2011;26(8):1822–1828.
- , , , , . Mild chronic hyponatremia is associated with falls, unsteadiness, and attention deficits. Am J Med. 2006;119(1):71.e71–78.
- , , , et al. Intensive care‐acquired hypernatremia after major cardiothoracic surgery is associated with increased mortality. Intensive Care Med. 2010;36(10):1718–1723.
- , , , et al. Validity of international classification of diseases, ninth revision, clinical modification codes for acute renal failure. J Am Soc Nephrol. 2006;17(6):1688–1694.
- , , . Adapting a clinical comorbidity index for use with ICD‐9‐CM administrative databases. J Clin Epidemiol. 1992;45(6):613–619.
- . Hyperglycemia‐induced hyponatremia—calculation of expected serum sodium depression. N Engl J Med. 1973;289(16):843–844.
- , , , , . Hyponatremia associated with large‐bone fracture in elderly patients. Int Urol Nephrol. 2009;41(3):733–737.
- , , , , . Hip fracture post‐operation dysnatremia and Na+‐courses in different cognitive and functional patient groups. Arch Gerontol Geriatr. 2011;53(2):179–182.
- , , , , , . Preoperative hyponatremia and perioperative complications. Arch Intern Med. 2012;172(19):1474–1481.
- , , , . Mortality and serum urea and electrolytes on admission for hip fracture patients. Injury. 2006;37(8):698–704.
- , , , et al. Hypernatremia in the critically ill is an independent risk factor for mortality. Am J Kidney Dis. 2007;50(6):952–957.
- , , . Hypernatremia in elderly patients. A heterogeneous, morbid, and iatrogenic entity. Ann Intern Med. 1987;107(3):309–319.
- , , . Hypernatremia in hepatic failure. JAMA. 1980;243(12):1257–1260.
- , , , . Preoperative hypernatremia predicts increased perioperative morbidity and mortality. Am J Med. 2013;126(10):877–886.
- , , , , . Mild hyponatremia and risk of fracture in the ambulatory elderly. QJM. 2008;101(7):583–588.
- , , , et al. Hyponatremia‐induced osteoporosis. J Bone Miner Res. 2010;25(3):554–563.
- , . Hyponatremia and mortality: moving beyond associations. Am J Kidney Dis. 2013;62(1):139–149.
- , , , . Reversible nerve conduction slowing in hyponatremia. J Neurol. 2004;251(12):1532–1533.
- , , , et al. Risk factors for hospital‐acquired Staphylococcus aureus bacteremia. Arch Intern Med. 1999;159(13):1437–1444.
- , . Hypernatremia. N Engl J Med. 2000;342(20):1493–1499.
- , , , , , . Influence of hypernatremic‐hyperosmolar state on hemodynamics of patients with normal and depressed myocardial function. Crit Care Med. 1986;14(10):913–914.
Sodium is the predominant extracellular cation and a major determinant of serum osmolality. As such, the serum sodium (SNa) concentration in humans is closely maintained by sensitive homeostatic mechanisms. However, disorders of sodium homeostasis are relatively common in selected patient populations, resulting in hyponatremia (<135 mmol/L) or hypernatremia (>144 mmol/L).[1, 2]
The presence of hyponatremia is independently associated with greater mortality in hospitalized individuals,[3] including patients with congestive heart failure[4] and cancer.[5] In prior subgroup analyses of patients with musculoskeletal disorders undergoing surgery, hyponatremia (<135 mmol/L) at the time of hospital admission was associated with a 2.31‐fold greater risk of death, compared with normonatremic individuals (135144 mmol/L).[3] Hyponatremia is also associated with increased fracture risk[6, 7] and disturbances of gait8; however, controversy remains as to whether this association is causal or simply a marker of comorbid disease. On the other hand, hypernatremia has been associated with greater risk of mortality in critically ill patients9; however, there is a relative paucity of data regarding clinical associations in the orthopedic population.
We aimed to examine the relationship of the perioperative SNa (corrected for glucose) with length of stay and 30‐day mortality in patients undergoing major orthopedic surgery. We hypothesized that both hypo‐ and hypernatremia would be associated with greater length of stay and greater 30‐day mortality.
METHODS
Study Population
Administrative and laboratory data were obtained from individuals admitted to 2 major hospitals in Boston, Massachusetts. Brigham and Women's Hospital is a 793‐bed academic medical center; Massachusetts General Hospital is a 907‐bed academic medical center. These hospitals provide care to an ethnically and socioeconomically diverse population within eastern Massachusetts and the surrounding region. The study was deemed exempt by the Partners Institutional Review Board.
The Research Patient Data Registry serves as a central data warehouse for over 1.8 million inpatients and outpatients; it contains information on patient demographics, diagnoses, procedures, medications, inpatient and outpatient encounters, and laboratory results. The database has been accessed previously for clinical studies.[3, 10] Between January 1, 2006 and January 27, 2011, data from the index admission of adult individuals undergoing major orthopedic procedures were abstracted from the Research Patient Data Registry (n=21,663). Those without availability of simultaneous measurements of SNa and glucose within 6 days of surgery (to minimize iatrogenic influences on SNa) were excluded (n=4995), leaving 16,668 admissions available for analysis. Reasons for exclusion included a length of stay 1 day (n=137) and/or age <18 years (n=327). The final cohort consisted of 16,206 unique individuals.
The following data were retrieved: age, race, sex, length of stay, vital status (linked to the Social Security Death Index), International Classification of Diseases, 9th Revision, Clinical Modification (ICD‐9‐CM) diagnosis codes (up to 10 per patient), and inpatient sodium and glucose measurements. The Deyo modification of the Charlson Comorbidity Index (D‐CI) was used to estimate comorbid disease status (sum of the weighted number of comorbid conditions based on 17 diagnostic categories identified from ICD‐9‐CM diagnosis codes).[11]
Exposures and Outcomes
The primary exposure of interest was the serum sodium concentration during hospitalization most proximal to the day of surgery. All serum sodium measurements were corrected for concomitant serum glucose >100 mg/dL in the following manner: corrected sodium (SNa)=measured sodium+(measured glucose‐100/100)*1.6.12 SNa was then categorized into moderate/severe hyponatremia (130 mmol/L), mild hyponatremia (131134 mmol/L), normonatremia (135143 mmol/L), or hypernatremia (144 mmol/L). The primary outcomes of interest were hospital length of stay and 30‐day mortality. Length of stay was log‐transformed due to the highly right‐skewed distribution. For mortality analyses, at‐risk time was considered from the date of laboratory measurement of SNa until death or 30 days later, whichever came first.
Statistical Analysis
Continuous variables were examined graphically and recorded as means ( standard deviations); comparisons were made using t tests. Categorical variables were examined by frequency distribution, recorded as proportions, and comparisons were made using the [2] test.
The association between log‐transformed length of stay and category of SNa was assessed by linear regression models; the association with all‐cause mortality was assessed by fitting Cox proportional hazards models. Initially unadjusted models were fit. To explore the extent of confounding, case‐mix adjusted models were fit as follows: model 1 was adjusted for age, race (black vs nonblack), sex (male vs female), and clinical center. Model 2 was adjusted for the same variables as model 1, in addition to the D‐CI score (1, 2, or 3) and diagnosis of fracture; model 3 was adjusted for the same covariates as model 2 plus individual covariate terms for congestive heart failure (CHF), diabetes, cancer, and liver disease. To further assess for the presence of nonlinear relationships in mortality analyses, restricted and adjusted cubic splines were fit with knots corresponding to SNa values of 135, 137, 139, 141, and 143 mmol/L (approximately the 10th, 25th, 50th, 75th, and 90th percentiles). The linearity assumption for continuous variables was assessed by comparative model fit diagnostics using Akaike's information criterion. The proportionality assumption was assessed by Schoenfeld residual testing.
Subgroup analyses were performed according to the presence or absence of a diagnostic code for fracture. As the majority of patients had their SNa measured on the same day as surgery, sensitivity analyses were performed that restricted inclusion to those individuals with SNa measured within 60 days prior to admission.
Two‐tailed P values <0.05 were considered statistically significant. Analyses were performed with SAS version 9.2 (SAS Institute, Cary, NC) and Stata 10MP (StataCorp, College Station, TX).
RESULTS
Baseline Characteristics
The primary cohort consisted of 16,206 individuals. Mean age was 62.5 years (16.6), 44.8% were male, 4.6% were black, 4.9% had CHF, and 12.4% were diabetic. The mean SNa was 138.52.9 mmol/L; 1.2% had moderate/severe hyponatremia, 6.4% had mild hyponatremia, and 2.5% were hypernatremic. Those with lower SNa tended to be older, female, and more likely to have CHF, cancer, liver disease, and higher comorbidity scores than those with normonatremia (Table 1).
| Perioperative SNa (mmol/L) | |||||
|---|---|---|---|---|---|
| 130, n=198 | 131134, n=1,036 | 135143, n=15,563 | 144, n=409 | Pb | |
| |||||
| Age (y) | 72.514.9 | 66.817.1 | 62.616.5 | 65.117.0 | <0.001 |
| Male (%) | 32.3 | 45.5 | 45.2 | 37.2 | <0.001 |
| Black (%) | 1.6 | 4.2 | 4.7 | 5.3 | 0.18 |
| CHF (%) | 13.1 | 9.2 | 4.5 | 6.6 | <0.001 |
| DM (%) | 10.1 | 13.3 | 12.4 | 12.0 | 0.61 |
| Cancer (%) | 14.1 | 10.8 | 4.5 | 4.4 | <0.001 |
| COPD (%) | 13.1 | 14.4 | 13.1 | 14.2 | 0.63 |
| Hypothyroid (%) | 12.1 | 11.0 | 10.5 | 10.3 | 0.84 |
| Liver disease (%) | 2.0 | 1.1 | 0.6 | 0.5 | 0.02 |
| D‐CI score | <0.001 | ||||
| 0 | 43.4 | 48.0 | 61.5 | 60.6 | |
| 12 | 41.4 | 38.6 | 31.9 | 33.8 | |
| 3 | 15.2 | 13.4 | 6.6 | 6.6 | |
| Glucose (mg/dL) | 142100 | 13657 | 13342 | 147108 | <0.001 |
Hospital Length of Stay
The median length of stay was 4 days (interquartile range, 36 days). The unadjusted length of stay was greater for those with hypo‐ and hypernatremia compared with those who were normonatremic. In multivariable adjusted models this pattern persisted, with evidence for a J‐shaped association for categories of SNa with greater length of stay (Table 2). In adjusted subgroup analyses, similar J‐shaped patterns of association (model 3) were evident in those with and without a diagnosis of fracture.
| Difference (95% CI) in LOS in Days According to Category of Perioperative SNab | ||||
|---|---|---|---|---|
| 130 mmol/L, n=198 | 131134 mmol/L, n=1,036 | 135143 mmol/L, n=14,563 | 144 mmol/L, n=409 | |
| ||||
| Median LOS in days [IQR] | 6 [49] | 5 [48] | 4 [36] | 5 [47] |
| Unadjusted | 2.2 (1.9‐2.6) P<0.001 | 1.8 (1.6‐1.9) P<0.001 | REF | 1.5 (1.3‐1.7) P<0.001 |
| Model 1 | 2.2 (1.8‐2.6) P<0.001 | 1.7 (1.6‐1.9) P<0.001 | REF | 1.5 (1.3‐1.7) P<0.001 |
| Model 2 | 1.7 (1.4‐2.0) P<0.001 | 1.4 (1.3‐1.5) P<0.001 | REF | 1.4 (1.2‐1.5) P<0.001 |
| Model 3 | 1.6 (1.4‐1.9) P<0.001 | 1.4 (1.3‐1.5) P<0.001 | REF | 1.4 (1.2‐1.5) P<0.001 |
| Fracturec | ||||
| Present, n=5,296 | 1.4 (1.1‐1.9) P=0.02 | 1.2 (1.01.4) P=0.01 | REF | 1.7 (1.3‐2.1) P<0.001 |
| Absent, n=10,910 | 1.8 (1.5‐2.2) P<0.001 | 1.5 (1.4‐1.7) P<0.001 | REF | 1.2 (1.01.3) P=0.02 |
In sensitivity analyses restricted to individuals with SNa available within 60 days prior to admission, the effect estimates for the relationships between categories of hyponatremia and length of stay were qualitatively unchanged (see Supporting Information, Table A, in the online version of this article).
30‐Day Mortality
Overall, patients contributed 1325 years of at‐risk time, during which 208 deaths were recorded within 30 days of orthopedic surgery. In both unadjusted and case‐mix adjusted models, there was evidence for the presence of a J‐shaped association for categories of SNa with greater 30‐day mortality (Table 3). Restricted cubic spline analyses provided additional evidence for the presence of a nonlinear relationship, with hypo‐ and hypernatremia being associated with greater 30‐day mortality (Figure 1). In adjusted subgroup analyses, mild hyponatremia and hypernatremia remained associated with greater mortality in those with fracture, whereas only moderate/severe hyponatremia remained associated with greater mortality in those without a diagnosis of fracture.
| Hazard Ratio (95% CI) for 30‐Day Mortality According to Category of Perioperative SNa | ||||
|---|---|---|---|---|
| <130 mmol/L, n= 198 | 131134 mmol/L, n=1,036 | 135143 mmol/L, n=14,563 | 144 mmol/L, n=409 | |
| ||||
| Unadjusted | 5.73 (3.11‐10.6) | 3.48 (2.40‐5.04) | REF | 4.90 (3.037.91) |
| Model 1 | 3.49 (1.88‐6.49) | 2.36 (1.60‐3.50) | REF | 3.83 (2.31‐6.35) |
| Model 2 | 2.89 (1.56‐5.35) | 1.96 (1.33‐2.90) | REF | 3.14 (1.88‐5.21) |
| Model 3 | 2.47 (1.33‐4.59) | 1.80 (1.21‐2.66) | REF | 2.99 (1.79‐4.98) |
| Fractureb | ||||
| Present, n=5,296 | 1.94 (0.84‐4.47) | 1.83 (1.13‐2.97) | REF | 3.12 (1.72‐5.66) |
| Absent, n=10,910 | 3.85 (1.53‐9.68) | 1.58 (0.80‐3.14) | REF | 2.73 (0.98‐7.62) |
In sensitivity analyses, when restricted to individuals with SNa available within 60 days prior to admission, the effect estimates for the relationships between categories of hyponatremia and length of stay were qualitatively unchanged (see Supporting Information, Table B, in the online version of this article).
DISCUSSION
In this study of hospitalized patients undergoing major orthopedic procedures, we report that abnormal preadmission and perioperative SNa during hospitalization are: (1) present in approximately 10% of patients, (2) associated with greater hospital length of stay, and (3) associated with greater 30‐day mortality.
The incidence of perioperative hyponatremia (<135 mmol/L) in prior studies ranges from 9.1% to 26.5% in studies of patients over 65 years of age admitted to the hospital with large bone fractures.[13, 14] In our study, the overall incidence of hyponatremia (SNa <135 mmol/L) was 7.6%. Of note, our sample included individuals aged 18 years and was not limited to individuals with fractures, which may partly explain why the incidence was lower than that previously reported.
Few studies have examined the association of perioperative hyponatremia with length of stay in the hospitalized orthopedic surgery population. We found that both hyponatremia and hypernatremia (corrected for glucose) were independently associated with greater adjusted hospital length of stay, compared with normonatremic individuals. This has important implications for healthcare costs and resource utilization. However, it is unclear if dysnatremia is associated with other metrics of postoperative recovery that could delay discharge, or whether dysnatremia alone is responsible for the decision to delay discharge (despite other measures of recovery being deemed adequate).
Leung et al. recently examined the association of preoperative hyponatremia (<135 mmol/L, uncorrected and measured within 90 days of surgery) with 30‐day mortality in 964,263 patients from the American College of Surgeons National Surgical Quality Improvement Program (ACS NSQIP) dataset.[15] They found that preoperative hyponatremia was associated with 44% greater adjusted odds (odds ratio [OR]: 1.44, 95% CI: 1.38‐1.50) of 30‐day mortality in the whole cohort and with 56% greater adjusted odds (OR: 1.56, 95% CI: 1.22‐1.99) in the subgroup of orthopedic patients. Waikar et al. also reported that hyponatremia is associated with greater in‐hospital and long‐term mortality in the subgroup of hospitalized patients who were admitted for musculoskeletal problems requiring surgery.[3] Our analyses support these findings and provide greater confidence by specifically focusing on patients admitted for major orthopedic surgery. We also expand the current knowledge base by correcting for serum glucose concentrations and by reporting associations of moderate/severe hyponatremia with adverse clinical outcomes.
The incidence of perioperative hypernatremia in our study was 2.5%, which compares to 1.0% to 2.6% in other studies of orthopedic patients.[14, 16] Hypernatremia has previously been associated with greater mortality in hospitalized patients in the intensive care unit (ICU) setting at the time of admission,[17] during the ICU stay,[9] in older patients (>60 years),[18] and in those with decompensated liver disease.[19] More recently, Leung et al. performed further analyses using data from the ACS NSQIP, reporting that preoperative hypernatremia (>144 mmol/L, uncorrected and measured within 90 days of surgery) is associated with 44% greater adjusted odds (OR: 1.44, 95% CI: 1.33‐1.56) of 30‐day mortality, but was not significantly associated with greater mortality in the orthopedic subgroup.[20] We extend the literature by examining glucose‐corrected SNa and again by focusing specifically on those undergoing major orthopedic surgery, reporting an association of perioperative hypernatremia with greater length of stay and 30‐day mortality. In our study, when we specifically examined the association of preoperative SNa values, we noted attenuation of the effect estimates and loss of statistical significance, confirming the subgroup findings of Leung et al.[20] The reasons for this are not clear, but may relate to the possibility that perioperative hypernatremia (as opposed to preoperative) is a stronger marker of concurrent illness severity and therefore more closely associates with adverse clinical outcomes.
As with most observational studies in this area, the question of whether dysnatremia is causative or merely a marker of comorbidity remains. In this regard, there are some unique points that deserve mention in this cohort of patients. Hyponatremia has previously been associated with several musculoskeletal abnormalities, including a greater risk of fracture,[7, 16, 21] which may contribute to the observed associations with greater morbidity and mortality. For example, Verbalis et al. reported that the induction and maintenance of hyponatremia by administration of 1‐deamino8‐d‐arginine vasopressin in rodent models is associated with reduced bone mineral density in excised rat femurs, which may predispose to greater fracture risk.[22] In humans, the same authors reported that hyponatremia (<135 mmol/L) was independently associated with greater odds of having osteoporosis at the femoral neck in individuals aged 50 years or older (OR: 2.87, 95% CI: 1.41‐5.81), compared with normonatremic individuals (135145 mmol/L).[22] On the other hand, Kinsella et al. found that hyponatremia (<135 mmol/L) associated with greater odds of having a fracture (OR: 2.25, 95% CI: 1.24‐4.09), independent of the presence of osteoporosis as measured by hip and vertebral T‐scores, suggesting an association between hyponatremia and fracture, independent of osteoporosis.[6] Other potential confounders of these associations may include gait disturbance and unsteadiness, which could contribute to greater fall and fracture risk.[7, 8, 21] Additional proposed mechanisms for the association of hyponatremia with adverse outcomes include the development of cerebral edema,[23] abnormal nerve conduction,[24] and predisposition to infection,[25] perhaps via altered immune functioning in the presence of hypo‐osmolality. Unfortunately, due to data limitations, we were unable to investigate these hypotheses further in our present study. In relation to hypernatremia, associations with impairment in neurologic,[26] myocardial,[27] and immune functioning have been reported previously, which may contribute to some of the excess risk associated with this condition.
There are several limitations of this study that deserve further mention. We used ICD‐9 and diagnosis‐related group codes to ascertain data on primary diagnoses and comorbid conditions, raising the possibility of some degree of misclassification of covariates in this study. We were unable to differentiate between elective versus urgent/emergent procedures. Given the large sample size and intrinsic data limitations, we were unable to ascertain the underlying causes of dysnatremia, or examine practice differences between the 2 institutions from which the sample was sourced. The majority of our sample had perioperative SNa measurements performed on the same day as their major orthopedic procedure. Although we were unable to confirm the timing of SNa measurements relative to the operation, it is not uncommon for elective cases to have initial hospitalization labs drawn in the recovery room, as opposed to preoperatively. In sensitivity analyses, we found similar patterns of association for hyponatremia with outcomes, but not for hypernatremia, when we examined the SNa measurement within 60 days prior to admission as the exposure of interest. Although these analyses were underpowered, they provide some modicum of reassurance that the observed associations of perioperative hyponatremia with adverse outcomes are robust. Whether perioperative dysnatremia, measured in the recovery room, has associations with clinical outcomes that are distinct from immediate preoperative dysnatremia requires further research. The possibility of residual confounding (eg, administration of fluids, medications, severity of illness) that was not captured by the D‐CI index, functional status and infection remain important considerations. Finally, caution must be applied before generalizing our results from 2 large academic centers to the general hospitalized orthopedic population.
In conclusion, we report that dysnatremia on admission for patients requiring major orthopedic surgery is present in approximately 10% of patients and is associated with greater length of stay and all‐cause mortality. Further research is required to assess whether dysnatremia is a mediator or marker for increased morbidity and mortality, and whether perioperative correction of hypo‐ or hypernatremia will improve clinical outcomes in these patients.
Acknowledgments
Disclosures: Dr. Mc Causland had full access to all the data in the study and takes responsibility for the integrity of the data and the accuracy of the data analysis. Dr. McCausland was supported by a Clinical Fellowship Grant from the National Kidney Foundation (20112013). Dr. Wright has no relevant disclosures. This work was supported by an investigator‐initiated grant from Otsuka to Dr. Waikar. Otsuka had no role in the design, conduct, management, analysis or interpretation of these data. In addition to investigator‐initiated funding from Otsuka for the present study, Dr. Waikar previously received grant support from Astellas for an investigator‐initiated study of hyponatremia and participated in an advisory board meeting for Otsuka. He is supported by National Institutes of Health grants U01DK085660 and RO1DK093574.
- . Hypernatremia. Semin Nephrol. 1998;18(1):20–30.
- , , . Incidence and prevalence of hyponatremia. Am J Med. 2006;119(7suppl 1):S30–S35.
- , , . Mortality after hospitalization with mild, moderate, and severe hyponatremia. Am J Med. 2009;122(9):857–865.
- , , , , , . Predicting mortality among patients hospitalized for heart failure: derivation and validation of a clinical model. JAMA. 2003;290(19):2581–2587.
- , , . A prospective study on hyponatraemia in medical cancer patients: epidemiology, aetiology and differential diagnosis. Support Care Cancer. 2000;8(3):192–197.
- , , , , . Hyponatremia independent of osteoporosis is associated with fracture occurrence. Clin J Am Soc Nephrol. 2010;5(2):275–280.
- , , , et al. Mild hyponatremia as a risk factor for fractures: the Rotterdam Study. J Bone Miner Res. 2011;26(8):1822–1828.
- , , , , . Mild chronic hyponatremia is associated with falls, unsteadiness, and attention deficits. Am J Med. 2006;119(1):71.e71–78.
- , , , et al. Intensive care‐acquired hypernatremia after major cardiothoracic surgery is associated with increased mortality. Intensive Care Med. 2010;36(10):1718–1723.
- , , , et al. Validity of international classification of diseases, ninth revision, clinical modification codes for acute renal failure. J Am Soc Nephrol. 2006;17(6):1688–1694.
- , , . Adapting a clinical comorbidity index for use with ICD‐9‐CM administrative databases. J Clin Epidemiol. 1992;45(6):613–619.
- . Hyperglycemia‐induced hyponatremia—calculation of expected serum sodium depression. N Engl J Med. 1973;289(16):843–844.
- , , , , . Hyponatremia associated with large‐bone fracture in elderly patients. Int Urol Nephrol. 2009;41(3):733–737.
- , , , , . Hip fracture post‐operation dysnatremia and Na+‐courses in different cognitive and functional patient groups. Arch Gerontol Geriatr. 2011;53(2):179–182.
- , , , , , . Preoperative hyponatremia and perioperative complications. Arch Intern Med. 2012;172(19):1474–1481.
- , , , . Mortality and serum urea and electrolytes on admission for hip fracture patients. Injury. 2006;37(8):698–704.
- , , , et al. Hypernatremia in the critically ill is an independent risk factor for mortality. Am J Kidney Dis. 2007;50(6):952–957.
- , , . Hypernatremia in elderly patients. A heterogeneous, morbid, and iatrogenic entity. Ann Intern Med. 1987;107(3):309–319.
- , , . Hypernatremia in hepatic failure. JAMA. 1980;243(12):1257–1260.
- , , , . Preoperative hypernatremia predicts increased perioperative morbidity and mortality. Am J Med. 2013;126(10):877–886.
- , , , , . Mild hyponatremia and risk of fracture in the ambulatory elderly. QJM. 2008;101(7):583–588.
- , , , et al. Hyponatremia‐induced osteoporosis. J Bone Miner Res. 2010;25(3):554–563.
- , . Hyponatremia and mortality: moving beyond associations. Am J Kidney Dis. 2013;62(1):139–149.
- , , , . Reversible nerve conduction slowing in hyponatremia. J Neurol. 2004;251(12):1532–1533.
- , , , et al. Risk factors for hospital‐acquired Staphylococcus aureus bacteremia. Arch Intern Med. 1999;159(13):1437–1444.
- , . Hypernatremia. N Engl J Med. 2000;342(20):1493–1499.
- , , , , , . Influence of hypernatremic‐hyperosmolar state on hemodynamics of patients with normal and depressed myocardial function. Crit Care Med. 1986;14(10):913–914.
© 2014 Society of Hospital Medicine
