User login
ED Care Within 30 Days of Discharge
Reducing hospital admissions within 30 days of inpatient discharge is the focus of numerous policies, incentives, and payment models, led by the Centers for Medicare & Medicaid Services.[1] Accordingly, care‐transition programs have been developed and are found to be effective in reducing hospital readmissions.[2, 3] Interestingly, emergency department (ED) visits have not been included in this definition of readmission, no programs have focused specifically on reducing ED visits,[4] and some have even increased ED visits.[5]
The prevalence and costs associated with ED care within 30 days of hospital discharge are not insignificant. Up to 24% of discharged patients present to the ED within 30 days, among whom only 50% are readmitted.[6] ED care alone accounts for nearly 40% of all costs in the acute postdischarge period.[7] This is in addition to the costs associated with readmissions from the ED, which are the result of disposition decisions made by ED clinicians.
To begin to build effective care‐transition programs to reduce ED visits after inpatient discharge, greater understanding is needed on what factors influence the utilization of the ED and what potential interventions could have prevented them. Studies from inpatient populations have been successful in eliciting these factors through stakeholder interviews.[8, 9, 10] In fact, the American College of Physicians and Society of Hospital Medicine emphasize involvement of the patient and family members in plans of care.[11] No prior studies have used stakeholders to inform care‐transition models for patients who return to the ED within 30 days of inpatient discharge.
Therefore, the primary objective of this study was to collect various stakeholder perspectives to improve the understanding of factors associated with ED visits within 30 days of hospital discharge and identify potentially useful interventions to prevent them. We hypothesized that there would be significant discordances between patients, their caregivers, and emergency physicians. Findings from this study could inform an expanded framework for understanding the complexity of care needs after hospital discharge and suggest interventions to improve health outcomes and to reduce healthcare costs.
METHODS
Setting
The study took place in the ED of a 525‐bed urban teaching hospital in Pittsburgh, Pennsylvania, with 55,000 annual ED visits and 26,137 hospital admissions per year. Overall demographics of patients presenting to this ED in 2012 were 82% white, 17% black, and 0.3% Asian. The institutional review board of the University of Pittsburgh approved this study.
Participants
Patients were eligible to participate if they: (1) had the capacity to complete an interview, as determined by the attending emergency physician based on their exam; and (2) presented to the ED within 30 days of a prior discharge from any affiliate hospital. Eligible participants were identified by a trained research associate (J.H.) on the day of the ED visit by screening the electronic medical record. We excluded 2 patients from analysis who had both been to the ED prior to a readmission and had already completed the survey in the last 30 days. Caregivers were eligible to participate if they: (1) were in the ED at the time of patient evaluation, and (2) were identified by participating patients. ED physicians were eligible to participate if they had seen and evaluated the enrolled patient and were the attending staff physician. Eligible caregivers and physicians underwent separate informed consent.
Development of Survey Instrument
A collaborative team of physicians and hospital administrators used a defined conceptual framework,[9] literature search, and pilot administration to construct a survey to elucidate factors potentially contributing to ED visits within 30 days of hospital discharge and interventions that could have potentially prevented the ED visit. All participants (patients, caregivers, and physicians) were asked to complete the following questions: (1) In your opinion, is your/the patient's ED visit today directly related to your/their last hospitalization? (2) In your opinion, did any of the following contribute to your/the patient's ED visit today? (3) In your opinion, which of the following could have prevented your/the patient's ED visit today? For questions 2 and 3, participants were asked to mark any and all prespecified options that apply, including none of the above. Participants were also given an other choice, which allowed them to provide open‐ended answers. Across participant categories, the surveys differed only in the demographic questions. For patients, we asked questions regarding age, sex, race, highest education, relationship status, living situation, access to mobile communication, and chief complaint. For caregivers, we asked questions regarding age, relationship to patient, and frequency of patient contact. For physicians, we asked for sex and years of experience practicing emergency medicine. Prior to administration, the survey was pretested with 10 patients and revised to improve reliability and comprehensibility.
Survey Administration
Participants were screened and enrolled during 5‐ to 10‐hour blocks that were chosen by the research associate. Sampling was balanced between weekdays and weekends and between daytime and evening hours. The research associate typically took 5 minutes to conduct the survey in person with each participant and recorded all responses directly into an electronic file. The research associate made every effort to conduct all surveys in a private area without others present to reduce reporting biases.
Analysis
Participant descriptor and response profiles for perceived factors contributing to ED visits and interventions to potentially prevent them were first visually examined and described. Summary statistics were calculated and displayed as number (percentage) for categorical data or mean (standard deviation [SD]) for continuous data. For each individual item, patient‐physician and patient‐caregiver dyads were considered concordant if they both agreed on either the presence or absence of a given factor. To quantify dyad concordance, we calculated weighted statistics for concordance in each individual item and the agreement rate for concordance in each individual item.[12] To determine the relative additional contribution of caregivers and physicians, we calculated and displayed the percentage of factors identified by caregivers and physicians when the patient did not identify them. All data were analyzed using Stata 10.0 (StataCorp, College Station, TX).
RESULTS
Participant Characteristics
We surveyed 135 patients who had been discharged from the hospital within the last 30 days (Table 1). The number of days since discharge ranged from 1 to 30, with a mean of 12 (SD 9) days. Forty‐four percent of cases presented to the ED within 7 days of the last discharge. Patients represented a wide age range from 18 to 96 years, with 61% under 65 years of age. Around a third (31%) were black, and 44% had no college education. Most (65%) were not currently married, the majority lived in the community (93%), and 63% live with at least 1 other person. Frequent ED chief complaints included chest pain or shortness of breath (24%), musculoskeletal pain (20%), and weakness (13%). To achieve 135 patient‐physician dyads, we surveyed 22 unique emergency physicians, with each individual physician completing between 1 and 17 surveys and the median completion of 5 surveys. The mean number of years in practice was 12 (SD 9). We also surveyed 49 unique patient caregivers, who were between 20 and 86 years of age (mean age, 52 years [SD 14]). Eighty‐eight percent of caregivers were family members, 8% friends, and 4% paid caregivers. The majority (63%) of caregivers lived with the patient and spent a mean of 11 hours (SD 7) per day with them.
| Participant Characteristics | Value |
|---|---|
| |
| Patient characteristic, N=135 | |
| Age, y, mean (SD) | 59 (18) |
| Sex, female | 74 (55) |
| Race | |
| Black | 41 (31) |
| White | 92 (69) |
| Asian | 1 (1) |
| Highest education | |
| Less than high school | 17 (13) |
| High school or GED | 41 (31) |
| At least some college | 75 (56) |
| Relationship | |
| Married | 47 (35) |
| Single | 58 (43) |
| Separated/widowed | 29 (21) |
| Living situation | |
| Alone | 40 (30) |
| With 1 other | 49 (36) |
| With multiple family members | 37 (27) |
| Nursing home/assisted living | 9 (7) |
| Access to communication, personal mobile phone | 110 (81) |
| Chief complaint | |
| Chest pain/shortness of breath | 32 (24) |
| Musculoskeletal pain | 27 (20 |
| Weakness | 18 (13) |
| Abdominal pain/nausea/vomiting | 14 (10) |
| Postoperative complaint | 12 (9) |
| Headache | 5 (4) |
| Other | 27 (20) |
| Caregiver characteristic, N=49 | |
| Age, y, mean (SD) | 52 (13) |
| Relationship to patient | |
| Family member | 43 (88) |
| Friend | 4 (8) |
| Paid caregiver | 2 (4) |
| Frequency of patient contact | |
| Lives with patient | 31 (63) |
| Waking hours per day with patient, mean (SD) | 11 (7) |
| Physician characteristic, N=22 | |
| Sex | |
| Female | 7 (30) |
| Male | 15 (70) |
| Years practicing emergency medicine, mean (SD) | 11 (9) |
Factors Contributing to Need for Acute Care Within 30 Days of Hospital Discharge
Overall, 89% of patients, 87% of emergency physicians, and 96% of caregivers identified at least 1 factor contributing to the return ED visit (Table 2). Patient‐physician concordances in factors contributing to early ED care were generally poor, with weighted statistics ranging from 0.02 to 0.33 and agreement rates ranging from 59% to 93%. Patient‐caregiver concordances in factors contributing to early ED care were generally better, with weighted statistics ranging from 0.05 to 0.68 and agreement rates ranging from 78% to 96%.
| Patient Report, N=135 | Physician Report, N=135 | Caregiver Report, N=49 | Patient‐Physician Concordance | Patient Caregiver Concordance | ||||||
|---|---|---|---|---|---|---|---|---|---|---|
| n | % | n | % | n | % | Agreement % | Agreement % | |||
| ||||||||||
| Factors contributing to early acute care | ||||||||||
| Issues related to prior hospitalization | 92 | 68 | 88 | 65 | 36 | 73 | 0.33 | 70 | 0.51 | 78 |
| Progression of chronic disease or medical condition | 56 | 41 | 60 | 44 | 22 | 45 | 0.15 | 59 | 0.58 | 80 |
| Missed doses or not taking prescribed medications | 9 | 7 | 7 | 5 | 2 | 4 | 0.34 | 93 | 0.3 | 92 |
| Not enough support at home | 7 | 5 | 15 | 11 | 2 | 4 | 0.02 | 85 | 0.05 | 90 |
| Fall or unsteadiness when walking | 12 | 9 | 6 | 4 | 4 | 8 | 0.05 | 88 | 0.65 | 96 |
| Side effects of current medication | 26 | 19 | 5 | 4 | 7 | 14 | 0.21 | 83 | 0.68 | 90 |
| Potential ways to prevent early acute care visit | ||||||||||
| Improved discharge care instructions | 13 | 10 | 17 | 13 | 3 | 6 | 0.09 | 79 | 0.46 | 92 |
| Review of medications | 13 | 10 | 7 | 5 | 5 | 10 | 0.08 | 85 | 0.55 | 82 |
| Home health visits | 9 | 7 | 21 | 16 | 2 | 4 | 0.19 | 84 | 0.03 | 94 |
| Follow‐up appointment with primary care doctor | 14 | 10 | 29 | 21 | 0 | 0 | 0.08 | 74 | ||
| Follow‐up appointment with specialist | 10 | 7 | 28 | 21 | 5 | 10 | 0.05 | 75 | 0.33 | 88 |
Both physicians and caregivers identified factors contributing to ED visits when patients did not (Table 3). Specifically, they identified issues related to prior hospitalization contributing to the ED visit between 42% and 45% of the time when patients did not. Physicians identified progression of chronic disease or medical condition 38% of the time when the patient did not, compared to caregivers, who identified it 23% of the time patients did not. Physicians also indicated that not enough support at home as contributing to ED visits 11% of the time patents did not, compared to a 4% increase when caregivers were asked. Other reasons were reported through free text by 20% of patients, 16% of emergency physicians, and 22% of caregivers. Across all stakeholders, around one‐third (27%31%) of these other factors related to postoperative complications, and 27% to 44% related to the perception of being discharged too early.
| If Patient Did Not Report | ||
|---|---|---|
| Physician Report | Caregiver Report | |
| ||
| Factors contributing to early acute care | ||
| Issues related to prior hospitalization | 18 (42) | 9 (45) |
| Progression of disease or medical condition | 30 (38) | 7 (23) |
| Missed doses or not taking prescribed medications | 4 (3) | 1 (2) |
| Not enough support at home | 14 (11) | 2 (4) |
| Fall or unsteadiness when walking | 5 (4) | 2 (4) |
| Side effects of current medication | 1 (1) | 0 |
| Potential ways to prevent early acute care visit | ||
| Improved discharge care instructions | 16 (13) | 1 (2) |
| Review of medications | 7 (6) | 2 (5) |
| Home health visits | 17 (13) | 2 (4) |
| Follow‐up appointment with primary care doctor | 25 (21) | 0 |
| Follow‐up appointment with specialist | 25 (20) | 3 (7) |
Potential Ways to Prevent Early Acute Care Within 30 Days of Hospital Discharge
Overall, 56% of patients, 55% of emergency physicians, and 49% of caregivers selected at least 1 intervention that could have potentially prevented the ED visit. However, no single intervention was identified by more than one‐fifth of participants (Table 2). Around 10% of patients identified either improved discharge instructions, review of medications, and follow‐up care with primary care provider as potential ways to prevent ED visits. Physicians identified both follow‐up with a primary care provider and specialist around 21% of the time as potential preventive interventions. Patient‐physician concordances in potential ways to prevent ED care were extremely poor, with weighted statistics ranging from 0.08 to 0.19 and agreement rates ranging from 74% to 85%. Patient‐caregiver concordances in potential ways to prevent ED care again were generally better, with weighted statistics ranging from 0.03 to 0.55 and agreement rates ranging from 82% to 94%.
Other potential interventions were reported by 16% of patients, 10% of emergency physicians, and 10% of caregivers. From patients, other interventions related to staying in the hospital longer on last admission and better medication instructions from last admission. Other interventions reported by physicians included home physical therapy, improved primary care provision, and more home support. Physicians, but not caregivers, more frequently identified potentially useful interventions when patients did not (Table 3). Other interventions reported by caregivers included staying in the hospital longer, improved patient activity, and better medications.
DISCUSSION
Several findings from this study can improve the understanding of what factors influence the utilization of the ED soon after inpatient discharge and what interventions could potentially prevent them. Consistent with our hypothesis, there are significant discordances between patients, their caregivers, and emergency physicians. Additionally, emergency physicians and caregivers were able to identify factors and potential opportunities for prevention a significant, albeit variable, amount of time the patients did not. Perhaps not surprisingly, we found that across stakeholders, the majority of ED visits are perceived as related to issues from the prior hospitalization or progression of chronic disease or medical condition. Of some concern, we found that less than half of patients, physicians, and caregivers could identify an intervention to potentially prevent the ED visit.
The large discordances between patients' and physicians' perceptions in our study were similar to those found in prior studies from primary care.[13, 14, 15] No prior study has examined discordances in emergency care or regarding perceptions about care‐transition difficulties. Feigenbaum et al.[10] interviewed patients, caregivers, and physicians to create composite definitions of potentially preventable readmissions. They did not, however, look at how these perceptions differ or describe the relative contribution of individual stakeholders to overall definitions. The discordances between patient and emergency physician perceptions may be due to a couple of potential causes. First, emergency physicians may have greater access to medical history data than patients, allowing them to develop more objective assessments. This is supported by our finding that physicians identified factors when patients did not. Second, patients may understand certain care‐transition difficulties that physicians do not elicit from history taking. This may be especially apparent in the emergency setting, where physicians are time limited and do not have established care relationships with patients.
The moderate agreement between patient and caregiver perceptions are similar to a couple of studies examining perceived quality of life among patients.[16, 17] These discordances can be due to a couple of potential causes. First, caregivers may witness deficits or transition difficulties that the patient may not. This may be particularly true for caregivers who are providing substantial support in managing the patient's healthcare or for patients with cognitive impairment. Second, caregivers may not know the patient history well enough to know what specific issues affect the patient. This would be likely when caregivers do not live with patients or serve a central role in caregiving.
The overwhelming perception that the majority of ED visits are related to issues from the prior hospitalization or progression of chronic disease or medical condition suggests that, by and large, acute care needs soon after hospital discharges are not new unrelated medical issues, and thus theoretically could be predicted and prevented. This is consistent with prior prediction models showing that chronic medical comorbidities have strong associations with hospital readmission.[18, 19] It also supports probing care issues with patients prior to hospital discharge.[20]
The finding that less than half of patients, physicians, or caregivers could identify an intervention to potentially prevent the ED visit echoes prior research, indicating that only a minority of readmissions may be truly preventable,[21] and suggests that there may not be obvious needs that can be addressed to prevent acute care visits. An alternative interpretation is that the healthcare system does not currently have a suitable alternative to meet the perceived needs of patients. Despite this, patients occasionally perceived that better discharge instructions, review of medications, and sooner follow‐up appointments with a primary care doctor could have potentially prevented their ED visit. This is consistent with numerous prior studies and supports better transition‐of‐care programs.
Our study had a small sample size, which results in wide confidence intervals on all point estimates of percentages, limiting the precision of our findings. No medical charts were reviewed to determine the medical reasons for the index admission, the prior course of care, or subsequent hospital course after emergency care, limiting our ability to link perceptions with actual past hospital experiences or compare differences in perceptions by subsequent readmission. Another limitation is a lack of generalizability of our findings to other patients, hospitals, or regions. Our patient population was largely white and English speaking only for participation in this study. Also, our hospital ED admits an average of 48% of patients, which is higher than most hospitals. We enrolled a convenience sample as opposed to a consecutive sample of patients due to limitations in research associate staffing, potentially biasing our sample. We attempted to minimize this bias by scheduling shifts across days and time periods. We did not systematically collect the number of patients or caregivers who refused participation, but believe that it was less than 5% of those approached. Other limitations include possible reporting biases associated with in‐person interviews, which we attempted to minimize by conducting all surveys in private.
SUMMARY
Identifying needs in patients who utilize the ED soon after being discharged from inpatient care is essential for planning appropriate care‐transition interventions. Our findings suggest that multiple stakeholders may be necessary to fully elicit targets for effective care‐transition programs.
Disclosure: Nothing to report.
- Medicare Payment Advisory Commission. Payment policy for inpatient readmissions. In: Report to the congress: promoting greater efficiency in Medicare. Available at: http://www.medpac.gov/chapters/Jun07_Ch05.pdf. Accessed February 9, 2010.
- , , , et al. A reengineered hospital discharge program to decrease rehospitalization: a randomized trial. Ann Intern Med. 2009;150(3):178–187.
- , , , et al. Hospital readmission in general medicine patients: a prediction model. J Gen Intern Med. 2010;25(3):211–219.
- , , , , , . Hospital‐initiated transitional care interventions as a patient safety strategy: a systematic review. Ann Intern Med. 2013;158(5 pt 2):433–440.
- , . Hospital readmissions as a measure of quality of health care: advantages and limitations. Arch Intern Med. 2000;160(8):1074–1081.
- , , , . Emergency department visits after hospital discharge: a missing part of the equation. Ann Emerg Med. 2013;62(2):145–150.
- , , , et al. Use of hospital‐based acute care among patients recently discharged from the hospital. JAMA. 2013;309(4):364–371.
- , , , , , . Continuity of care and monitoring pain after discharge: patient perspective. J Adv Nurs. 2010;66(1):40–48.
- , , , , , . Perceptions of readmitted patients on the transition from hospital to home. J Hosp Med. 2012;7(9):709–712.
- , , , et al. Factors contributing to all‐cause 30‐day readmissions: a structured case series across 18 hospitals. Med Care. 2012;50(7):599–605.
- , , , et al. Transition of care consensus policy statement, American College of Physicians‐Society of General Internal Medicine‐Society of Hospital Medicine‐American Geriatric Society‐American College of Emergency Physicians‐Society of Academic Emergency Medicine. J Gen Intern Med. 2009;24(8):971–976.
- , . J Clin Epidemiol. 1990;43(6):551–558.
- , , , , , . Patient‐doctor agreement about problems needing follow‐up visit. JAMA. 1979;242(4):344–346.
- , , , , , . Reasons for encounter and diagnosed health problems: convergence between doctors and patients. Fam Pract. 1992;9(2):191–194.
- , , , . Concordance between physicians and their older and younger patients in the primary care medical encounter. Gerontologist. 1989;29(6):808–813.
- , , , et al. Do older patients and their family caregivers agree about the quality of chronic illness care? Int J Qual Health Care. 2013;25(5):515–524.
- , , . Proxy reporting of quality of life using the EQ‐5D. Med Care. 2002;40(12):1186–1195.
- , . Hospital readmissions—not just a measure of quality. JAMA. 2011;306(16):1796–1797.
- , , , . Redefining readmission risk factors for general medicine patients. J Hosp Med. 2011;6(2):54–60.
- , , . Tying up loose ends: discharging patients with unresolved medical issues. Arch Intern Med. 2007;167(12):1305–1311.
- , , , . Potentially avoidable 30‐day hospital readmissions in medical patients: derivation and validation of a prediction model. JAMA Intern Med. 2013;173(8):632–638.
Reducing hospital admissions within 30 days of inpatient discharge is the focus of numerous policies, incentives, and payment models, led by the Centers for Medicare & Medicaid Services.[1] Accordingly, care‐transition programs have been developed and are found to be effective in reducing hospital readmissions.[2, 3] Interestingly, emergency department (ED) visits have not been included in this definition of readmission, no programs have focused specifically on reducing ED visits,[4] and some have even increased ED visits.[5]
The prevalence and costs associated with ED care within 30 days of hospital discharge are not insignificant. Up to 24% of discharged patients present to the ED within 30 days, among whom only 50% are readmitted.[6] ED care alone accounts for nearly 40% of all costs in the acute postdischarge period.[7] This is in addition to the costs associated with readmissions from the ED, which are the result of disposition decisions made by ED clinicians.
To begin to build effective care‐transition programs to reduce ED visits after inpatient discharge, greater understanding is needed on what factors influence the utilization of the ED and what potential interventions could have prevented them. Studies from inpatient populations have been successful in eliciting these factors through stakeholder interviews.[8, 9, 10] In fact, the American College of Physicians and Society of Hospital Medicine emphasize involvement of the patient and family members in plans of care.[11] No prior studies have used stakeholders to inform care‐transition models for patients who return to the ED within 30 days of inpatient discharge.
Therefore, the primary objective of this study was to collect various stakeholder perspectives to improve the understanding of factors associated with ED visits within 30 days of hospital discharge and identify potentially useful interventions to prevent them. We hypothesized that there would be significant discordances between patients, their caregivers, and emergency physicians. Findings from this study could inform an expanded framework for understanding the complexity of care needs after hospital discharge and suggest interventions to improve health outcomes and to reduce healthcare costs.
METHODS
Setting
The study took place in the ED of a 525‐bed urban teaching hospital in Pittsburgh, Pennsylvania, with 55,000 annual ED visits and 26,137 hospital admissions per year. Overall demographics of patients presenting to this ED in 2012 were 82% white, 17% black, and 0.3% Asian. The institutional review board of the University of Pittsburgh approved this study.
Participants
Patients were eligible to participate if they: (1) had the capacity to complete an interview, as determined by the attending emergency physician based on their exam; and (2) presented to the ED within 30 days of a prior discharge from any affiliate hospital. Eligible participants were identified by a trained research associate (J.H.) on the day of the ED visit by screening the electronic medical record. We excluded 2 patients from analysis who had both been to the ED prior to a readmission and had already completed the survey in the last 30 days. Caregivers were eligible to participate if they: (1) were in the ED at the time of patient evaluation, and (2) were identified by participating patients. ED physicians were eligible to participate if they had seen and evaluated the enrolled patient and were the attending staff physician. Eligible caregivers and physicians underwent separate informed consent.
Development of Survey Instrument
A collaborative team of physicians and hospital administrators used a defined conceptual framework,[9] literature search, and pilot administration to construct a survey to elucidate factors potentially contributing to ED visits within 30 days of hospital discharge and interventions that could have potentially prevented the ED visit. All participants (patients, caregivers, and physicians) were asked to complete the following questions: (1) In your opinion, is your/the patient's ED visit today directly related to your/their last hospitalization? (2) In your opinion, did any of the following contribute to your/the patient's ED visit today? (3) In your opinion, which of the following could have prevented your/the patient's ED visit today? For questions 2 and 3, participants were asked to mark any and all prespecified options that apply, including none of the above. Participants were also given an other choice, which allowed them to provide open‐ended answers. Across participant categories, the surveys differed only in the demographic questions. For patients, we asked questions regarding age, sex, race, highest education, relationship status, living situation, access to mobile communication, and chief complaint. For caregivers, we asked questions regarding age, relationship to patient, and frequency of patient contact. For physicians, we asked for sex and years of experience practicing emergency medicine. Prior to administration, the survey was pretested with 10 patients and revised to improve reliability and comprehensibility.
Survey Administration
Participants were screened and enrolled during 5‐ to 10‐hour blocks that were chosen by the research associate. Sampling was balanced between weekdays and weekends and between daytime and evening hours. The research associate typically took 5 minutes to conduct the survey in person with each participant and recorded all responses directly into an electronic file. The research associate made every effort to conduct all surveys in a private area without others present to reduce reporting biases.
Analysis
Participant descriptor and response profiles for perceived factors contributing to ED visits and interventions to potentially prevent them were first visually examined and described. Summary statistics were calculated and displayed as number (percentage) for categorical data or mean (standard deviation [SD]) for continuous data. For each individual item, patient‐physician and patient‐caregiver dyads were considered concordant if they both agreed on either the presence or absence of a given factor. To quantify dyad concordance, we calculated weighted statistics for concordance in each individual item and the agreement rate for concordance in each individual item.[12] To determine the relative additional contribution of caregivers and physicians, we calculated and displayed the percentage of factors identified by caregivers and physicians when the patient did not identify them. All data were analyzed using Stata 10.0 (StataCorp, College Station, TX).
RESULTS
Participant Characteristics
We surveyed 135 patients who had been discharged from the hospital within the last 30 days (Table 1). The number of days since discharge ranged from 1 to 30, with a mean of 12 (SD 9) days. Forty‐four percent of cases presented to the ED within 7 days of the last discharge. Patients represented a wide age range from 18 to 96 years, with 61% under 65 years of age. Around a third (31%) were black, and 44% had no college education. Most (65%) were not currently married, the majority lived in the community (93%), and 63% live with at least 1 other person. Frequent ED chief complaints included chest pain or shortness of breath (24%), musculoskeletal pain (20%), and weakness (13%). To achieve 135 patient‐physician dyads, we surveyed 22 unique emergency physicians, with each individual physician completing between 1 and 17 surveys and the median completion of 5 surveys. The mean number of years in practice was 12 (SD 9). We also surveyed 49 unique patient caregivers, who were between 20 and 86 years of age (mean age, 52 years [SD 14]). Eighty‐eight percent of caregivers were family members, 8% friends, and 4% paid caregivers. The majority (63%) of caregivers lived with the patient and spent a mean of 11 hours (SD 7) per day with them.
| Participant Characteristics | Value |
|---|---|
| |
| Patient characteristic, N=135 | |
| Age, y, mean (SD) | 59 (18) |
| Sex, female | 74 (55) |
| Race | |
| Black | 41 (31) |
| White | 92 (69) |
| Asian | 1 (1) |
| Highest education | |
| Less than high school | 17 (13) |
| High school or GED | 41 (31) |
| At least some college | 75 (56) |
| Relationship | |
| Married | 47 (35) |
| Single | 58 (43) |
| Separated/widowed | 29 (21) |
| Living situation | |
| Alone | 40 (30) |
| With 1 other | 49 (36) |
| With multiple family members | 37 (27) |
| Nursing home/assisted living | 9 (7) |
| Access to communication, personal mobile phone | 110 (81) |
| Chief complaint | |
| Chest pain/shortness of breath | 32 (24) |
| Musculoskeletal pain | 27 (20 |
| Weakness | 18 (13) |
| Abdominal pain/nausea/vomiting | 14 (10) |
| Postoperative complaint | 12 (9) |
| Headache | 5 (4) |
| Other | 27 (20) |
| Caregiver characteristic, N=49 | |
| Age, y, mean (SD) | 52 (13) |
| Relationship to patient | |
| Family member | 43 (88) |
| Friend | 4 (8) |
| Paid caregiver | 2 (4) |
| Frequency of patient contact | |
| Lives with patient | 31 (63) |
| Waking hours per day with patient, mean (SD) | 11 (7) |
| Physician characteristic, N=22 | |
| Sex | |
| Female | 7 (30) |
| Male | 15 (70) |
| Years practicing emergency medicine, mean (SD) | 11 (9) |
Factors Contributing to Need for Acute Care Within 30 Days of Hospital Discharge
Overall, 89% of patients, 87% of emergency physicians, and 96% of caregivers identified at least 1 factor contributing to the return ED visit (Table 2). Patient‐physician concordances in factors contributing to early ED care were generally poor, with weighted statistics ranging from 0.02 to 0.33 and agreement rates ranging from 59% to 93%. Patient‐caregiver concordances in factors contributing to early ED care were generally better, with weighted statistics ranging from 0.05 to 0.68 and agreement rates ranging from 78% to 96%.
| Patient Report, N=135 | Physician Report, N=135 | Caregiver Report, N=49 | Patient‐Physician Concordance | Patient Caregiver Concordance | ||||||
|---|---|---|---|---|---|---|---|---|---|---|
| n | % | n | % | n | % | Agreement % | Agreement % | |||
| ||||||||||
| Factors contributing to early acute care | ||||||||||
| Issues related to prior hospitalization | 92 | 68 | 88 | 65 | 36 | 73 | 0.33 | 70 | 0.51 | 78 |
| Progression of chronic disease or medical condition | 56 | 41 | 60 | 44 | 22 | 45 | 0.15 | 59 | 0.58 | 80 |
| Missed doses or not taking prescribed medications | 9 | 7 | 7 | 5 | 2 | 4 | 0.34 | 93 | 0.3 | 92 |
| Not enough support at home | 7 | 5 | 15 | 11 | 2 | 4 | 0.02 | 85 | 0.05 | 90 |
| Fall or unsteadiness when walking | 12 | 9 | 6 | 4 | 4 | 8 | 0.05 | 88 | 0.65 | 96 |
| Side effects of current medication | 26 | 19 | 5 | 4 | 7 | 14 | 0.21 | 83 | 0.68 | 90 |
| Potential ways to prevent early acute care visit | ||||||||||
| Improved discharge care instructions | 13 | 10 | 17 | 13 | 3 | 6 | 0.09 | 79 | 0.46 | 92 |
| Review of medications | 13 | 10 | 7 | 5 | 5 | 10 | 0.08 | 85 | 0.55 | 82 |
| Home health visits | 9 | 7 | 21 | 16 | 2 | 4 | 0.19 | 84 | 0.03 | 94 |
| Follow‐up appointment with primary care doctor | 14 | 10 | 29 | 21 | 0 | 0 | 0.08 | 74 | ||
| Follow‐up appointment with specialist | 10 | 7 | 28 | 21 | 5 | 10 | 0.05 | 75 | 0.33 | 88 |
Both physicians and caregivers identified factors contributing to ED visits when patients did not (Table 3). Specifically, they identified issues related to prior hospitalization contributing to the ED visit between 42% and 45% of the time when patients did not. Physicians identified progression of chronic disease or medical condition 38% of the time when the patient did not, compared to caregivers, who identified it 23% of the time patients did not. Physicians also indicated that not enough support at home as contributing to ED visits 11% of the time patents did not, compared to a 4% increase when caregivers were asked. Other reasons were reported through free text by 20% of patients, 16% of emergency physicians, and 22% of caregivers. Across all stakeholders, around one‐third (27%31%) of these other factors related to postoperative complications, and 27% to 44% related to the perception of being discharged too early.
| If Patient Did Not Report | ||
|---|---|---|
| Physician Report | Caregiver Report | |
| ||
| Factors contributing to early acute care | ||
| Issues related to prior hospitalization | 18 (42) | 9 (45) |
| Progression of disease or medical condition | 30 (38) | 7 (23) |
| Missed doses or not taking prescribed medications | 4 (3) | 1 (2) |
| Not enough support at home | 14 (11) | 2 (4) |
| Fall or unsteadiness when walking | 5 (4) | 2 (4) |
| Side effects of current medication | 1 (1) | 0 |
| Potential ways to prevent early acute care visit | ||
| Improved discharge care instructions | 16 (13) | 1 (2) |
| Review of medications | 7 (6) | 2 (5) |
| Home health visits | 17 (13) | 2 (4) |
| Follow‐up appointment with primary care doctor | 25 (21) | 0 |
| Follow‐up appointment with specialist | 25 (20) | 3 (7) |
Potential Ways to Prevent Early Acute Care Within 30 Days of Hospital Discharge
Overall, 56% of patients, 55% of emergency physicians, and 49% of caregivers selected at least 1 intervention that could have potentially prevented the ED visit. However, no single intervention was identified by more than one‐fifth of participants (Table 2). Around 10% of patients identified either improved discharge instructions, review of medications, and follow‐up care with primary care provider as potential ways to prevent ED visits. Physicians identified both follow‐up with a primary care provider and specialist around 21% of the time as potential preventive interventions. Patient‐physician concordances in potential ways to prevent ED care were extremely poor, with weighted statistics ranging from 0.08 to 0.19 and agreement rates ranging from 74% to 85%. Patient‐caregiver concordances in potential ways to prevent ED care again were generally better, with weighted statistics ranging from 0.03 to 0.55 and agreement rates ranging from 82% to 94%.
Other potential interventions were reported by 16% of patients, 10% of emergency physicians, and 10% of caregivers. From patients, other interventions related to staying in the hospital longer on last admission and better medication instructions from last admission. Other interventions reported by physicians included home physical therapy, improved primary care provision, and more home support. Physicians, but not caregivers, more frequently identified potentially useful interventions when patients did not (Table 3). Other interventions reported by caregivers included staying in the hospital longer, improved patient activity, and better medications.
DISCUSSION
Several findings from this study can improve the understanding of what factors influence the utilization of the ED soon after inpatient discharge and what interventions could potentially prevent them. Consistent with our hypothesis, there are significant discordances between patients, their caregivers, and emergency physicians. Additionally, emergency physicians and caregivers were able to identify factors and potential opportunities for prevention a significant, albeit variable, amount of time the patients did not. Perhaps not surprisingly, we found that across stakeholders, the majority of ED visits are perceived as related to issues from the prior hospitalization or progression of chronic disease or medical condition. Of some concern, we found that less than half of patients, physicians, and caregivers could identify an intervention to potentially prevent the ED visit.
The large discordances between patients' and physicians' perceptions in our study were similar to those found in prior studies from primary care.[13, 14, 15] No prior study has examined discordances in emergency care or regarding perceptions about care‐transition difficulties. Feigenbaum et al.[10] interviewed patients, caregivers, and physicians to create composite definitions of potentially preventable readmissions. They did not, however, look at how these perceptions differ or describe the relative contribution of individual stakeholders to overall definitions. The discordances between patient and emergency physician perceptions may be due to a couple of potential causes. First, emergency physicians may have greater access to medical history data than patients, allowing them to develop more objective assessments. This is supported by our finding that physicians identified factors when patients did not. Second, patients may understand certain care‐transition difficulties that physicians do not elicit from history taking. This may be especially apparent in the emergency setting, where physicians are time limited and do not have established care relationships with patients.
The moderate agreement between patient and caregiver perceptions are similar to a couple of studies examining perceived quality of life among patients.[16, 17] These discordances can be due to a couple of potential causes. First, caregivers may witness deficits or transition difficulties that the patient may not. This may be particularly true for caregivers who are providing substantial support in managing the patient's healthcare or for patients with cognitive impairment. Second, caregivers may not know the patient history well enough to know what specific issues affect the patient. This would be likely when caregivers do not live with patients or serve a central role in caregiving.
The overwhelming perception that the majority of ED visits are related to issues from the prior hospitalization or progression of chronic disease or medical condition suggests that, by and large, acute care needs soon after hospital discharges are not new unrelated medical issues, and thus theoretically could be predicted and prevented. This is consistent with prior prediction models showing that chronic medical comorbidities have strong associations with hospital readmission.[18, 19] It also supports probing care issues with patients prior to hospital discharge.[20]
The finding that less than half of patients, physicians, or caregivers could identify an intervention to potentially prevent the ED visit echoes prior research, indicating that only a minority of readmissions may be truly preventable,[21] and suggests that there may not be obvious needs that can be addressed to prevent acute care visits. An alternative interpretation is that the healthcare system does not currently have a suitable alternative to meet the perceived needs of patients. Despite this, patients occasionally perceived that better discharge instructions, review of medications, and sooner follow‐up appointments with a primary care doctor could have potentially prevented their ED visit. This is consistent with numerous prior studies and supports better transition‐of‐care programs.
Our study had a small sample size, which results in wide confidence intervals on all point estimates of percentages, limiting the precision of our findings. No medical charts were reviewed to determine the medical reasons for the index admission, the prior course of care, or subsequent hospital course after emergency care, limiting our ability to link perceptions with actual past hospital experiences or compare differences in perceptions by subsequent readmission. Another limitation is a lack of generalizability of our findings to other patients, hospitals, or regions. Our patient population was largely white and English speaking only for participation in this study. Also, our hospital ED admits an average of 48% of patients, which is higher than most hospitals. We enrolled a convenience sample as opposed to a consecutive sample of patients due to limitations in research associate staffing, potentially biasing our sample. We attempted to minimize this bias by scheduling shifts across days and time periods. We did not systematically collect the number of patients or caregivers who refused participation, but believe that it was less than 5% of those approached. Other limitations include possible reporting biases associated with in‐person interviews, which we attempted to minimize by conducting all surveys in private.
SUMMARY
Identifying needs in patients who utilize the ED soon after being discharged from inpatient care is essential for planning appropriate care‐transition interventions. Our findings suggest that multiple stakeholders may be necessary to fully elicit targets for effective care‐transition programs.
Disclosure: Nothing to report.
- Medicare Payment Advisory Commission. Payment policy for inpatient readmissions. In: Report to the congress: promoting greater efficiency in Medicare. Available at: http://www.medpac.gov/chapters/Jun07_Ch05.pdf. Accessed February 9, 2010.
- , , , et al. A reengineered hospital discharge program to decrease rehospitalization: a randomized trial. Ann Intern Med. 2009;150(3):178–187.
- , , , et al. Hospital readmission in general medicine patients: a prediction model. J Gen Intern Med. 2010;25(3):211–219.
- , , , , , . Hospital‐initiated transitional care interventions as a patient safety strategy: a systematic review. Ann Intern Med. 2013;158(5 pt 2):433–440.
- , . Hospital readmissions as a measure of quality of health care: advantages and limitations. Arch Intern Med. 2000;160(8):1074–1081.
- , , , . Emergency department visits after hospital discharge: a missing part of the equation. Ann Emerg Med. 2013;62(2):145–150.
- , , , et al. Use of hospital‐based acute care among patients recently discharged from the hospital. JAMA. 2013;309(4):364–371.
- , , , , , . Continuity of care and monitoring pain after discharge: patient perspective. J Adv Nurs. 2010;66(1):40–48.
- , , , , , . Perceptions of readmitted patients on the transition from hospital to home. J Hosp Med. 2012;7(9):709–712.
- , , , et al. Factors contributing to all‐cause 30‐day readmissions: a structured case series across 18 hospitals. Med Care. 2012;50(7):599–605.
- , , , et al. Transition of care consensus policy statement, American College of Physicians‐Society of General Internal Medicine‐Society of Hospital Medicine‐American Geriatric Society‐American College of Emergency Physicians‐Society of Academic Emergency Medicine. J Gen Intern Med. 2009;24(8):971–976.
- , . J Clin Epidemiol. 1990;43(6):551–558.
- , , , , , . Patient‐doctor agreement about problems needing follow‐up visit. JAMA. 1979;242(4):344–346.
- , , , , , . Reasons for encounter and diagnosed health problems: convergence between doctors and patients. Fam Pract. 1992;9(2):191–194.
- , , , . Concordance between physicians and their older and younger patients in the primary care medical encounter. Gerontologist. 1989;29(6):808–813.
- , , , et al. Do older patients and their family caregivers agree about the quality of chronic illness care? Int J Qual Health Care. 2013;25(5):515–524.
- , , . Proxy reporting of quality of life using the EQ‐5D. Med Care. 2002;40(12):1186–1195.
- , . Hospital readmissions—not just a measure of quality. JAMA. 2011;306(16):1796–1797.
- , , , . Redefining readmission risk factors for general medicine patients. J Hosp Med. 2011;6(2):54–60.
- , , . Tying up loose ends: discharging patients with unresolved medical issues. Arch Intern Med. 2007;167(12):1305–1311.
- , , , . Potentially avoidable 30‐day hospital readmissions in medical patients: derivation and validation of a prediction model. JAMA Intern Med. 2013;173(8):632–638.
© 2014 Society of Hospital Medicine
Confused, cold, and lethargic
CASE Confused and cold
Ms. K, age 48, is brought to the emergency department (ED) by her husband because she has become increasingly lethargic over the past 2 weeks and cannot attend to activities of daily living. She is incontinent of stool and poorly responsive.
Ms. K’s husband reports that lethargy culminated in his wife sleeping 30 continuous hours. She has a history of a ruptured cerebral arteriovenous malformation (AVM) complicated by a secondary infarct 7 years ago, with residual symptoms of frontal lobe syndrome. Until 2 weeks ago, however, she was in her usual state of health.
Symptoms have included depression, mood lability, impulsivity, disinhibition, poor focus, and apathy. An outpatient psychiatrist has managed these symptoms with antidepressants and atypical antipsychotics.
When Ms. K arrives in the ED, she is taking citalopram, 30 mg/d, and paliperidone,
6 mg/d. Her psychiatrist started paliperidone 2 months ago, increasing the dosage to 6 mg/d 6 weeks before presentation because of worsening mood lability, disinhibition, and paranoia regarding her caregivers. Her husband denies any other medication changes or exposure to environmental toxins.
In the ED, Ms. K is confused and oriented only to person. Vital signs are: pulse 46 bpm; blood pressure, 66/51 mm Hg; respirations, 12/min; and temperature, 29.9ºC (85.8ºF) via bladder probe.
a) major depressive disorder, severe, with catatonic features
b) exposure to cold
c) hypothyroidism
d) drug-induced hypothermia
e) stroke
f) sepsis
g) delirium
The authors’ observations
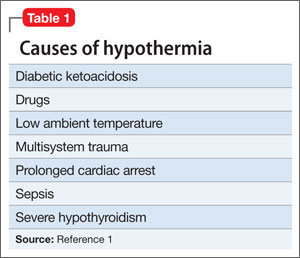
Hypothermia is core body temperature <35ºC (95ºF).1 It often is caused by exposure to low ambient temperature (Table 1),1 but Ms. K’s husband denied that she had been exposed to cold. Because of Ms. K’s neurologic history, stroke was high on the differential diagnosis, but physical examination did not reveal evidence of focal dysfunction and was significant only for altered mental status.
Ms. K had no posturing, rigidity, negativism, or excessive motor activity that would suggest catatonia. Before she became lethargic, her husband had not noted any deterioration of mood, although she did exhibit other behavioral changes that prompted her outpatient psychiatrist to increase the dosage of paliperidone. Although Ms. K began experiencing persecutory delusions—she believed that her caregivers were trying to harm her—she and her family denied perceptual disturbances. On examination, she did not appear responsive to auditory or visual hallucinations.
Frontal lobe syndrome is defined as a set of changes in the cognitive, behavioral, or emotional domains, often leading to disturbed affect, alteration of attention, aphasia, perseveration, disinhibition, and personality changes.2 These symptoms are not specific to lesions in the frontal lobes but can arise from lesions anywhere in the frontal-striatal-thalamic circuit.3 Causes include traumatic brain injury, neurodegenerative disorders, cerebrovascular disease, tumors, and aging.2 Recommended treatment incorporates psychosocial interventions with drug treatment to target specific symptoms. Medications reported to be effective include typical and atypical antipsychotics to target aggression and agitation; benzodiazepines to reduce arousal; antidepressants for mood symptoms, dopamine agonists (eg, bromocriptine) to decrease apathy, and mood stabilizers to target mood lability.4
Before her AVM rupture, review of Ms. K’s psychiatric history revealed no psychiatric symptoms or impaired functioning. When hospitalized for the AVM repair, she was started on sertraline. She began seeing a psychiatrist 2 years later because of increased agitation and behavioral disturbances, and aripiprazole was added. Persistent agitation prompted a trial of divalproex sodium, which was discontinued because of slurred speech and increased distractibility. Aripiprazole was tapered and replaced with paliperidone because of poor response. Citalopram was initiated 1 year before she presented to the ED.
a) brain MRI
b) infectious evaluation (lumbar puncture with analysis of cerebrospinal fluid, complete blood count, blood cultures, chest radiographs)
c) endocrine panel
d) urine toxicology screen
EVALUATION Hypothermia
Laboratory tests reveal multiple abnormalities, including thrombocytopenia (platelet level, 53 ×103/μL), altered coagulation (partial thromboplastin time, 55.6 s), elevated levels of hepatic transaminases (aspartate aminotransferase, 168 U/L; alanine aminotransferase, 357 U/L), and increased alkaline phosphatase (206 U/L). Other mild metabolic disturbances include: sodium, 149 mEq/L; CO2, 33 mEq/L; and blood urea nitrogen, 24 mg/dL.
These laboratory values are consistent with complications of hypothermia.1
ECG reveals sinus bradycardia (40 bpm) and Osborn waves (additional deflection at the end of the QRS complex), which are seen often in hypothermia.1 Head CT and brain MRI show chronic changes after Ms. K’s right temporoparietal AVM rupture, but no acute abnormality. Urinalysis, blood cultures, and chest radiographs are negative for infection. Urine toxicology screen is negative. Results of thyroid function tests and pituitary hormones studies are significant only for hyperprolactinemia of 155.7 ng/mL, a known adverse effect of antipsychotics.5
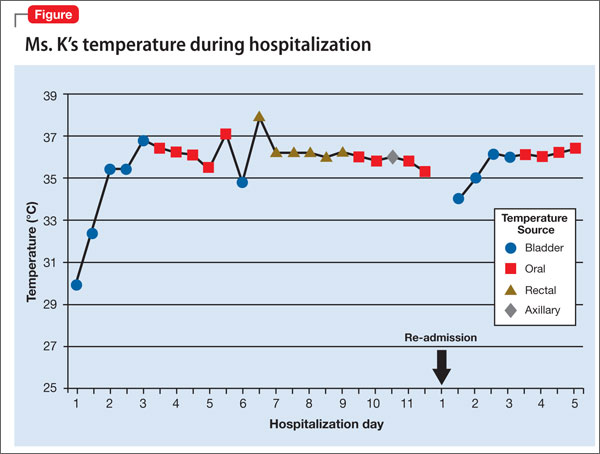
Ms. K is admitted and rewarmed passively and with warm IV fluids; by day 10 of hospitalization, temperature is stable (>35.1ºC [95.2ºF]). Thrombocytopenia, transaminitis, and altered mental status resolve.
Ms. K’s oral medications, including citalopram and paliperidone, have been held since admission because of her altered mental status. The psychiatry service is consulted to evaluate whether her presentation could be related to her change of medication.
A literature search reveals no report of paliperidone-induced hypothermia, but we consider it a possible explanation for Ms. K’s presentation. Lamotrigine (titrated to 50 mg/d), a benzodiazepine (oral lorazepam as needed), and discontinuing antipsychotics are recommended. After she returns to her baseline functioning, Ms. K is discharged to a skilled nursing facility.
Ms. K presents to the ED 2 days after discharge with altered mental status. Vital signs are: blood pressure, 90/55 mm Hg; pulse, 59 bpm; respiratory rate, 14/min; and temperature, 34.4ºC (93.9ºF) via bladder probe (Figure). Laboratory tests were significant for hepatic transaminitis (aspartate aminotransferase, 75 U/L; alanine aminotransferase, 122 U/L) and elevated alkaline phosphatase (226 U/L). A review of records from the nursing facility revealed that Ms. K was receiving paliperidone because of an error in the discharge summary, which recommended restarting all prior medications.
The authors’ observations
The Naranjo Causality Scale,6 which categorizes the probability that an adverse event is related to a drug (based on several variables, including timing of the drug administration with the onset of event, drug dosage and levels, response relationships to a drug, including re-challenge when possible, and previous patient experience with the medication), often is used to evaluate whether an adverse clinical event has been caused by a drug (Table 2). We applied the Scale to Ms. K’s case, which revealed a score of 7—indicating a probable adverse drug reaction. The sequence of events in Ms. K’s case that led to a paliperidone challenge-dechallenge-rechallenge, and the resulting hypothermia, are, we concluded, evidence of an adverse drug reaction.
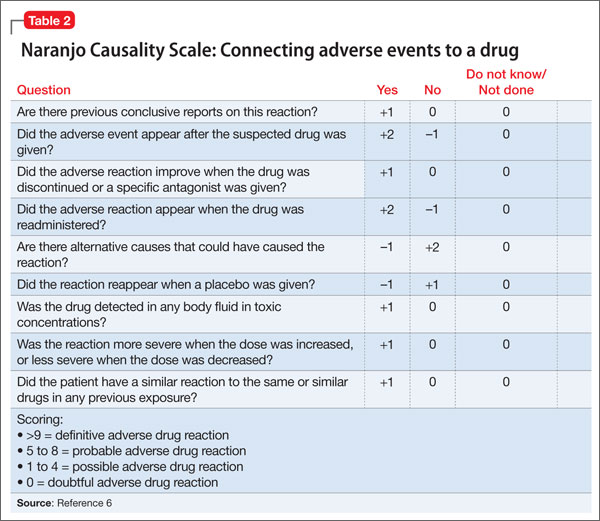
Using the World Health Organization database for adverse drug reactions, van Marum et al7 found 480 reports hypothermia with antipsychotics as of 2007 (compared with 524 reports of hyperthermia in the same period); 55% involved atypical antipsychotics, mainly risperidone. There are no case reports of paliperidone-induced hypothermia; however, several reports of hypothermia have been attributed to risperidone, and paliperidone is the primary active metabolite of risperidone.5
To identify risk factors for hypothermia with antipsychotic use, van Marum et al7 performed a literature search for case reports of antipsychotic-induced hypothermia, which revealed no association with age or sex. The most common diagnosis in cases of antipsychotic-induced hypothermia was schizophrenia (51%). In 73% of the cases, hypothermia followed the start or dosage increase of the antipsychotic. These observations have been noted in case reports and case series of hypothermia associated with antipsychotic use.8-12
Mechanism of action
One proposed mechanism for antipsychotic-induced hypothermia includes preferential 5-HT2A receptor antagonism over D2 receptor antagonism.7,12 It has been believed that, under normal conditions, the action of dopamine to reduce body temperature and the action of serotonin to elevate it are in balance.9
Another possible mechanism is peripheral á2-adrenergic blockade, which might increase the hypothermic effect by inhibiting peripheral responses to cooling, such as vasoconstriction and shivering.7,8 Boschi et al13 found that antipsychotics cause hypothermia in rats when the drug is administered intraperitoneally but not when given intrathecally. Perhaps for these reasons, in the early 1950s, before its psychotropic properties were known, chlorpromazine was used during surgery to induce artificial hibernation and suppress the body’s response to cooling.7 The therapeutic activity of paliperidone is mediated though a D2, 5-HT2A, and á2-receptor antagonism5; these mechanisms could, therefore, be contributing to Ms. K’s hypothermia.
Patients with preexisting brain damage— such as Ms. K—might be at increased risk of antipsychotic-induced hypothermia.7,8 This includes focal damage to central thermoregulatory centers, such as the pre-optic anterior hypothalamic region,14 and more diffuse damage seen in patients with cognitive impairment or a seizure disorder.8
Studies of people with schizophrenia show a decrease in core temperature after administration of an antipsychotic,15 raising the possibility of an impairment of baseline thermoregulatory control. Such thermal dysregulation in patients with schizophrenia might be explained by changes in neurotensin levels.7
The neuropeptide neurotensin has been implicated in the regulation of prolactin release and interacts to a significant degree with the dopaminergic system.16 When administered to animals, neurotensin suppresses heat production and increases heat loss.17 The neurotensin level in CSF was found to be lower in non-medicated patients with schizophrenia than in healthy controls, with an inverse correlation between the severity of symptoms and the neurotensin level.18
Additionally, persons with schizophrenia might be at increased risk of developing hypothermia when exposed to a low environmental temperature.7,8 Kudoh et al19 investigated temperature regulation during anesthesia in patients with chronic (≥7 years) schizophrenia receiving antipsychotics, and compared findings against what was seen in controls. The team reported that patients with schizophrenia had significantly lower intraoperative temperatures.
A published analysis of cases and studies of antipsychotic-induced hypothermia describes the combination of drug variables, patient variables, and environmental variables that contribute to thermal dysregulation (Table 3).7-12,15 The recommendation for practitioners is that, when considering an antipsychotic for a patient at high risk of thermal dysregulation, your choice of an agent should take that risk into account, especially when that drug is one that has comparatively stronger serotonergic and peripheral á-adrenergic effects. You should monitor patients closely for hypothermia after starting and when increasing the dosage of the drug. In patients with schizophrenia who might have a problem with baseline thermoregulation, advise them to take measures to counteract their increased susceptibility to low ambient temperatures.
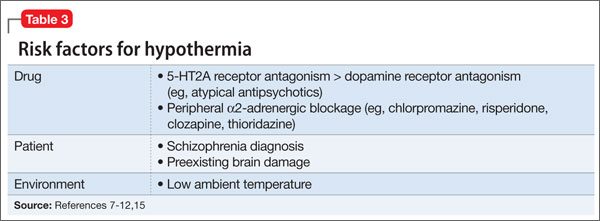
OUTCOME Readmission
Ms. K was readmitted, rewarmed, and discharged to a skilled nursing facility 4 days later, after baseline function returned to normal and temperature stabilized. Paliperidone is now listed in her electronic medical record as “drug intolerance.”
This case also highlights the importance of adequate medication reconciliation at
admission and discharge, especially when using an electronic medical record system, because what might otherwise be considered a minor mistake can have devastating consequences.
Bottom Line
Thermal dysregulation—hyperthermia and hypothermia—can occur secondary to an antipsychotic. Determining whether a patient is at increased risk of either of these adverse effects is important when deciding to use antipsychotics. Recognizing agents that can cause hypothermia is essential, because management requires prompt discontinuation of the offending drug.
Related Resource
- Espay AJ, et al. Frontal lobe syndromes. http://emedicine.medscape.com/article/1135866-overview. Updated September 17, 2012. Accessed November 3, 2012.
Drug Brand Names
Aripiprazole • Abilify Lamotrigine • Lamictal
Bromocriptine • Parlodel Lorazepam • Ativan
Chlorpromazine • Thorazine Paliperidone • Invega
Citalopram • Celexa Risperidone • Risperdal
Clozapine • Clozaril Sertraline • Zoloft
Divalproex sodium • Depakote Thioridazine • Mellaril
Disclosure
The authors report no financial relationships with any company whose products are mentioned in this article or with manufacturers of competing products.
1. Aslam AF, Aslam AK, Vasavada BC, et al. Hypothermia: evaluation, electrocardiographic manifestations, and management. Am J Med. 2006;119(4):297-301.
2. Hanna-Pladdy B. Dysexecutive syndromes in neurologic disease. J Neurol Phys Ther. 2007;31(3):119-127.
3. Salloway SP. Diagnosis and treatment of patients with “frontal lobe” syndromes. J Neuropsychiatry Clin Neurosci. 1994;6(4):388-398.
4. Campbell JJ, Duffy JD, Salloway SP. Treatment strategies for patients with dysexecutive syndromes. In: Salloway SP, Malloy PF, Duffy JD, eds. The frontal lobes and neuropsychiatric illness. Washington, DC: American Psychiatric Press; 2001:153-163.
5. Stahl SM. Essential psychopharmacology: neuroscientific basis and practical applications. 3rd ed. New York, NY: Cambridge University Press; 2000:336.
6. Naranjo CA, Busto U, Sellers EM, et al. A method for estimating the probability of adverse drug reactions. Clin Pharmacol Ther. 1981;30(2):239-245.
7. van Marum RJ, Wegewijs MA, Loonen AJM, et al. Hypothermia following antipsychotic drug use. Eur J Clin Pharmacol. 2007;63(6):627-631.
8. Kreuzer P, Landgrebe M, Wittmann M, et al. Hypothermia associated with antipsychotic drug use: a clinical case series and review of current literature. J Clin Pharmacol. 2012;52(7)1090-1097.
9. Hung CF, Huang TY, Lin PY. Hypothermia and rhabdomyolysis following olanzapine injection in an adolescent with schizophreniform disorder. Gen Hosp Psychiatry. 2009;31(4):376-378.
10. Razaq M, Samma M. A case of risperidone-induced hypothermia. Am J Ther. 2004;11(3):229-230.
11. Schwaninger M, Weisbrod M, Schwab S, et al. Hypothermia induced by atypical neuroleptics. Clin Neuropharmacol. 1998;21(6):344-346.
12. Bookstaver PB, Miller AD. Possible long-acting risperidone-induced hypothermia precipitating phenytoin toxicity in an elderly patient. J Clin Pharm Ther. 2011; 36(3):426-429.
13. Boschi G, Launay N, Rips R. Neuroleptic-induced hypothermia in mice: lack of evidence for a central mechanism. Br J Pharmacol. 1987;90(4):745-751.
14. Sessler DI. Thermoregulatory defense mechanisms. Crit Care Med. 2009;37(suppl 7):S203-S210.
15. Shiloh R, Weizman A, Epstein Y, et al. Abnormal thermoregulation in drug-free male schizophrenia patients. Eur Neuropsychopharmacol. 2001;11(4):285-288.
16. McCann SM, Vijayan E. Control of anterior pituitary hormone secretion by neurotensin. Ann N Y Acad Sci. 1992; 668:287-297.
17. Chandra A, Chou HC, Chang C, et al. Effecst of intraventricular administration of neurotensin and somatostatin on thermoregulation in the rat. Neuropharmacology. 1981;20(7):715-718.
18. Sharma RP, Janicak PG, Bissette G, et al. CSF neurotensin concentrations and antipsychotic treatment in schizophrenia and schizoaffective disorder. Am J Psychiatry. 1997; 154(7):1019-1021.
19. Kudoh A, Takase H, Takazawa T. Chronic treatment with antipsychotics enhances intraoperative core hypothermia. Anesth Analg. 2004;98(1):111-115.
CASE Confused and cold
Ms. K, age 48, is brought to the emergency department (ED) by her husband because she has become increasingly lethargic over the past 2 weeks and cannot attend to activities of daily living. She is incontinent of stool and poorly responsive.
Ms. K’s husband reports that lethargy culminated in his wife sleeping 30 continuous hours. She has a history of a ruptured cerebral arteriovenous malformation (AVM) complicated by a secondary infarct 7 years ago, with residual symptoms of frontal lobe syndrome. Until 2 weeks ago, however, she was in her usual state of health.
Symptoms have included depression, mood lability, impulsivity, disinhibition, poor focus, and apathy. An outpatient psychiatrist has managed these symptoms with antidepressants and atypical antipsychotics.
When Ms. K arrives in the ED, she is taking citalopram, 30 mg/d, and paliperidone,
6 mg/d. Her psychiatrist started paliperidone 2 months ago, increasing the dosage to 6 mg/d 6 weeks before presentation because of worsening mood lability, disinhibition, and paranoia regarding her caregivers. Her husband denies any other medication changes or exposure to environmental toxins.
In the ED, Ms. K is confused and oriented only to person. Vital signs are: pulse 46 bpm; blood pressure, 66/51 mm Hg; respirations, 12/min; and temperature, 29.9ºC (85.8ºF) via bladder probe.
a) major depressive disorder, severe, with catatonic features
b) exposure to cold
c) hypothyroidism
d) drug-induced hypothermia
e) stroke
f) sepsis
g) delirium
The authors’ observations
Hypothermia is core body temperature <35ºC (95ºF).1 It often is caused by exposure to low ambient temperature (Table 1),1 but Ms. K’s husband denied that she had been exposed to cold. Because of Ms. K’s neurologic history, stroke was high on the differential diagnosis, but physical examination did not reveal evidence of focal dysfunction and was significant only for altered mental status.
Ms. K had no posturing, rigidity, negativism, or excessive motor activity that would suggest catatonia. Before she became lethargic, her husband had not noted any deterioration of mood, although she did exhibit other behavioral changes that prompted her outpatient psychiatrist to increase the dosage of paliperidone. Although Ms. K began experiencing persecutory delusions—she believed that her caregivers were trying to harm her—she and her family denied perceptual disturbances. On examination, she did not appear responsive to auditory or visual hallucinations.
Frontal lobe syndrome is defined as a set of changes in the cognitive, behavioral, or emotional domains, often leading to disturbed affect, alteration of attention, aphasia, perseveration, disinhibition, and personality changes.2 These symptoms are not specific to lesions in the frontal lobes but can arise from lesions anywhere in the frontal-striatal-thalamic circuit.3 Causes include traumatic brain injury, neurodegenerative disorders, cerebrovascular disease, tumors, and aging.2 Recommended treatment incorporates psychosocial interventions with drug treatment to target specific symptoms. Medications reported to be effective include typical and atypical antipsychotics to target aggression and agitation; benzodiazepines to reduce arousal; antidepressants for mood symptoms, dopamine agonists (eg, bromocriptine) to decrease apathy, and mood stabilizers to target mood lability.4
Before her AVM rupture, review of Ms. K’s psychiatric history revealed no psychiatric symptoms or impaired functioning. When hospitalized for the AVM repair, she was started on sertraline. She began seeing a psychiatrist 2 years later because of increased agitation and behavioral disturbances, and aripiprazole was added. Persistent agitation prompted a trial of divalproex sodium, which was discontinued because of slurred speech and increased distractibility. Aripiprazole was tapered and replaced with paliperidone because of poor response. Citalopram was initiated 1 year before she presented to the ED.
a) brain MRI
b) infectious evaluation (lumbar puncture with analysis of cerebrospinal fluid, complete blood count, blood cultures, chest radiographs)
c) endocrine panel
d) urine toxicology screen
EVALUATION Hypothermia
Laboratory tests reveal multiple abnormalities, including thrombocytopenia (platelet level, 53 ×103/μL), altered coagulation (partial thromboplastin time, 55.6 s), elevated levels of hepatic transaminases (aspartate aminotransferase, 168 U/L; alanine aminotransferase, 357 U/L), and increased alkaline phosphatase (206 U/L). Other mild metabolic disturbances include: sodium, 149 mEq/L; CO2, 33 mEq/L; and blood urea nitrogen, 24 mg/dL.
These laboratory values are consistent with complications of hypothermia.1
ECG reveals sinus bradycardia (40 bpm) and Osborn waves (additional deflection at the end of the QRS complex), which are seen often in hypothermia.1 Head CT and brain MRI show chronic changes after Ms. K’s right temporoparietal AVM rupture, but no acute abnormality. Urinalysis, blood cultures, and chest radiographs are negative for infection. Urine toxicology screen is negative. Results of thyroid function tests and pituitary hormones studies are significant only for hyperprolactinemia of 155.7 ng/mL, a known adverse effect of antipsychotics.5
Ms. K is admitted and rewarmed passively and with warm IV fluids; by day 10 of hospitalization, temperature is stable (>35.1ºC [95.2ºF]). Thrombocytopenia, transaminitis, and altered mental status resolve.
Ms. K’s oral medications, including citalopram and paliperidone, have been held since admission because of her altered mental status. The psychiatry service is consulted to evaluate whether her presentation could be related to her change of medication.
A literature search reveals no report of paliperidone-induced hypothermia, but we consider it a possible explanation for Ms. K’s presentation. Lamotrigine (titrated to 50 mg/d), a benzodiazepine (oral lorazepam as needed), and discontinuing antipsychotics are recommended. After she returns to her baseline functioning, Ms. K is discharged to a skilled nursing facility.
Ms. K presents to the ED 2 days after discharge with altered mental status. Vital signs are: blood pressure, 90/55 mm Hg; pulse, 59 bpm; respiratory rate, 14/min; and temperature, 34.4ºC (93.9ºF) via bladder probe (Figure). Laboratory tests were significant for hepatic transaminitis (aspartate aminotransferase, 75 U/L; alanine aminotransferase, 122 U/L) and elevated alkaline phosphatase (226 U/L). A review of records from the nursing facility revealed that Ms. K was receiving paliperidone because of an error in the discharge summary, which recommended restarting all prior medications.
The authors’ observations
The Naranjo Causality Scale,6 which categorizes the probability that an adverse event is related to a drug (based on several variables, including timing of the drug administration with the onset of event, drug dosage and levels, response relationships to a drug, including re-challenge when possible, and previous patient experience with the medication), often is used to evaluate whether an adverse clinical event has been caused by a drug (Table 2). We applied the Scale to Ms. K’s case, which revealed a score of 7—indicating a probable adverse drug reaction. The sequence of events in Ms. K’s case that led to a paliperidone challenge-dechallenge-rechallenge, and the resulting hypothermia, are, we concluded, evidence of an adverse drug reaction.
Using the World Health Organization database for adverse drug reactions, van Marum et al7 found 480 reports hypothermia with antipsychotics as of 2007 (compared with 524 reports of hyperthermia in the same period); 55% involved atypical antipsychotics, mainly risperidone. There are no case reports of paliperidone-induced hypothermia; however, several reports of hypothermia have been attributed to risperidone, and paliperidone is the primary active metabolite of risperidone.5
To identify risk factors for hypothermia with antipsychotic use, van Marum et al7 performed a literature search for case reports of antipsychotic-induced hypothermia, which revealed no association with age or sex. The most common diagnosis in cases of antipsychotic-induced hypothermia was schizophrenia (51%). In 73% of the cases, hypothermia followed the start or dosage increase of the antipsychotic. These observations have been noted in case reports and case series of hypothermia associated with antipsychotic use.8-12
Mechanism of action
One proposed mechanism for antipsychotic-induced hypothermia includes preferential 5-HT2A receptor antagonism over D2 receptor antagonism.7,12 It has been believed that, under normal conditions, the action of dopamine to reduce body temperature and the action of serotonin to elevate it are in balance.9
Another possible mechanism is peripheral á2-adrenergic blockade, which might increase the hypothermic effect by inhibiting peripheral responses to cooling, such as vasoconstriction and shivering.7,8 Boschi et al13 found that antipsychotics cause hypothermia in rats when the drug is administered intraperitoneally but not when given intrathecally. Perhaps for these reasons, in the early 1950s, before its psychotropic properties were known, chlorpromazine was used during surgery to induce artificial hibernation and suppress the body’s response to cooling.7 The therapeutic activity of paliperidone is mediated though a D2, 5-HT2A, and á2-receptor antagonism5; these mechanisms could, therefore, be contributing to Ms. K’s hypothermia.
Patients with preexisting brain damage— such as Ms. K—might be at increased risk of antipsychotic-induced hypothermia.7,8 This includes focal damage to central thermoregulatory centers, such as the pre-optic anterior hypothalamic region,14 and more diffuse damage seen in patients with cognitive impairment or a seizure disorder.8
Studies of people with schizophrenia show a decrease in core temperature after administration of an antipsychotic,15 raising the possibility of an impairment of baseline thermoregulatory control. Such thermal dysregulation in patients with schizophrenia might be explained by changes in neurotensin levels.7
The neuropeptide neurotensin has been implicated in the regulation of prolactin release and interacts to a significant degree with the dopaminergic system.16 When administered to animals, neurotensin suppresses heat production and increases heat loss.17 The neurotensin level in CSF was found to be lower in non-medicated patients with schizophrenia than in healthy controls, with an inverse correlation between the severity of symptoms and the neurotensin level.18
Additionally, persons with schizophrenia might be at increased risk of developing hypothermia when exposed to a low environmental temperature.7,8 Kudoh et al19 investigated temperature regulation during anesthesia in patients with chronic (≥7 years) schizophrenia receiving antipsychotics, and compared findings against what was seen in controls. The team reported that patients with schizophrenia had significantly lower intraoperative temperatures.
A published analysis of cases and studies of antipsychotic-induced hypothermia describes the combination of drug variables, patient variables, and environmental variables that contribute to thermal dysregulation (Table 3).7-12,15 The recommendation for practitioners is that, when considering an antipsychotic for a patient at high risk of thermal dysregulation, your choice of an agent should take that risk into account, especially when that drug is one that has comparatively stronger serotonergic and peripheral á-adrenergic effects. You should monitor patients closely for hypothermia after starting and when increasing the dosage of the drug. In patients with schizophrenia who might have a problem with baseline thermoregulation, advise them to take measures to counteract their increased susceptibility to low ambient temperatures.
OUTCOME Readmission
Ms. K was readmitted, rewarmed, and discharged to a skilled nursing facility 4 days later, after baseline function returned to normal and temperature stabilized. Paliperidone is now listed in her electronic medical record as “drug intolerance.”
This case also highlights the importance of adequate medication reconciliation at
admission and discharge, especially when using an electronic medical record system, because what might otherwise be considered a minor mistake can have devastating consequences.
Bottom Line
Thermal dysregulation—hyperthermia and hypothermia—can occur secondary to an antipsychotic. Determining whether a patient is at increased risk of either of these adverse effects is important when deciding to use antipsychotics. Recognizing agents that can cause hypothermia is essential, because management requires prompt discontinuation of the offending drug.
Related Resource
- Espay AJ, et al. Frontal lobe syndromes. http://emedicine.medscape.com/article/1135866-overview. Updated September 17, 2012. Accessed November 3, 2012.
Drug Brand Names
Aripiprazole • Abilify Lamotrigine • Lamictal
Bromocriptine • Parlodel Lorazepam • Ativan
Chlorpromazine • Thorazine Paliperidone • Invega
Citalopram • Celexa Risperidone • Risperdal
Clozapine • Clozaril Sertraline • Zoloft
Divalproex sodium • Depakote Thioridazine • Mellaril
Disclosure
The authors report no financial relationships with any company whose products are mentioned in this article or with manufacturers of competing products.
1. Aslam AF, Aslam AK, Vasavada BC, et al. Hypothermia: evaluation, electrocardiographic manifestations, and management. Am J Med. 2006;119(4):297-301.
2. Hanna-Pladdy B. Dysexecutive syndromes in neurologic disease. J Neurol Phys Ther. 2007;31(3):119-127.
3. Salloway SP. Diagnosis and treatment of patients with “frontal lobe” syndromes. J Neuropsychiatry Clin Neurosci. 1994;6(4):388-398.
4. Campbell JJ, Duffy JD, Salloway SP. Treatment strategies for patients with dysexecutive syndromes. In: Salloway SP, Malloy PF, Duffy JD, eds. The frontal lobes and neuropsychiatric illness. Washington, DC: American Psychiatric Press; 2001:153-163.
5. Stahl SM. Essential psychopharmacology: neuroscientific basis and practical applications. 3rd ed. New York, NY: Cambridge University Press; 2000:336.
6. Naranjo CA, Busto U, Sellers EM, et al. A method for estimating the probability of adverse drug reactions. Clin Pharmacol Ther. 1981;30(2):239-245.
7. van Marum RJ, Wegewijs MA, Loonen AJM, et al. Hypothermia following antipsychotic drug use. Eur J Clin Pharmacol. 2007;63(6):627-631.
8. Kreuzer P, Landgrebe M, Wittmann M, et al. Hypothermia associated with antipsychotic drug use: a clinical case series and review of current literature. J Clin Pharmacol. 2012;52(7)1090-1097.
9. Hung CF, Huang TY, Lin PY. Hypothermia and rhabdomyolysis following olanzapine injection in an adolescent with schizophreniform disorder. Gen Hosp Psychiatry. 2009;31(4):376-378.
10. Razaq M, Samma M. A case of risperidone-induced hypothermia. Am J Ther. 2004;11(3):229-230.
11. Schwaninger M, Weisbrod M, Schwab S, et al. Hypothermia induced by atypical neuroleptics. Clin Neuropharmacol. 1998;21(6):344-346.
12. Bookstaver PB, Miller AD. Possible long-acting risperidone-induced hypothermia precipitating phenytoin toxicity in an elderly patient. J Clin Pharm Ther. 2011; 36(3):426-429.
13. Boschi G, Launay N, Rips R. Neuroleptic-induced hypothermia in mice: lack of evidence for a central mechanism. Br J Pharmacol. 1987;90(4):745-751.
14. Sessler DI. Thermoregulatory defense mechanisms. Crit Care Med. 2009;37(suppl 7):S203-S210.
15. Shiloh R, Weizman A, Epstein Y, et al. Abnormal thermoregulation in drug-free male schizophrenia patients. Eur Neuropsychopharmacol. 2001;11(4):285-288.
16. McCann SM, Vijayan E. Control of anterior pituitary hormone secretion by neurotensin. Ann N Y Acad Sci. 1992; 668:287-297.
17. Chandra A, Chou HC, Chang C, et al. Effecst of intraventricular administration of neurotensin and somatostatin on thermoregulation in the rat. Neuropharmacology. 1981;20(7):715-718.
18. Sharma RP, Janicak PG, Bissette G, et al. CSF neurotensin concentrations and antipsychotic treatment in schizophrenia and schizoaffective disorder. Am J Psychiatry. 1997; 154(7):1019-1021.
19. Kudoh A, Takase H, Takazawa T. Chronic treatment with antipsychotics enhances intraoperative core hypothermia. Anesth Analg. 2004;98(1):111-115.
Dissecting melancholia with evidence-based biomarker tools
For more than 50 years, depression has been studied, and understood, as a deficiency of specific neurotransmitters in the brain—namely dopamine, norepinephrine, and serotonin. Treatments for depression have been engineered to increase the release, or block the degradation, of these neurotransmitters within the synaptic cleft. Although a large body of evidence supports involvement of dopamine, norepinephrine, and serotonin in the pathophysiology of depression, the observation that pharmacotherapy is able to induce remission only in <50% of patients1 has prompted researchers to look beyond neurotransmitters for an understanding of depressive disorders (Table 1).
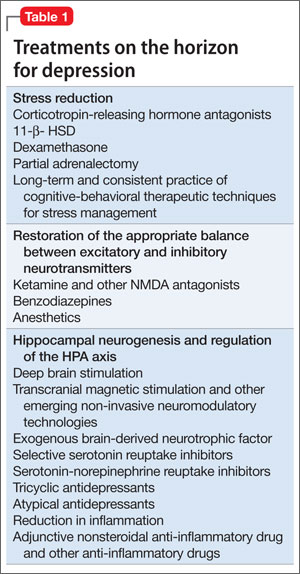
Today, theories of depression focus more on differences in neuron density in various regions of the brain; the effect of stress on neurogenesis and neuronal cell apoptosis; alterations in feedback pathways connecting the pre-frontal cortex to the limbic system; and the role of proinflammatory mediators evoked during the stress response (Box,2,3). These theories should not be viewed as separate entities because they are highly interconnected. Integrating them provides for a more expansive understanding of the pathophysiology of depression and biomarkers that are involved (Table 2).
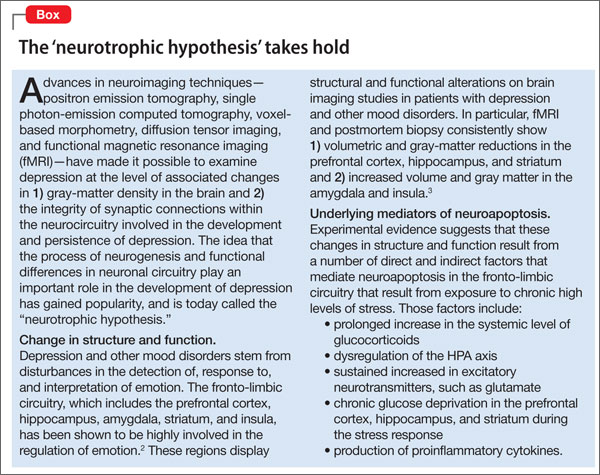
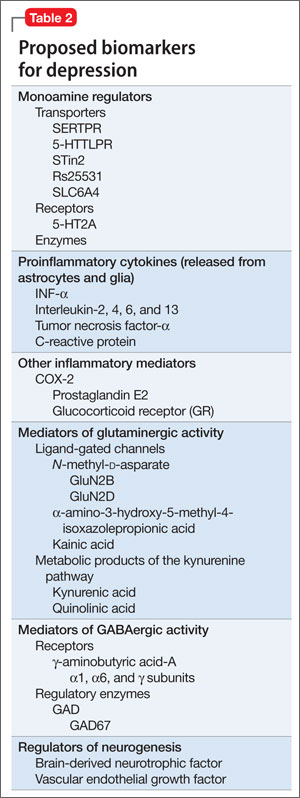
In this article, we:
- integrate the large body of evidence supporting the contribution of the above variables to the onset and persistence of depression
- propose a possible risk stratification model
- explore possibilities for treatment.
The stress response: How does it affect the brain?
Stress initiates a cascade of events in the brain and peripheral systems that enable an organism to cope with, and adapt to, new and challenging situations. That is why physiologic and behavioral responses to stress generally are considered beneficial to survival.
When stress is maintained for a long period, both brain and body are harmed because target cells undergo prolonged exposure to physiologic stress mediators. For example, Woolley and Gould4 exposed rats to varying durations of glucocorticoids and observed that treating animals with corticosterone injection for 21 days induced neuronal atrophy in the hippocampus and prefrontal cortex and increased release of proinflammatory cytokines from astrocytes within the limbic system. Stressful experiences are believed to be closely associated with development of psychological alterations and, thus, neuropsychiatric disorders.5 To go further: Chronic stress is believed to be the leading cause of depression.
When the brain perceives an external threat, the stress response is called into action. The amygdala, part of the primitive limbic system, is the primary area of the brain responsible for triggering the stress response,6 signaling the hypothalamus to release corticotropin-releasing hormone (CRH) to the anterior pituitary gland, which, in turn releases adrenocorticotropic hormone to the adrenal glands (Figure 1).7 The adrenal glands are responsible for releasing glucocorticoids, which, because of their lipophilic nature, can cross the blood-brain barrier and are found in higher levels in the cerebrospinal fluid (CSF) of depressed persons.7
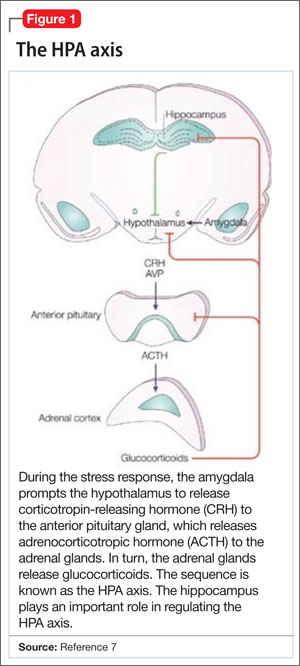
Once in the brain, glucocorticoids can be irreversibly degraded in the cytosol by the enzyme 11-β hydroxysteroid dehydrogenase type 2, a potential target for treating depression, or can bind to the glucocorticoid receptor (GR). Results of a research study of the role of cortisol in suppression of proinflammatory cytokine signaling activity in rainbow trout hepatocytes suggest a negative feedback loop for GR gene regulation during stress.8
Because this auto-regulation is a crucial step in the physiological stress response, the idea of the GR as an important biomarker in depression has gained popularity. In humans, when the GR binds to glucocorticoids that are released from the adrenal cortex during the stress response, the activated GR-cortisol complex represses expression of proinflammatory proteins in astrocytes and microglial cells and in all cells in the periphery before they are transcribed into proteins.9 The GR also has been shown to modulate neurogenesis.8 Repeated stress that persists over a long period leads to GR resistance, thereby reducing inhibition of production of proinflammatory cytokines.
Exposure to stress for >21 days leads to overactivity of the HPA axis and GR resistance,10 which decreases suppression of proinflammatory cytokines. There is evidence that proinflammatory cytokines, tumor necrosis factor-α, and interleukin-6 further induce GR receptor resistance by preventing the cortisol-GR receptor complex from entering cell nuclei and decreasing binding to DNA within the nuclei.11 Dexamethasone, a GR agonist, has been implicated in research studies for potential re-regulation of the HPA axis in depressed persons.12
Nerve cell death in the hippocampus
Studies showing reduced hippocampal volume in unipolar depression and a correlation between the number of episodes and a consequence of untreated depression and studies suggesting that treatment can stop or reduce shrinkage,13 and recent findings of rapid neurogenesis in hippocampi in response to ketamine, brings our focus to hippocampus in depression.
The greatest density of GRs is found in the hippocampus, which is closely associated with the limbic system.7 Therefore, the hippocampus is sensitive to increases in glucocorticoids in the brain and plays a crucial role in regulation of the HPA axis.
Evidence shows that in chronic stress exposure (≥21 days), nerve cells in the hippocampus begin to atrophy and can no longer provide negative feedback inhibition to the hypothalamus, causing HPA axis dysregulation and uncontrolled release of glucocorticoids into the bloodstream and CSF.2 In patients with Cushing syndrome, who produce abnormally high levels of glucocorticoid, the incidence of depression is as high as 50%.14 Similarly, patients treated with glucocorticoids such as prednisone often experience psychiatric symptoms, the most common being depression. Gould found that partial adrenalectomy increased hippocampal neurogenesis in rat brains, indicating the beneficial effect of stress hormone antagonism.4 CRH antagonists are being looked at as a promising and less invasive treatment option for depression.
Focus has been diverted to the role of the hippocampus in depression because of its ability to regenerate throughout adulthood, leading potentially to a re-regulation of the HPA axis and subsiding of the stress response, which is universally believed to be the primary precipitating factor in depression onset. Rats require 10 to 21 days of rest to recover from the effects of chronic (21 days) administration of glucocorticoids.15 If this proves to be a directly proportional relationship, then rats would need an estimated 120 days to recover from 6 months of constant glucocorticoid exposure. Considering that the same is true for humans, current depression treatment programs, which average 6 weeks, are not long enough for adequate recovery.
Antidepressants such as selective serotonin reuptake inhibitors, serotonin-norepinephrine reuptake inhibitors, and tricyclics stimulate neurogenesis in the hippocampus via increases in brain-derived neurotrophic factor (BDNF), suggesting that these neurotransmitters play an important role depression.16
Repetitive transcranial magnetic stimulation (rTMS), a noninvasive neuromodulation therapy approved to treat major depression, delivers brief magnetic pulses to the limbic structures. Treatment facilitates focal stimulation, rapidly applying electrical charges to the cortical neurons. TMS targets prefrontal circuits of the brain that are underactive during depressive episodes. Recent animal studies have suggested that bromodeoxyuridine (BrdU)-positive cells (newborn cells) are increased significantly in the dentate gyrus, in turn suggesting that hippocampal neurogenesis might be involved in the antidepressant effects of chronic rTMS.17 Although the underlying therapeutic mechanisms of rTMS treatment of depression remain unclear, it appears that hippocampal neurogenesis might be required to produce the effects of antidepressant treatments, including drugs and electroconvulsive therapy.17
Selective ‘shunting’ of energy occurs during the stress response
Hormones released from the adrenal glands during stress divert glucose to exercising muscles and the brain’s limbic system, which are involved in the fight-or-flight response.18 However, metabolic functions and areas of the brain that are not involved in the stress response, such as the cerebral cortex and hippocampus, are deprived of energy as a consequence of this innate selective shunting (Figure 2).19
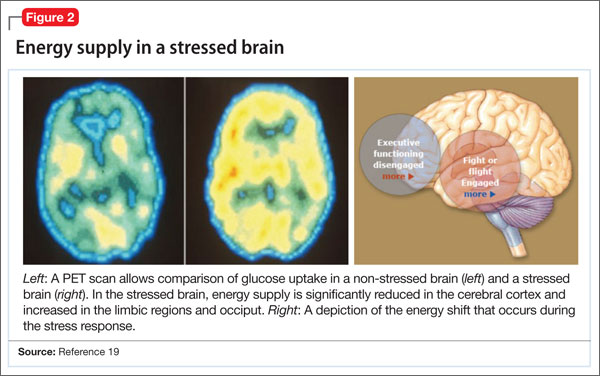
Positron-emission tomography (PET) scanning of the resting brain shows that components of the cerebral cortex (prefrontal cortex, hippocampus, striatum) and areas connecting the cerebral cortex to the limbic system exhibit the most energy consumption in the brain during rest (Figure 3).20 PET studies also show that neuronal connections within these energy-demanding areas atrophy more rapidly than in any other area of the brain when their energy supply is reduced or cut off.6
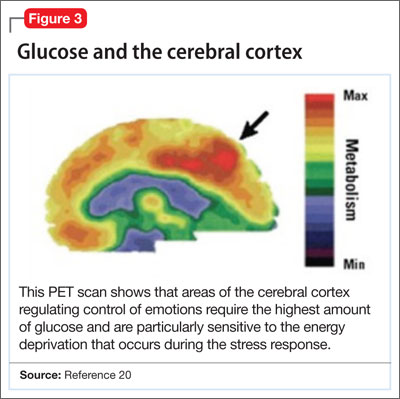
When the supply of oxygen and glucose to certain areas of the brain is reduced—such as in traumatic brain injury or stroke—the excitatory neurotransmitter glutamate accumulates in extracellular fluid and causes nerve-cell death.21 When a conditioned stimulus is presented during fear acquisition, functional magnetic resonance imaging (fMRI) studies of fear-conditioning have consistently reported, in the prefrontal cortex:
- a decrease in the blood oxygen level-dependent signal, below resting baseline
- a reduction in blood flow (Figure 4).22
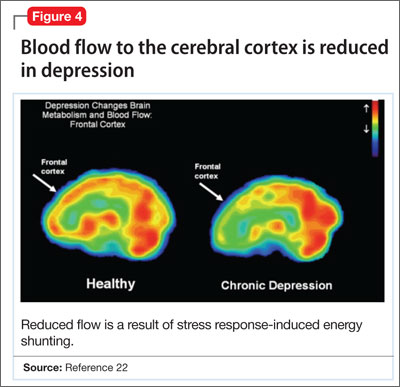
This discovery adds to evidence that demonstrates a decrease in gray-matter density in the frontal lobes as a result of glutaminergic toxicity (Figure 5).
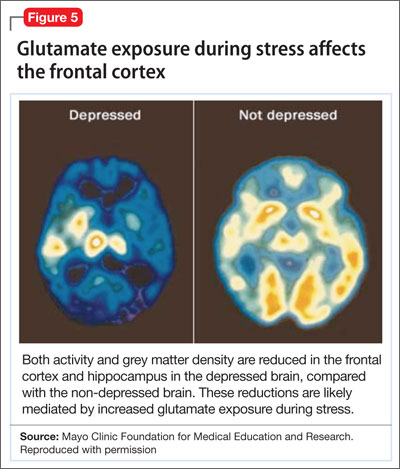
Activation of L-glutamate, believed to play a significant role in depression and other neuropsychiatric disorders, triggers calcium-dependent intracellular responses that “excite cells to death,” so to speak—thereby causing nerve-cell apoptosis and a reduction in synaptic connections between different areas of the brain responsible for learning and memory.23 Malfunction of these synaptic connections is thought to be partially responsible for depression and other psychiatric disorders.
Excessive activation of N-methyl-d-asparate (NMDA) receptors is thought to be the underlying mechanism that leads to neuronal cell death in glutaminergic toxicity. Therefore, NMDA receptor proteins have become a target in treating neurodegenerative psychiatric illnesses. There is more than one type of NMDA receptor; some of them are excitatory, others are inhibitory. Four compounds have presented as therapeutic candidates for inhibition of NMDA receptor functioning and treatment of depression: those that inhibit glutamate binding, those that block the ion channel, and those that inhibit receptor binding to the terminal regulatory domain.24
Regrettably, these chemical compounds are not receptor-selective, but small structural modifications of these NMDA receptors have been found and lead to significant changes in potency and selectivity. This should serve as a unique starting point for developing highly specific NMDA receptor modulator agents for a variety of neuropsychiatric and neurological conditions. GLYX-13, a derivative of ketamine (an NMDA receptor antagonist), has been implicated for use in treating depression. It has been tested on 2 large phase-II study groups.25
Neuronal circuitry of depression is altered by prolonged stress
Symptoms of depression can be explained by the anatomical circuit shown in Figure 6.15,20 Impaired concentration, diminished ability to process new information, and decline in memory function are associated with decreased nerve density in the hippocampus, which plays a key role in learning, memory, and encoding of emotionally relevant data into memory.26 The hippocampus interacts with the amygdala to provide input about the context in which stimuli occur.
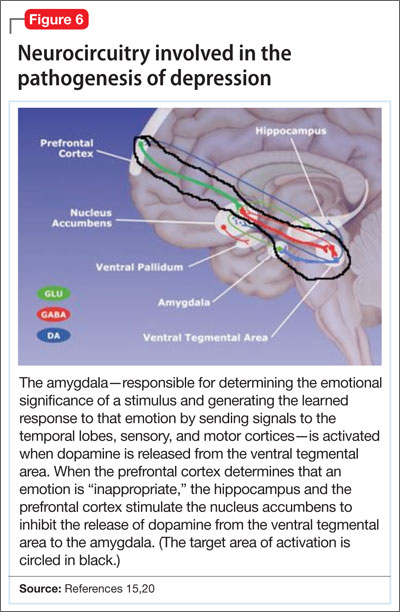
Depressed people often demonstrate impulsivity and have difficulty controlling expression of emotions—traits that are attributed to increased neuronal density in the amygdala and insula, which has been illustrated in PET scans and voxel-based morphometry in depressed patients.27 These brain areas are implicated in subjective emotional experience, processing of emotional reactions, and impulsive decision-making. The amygdala is normally highly regulated by the prefrontal cortex, which uses rational judgment to interpret stimuli and regulate the expression of emotion.
A study involving a facial expression processing task demonstrated reduced connectivity between the amygdala and prefrontal cortex and increased functional connectivity among the amygdala, hippocampus, and caudate-putamen in depressed patients.24 And in a study that measured white matter conduction in various brain areas in depressed patients, the greatest reduction was found in areas connecting the limbic system to the prefrontal cortex and hippocampus—believed to be caused by stress response-induced ischemic glutaminergic neuroapoptosis.21 Such neuroapoptosis might lead to irrational interpretation of stimuli, unchecked expression of emotion, and impulsive thoughts and behavior that are often present in depression and other mood disorders.
Deep brain stimulation (DBS), in which electrodes are implanted in the brain, has proved effective at increasing synaptic connections between the prefrontal cortex and the limbic system when electrodes are placed appropriately.28 Patients with refractory depression who are treated with DBS show increased gray-matter density and functional activity in the prefrontal cortex, hippocampus, and fronto-limbic connections.29 DBS also increases neurotransmission of dopamine, serotonin, and norepinephrine within the fronto-limbic circuitry.30
Identifying risk factors for depression
Genetic risk factors. Forty percent of patients with depression have a first-degree relative with depression, suggesting a strong genetic component.10 Inherited differences in hippocampal volume, synaptic connections between the prefrontal cortex and amygdala, γ-aminobutyric acid (GABA)/glutamate balance, BDNF neurotransmitter receptors, and anatomic positioning of the limbic system in relation to other brain structures might account for the heritability of psychiatric disorders such as depression.
Evidence has been consistent that hippocampal volume is diminished in the brain of depressed persons. However, there is no prospective cohort study to determine whether people who have lower gray-matter hippocampal density or volume, or both, before depression onset develop symptoms later in life. There also is no study to determine the percentage of people who have lower-than-average hippocampal gray-matter density or volume and who have a first-degree relative with depression. Such studies would yield valuable information about anatomic variables that increase the risk of depression.
It has been proposed that low GABA function is an inherited biomarker for depression. Bjork and co-workers found a lower plasma level of GABA in depressed subjects and in their first-degree relatives, confirming that GABAergic tone might be under genetic control.11 Genetic loci studies in mice have linked depressive-like behavior to GABAergic loci on chromosomes 8 and 11, encoding alpha 1, alpha 6, and gamma subunits of GABAA receptors.23
A recent study in humans showed that severe, treatment-resistant depression with anxiety was linked to a mutation in the B1 subunit of the GABAA receptor. Positive genetic associations were found between polymorphism in human GABAA receptor subunit genes.11
GABA metabolizing enzymes also can be considered biological modifiers of depression. For example:
- GABA uptake and metabolism is controlled by the enzyme glutamic acid decarboxylase (GAD); depression has been found to be associated with a polymorphism in the GAD67 gene encoding an isoform of GAD.11
- GABA transaminase (GABA-T) is another key enzyme in GABA turnover.31 It catabolizes GABA.
We can conclude that, to a high degree, depression depends on GABA production and metabolism.
A variant in the human BDNF gene, in which valine is substituted for methionine in position 66 of the pro-domain of the BDNF protein, is associated with
- a decrease in the production of BDNF
- increased susceptibility to neuropsychiatric disorders, including depression, anxiety disorder, and bipolar disorder (Figure 7).32
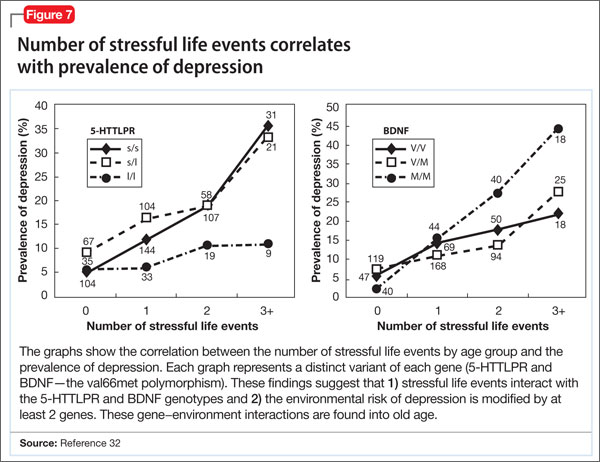
People with the MM allele have been found to have a small hippocampal neuronal density and poor hippocampus-dependent memory function in neuroimaging studies.23 They also displayed diminished ventromedial prefrontal cortex volume and presented with aversive memory extinction deficit (ie, “holding grudges”).
Another neurotrophic factor, vascular endothelial growth factor (VEGF), is a survival factor for endothelial cells and neurons and a modulator of synaptic transmission. Understanding the molecular and cellular specificity of antidepressant-induced VEGF will be critical to determine its potential as a therapeutic target in depression.33 Delineating the relationship between VEGF and depression has, ultimately, the potential to shed light on the still elusive neural mechanisms that underlie the pathophysiology of depression and the mechanisms by which antidepressants exert their effects.34
Genetic polymorphisms in monoamine receptors (5-HT2A), transporters (SERTPR, 5-HTTLPR, STin2, rs25531, SLC6A4), and regulatory enzymes should not be overlooked.35 There is reproducible evidence that variability in these polymorphisms are associated with variability in:
- vulnerability to depression
- the response to treatment with existing antidepressant medications.1
Most studies that look at changes in neuronal circuitry focus on the integrity of synaptic connections between the frontal cortex and limbic system; few of them have closely examined the importance of the anatomic proximity of the 2 regions. It might be that having an amygdala that is relatively closer to the frontal cortex and the hippocampus reduces a person’s risk of depression, and vice versa. This association needs to be investigated further with imaging studies.
Environmental risk factors. The brain is thought to be plastic until age 30.5 Plasticity diminishes with age after age 7—except for the hippocampus, which can regenerate throughout life.36 Early life experiences play an important role in forming synaptic connections between the frontal cortex and the limbic system, through a process known as fear conditioning.
Children learn early in life which stimuli are to be perceived as threatening or aversive and how to respond to best preserves their safety and internal sense of well-being. Those who grow up in a hostile environment learn to perceive more stimuli as threatening than children who grow up in a nurturing environment.32 It is possible that the amygdala is larger in children who grow up in less-than-ideal circumstances because this region is constantly being recruited—at the expense of the more rational frontal cortex.
Evidence suggests that these conditions reduce hippocampal neurogenesis37:
- increasing age
- substance abuse (opiates and methamphetamines)
- inadequate housing
- minimal physical activity
- little opportunity for social stimulation
- minimal learning experience.
Bottom Line
Depression has been understood as a neurotransmitter deficiency in the brain; treatments were engineered to increase release, or block degradation, of those neurotransmitters. Novel theories—all interconnected—of the neuroanatomical pathophysiology of depression focus more on differences in neuron density in the brain; effects of stress on neurogenesis and neuronal cell apoptosis; alterations in feedback pathways connecting the pre-frontal cortex to the limbic system; and the role of pro-inflammatory mediators evoked during the stress response.
Related Resources
- Fuchs E. Neurogenesis in the adult brain: is there an association with mental disorders? Eur Arch Psychiatry Clin Neurosci. 2007;257(5):247-249.
- Videbech P, Ravnkilde B. Hippocampal volume and depression: a meta-analysis of MRI studies. Am J Psychiatry. 2004; 161(11):1957-1966.
Disclosure
The authors report no financial relationships with any company whose products are mentioned in this article or with manufacturers of competing products.
Acknowledgement
Anita Rao, second-year medical student, Stritch School of Medicine, Loyola University, Chicago, Illinois, assisted in the preparation of this manuscript.
1. Eley TC, Sugden K, Corsico A, et al. Gene-environment interaction analysis of serotonin system markers with adolescent depression. Mol Psychiatry. 2004;9(10):908-915.
2. Haber SN, Rauch SL. Neurocircuitry: a window into the networks underlying neuropsychiatric disease. Neuropsychopharmacology. 2010;35(1):1-3.
3. Frodl T, Bokde AL, Scheuerecker J, et al. Functional connectivity bias of the orbitofrontal cortex in drug-free patients with major depression. Biol Psychiatry. 2010; 67(2):161-167.
4. Woolley CS, Gould E, McEwen BS. Exposure to excess glucocorticoids alters dendritic morphology of adult hippocampal pyramidal neurons. Brain Res. 1990;531(1-2): 225-231.
5. Heim C, Nemeroff CB. The impact of early adverse experiences on brain systems involved in the pathophysiology of anxiety and affective disorders. Biol Psychiatry. 1999;46(11):1509-1522.
6. Isgor C, Kabbaj M, Akil H, et al. Delayed effects of chronic variable stress during peripubertal-juvenile period on hippocampal morphology and on cognitive and stress axis functions in rats. Hippocampus. 2004;14(5):636-648.
7. De Kloet ER, Vreugdenhil E, Oitzl MS, et al. Brain corticosteroid receptor balance in health and disease. Endocr Rev. 1998;19(3):269-301.
8. Philip AM, Kim SD, Vijayan MM. Cortisol modulates the expression of cytokines and suppressors of cytokine signaling (SOCS) in rainbow trout hepatocytes. Dev Comp Immunol. 2012;38(2):360-367.
9. Coplan JD, Lydiard RB. Brain circuits in panic disorder. Biol Psychiatry. 1998;44(12):1264-1276.
10. Anisman H, Merali Z. Cytokines, stress and depressive illness: brain-immune interactions. Ann Med. 2003;35(1):2-11.
11. Crowley JJ, Lucki I. Opportunities to discover genes regulating depression and antidepressant response from rodent behavioral genetics. Curr Pharm Des. 2005;11(2):157-169.
12. Covington HE 3rd, Vialou V, Nestler EJ. From synapse to nucleus: novel targets for treating depression. Neuropharmacology. 2010;58(4-5):683-693.
13. Videbech P, Ravnkilde B. Hippocampal volume and depression: a meta-analysis of MRI studies. Am J Psychiatry. 2004;161(11):1957-1966.
14. Sandi C. Stress, cognitive impairment and cell adhesion molecules. Nat Rev Neurosci. 2004;5(12):917-930.
15. Hartley CA, Phelps EA. Changing fear: the neurocircuitry of emotion regulation. Neuropsychopharmacology. 2010;35(1): 136-146.
16. Kim DK, Lim SW, Lee S, et al. Serotonin transporter gene polymorphism and antidepressant response. Neuroreport. 2000;11(1):215-219.
17. Ueyama E, Ukai S, Ogawa A, et al, Chronic repetitive transcranial magnetic stimulation increases hippocampal neurogenesis in rats. Psychiatry Clin Neurosci. 2011; 65(1):77-81.
18. Irwin W, Anderle MJ, Abercrombie HC, et al. Amygdalar interhemispheric functional connectivity differs between the non-depressed and depressed human brain. Neuroimage. 2004;21(2):674-686.
19. McEwen BS. Physiology and neurobiology of stress and adaptation: central role of the brain. Physiol Rev. 2007; 87(3):873-904.
20. Gusnard DA, Raichle ME, Raichle ME. Searching for a baseline: functional imaging and the resting human brain. Nat Rev Neurosci. 2001;2(10):685-694.
21. Hulsebosch CE, Hains BC, Crown ED, et al. Mechanisms of chronic central neuropathic pain after spinal cord injury. Brain Res Rev. 2009;60(1):202-213.
22. Gottfried JA, Dolan RJ. Human orbitofrontal cortex mediates extinction learning while accessing conditioned representations of value. Nat Neurosci. 2004;7(10):1144-1152.
23 Arnone D, McKie S, Elliott R, et al. State-dependent changes in hippocampal grey matter in depression. Mol Psychiatry. 2012;1(8):1359-4184.
24. Brunoni AR, Lopes M, Fregni F. A systematic review and meta-analysis of clinical studies on major depression and BDNF levels: implications for the role of neuroplasticity in depression. Int J Neuropsychopharmacol. 2008;11(8):1169-1180.
25. Maeng S, Zarate CA Jr. The role of glutamate in mood disorders: results from the ketamine in major depression study and the presumed cellular mechanism underlying its antidepressant effects. Curr Psychiatry Rep. 2007;9(6):467-474.
26. Vaidya VA, Fernandes K, Jha S. Regulation of adult hippocampal neurogenesis: relevance to depression. Expert Rev Neurother. 2007;7(7):853-864.
27. Lisiecka DM, Carballedo A, Fagan AJ, et al. Altered inhibition of negative emotions in subjects at family risk of major depressive disorder. J Psychiatr Res. 2012;46(2):181-188.
28. Mayberg HS, Lozano AM, Voon V, et al. Deep brain stimulation for treatment-resistant depression. Neuron. 2005;45(5):651-660.
29. Levkovitz Y, Harel EV, Roth Y, et al. Deep transcranial magnetic stimulation over the prefrontal cortex: evaluation of antidepressant and cognitive effects in depressive patients. Brain Stimul. 2009;2(4):188-200.
30. Schlaepfer TE, Lieb K. Deep brain stimulation for treatment of refractory depression. Lancet. 2005;366(9495):1420-1422.
31. Astrup, J. Energy-requiring cell functions in the ischemic brain. Their critical supply and possible inhibition in protective therapy. J Neurosurg. 1982;56(4):482-497.
32. Fletcher JM. Childhood mistreatment and adolescent and young adult depression. Soc Sci Med. 2009;68(5):799-806.
33. Warner-Schmidt JL, Duman R. VEGF as a potential target for therapeutic intervention in depression. Curr Opin Pharmacol. 2008;8(1):14-19.
34. Clark-Raymond A, Halaris A. VEGF and depression: a comprehensive assessment of clinical data. J Psychiatr Res. 2013;47(8):1080-1087.
35. Alonso R, Griebel G, Pavone G, et al. Blockade of CRF(1) or V(1b) receptors reverses stress-induced suppression of neurogenesis in a mouse model of depression. Mol Psychiatry. 2004;9(3):278-286.
36. Thomas RM, Peterson DA. A neurogenic theory of depression gains momentum. Mol Interv. 2003;3(8):441-444.
37. Jacobs BL. Adult brain neurogenesis and depression. Brain Behav Immun. 2002;16(5):602-609.
For more than 50 years, depression has been studied, and understood, as a deficiency of specific neurotransmitters in the brain—namely dopamine, norepinephrine, and serotonin. Treatments for depression have been engineered to increase the release, or block the degradation, of these neurotransmitters within the synaptic cleft. Although a large body of evidence supports involvement of dopamine, norepinephrine, and serotonin in the pathophysiology of depression, the observation that pharmacotherapy is able to induce remission only in <50% of patients1 has prompted researchers to look beyond neurotransmitters for an understanding of depressive disorders (Table 1).
Today, theories of depression focus more on differences in neuron density in various regions of the brain; the effect of stress on neurogenesis and neuronal cell apoptosis; alterations in feedback pathways connecting the pre-frontal cortex to the limbic system; and the role of proinflammatory mediators evoked during the stress response (Box,2,3). These theories should not be viewed as separate entities because they are highly interconnected. Integrating them provides for a more expansive understanding of the pathophysiology of depression and biomarkers that are involved (Table 2).
In this article, we:
- integrate the large body of evidence supporting the contribution of the above variables to the onset and persistence of depression
- propose a possible risk stratification model
- explore possibilities for treatment.
The stress response: How does it affect the brain?
Stress initiates a cascade of events in the brain and peripheral systems that enable an organism to cope with, and adapt to, new and challenging situations. That is why physiologic and behavioral responses to stress generally are considered beneficial to survival.
When stress is maintained for a long period, both brain and body are harmed because target cells undergo prolonged exposure to physiologic stress mediators. For example, Woolley and Gould4 exposed rats to varying durations of glucocorticoids and observed that treating animals with corticosterone injection for 21 days induced neuronal atrophy in the hippocampus and prefrontal cortex and increased release of proinflammatory cytokines from astrocytes within the limbic system. Stressful experiences are believed to be closely associated with development of psychological alterations and, thus, neuropsychiatric disorders.5 To go further: Chronic stress is believed to be the leading cause of depression.
When the brain perceives an external threat, the stress response is called into action. The amygdala, part of the primitive limbic system, is the primary area of the brain responsible for triggering the stress response,6 signaling the hypothalamus to release corticotropin-releasing hormone (CRH) to the anterior pituitary gland, which, in turn releases adrenocorticotropic hormone to the adrenal glands (Figure 1).7 The adrenal glands are responsible for releasing glucocorticoids, which, because of their lipophilic nature, can cross the blood-brain barrier and are found in higher levels in the cerebrospinal fluid (CSF) of depressed persons.7
Once in the brain, glucocorticoids can be irreversibly degraded in the cytosol by the enzyme 11-β hydroxysteroid dehydrogenase type 2, a potential target for treating depression, or can bind to the glucocorticoid receptor (GR). Results of a research study of the role of cortisol in suppression of proinflammatory cytokine signaling activity in rainbow trout hepatocytes suggest a negative feedback loop for GR gene regulation during stress.8
Because this auto-regulation is a crucial step in the physiological stress response, the idea of the GR as an important biomarker in depression has gained popularity. In humans, when the GR binds to glucocorticoids that are released from the adrenal cortex during the stress response, the activated GR-cortisol complex represses expression of proinflammatory proteins in astrocytes and microglial cells and in all cells in the periphery before they are transcribed into proteins.9 The GR also has been shown to modulate neurogenesis.8 Repeated stress that persists over a long period leads to GR resistance, thereby reducing inhibition of production of proinflammatory cytokines.
Exposure to stress for >21 days leads to overactivity of the HPA axis and GR resistance,10 which decreases suppression of proinflammatory cytokines. There is evidence that proinflammatory cytokines, tumor necrosis factor-α, and interleukin-6 further induce GR receptor resistance by preventing the cortisol-GR receptor complex from entering cell nuclei and decreasing binding to DNA within the nuclei.11 Dexamethasone, a GR agonist, has been implicated in research studies for potential re-regulation of the HPA axis in depressed persons.12
Nerve cell death in the hippocampus
Studies showing reduced hippocampal volume in unipolar depression and a correlation between the number of episodes and a consequence of untreated depression and studies suggesting that treatment can stop or reduce shrinkage,13 and recent findings of rapid neurogenesis in hippocampi in response to ketamine, brings our focus to hippocampus in depression.
The greatest density of GRs is found in the hippocampus, which is closely associated with the limbic system.7 Therefore, the hippocampus is sensitive to increases in glucocorticoids in the brain and plays a crucial role in regulation of the HPA axis.
Evidence shows that in chronic stress exposure (≥21 days), nerve cells in the hippocampus begin to atrophy and can no longer provide negative feedback inhibition to the hypothalamus, causing HPA axis dysregulation and uncontrolled release of glucocorticoids into the bloodstream and CSF.2 In patients with Cushing syndrome, who produce abnormally high levels of glucocorticoid, the incidence of depression is as high as 50%.14 Similarly, patients treated with glucocorticoids such as prednisone often experience psychiatric symptoms, the most common being depression. Gould found that partial adrenalectomy increased hippocampal neurogenesis in rat brains, indicating the beneficial effect of stress hormone antagonism.4 CRH antagonists are being looked at as a promising and less invasive treatment option for depression.
Focus has been diverted to the role of the hippocampus in depression because of its ability to regenerate throughout adulthood, leading potentially to a re-regulation of the HPA axis and subsiding of the stress response, which is universally believed to be the primary precipitating factor in depression onset. Rats require 10 to 21 days of rest to recover from the effects of chronic (21 days) administration of glucocorticoids.15 If this proves to be a directly proportional relationship, then rats would need an estimated 120 days to recover from 6 months of constant glucocorticoid exposure. Considering that the same is true for humans, current depression treatment programs, which average 6 weeks, are not long enough for adequate recovery.
Antidepressants such as selective serotonin reuptake inhibitors, serotonin-norepinephrine reuptake inhibitors, and tricyclics stimulate neurogenesis in the hippocampus via increases in brain-derived neurotrophic factor (BDNF), suggesting that these neurotransmitters play an important role depression.16
Repetitive transcranial magnetic stimulation (rTMS), a noninvasive neuromodulation therapy approved to treat major depression, delivers brief magnetic pulses to the limbic structures. Treatment facilitates focal stimulation, rapidly applying electrical charges to the cortical neurons. TMS targets prefrontal circuits of the brain that are underactive during depressive episodes. Recent animal studies have suggested that bromodeoxyuridine (BrdU)-positive cells (newborn cells) are increased significantly in the dentate gyrus, in turn suggesting that hippocampal neurogenesis might be involved in the antidepressant effects of chronic rTMS.17 Although the underlying therapeutic mechanisms of rTMS treatment of depression remain unclear, it appears that hippocampal neurogenesis might be required to produce the effects of antidepressant treatments, including drugs and electroconvulsive therapy.17
Selective ‘shunting’ of energy occurs during the stress response
Hormones released from the adrenal glands during stress divert glucose to exercising muscles and the brain’s limbic system, which are involved in the fight-or-flight response.18 However, metabolic functions and areas of the brain that are not involved in the stress response, such as the cerebral cortex and hippocampus, are deprived of energy as a consequence of this innate selective shunting (Figure 2).19
Positron-emission tomography (PET) scanning of the resting brain shows that components of the cerebral cortex (prefrontal cortex, hippocampus, striatum) and areas connecting the cerebral cortex to the limbic system exhibit the most energy consumption in the brain during rest (Figure 3).20 PET studies also show that neuronal connections within these energy-demanding areas atrophy more rapidly than in any other area of the brain when their energy supply is reduced or cut off.6
When the supply of oxygen and glucose to certain areas of the brain is reduced—such as in traumatic brain injury or stroke—the excitatory neurotransmitter glutamate accumulates in extracellular fluid and causes nerve-cell death.21 When a conditioned stimulus is presented during fear acquisition, functional magnetic resonance imaging (fMRI) studies of fear-conditioning have consistently reported, in the prefrontal cortex:
- a decrease in the blood oxygen level-dependent signal, below resting baseline
- a reduction in blood flow (Figure 4).22
This discovery adds to evidence that demonstrates a decrease in gray-matter density in the frontal lobes as a result of glutaminergic toxicity (Figure 5).
Activation of L-glutamate, believed to play a significant role in depression and other neuropsychiatric disorders, triggers calcium-dependent intracellular responses that “excite cells to death,” so to speak—thereby causing nerve-cell apoptosis and a reduction in synaptic connections between different areas of the brain responsible for learning and memory.23 Malfunction of these synaptic connections is thought to be partially responsible for depression and other psychiatric disorders.
Excessive activation of N-methyl-d-asparate (NMDA) receptors is thought to be the underlying mechanism that leads to neuronal cell death in glutaminergic toxicity. Therefore, NMDA receptor proteins have become a target in treating neurodegenerative psychiatric illnesses. There is more than one type of NMDA receptor; some of them are excitatory, others are inhibitory. Four compounds have presented as therapeutic candidates for inhibition of NMDA receptor functioning and treatment of depression: those that inhibit glutamate binding, those that block the ion channel, and those that inhibit receptor binding to the terminal regulatory domain.24
Regrettably, these chemical compounds are not receptor-selective, but small structural modifications of these NMDA receptors have been found and lead to significant changes in potency and selectivity. This should serve as a unique starting point for developing highly specific NMDA receptor modulator agents for a variety of neuropsychiatric and neurological conditions. GLYX-13, a derivative of ketamine (an NMDA receptor antagonist), has been implicated for use in treating depression. It has been tested on 2 large phase-II study groups.25
Neuronal circuitry of depression is altered by prolonged stress
Symptoms of depression can be explained by the anatomical circuit shown in Figure 6.15,20 Impaired concentration, diminished ability to process new information, and decline in memory function are associated with decreased nerve density in the hippocampus, which plays a key role in learning, memory, and encoding of emotionally relevant data into memory.26 The hippocampus interacts with the amygdala to provide input about the context in which stimuli occur.
Depressed people often demonstrate impulsivity and have difficulty controlling expression of emotions—traits that are attributed to increased neuronal density in the amygdala and insula, which has been illustrated in PET scans and voxel-based morphometry in depressed patients.27 These brain areas are implicated in subjective emotional experience, processing of emotional reactions, and impulsive decision-making. The amygdala is normally highly regulated by the prefrontal cortex, which uses rational judgment to interpret stimuli and regulate the expression of emotion.
A study involving a facial expression processing task demonstrated reduced connectivity between the amygdala and prefrontal cortex and increased functional connectivity among the amygdala, hippocampus, and caudate-putamen in depressed patients.24 And in a study that measured white matter conduction in various brain areas in depressed patients, the greatest reduction was found in areas connecting the limbic system to the prefrontal cortex and hippocampus—believed to be caused by stress response-induced ischemic glutaminergic neuroapoptosis.21 Such neuroapoptosis might lead to irrational interpretation of stimuli, unchecked expression of emotion, and impulsive thoughts and behavior that are often present in depression and other mood disorders.
Deep brain stimulation (DBS), in which electrodes are implanted in the brain, has proved effective at increasing synaptic connections between the prefrontal cortex and the limbic system when electrodes are placed appropriately.28 Patients with refractory depression who are treated with DBS show increased gray-matter density and functional activity in the prefrontal cortex, hippocampus, and fronto-limbic connections.29 DBS also increases neurotransmission of dopamine, serotonin, and norepinephrine within the fronto-limbic circuitry.30
Identifying risk factors for depression
Genetic risk factors. Forty percent of patients with depression have a first-degree relative with depression, suggesting a strong genetic component.10 Inherited differences in hippocampal volume, synaptic connections between the prefrontal cortex and amygdala, γ-aminobutyric acid (GABA)/glutamate balance, BDNF neurotransmitter receptors, and anatomic positioning of the limbic system in relation to other brain structures might account for the heritability of psychiatric disorders such as depression.
Evidence has been consistent that hippocampal volume is diminished in the brain of depressed persons. However, there is no prospective cohort study to determine whether people who have lower gray-matter hippocampal density or volume, or both, before depression onset develop symptoms later in life. There also is no study to determine the percentage of people who have lower-than-average hippocampal gray-matter density or volume and who have a first-degree relative with depression. Such studies would yield valuable information about anatomic variables that increase the risk of depression.
It has been proposed that low GABA function is an inherited biomarker for depression. Bjork and co-workers found a lower plasma level of GABA in depressed subjects and in their first-degree relatives, confirming that GABAergic tone might be under genetic control.11 Genetic loci studies in mice have linked depressive-like behavior to GABAergic loci on chromosomes 8 and 11, encoding alpha 1, alpha 6, and gamma subunits of GABAA receptors.23
A recent study in humans showed that severe, treatment-resistant depression with anxiety was linked to a mutation in the B1 subunit of the GABAA receptor. Positive genetic associations were found between polymorphism in human GABAA receptor subunit genes.11
GABA metabolizing enzymes also can be considered biological modifiers of depression. For example:
- GABA uptake and metabolism is controlled by the enzyme glutamic acid decarboxylase (GAD); depression has been found to be associated with a polymorphism in the GAD67 gene encoding an isoform of GAD.11
- GABA transaminase (GABA-T) is another key enzyme in GABA turnover.31 It catabolizes GABA.
We can conclude that, to a high degree, depression depends on GABA production and metabolism.
A variant in the human BDNF gene, in which valine is substituted for methionine in position 66 of the pro-domain of the BDNF protein, is associated with
- a decrease in the production of BDNF
- increased susceptibility to neuropsychiatric disorders, including depression, anxiety disorder, and bipolar disorder (Figure 7).32
People with the MM allele have been found to have a small hippocampal neuronal density and poor hippocampus-dependent memory function in neuroimaging studies.23 They also displayed diminished ventromedial prefrontal cortex volume and presented with aversive memory extinction deficit (ie, “holding grudges”).
Another neurotrophic factor, vascular endothelial growth factor (VEGF), is a survival factor for endothelial cells and neurons and a modulator of synaptic transmission. Understanding the molecular and cellular specificity of antidepressant-induced VEGF will be critical to determine its potential as a therapeutic target in depression.33 Delineating the relationship between VEGF and depression has, ultimately, the potential to shed light on the still elusive neural mechanisms that underlie the pathophysiology of depression and the mechanisms by which antidepressants exert their effects.34
Genetic polymorphisms in monoamine receptors (5-HT2A), transporters (SERTPR, 5-HTTLPR, STin2, rs25531, SLC6A4), and regulatory enzymes should not be overlooked.35 There is reproducible evidence that variability in these polymorphisms are associated with variability in:
- vulnerability to depression
- the response to treatment with existing antidepressant medications.1
Most studies that look at changes in neuronal circuitry focus on the integrity of synaptic connections between the frontal cortex and limbic system; few of them have closely examined the importance of the anatomic proximity of the 2 regions. It might be that having an amygdala that is relatively closer to the frontal cortex and the hippocampus reduces a person’s risk of depression, and vice versa. This association needs to be investigated further with imaging studies.
Environmental risk factors. The brain is thought to be plastic until age 30.5 Plasticity diminishes with age after age 7—except for the hippocampus, which can regenerate throughout life.36 Early life experiences play an important role in forming synaptic connections between the frontal cortex and the limbic system, through a process known as fear conditioning.
Children learn early in life which stimuli are to be perceived as threatening or aversive and how to respond to best preserves their safety and internal sense of well-being. Those who grow up in a hostile environment learn to perceive more stimuli as threatening than children who grow up in a nurturing environment.32 It is possible that the amygdala is larger in children who grow up in less-than-ideal circumstances because this region is constantly being recruited—at the expense of the more rational frontal cortex.
Evidence suggests that these conditions reduce hippocampal neurogenesis37:
- increasing age
- substance abuse (opiates and methamphetamines)
- inadequate housing
- minimal physical activity
- little opportunity for social stimulation
- minimal learning experience.
Bottom Line
Depression has been understood as a neurotransmitter deficiency in the brain; treatments were engineered to increase release, or block degradation, of those neurotransmitters. Novel theories—all interconnected—of the neuroanatomical pathophysiology of depression focus more on differences in neuron density in the brain; effects of stress on neurogenesis and neuronal cell apoptosis; alterations in feedback pathways connecting the pre-frontal cortex to the limbic system; and the role of pro-inflammatory mediators evoked during the stress response.
Related Resources
- Fuchs E. Neurogenesis in the adult brain: is there an association with mental disorders? Eur Arch Psychiatry Clin Neurosci. 2007;257(5):247-249.
- Videbech P, Ravnkilde B. Hippocampal volume and depression: a meta-analysis of MRI studies. Am J Psychiatry. 2004; 161(11):1957-1966.
Disclosure
The authors report no financial relationships with any company whose products are mentioned in this article or with manufacturers of competing products.
Acknowledgement
Anita Rao, second-year medical student, Stritch School of Medicine, Loyola University, Chicago, Illinois, assisted in the preparation of this manuscript.
1. Eley TC, Sugden K, Corsico A, et al. Gene-environment interaction analysis of serotonin system markers with adolescent depression. Mol Psychiatry. 2004;9(10):908-915.
2. Haber SN, Rauch SL. Neurocircuitry: a window into the networks underlying neuropsychiatric disease. Neuropsychopharmacology. 2010;35(1):1-3.
3. Frodl T, Bokde AL, Scheuerecker J, et al. Functional connectivity bias of the orbitofrontal cortex in drug-free patients with major depression. Biol Psychiatry. 2010; 67(2):161-167.
4. Woolley CS, Gould E, McEwen BS. Exposure to excess glucocorticoids alters dendritic morphology of adult hippocampal pyramidal neurons. Brain Res. 1990;531(1-2): 225-231.
5. Heim C, Nemeroff CB. The impact of early adverse experiences on brain systems involved in the pathophysiology of anxiety and affective disorders. Biol Psychiatry. 1999;46(11):1509-1522.
6. Isgor C, Kabbaj M, Akil H, et al. Delayed effects of chronic variable stress during peripubertal-juvenile period on hippocampal morphology and on cognitive and stress axis functions in rats. Hippocampus. 2004;14(5):636-648.
7. De Kloet ER, Vreugdenhil E, Oitzl MS, et al. Brain corticosteroid receptor balance in health and disease. Endocr Rev. 1998;19(3):269-301.
8. Philip AM, Kim SD, Vijayan MM. Cortisol modulates the expression of cytokines and suppressors of cytokine signaling (SOCS) in rainbow trout hepatocytes. Dev Comp Immunol. 2012;38(2):360-367.
9. Coplan JD, Lydiard RB. Brain circuits in panic disorder. Biol Psychiatry. 1998;44(12):1264-1276.
10. Anisman H, Merali Z. Cytokines, stress and depressive illness: brain-immune interactions. Ann Med. 2003;35(1):2-11.
11. Crowley JJ, Lucki I. Opportunities to discover genes regulating depression and antidepressant response from rodent behavioral genetics. Curr Pharm Des. 2005;11(2):157-169.
12. Covington HE 3rd, Vialou V, Nestler EJ. From synapse to nucleus: novel targets for treating depression. Neuropharmacology. 2010;58(4-5):683-693.
13. Videbech P, Ravnkilde B. Hippocampal volume and depression: a meta-analysis of MRI studies. Am J Psychiatry. 2004;161(11):1957-1966.
14. Sandi C. Stress, cognitive impairment and cell adhesion molecules. Nat Rev Neurosci. 2004;5(12):917-930.
15. Hartley CA, Phelps EA. Changing fear: the neurocircuitry of emotion regulation. Neuropsychopharmacology. 2010;35(1): 136-146.
16. Kim DK, Lim SW, Lee S, et al. Serotonin transporter gene polymorphism and antidepressant response. Neuroreport. 2000;11(1):215-219.
17. Ueyama E, Ukai S, Ogawa A, et al, Chronic repetitive transcranial magnetic stimulation increases hippocampal neurogenesis in rats. Psychiatry Clin Neurosci. 2011; 65(1):77-81.
18. Irwin W, Anderle MJ, Abercrombie HC, et al. Amygdalar interhemispheric functional connectivity differs between the non-depressed and depressed human brain. Neuroimage. 2004;21(2):674-686.
19. McEwen BS. Physiology and neurobiology of stress and adaptation: central role of the brain. Physiol Rev. 2007; 87(3):873-904.
20. Gusnard DA, Raichle ME, Raichle ME. Searching for a baseline: functional imaging and the resting human brain. Nat Rev Neurosci. 2001;2(10):685-694.
21. Hulsebosch CE, Hains BC, Crown ED, et al. Mechanisms of chronic central neuropathic pain after spinal cord injury. Brain Res Rev. 2009;60(1):202-213.
22. Gottfried JA, Dolan RJ. Human orbitofrontal cortex mediates extinction learning while accessing conditioned representations of value. Nat Neurosci. 2004;7(10):1144-1152.
23 Arnone D, McKie S, Elliott R, et al. State-dependent changes in hippocampal grey matter in depression. Mol Psychiatry. 2012;1(8):1359-4184.
24. Brunoni AR, Lopes M, Fregni F. A systematic review and meta-analysis of clinical studies on major depression and BDNF levels: implications for the role of neuroplasticity in depression. Int J Neuropsychopharmacol. 2008;11(8):1169-1180.
25. Maeng S, Zarate CA Jr. The role of glutamate in mood disorders: results from the ketamine in major depression study and the presumed cellular mechanism underlying its antidepressant effects. Curr Psychiatry Rep. 2007;9(6):467-474.
26. Vaidya VA, Fernandes K, Jha S. Regulation of adult hippocampal neurogenesis: relevance to depression. Expert Rev Neurother. 2007;7(7):853-864.
27. Lisiecka DM, Carballedo A, Fagan AJ, et al. Altered inhibition of negative emotions in subjects at family risk of major depressive disorder. J Psychiatr Res. 2012;46(2):181-188.
28. Mayberg HS, Lozano AM, Voon V, et al. Deep brain stimulation for treatment-resistant depression. Neuron. 2005;45(5):651-660.
29. Levkovitz Y, Harel EV, Roth Y, et al. Deep transcranial magnetic stimulation over the prefrontal cortex: evaluation of antidepressant and cognitive effects in depressive patients. Brain Stimul. 2009;2(4):188-200.
30. Schlaepfer TE, Lieb K. Deep brain stimulation for treatment of refractory depression. Lancet. 2005;366(9495):1420-1422.
31. Astrup, J. Energy-requiring cell functions in the ischemic brain. Their critical supply and possible inhibition in protective therapy. J Neurosurg. 1982;56(4):482-497.
32. Fletcher JM. Childhood mistreatment and adolescent and young adult depression. Soc Sci Med. 2009;68(5):799-806.
33. Warner-Schmidt JL, Duman R. VEGF as a potential target for therapeutic intervention in depression. Curr Opin Pharmacol. 2008;8(1):14-19.
34. Clark-Raymond A, Halaris A. VEGF and depression: a comprehensive assessment of clinical data. J Psychiatr Res. 2013;47(8):1080-1087.
35. Alonso R, Griebel G, Pavone G, et al. Blockade of CRF(1) or V(1b) receptors reverses stress-induced suppression of neurogenesis in a mouse model of depression. Mol Psychiatry. 2004;9(3):278-286.
36. Thomas RM, Peterson DA. A neurogenic theory of depression gains momentum. Mol Interv. 2003;3(8):441-444.
37. Jacobs BL. Adult brain neurogenesis and depression. Brain Behav Immun. 2002;16(5):602-609.

Expressing yourself can be risky business!
In the adolescent years, it’s all about "YOLO" (You only live once!), which is the premise for many of the behaviors that primary care doctors see during this time. Many teens come into the office covered in piercings and tattoos. My favorite is the boyfriend’s name tattooed across an arm, a leg, or even the buttocks. You can’t help but think to yourself, "You are going to regret that one, for sure!"
Although tattooing and piercing are practiced in many cultures, extensive body art and multiple piercings are practices that are often done by adolescents who also engage in other risky behaviors. ("Tattooing in adults and adolescents," UpToDate, Aug. 29, 2013). One study showed that this population is much more likely to engage in sexual activity, binge drinking, marijuana smoking, and fighting significantly more than were non–tattooed adolescents.

As a primary care doctor, you’re less likely to be asked for advice about getting a tattoo or piercing than you are to be asked to fix the mishaps of these practices, but it is still important to be up to date on the potential risks. Adolescents are at an even a greater risk than are adults for complications because, in most states, children under age 18 years are required to have parental consent to get a tattoo or piercing. Therefore, this age group is more likely to seek out illegal or unlicensed businesses. Where there is a greater risk of substandard protocols and hygiene, the risk of infection increases. Many of the infections come from nonsterile cleaning fluid and water used in the tattooing or piercing procedure. Improper education of the client on aftercare is another contributing factor.
Local infections are the No. 1 complication of tattoos and piercings. Staphylococcus aureus and methicillin-resistant S. aureus (MRSA) are the most common causes of infection, but several other infectious agents have also been identified. It is not uncommon to have outbreaks of a particular infection occur because a certain provider is not using appropriate hygiene or is a carrier of one of the blood-borne illnesses.
Some caution tattoo seekers about blood-borne infections such as HIV, hepatitis C, and hepatitis B. But the number of such infections is currently relatively low. In fact, the research does not show a clear causal relationship between tattoos and piercings. Instead, it shows that, because adolescents who get tattoos are risk takers and are more likely to be intravenous drug users, they are also more likely to become infected with these diseases (Pediatrics 2002;109:1021-7).
A major complication that should not be overlooked is infective endocarditis. Although rare, if a teen presents 1-2 months after a body piercing or tattoo and has unexplained fevers, weakness, arthritis, and malaise, a work-up should be done with infective endocarditis in mind.
The role of the primary care doctor in this situation is to educate patients on appropriate practices so that they will be less inclined to have an inexperienced and unlicensed person perform body art procedures on them. Patients should expect the skin to be cleaned initially with alcohol and iodine, and sterile water and gloves to be used in the procedure. A clear understanding of the potential health risks and life-long complications should also help to deter them unsafe practices.
In the event of a local infection, it may actually be better to leave the piercing in because it allows for drainage. Antibiotic coverage that includes MRSA will also speed recovery.
Tattoos and piercing can be safe when done properly. Being proactive and sharing the appropriate information can help an adolescent make a better decision so that not only do they get to live it up, they can live a healthy long life as well
Dr. Pearce is a pediatrician in Frankfort, Ill. E-mail her at [email protected].
In the adolescent years, it’s all about "YOLO" (You only live once!), which is the premise for many of the behaviors that primary care doctors see during this time. Many teens come into the office covered in piercings and tattoos. My favorite is the boyfriend’s name tattooed across an arm, a leg, or even the buttocks. You can’t help but think to yourself, "You are going to regret that one, for sure!"
Although tattooing and piercing are practiced in many cultures, extensive body art and multiple piercings are practices that are often done by adolescents who also engage in other risky behaviors. ("Tattooing in adults and adolescents," UpToDate, Aug. 29, 2013). One study showed that this population is much more likely to engage in sexual activity, binge drinking, marijuana smoking, and fighting significantly more than were non–tattooed adolescents.
As a primary care doctor, you’re less likely to be asked for advice about getting a tattoo or piercing than you are to be asked to fix the mishaps of these practices, but it is still important to be up to date on the potential risks. Adolescents are at an even a greater risk than are adults for complications because, in most states, children under age 18 years are required to have parental consent to get a tattoo or piercing. Therefore, this age group is more likely to seek out illegal or unlicensed businesses. Where there is a greater risk of substandard protocols and hygiene, the risk of infection increases. Many of the infections come from nonsterile cleaning fluid and water used in the tattooing or piercing procedure. Improper education of the client on aftercare is another contributing factor.
Local infections are the No. 1 complication of tattoos and piercings. Staphylococcus aureus and methicillin-resistant S. aureus (MRSA) are the most common causes of infection, but several other infectious agents have also been identified. It is not uncommon to have outbreaks of a particular infection occur because a certain provider is not using appropriate hygiene or is a carrier of one of the blood-borne illnesses.
Some caution tattoo seekers about blood-borne infections such as HIV, hepatitis C, and hepatitis B. But the number of such infections is currently relatively low. In fact, the research does not show a clear causal relationship between tattoos and piercings. Instead, it shows that, because adolescents who get tattoos are risk takers and are more likely to be intravenous drug users, they are also more likely to become infected with these diseases (Pediatrics 2002;109:1021-7).
A major complication that should not be overlooked is infective endocarditis. Although rare, if a teen presents 1-2 months after a body piercing or tattoo and has unexplained fevers, weakness, arthritis, and malaise, a work-up should be done with infective endocarditis in mind.
The role of the primary care doctor in this situation is to educate patients on appropriate practices so that they will be less inclined to have an inexperienced and unlicensed person perform body art procedures on them. Patients should expect the skin to be cleaned initially with alcohol and iodine, and sterile water and gloves to be used in the procedure. A clear understanding of the potential health risks and life-long complications should also help to deter them unsafe practices.
In the event of a local infection, it may actually be better to leave the piercing in because it allows for drainage. Antibiotic coverage that includes MRSA will also speed recovery.
Tattoos and piercing can be safe when done properly. Being proactive and sharing the appropriate information can help an adolescent make a better decision so that not only do they get to live it up, they can live a healthy long life as well
Dr. Pearce is a pediatrician in Frankfort, Ill. E-mail her at [email protected].

Synthetic lethality: beating cancer at its own game
The primary focus for targeted cancer agents has typically been to counteract the oncogenic signaling that results from genetic defects. A new strategy is emerging that actually seeks to exploit the oncogenic features of tumor cells rather than overcome them. Synthetic lethality (SL) is a situation in which 2 nonlethal mutations become lethal to a cell when they are present simultaneously. If SL were to be exploited for anticancer therapy, it could lead to the development of highly selective, less toxic drugs, while expanding therapeutic targets to include those that have, until now, proven pharmaceutically intractable. Here, we discuss the idea of SL and how it can be applied to cancer therapy.
Click on the PDF icon at the top of this introduction to read the full article.
Biomarker testing for treatment of metastatic colorectal cancer: role of the pathologist in community practice
The past decade has been marked by significant advancements in the treatment of patients with metastatic colorectal cancer (mCRC), including the approval of novel biologic agents such as the angiogenesis inhibitors bevacizumab and afibercept and the epidermal growth factor receptor monoclonal antibodies (mAbs) cetuximab and panitumumab. Cetuximab was recently approved by the US Food and Drug Administration in combination with FOLFIRI (irinotecan, 5-fuorouracil, leucovorin) for the first-line treatment of patients with KRAS mutation-negative (wild-type) tumors as determined by an FDA-approved companion diagnostic. It was the first FDA approval in mCRC requiring use of a diagnostic test that is predictive of response prior to initiation of frontline therapy.
Click on the PDF icon at the top of this introduction to read the full article.
Current options and future directions in the systemic treatment of metastatic melanoma
Systemic treatment options for metastatic melanoma have historically been limited, with conventional cytotoxic chemotherapies demonstrating only modest benefit. Recent advances, however, have dramatically changed the treatment landscape and can be considered in 2 general categories: immunotherapeutic approaches that enhance antitumor immunity, and targeted therapeutic approaches that block oncogenic driver mutations. Immunotherapy with antibodies that block cytotoxic T-lymphocyte antigen 4 and programmed death-1 receptor can result in durable responses in a subset of patients. These treatments may be considered for patients irrespective of their mutational status, and ongoing research continues to investigate biomarkers associated with clinical outcomes. Side effects of these agents result from immune-mediated reactions involving various organ sites and can include: diarrhea, rash, hepatitis, and endocrinopathies.
Click on the PDF icon at the top of this introduction to read the full article.
Current gout guidelines stress ‘treat to target’
SNOWMASS, COLO. – The current American College of Rheumatology gout guidelines contain a number of recommendations that may come as a surprise to rheumatologists and primary care physicians alike.
The guidelines state, for example, that urate-lowering therapy should be undertaken routinely in any patient with an established diagnosis of gout who has comorbid chronic kidney disease (CKD) that is stage 2 or worse, meaning an estimated glomerular filtration rate of 89 mL/minute per 1.73 m2 or less.

The rationale is that it’s particularly important to try to prevent acute gout attacks in such patients because their renal dysfunction makes it problematic to use colchicine and NSAIDs to quell attacks. Intriguing studies suggest that lowering serum urate may actually slow progression of CKD, Dr. Michael H. Pillinger said at the Winter Rheumatology symposium sponsored by the American College of Rheumatology.
The guidelines name the other indications for urate lowering in gout patients as the presence of a tophus on clinical examination or an imaging study, a history of two or more gout attacks per year, or a history of kidney stones.
Traditionally, urate-lowering therapy has been initiated during quiescent periods, but the ACR guidelines state that it also can be started during an acute attack if effective anti-inflammatory management has been instituted.
"This goes against what I was taught," observed Dr. Pillinger, a rheumatologist and director of the crystal diseases study group at New York University.
The guidelines (Arthritis Care Res. 2012;64:1431-46 and 1447-61) emphasize the importance of a treat-to-target approach.
"The primary care physicians I talk to still don’t know this. The ACR recommends a minimum serum urate target of less than 6.0 mg/dL, but the guidelines are very clear that if 6 isn’t good enough, you keep going. You go below 5. When I see patients with tophaceous gout, my target is never 6. My target is 5 or 4. That’s what I teach my fellows," explained Dr. Pillinger, who served on an expert panel that advised the guideline-writing task force.
The ACR urate-lowering algorithm begins with either allopurinol or febuxostat (Uloric) as first-line therapy. The guideline committee, which expressly excluded cost as a consideration, offered no guidance as to which xanthine oxidase inhibitor is preferred. Dr. Pillinger noted that febuxostat is a more specific xanthine oxidase inhibitor, is simpler to dose, and is far less likely to cause hypersensitivity reactions than is allopurinol. It is also more effective, although not dramatically more so. And it is considerably more expensive.
Febuxostat is approved by the Food and Drug Administration specifically for use in patients with mild to moderate CKD. Allopurinol is not. However, the gout guidelines endorse the use of allopurinol in that setting.
When allopurinol is the initial drug, the guidelines recommend dosing it in a manner that is different from how most physicians have been using it, the rheumatologist said. The recommended starting dose is lower than has been customary: 100 mg/day, and 50 mg/day in patients with stage 4 or 5 CKD. The drug is to be titrated upward every 2-5 weeks as needed to achieve the target urate level. The maximum dose is 800 mg/day, even in patients with comorbid CKD. Although the guidelines don’t provide guidance as to the size of the stepwise dosing increases, Dr. Pillinger usually boosts the allopurinol dose by 100 mg at a time, or 50 mg in patients with CKD.
"Most patients don’t get to target at 300 mg/day. You’ve got to go higher," he said.
An important innovation in the current guidelines is the recommendation for testing for the HLA-B*5801 allele in patients of Korean, Thai, or Han Chinese ancestry who are being considered for allopurinol therapy. The presence of this allele confers a several hundred–fold increased risk of allopurinol hypersensitivity.
Probenecid is endorsed as the alternative first-line urate-lowering agent, but only if at least one xanthine oxidase inhibitor is contraindicated or not tolerated. No other agents get the nod as first-line therapy.
The guidelines state that if a patient’s serum urate is not at target despite maximum-dose therapy with a first-line xanthine oxidase inhibitor, it is not appropriate to switch to the other xanthine oxidase inhibitor. Instead, it is time to add a uricosuric agent: probenecid, losartan, or fenofibrate. If the urate level still is not at target and the patient is generally well, with few gout attacks, then that’s an acceptable result. However, if the patient has moderate tophaceous gout or chronic gouty arthropathy, it’s appropriate to place the patient on pegloticase (Krystexxa) while discontinuing all other urate-lowering agents.
The ACR guidelines stress that it is vital to always try to prevent gout attacks during initiation of urate-lowering therapy. The recommended first-line agents for prophylaxis are low-dose colchicine or a low-dose NSAID, with prednisone at a dose not to exceed 10 mg/day reserved as second-line therapy in the event the first-line agents are not tolerated or are ineffective.
Prophylaxis is supposed to continue as long as a patient has any evidence of disease activity. And once all symptoms and tophi have resolved, all measures needed to keep the serum urate below 6.0 mg/dL are to be continued indefinitely.
"For most patients," Dr. Pillinger concluded, "gout treatment is almost always forever."
He reported having received research grants from Takeda, which markets febuxostat in the United States, and Savient, which markets pegloticase.
SNOWMASS, COLO. – The current American College of Rheumatology gout guidelines contain a number of recommendations that may come as a surprise to rheumatologists and primary care physicians alike.
The guidelines state, for example, that urate-lowering therapy should be undertaken routinely in any patient with an established diagnosis of gout who has comorbid chronic kidney disease (CKD) that is stage 2 or worse, meaning an estimated glomerular filtration rate of 89 mL/minute per 1.73 m2 or less.
The rationale is that it’s particularly important to try to prevent acute gout attacks in such patients because their renal dysfunction makes it problematic to use colchicine and NSAIDs to quell attacks. Intriguing studies suggest that lowering serum urate may actually slow progression of CKD, Dr. Michael H. Pillinger said at the Winter Rheumatology symposium sponsored by the American College of Rheumatology.
The guidelines name the other indications for urate lowering in gout patients as the presence of a tophus on clinical examination or an imaging study, a history of two or more gout attacks per year, or a history of kidney stones.
Traditionally, urate-lowering therapy has been initiated during quiescent periods, but the ACR guidelines state that it also can be started during an acute attack if effective anti-inflammatory management has been instituted.
"This goes against what I was taught," observed Dr. Pillinger, a rheumatologist and director of the crystal diseases study group at New York University.
The guidelines (Arthritis Care Res. 2012;64:1431-46 and 1447-61) emphasize the importance of a treat-to-target approach.
"The primary care physicians I talk to still don’t know this. The ACR recommends a minimum serum urate target of less than 6.0 mg/dL, but the guidelines are very clear that if 6 isn’t good enough, you keep going. You go below 5. When I see patients with tophaceous gout, my target is never 6. My target is 5 or 4. That’s what I teach my fellows," explained Dr. Pillinger, who served on an expert panel that advised the guideline-writing task force.
The ACR urate-lowering algorithm begins with either allopurinol or febuxostat (Uloric) as first-line therapy. The guideline committee, which expressly excluded cost as a consideration, offered no guidance as to which xanthine oxidase inhibitor is preferred. Dr. Pillinger noted that febuxostat is a more specific xanthine oxidase inhibitor, is simpler to dose, and is far less likely to cause hypersensitivity reactions than is allopurinol. It is also more effective, although not dramatically more so. And it is considerably more expensive.
Febuxostat is approved by the Food and Drug Administration specifically for use in patients with mild to moderate CKD. Allopurinol is not. However, the gout guidelines endorse the use of allopurinol in that setting.
When allopurinol is the initial drug, the guidelines recommend dosing it in a manner that is different from how most physicians have been using it, the rheumatologist said. The recommended starting dose is lower than has been customary: 100 mg/day, and 50 mg/day in patients with stage 4 or 5 CKD. The drug is to be titrated upward every 2-5 weeks as needed to achieve the target urate level. The maximum dose is 800 mg/day, even in patients with comorbid CKD. Although the guidelines don’t provide guidance as to the size of the stepwise dosing increases, Dr. Pillinger usually boosts the allopurinol dose by 100 mg at a time, or 50 mg in patients with CKD.
"Most patients don’t get to target at 300 mg/day. You’ve got to go higher," he said.
An important innovation in the current guidelines is the recommendation for testing for the HLA-B*5801 allele in patients of Korean, Thai, or Han Chinese ancestry who are being considered for allopurinol therapy. The presence of this allele confers a several hundred–fold increased risk of allopurinol hypersensitivity.
Probenecid is endorsed as the alternative first-line urate-lowering agent, but only if at least one xanthine oxidase inhibitor is contraindicated or not tolerated. No other agents get the nod as first-line therapy.
The guidelines state that if a patient’s serum urate is not at target despite maximum-dose therapy with a first-line xanthine oxidase inhibitor, it is not appropriate to switch to the other xanthine oxidase inhibitor. Instead, it is time to add a uricosuric agent: probenecid, losartan, or fenofibrate. If the urate level still is not at target and the patient is generally well, with few gout attacks, then that’s an acceptable result. However, if the patient has moderate tophaceous gout or chronic gouty arthropathy, it’s appropriate to place the patient on pegloticase (Krystexxa) while discontinuing all other urate-lowering agents.
The ACR guidelines stress that it is vital to always try to prevent gout attacks during initiation of urate-lowering therapy. The recommended first-line agents for prophylaxis are low-dose colchicine or a low-dose NSAID, with prednisone at a dose not to exceed 10 mg/day reserved as second-line therapy in the event the first-line agents are not tolerated or are ineffective.
Prophylaxis is supposed to continue as long as a patient has any evidence of disease activity. And once all symptoms and tophi have resolved, all measures needed to keep the serum urate below 6.0 mg/dL are to be continued indefinitely.
"For most patients," Dr. Pillinger concluded, "gout treatment is almost always forever."
He reported having received research grants from Takeda, which markets febuxostat in the United States, and Savient, which markets pegloticase.
EXPERT ANALYSIS FROM THE ACR WINTER RHEUMATOLOGY SYMPOSIUM

Consortium study falls short of expectations
SAN FRANCISCO—A group’s effort to identify optimal front-line treatment for peripheral T-cell lymphomas (PTCLs) was not as successful as researchers anticipated.
The North American PTCL Consortium set out to find a treatment that could best CHOP (cyclophosphamide, hydroxydaunorubicin, vincristine, and prednisone), as studies have suggested this regimen is inadequate for patients with PTCL.
So the group organized a trial testing
a potentially more promising regimen: cyclophosphamide, etoposide, vincristine, and prednisone, alternating with pralatrexate (CEOP-P).
However, CEOP-P elicited a complete response (CR) rate comparable to rates historically seen with CHOP, and progression-free survival rates with the new regimen were “not particularly encouraging.”
Ranjana Advani, MD, of Stanford University Medical Center in California, discussed this trial’s inception, execution, and results at the 6th Annual T-cell Lymphoma Forum.
Trial inception
It all began with the first meeting of the North American PTCL Consortium, which took place at the 2006 ASH Annual Meeting. Physicians from 17 centers gathered to discuss the state of PTCL research in North America.
The group realized there were too many open studies for such a rare disease, and efforts should be more focused. However, they could not agree publicly as to which studies should get priority, so they used an anonymous survey to obtain a consensus.
Survey responses were “all over the map,” Dr Advani said. But ultimately, the consensus was that ongoing trials were not sufficient, and a new trial was necessary.
The group decided to first lend their support to ongoing trials and then launch a new study. At the fourth and fifth meetings of the North American PTCL Consortium (both in 2009), they drafted the concept of a front-line trial testing CEOP-P.
“We decided to use [CEOP] as a backbone because there were reservations about anthracyclines having a role in PTCL, and there was data . . . in patients [with B-cell lymphomas] who were not anthracycline-eligible and did reasonably well when etoposide was substituted [for hydroxydaunorubicin],” Dr Advani said.
As for for the second “P” in CEOP-P, pralatrexate was the first drug approved for patients with relapsed PTCL, which provided the rationale for evaluating it in the front-line setting.
Execution and results
The primary aim of this study was to improve the CR rate from 40% to 60% with CEOP-P followed by optional transplant. A literature review had revealed that CRs with CHOP have been in the range of 40% to 50%.
The researchers enrolled a total of 34 patients, but 1 withdrew consent. Twenty-seven patients received at least 2 cycles of CEOP-P. Of the 6 patients who received a single cycle, 4 discontinued treatment due to early disease progression, and 2 discontinued because of adverse events.
Grade 3-4 adverse events associated with CEOP-P included anemia, thrombocytopenia, febrile neutropenia, mucositis, sepsis, increased creatinine, and liver transaminases.
The researchers had used a 2-stage Simon design (alpha=0.10, 90% power) to test the null hypothesis that the CR rate would be 40% or greater.
For the first stage of 20 evaluable patients, the trial would be terminated if 8 or fewer patients experienced a CR after course 2B of chemotherapy. For the second stage, 34 patients were required, and at least 17 had to achieve a CR at the end of therapy for the regimen to be considered useful.
At the end of stage 1, 50% of the patients (10/20) had achieved a CR. Ultimately, 52% of all patients (n=17) achieved a CR.
This suggests CEOP-P is a useful regimen, according to the study design. But the primary aim of improving CR from 40% to 60% was not met.
Furthermore, the estimated 1-year and 2-year progression-free survival rates were “not particularly encouraging,” according to Dr Advani. The rates were 50% and 34%, respectively. And the estimated 1-year and 2-year overall survival rate was 64%.
“So this was a lesson in working together and getting a trial from ground zero, to up and running, to a presentation, and publication underway,” Dr Advani said.
“And even though it took in all the ingredients of what everybody thought was important . . . , it’s not a regimen which has that much promise to move to a randomized setting. And so defining the optimal front-line therapy in PTCL continues to be a challenge and an unmet need.”
Now, the North American PTCL Consortium is working on a second front-line trial testing cyclophosphamide, hydroxydaunorubicin, vincristine, etoposide, and prednisone (CHOEP) plus lenalidomide in stage II, III, and IV PTCL. The final protocol has been circulated, and the group anticipates the first patient will be enrolled by June or July of this year.
Dr Advani and her colleagues also presented results of the CEOP-P trial at the 2013 ASH Annual Meeting as abstract 3044. (Information in the abstract differs from that presented at the T-cell Lymphoma Forum.) ![]()
Researcher status affects paper popularity, study suggests

Credit: Rhoda Baer
New research indicates that author status affects how frequently scientific papers are cited, but the size of that effect depends on a number of other factors.
Investigators found that, overall, citations increased 12% above the expected level when authors were awarded “prestigious investigator status” at the Howard Hughes Medical Institute (HHMI).
However, certain kinds of research papers benefitted more than others by this increased prestige.
“We find much more of an effect on recent papers published in a short window before the prize,” said study author Pierre Azoulay, PhD, of the MIT Sloan School of Management in Cambridge.
And the greatest gains came for papers in new areas of research and for papers published in lower-profile journals. Younger researchers who had lower profiles prior to receiving the HHMI award were more likely to see a change as well.
“The effect was much more pronounced when there was more reason to be uncertain about the quality of the science or the scientist before the prize,” Dr Azoulay noted.
This paper, titled “Matthew: Effect or Fable?,” was published in Management Science.
The “Matthew Effect” is a term coined by sociologist Robert K. Merton to describe the possibility that the work of those with high status receives greater attention than equivalent work by those who are not as well known.
Positively identifying this phenomenon in scientific paper citations is difficult, however, because it is hard to separate the status of the author from the quality of the paper. It is possible, after all, that better-known researchers are simply producing higher-quality papers, which get more attention as a result.
But Dr Azoulay and his colleagues said they’ve found a way to address this issue. They looked at papers first published before the authors became HHMI investigators, then examined the citation rates for those papers after the HHMI appointments occurred, compared to a baseline of similar papers whose authors did not receive HHMI appointments.
More specifically, each paper in the study was paired with what Dr Azoulay called a “fraternal twin,” that is, another paper published in the same journal, at the same time, with the same initial citation pattern. For good measure, the authors of the papers in this comparison group were all scientists who had received other early career awards.
In all, from 1984 through 2003, 443 scientists were named HHMI investigators. Dr Azoulay and his colleagues examined 3636 papers written by 424 of those scientists, comparing them to 3636 papers in the control group.
“You couldn’t tell [the 2 sets of papers] apart in terms of citation trajectories, up until the time of the prize,” Dr Azoulay said.
Beyond the overall 12% increase in citations, the effect was nearly twice as great for papers published in lower-profile journals.
Alternately, Dr Azoulay pointed out, “If your paper was published in Cell or Nature or Science, the HHMI [award] doesn’t add a lot.” ![]()