User login
No Time for Chest Pain When There Are Chores to Do
ANSWER
There are three significant findings on this ECG. First, the rhythm shows complete heart block. The ventricular rate is 56 beats/min, and the QRS complex is narrow, resulting in a junctional rhythm. The atrial rate is 98 beats/min (consistent with a sinus rhythm), and there is no relationship of the P waves to the QRS complexes.
The second finding is a rightward axis deviation. Note that the QRS complexes are negative in lead I and positive in lead aVF. To meet criteria for a right-axis deviation, the QRS complex must also be positive in lead aVR. In this case, the QRS complex appears to be isoelectric in aVR, so we call the axis rightward.
The presence of rightward axis deviation is a result of the third finding, an anterior MI. This is due to the LAD artery occlusion discovered at catheterization. It is evident on the ECG by the absence of significant R waves in leads V1 through V4.
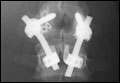
Given the need for a β-blocker with titration of dose, the patient underwent implantation of a permanent pacemaker system.
ANSWER
There are three significant findings on this ECG. First, the rhythm shows complete heart block. The ventricular rate is 56 beats/min, and the QRS complex is narrow, resulting in a junctional rhythm. The atrial rate is 98 beats/min (consistent with a sinus rhythm), and there is no relationship of the P waves to the QRS complexes.
The second finding is a rightward axis deviation. Note that the QRS complexes are negative in lead I and positive in lead aVF. To meet criteria for a right-axis deviation, the QRS complex must also be positive in lead aVR. In this case, the QRS complex appears to be isoelectric in aVR, so we call the axis rightward.
The presence of rightward axis deviation is a result of the third finding, an anterior MI. This is due to the LAD artery occlusion discovered at catheterization. It is evident on the ECG by the absence of significant R waves in leads V1 through V4.
Given the need for a β-blocker with titration of dose, the patient underwent implantation of a permanent pacemaker system.
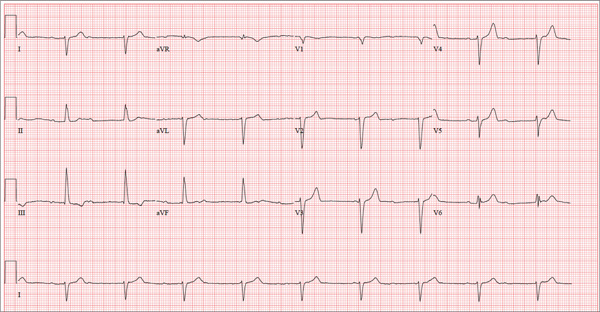
Three days ago, a 62-year-old man was admitted with chest pain and an MI (confirmed by cardiac enzymes). The chest pain started while he was working on his farm, but he did not seek immediate help because he assumed it was heartburn and he had chores to finish. When the pain did not resolve overnight, he finally presented to the emergency department. Cardiac catheterization revealed an occluded left anterior descending (LAD) artery distal to the first diagonal branch and diffuse disease in the circumflex and right coronary arteries. An echocardiogram showed diffuse left ventricular hypokinesis and no evidence of valvular disease. His left ventricular ejection fraction was estimated to be 48%. Medical history is remarkable for hypertension and gout. Surgical history is remarkable for an appendectomy at age 7 and surgical repair of a fractured tibia from a high school football injury. Family history is positive for coronary artery disease; both parents died at young ages (father at 60, mother at 65) of MI, and his older brother had an MI at age 50 (but is currently doing well). The patient owns a 475-acre farm on which he grows corn and soybeans. He also tends to 23 cows and has a large chicken coop. There are five workers to help, but he states that he does most of the work himself. He is divorced and lives alone with five dogs, whom he refers to as his “kids.” He does not smoke, but he has one beer and one shot of bourbon with dinner each night. His only medication at the time of admission was ibuprofen. He had been prescribed lisinopril in the past but hadn’t taken it in six months because “it’s too far a drive to get it refilled.” He has no known drug allergies. Following admission, he was started on a β-blocker (metoprolol), aspirin, atorvastatin, and lisinopril. During rounds, you notice that his hypertension is well controlled. His blood pressure is 118/80 mm Hg, compared to 180/92 mm Hg on admission. He is comfortable and wants to know when he can go home. As you contemplate discharge, a technician hands you the patient’s daily ECG tracing. It shows a ventricular rate of 56 beats/min; QRS duration, 106 ms; QT/QTc interval, 400/386 ms; P axis, 36°; R axis, 120°; and T axis, 7°. What is your interpretation of this ECG?

Man Is Alarmed by Skin Lesions
ANSWER
The correct answer is eruptive xanthomata (choice “b”) caused by an accumulation of lipid-filled macrophages as a result of pathologic levels of serum triglyceride—a situation discussed more fully below.
Neurofibromatosis type I (choice “a”), also known as von Recklinghausen disease, can present with multiple intradermal nodules. However, it usually appears in the second or third decade of life, with lesions that are fixed and soft. Biopsy would have confirmed this diagnosis.
Diabetic dermopathy (choice “c”) manifests with atrophic patches on anterior tibial skin. The patches occasionally become superficially eroded but do not resemble this patient’s lesions at all.
Juvenile xanthogranuloma (choice “d”) usually presents on children as a solitary yellowish brown papule. It can resemble eruptive xanthomata histologically but not clinically.
DISCUSSION
Eruptive xanthomata (EX) are relatively common, manifesting rapidly as papules and nodules, most frequently in the setting of hypertriglyceridemia. The latter can be familial and may be worsened by poorly controlled diabetes. Persons with Fredrickson types I, IV, and V hyperlipidemia are especially prone to EX.
As might be expected, patients with EX are at risk for several associated morbidities, including acute pancreatitis (especially in childhood cases) and atherosclerotic vessel disease. EX have also been associated with hypothyroid states and nephrotic syndromes.
Elevations in cholesterol, with normal triglyceride levels, can be associated with several types of xanthoma, including plane xanthomas and xanthelasma. The latter, often benign, can manifest in a normolipemic patient as well (necessitating a problem-directed history, physical, and lipid check).
Biopsy is often required to confirm the diagnosis of EX. As in this case, it typically shows monotonous collections of lipid-laden macrophages. Frozen sections of EX can be successfully stained for lipids, but routine processing of specimens effectively removes any lipids, replacing them with paraffin.
TREATMENT
Treatment entails controlling lipids with medication (fenofibrate), diet, and exercise and getting diabetes under control, as indicated. It is also essential to assess for atherosclerotic vessel disease and rule out pancreatitis.
Within a month of institution of treatment, this patient’s lesions had all but disappeared. His serum amylase and lipase were within normal limits, and testing for atherosclerotic vessel disease was pending.
Click here for more DermaDiagnosis cases, including
• The Value of Certainty in Diagnosis
• A Purplish Rash on the Instep
• Hair Loss at a Very Young Age.
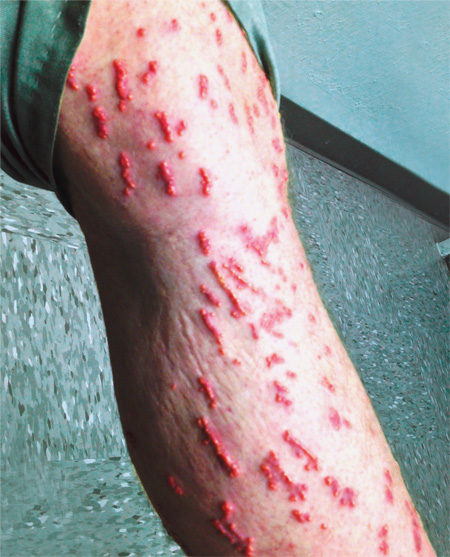
Although they are unaccompanied by any other symptoms, this man is understandably alarmed by the extensive lesions covering much of his body. They first appeared months ago but have become more numerous, larger, and more prominent with time. The patient’s history includes type 2 diabetes (often poorly controlled) and dyslipidemia, for which he takes fenofibrate. Several years ago, he experienced a similar skin outbreak, which resolved after the patient increased his exercise and gained better control of his blood glucose. The condition is striking. There are widespread bilateral collections of shallow intradermal papules, nodules, and plaques primarily on the extensor surfaces of the patient’s arms, legs, and thighs and the convex surfaces of his buttocks. Numbering into the hundreds, the lesions spare his palms, soles, face, and scalp. No abnormality of the periocular skin is appreciated. Moderately firm on palpation, the lesions range in size from 1 to 3 cm in diameter. In several locations, they are linearly configured. A 4-mm punch biopsy of one of them shows large numbers of foamy macrophages in the epidermis and upper dermis. Bloodwork reveals a triglyceride level of 3,850 mg/dL.

Mutation causes ibrutinib resistance in CLL

Credit: Rhoda Baer
Researchers say they have identified a source of drug resistance in chronic lymphocytic leukemia (CLL).
In a letter to The New England Journal of Medicine, the team described how a mutation in Bruton’s tyrosine kinase (BTK) triggers resistance to ibrutinib, a drug that treats CLL by inhibiting BTK.
The researchers discovered this point mutation in a CLL patient enrolled in a clinical trial. The patient initially responded well to ibrutinib but stopped responding after almost 20 months.
“In a way, we are repeating, at a faster pace, the story of Gleevec [imatinib],” said study author Y. Lynn Wang, MD, PhD, of the University of Chicago in Illinois.
“That story began with development of an effective drug with few side effects, but, in many patients, the leukemia eventually found a way around it after long-term use. So researchers developed second-line drugs to overcome resistance.”
The ibrutinib study began in 2010 at Weill Cornell Medical College in New York, one of several sites for a phase 1 trial of ibrutinib. The researchers recruited 16 patients with CLL whose disease had progressed or relapsed despite multiple treatments.
Dr Wang arranged to track the progress of each patient’s leukemic cells before and during treatment and to correlate any cellular or molecular changes with each patient’s disease activity.
One of the 16 patients in the trial seemed to be unusual. This 61-year-old woman was diagnosed in 2000 at age 49. She had unsuccessfully received several different treatments before entering the study.
Within 18 months of starting ibrutinib, she showed significant improvement. At about 20 months, however, she started to decline, developing a respiratory infection that did not improve with treatment. By 21 months, it was clear she was having a relapse. The clinical team increased her dose, with no discernable effect.
Dr Wang’s team quickly began analyzing her blood samples, looking for changes that occurred between the period when she was responding well to ibrutinib and after she began to relapse.
Because complete gene sequencing would be time consuming, Dr Wang asked a graduate student working on the project, Menu Setty from Memorial Sloan-Kettering in New York, to first focus on 3 proteins that were likely candidates. One of the candidates was BTK.
And sure enough, Setty discovered a tiny but consistent change in BTK in about 90% of post-relapse cells. It was a thymidine-to-adenine mutation at nucleotide 1634 of the BTK complementary DNA, leading to a substitution of serine for cysteine at residue 481 (C481S).
When the researchers later analyzed the entire set of the patient’s genes, they found no other genetic changes that correlated with the patient’s clinical course. BTK made perfect sense as the cause for drug resistance, the researchers noted, as it’s the primary target of ibrutinib binding, and it plays a central role in rapid cell proliferation.
Dr Wang and her colleagues used structural and biochemical measures to confirm that the C481S mutation made CLL cells resistant to ibrutinib. The studies indicated that ibrutinib was 500 times less likely to bind to mutant BTK.
In an attempt to save the patient, the researchers tested alternative kinase inhibitors against the patient’s leukemic cells in the lab.
They found some kinase inhibitors remained effective against ibrutinib-resistant cells. (These studies are described in a separate manuscript that has been submitted for publication.) Unfortunately, despite this effort, the patient passed away a few weeks later, due to sepsis.
The researchers noted that the C481S mutation is one of several mechanisms that underlie resistance to ibrutinib, but this research highlights the mutation’s role in disease development and drug resistance.
Understanding the molecular and cellular mechanisms of resistance is the first step toward monitoring, early detection, and development of novel strategies to overcome drug resistance. ![]()
FDA clears device to treat PE
Credit: Andre E.X. Brown
The US Food and Drug Administration has cleared for marketing a device that facilitates the treatment of pulmonary embolism (PE).
The EkoSonic Endovascular System is intended for controlled and selective infusion of physician-specified fluids, including thrombolytics, into the peripheral vasculature.
The device is designed to gently accelerate the penetration of thrombolytic agents into thrombi, thereby providing high levels of lysis.
The EkoSonic Endovascular System is the only minimally invasive endovascular therapy that is FDA-cleared for the treatment of PE. The device is manufactured by EKOS Corporation.
“The EKOS clinical data established that patients stricken with a life-threatening pulmonary embolism can be successfully and safely treated with the EkoSonic system,” said Samuel Z. Goldhaber, MD, of Brigham and Woman’s Hospital in Boston, Massachusetts.
The system produced favorable results in the ULTIMA and SEATTLE II trials.
Results of the ULTIMA trial were published in Circulation. The trial showed that, for PE patients at intermediate risk of adverse events, EKOS treatment was clinically superior to anticoagulation with heparin alone in reversing right ventricular dilation at 24 hours, without an increase in bleeding complications.
The results of SEATTLE II, the prospective, single-arm, multicenter trial of 150 patients, were released at the American College of Cardiology’s 63rd Annual Scientific Session & Expo.
SEATTLE II showed that ultrasound-facilitated catheter-directed low-dose fibrinolysis for acute PE minimizes the risk of intracranial hemorrhage, improves right ventricle function, and decreases pulmonary hypertension. ![]()
Hospitalist Minority Mentoring Program
The fraction of the US population identifying themselves as ethnic minorities was 36% in 2010 and will exceed 50% by 2050.[1, 2] This has resulted in an increasing gap in healthcare, as minorities have well‐documented disparities in access to healthcare and a disproportionately high morbidity and mortality.[3] In 2008, only 12.3% of US physicians were from under‐represented minority (URM) groups (see Figure in Castillo‐Page 4) (ie, those racial and ethnic populations that are underrepresented in the medical profession relative to their numbers in the general population as defined by the American Association of Medical Colleges[4, 5]). Diversifying the healthcare workforce may be an effective approach to reducing healthcare disparities, as URM physicians are more likely to choose primary care specialties,[6] work in underserved communities with socioeconomic or racial mixes similar to their own, thereby increasing access to care,[6, 7, 8] increasing minority patient satisfaction, and improving the quality of care received by minorities.[9, 10, 11]
The number of URM students attending medical school is slowly increasing, but in 2011, only 15% of the matriculating medical school students were URMs (see Figure 12 and Table 10 in Castillo‐Page[12]), and medical schools actively compete for this limited number of applicants. To increase the pool of qualified candidates, more URM students need to graduate college and pursue postgraduate healthcare training.[12]
URM undergraduate freshmen with intentions to enter medical school are 50% less likely to apply to medical school by the time they are seniors than their non‐Latino, white, and Asian counterparts.[13] Higher attrition rates have been linked to students having negative experiences in the basic science courses and with a lack of role models and exposure to careers in healthcare.[13, 14, 15, 16] We developed a hospitalist‐led mentoring program that was focused on overcoming these perceived limitations. This report describes the program and follow‐up data from our first year cohort documenting its success.
METHODS
The Healthcare Interest Program (HIP) was developed by 2 hospitalists (L. C., E. C.) and a physician's assistant (C. N.) who worked at Denver Health (DH), a university‐affiliated public hospital. We worked in conjunction with the chief diversity officer of the University of Colorado, Denver (UCD), primarily a commuter university in metropolitan Denver, where URMs composed 51% of the 2011 freshmen class. We reviewed articles describing mentoring programs for undergraduate students, and by consensus, designed a 7‐component program, each of which was intended to address a specific barrier identified in the literature as possibly contributing to reduced interest of minority students in pursuing medical careers (Table 1).[13, 14, 15, 16]
| Component | Goal |
|---|---|
| Clinical shadowing | |
| Student meets with their mentor and/or with other healthcare providers (eg, pharmacist, nurse) 4 hours per day, 1 or 2 times per month. | Expose students to various healthcare careers and to care for underserved patients. |
| Mentoring | |
| Student meets with their mentor for life coaching, career counseling, and to learn interviewing techniques 4 hours per month | Expand ideas of opportunity, address barriers or concerns before they affect grades, write letter of recommendation |
| Books to Bedside lectures | |
| One lecture per month designed to integrate clinical medicine with the undergraduate basic sciences. Sample lectures include: The Physics of Electrocardiograms and The Biochemistry of Diabetic Ketoacidosis | Improve the undergraduate experience in the basic science courses |
| Book club | |
| Group discussions of books selected for their focus on healthcare disparities and cultural diversity; 2 or 3 books per year (eg, The Spirit Catches You and You Fall Down by Ann Fadiman, Just Like Us by Helen Thorpe) | Socialize, begin to understand and discuss health disparities and caring for the underserved. |
| Diversity lectures | |
| Three speakers per term, each discussing different aspects of health disparities research being conducted in the Denver metropolitan area | Understand the disparities affecting the students' communities. Inspire interest in becoming involved with research. |
| Social events | |
| Kickoff, winter, and end‐of‐year gatherings | Socializing, peer group support |
| Journaling and reflection essay | |
| Summary of hospital experience with mentor and thoughts regarding healthcare career goals and plans. | Formalize career goals |
During the 2009 to 2010 academic year, information about the program, together with an application, was e‐mailed to all students at UCD who self‐identified as having interest in healthcare careers. This information was also distributed at all prehealth clubs and gatherings (ie, to students expressing interest in graduate and professional programs in healthcare‐related fields). All sophomore and junior students who submitted an application and had grade point averages (GPA) 2.8 were interviewed by the program director. Twenty‐three students were selected on the basis of their GPAs (attempting to include those with a range of GPAs), interviews, and the essays prepared as part of their applications.
An e‐mail soliciting mentors was sent to all hospitalists physicians and midlevels working at DH; 25/30 volunteered, and 20 were selected on the basis of their gender (as mentors were matched to students based on gender). The HIP director met with the mentors in person to introduce the program and its goals. All mentors had been practicing hospital medicine for 10 years after their training, and all but 3 were non‐Latino white. Each student accepted into the program was paired with a hospitalist who served as their mentor for the year.
The mentors were instructed in life coaching in both e‐mails and individual discussions. Every 2 or 3 months each hospitalist was contacted by e‐mail to see if questions or problems had arisen and to emphasize the need to meet with their mentees monthly.
Students filled out a written survey after each Books‐to‐Bedside (described in Table 1) discussion. The HIP director met with each student for at least 1 hour per semester and gathered feedback regarding mentor‐mentee success, shadowing experience, and the quality of the book club. At the end of the academic year, students completed a written, anonymous survey assessing their impressions of the program and their intentions of pursuing additional training in healthcare careers (Table 2). We used descriptive statistics to analyze the data including frequencies and mean tests.
|
| Open‐ended questions: |
| 1. How did HIP or your HIP mentor affect your application to your healthcare field of interest (eg, letter of recommendation, clinical hours, change in healthcare career of interest)? |
| 2. How did the Books to Bedside presentation affect you? |
| 3. My healthcare professional school of interest is (eg, medical school, nursing school, physician assistant school, pharmacy school, physical therapy school, dental school). |
| 4. How many times per month were you able to shadow at Denver Health? |
| 5. How would you revise the program to improve it? |
| Yes/no questions: |
| 1. English is my primary language. |
| 2. I am the first in my immediate family to attend college |
| 3. Did you work while in school? |
| 4. Did you receive scholarships while in school? |
| 5. Prior to participating in this program, I had a role model in my healthcare field of interest. |
| 6. My role model is my HIP mentor. |
| 7. May we contact you in 2 to 3 years to obtain information regarding your acceptance into your healthcare field of interest? |
| Likert 5‐point questions: |
| 1. Participation in HIP expanded my perceptions of what I could accomplish in the healthcare field. |
| 2. Participation in HIP has increased my confidence that I will be accepted into my healthcare field of choice. |
| 3. I intend to go to my healthcare school in the state of Colorado. |
| 4. One of my long‐term goals is to work with people with health disparities (eg, underserved). |
| 5. One of my long‐term goals is to work in a rural environment. |
| 6. I have access to my prehealth advisors. |
| 7. I have access to my HIP mentor. |
| 8. Outside of the HIP, I have had access to clinical experience shadowing with a physician or physician assistant. |
| 9. If not accepted the first time, I will reapply to my healthcare field of interest. |
| 10. I would recommend HIP to my colleagues. |
Two years after completing the program, each student was contacted via e‐mail and/or phone to determine whether they were still pursuing healthcare careers.
RESULTS
Twenty‐three students were accepted into the program (14 female, 9 male, mean age 19 [standard deviation1]). Their GPAs ranged from 2.8 to 4.0. Eleven (48%) were the first in their family to attend college, 6 (26%) indicated that English was not their primary language, and 16 (70%) were working while attending school. All 23 students stayed in the HIP program for the full academic year.
Nineteen of the 23 students (83%) completed the survey at the end of the year. Of these, 19 (100%) strongly agreed that the HIP expanded their perceptions of what they might accomplish and increased their confidence in being able to succeed in a healthcare profession. All 19 (100%) stated that they hoped to care for underserved minority patients in the future. Sixteen (84%) strongly agreed that their role model in life was their HIP mentor. These findings suggest that many of the HIP components successfully accomplished their goals (Table 1).
Two‐year follow‐up was available for 21 of the 23 students (91%). Twenty (95%) remained committed to a career in healthcare, 18 (86%) had graduated college, 6 (29%) were enrolled in graduate training in the healthcare professions (2 in medical school, 1 in nursing school, and 3 in a master's programs in public health, counseling, and medical science, respectively), and 9 (43%) were in the process of applying to postgraduate healthcare training programs (7 to medical school, 1 to dental school, and 1 to nursing school, respectively). Five students were preparing to take the Medical College Admissions Test, and 7 were working at various jobs in the healthcare field (eg, phlebotomists, certified nurse assistants, research assistants). Of the 16 students who expressed an interest in attending medical school at the beginning of the program, 15 (94%) maintained that interest.
DISCUSSION
HIP was extremely well‐received by the participating students, the majority graduated college and remained committed to a career in healthcare, and 29% were enrolled in postgraduate training in healthcare professions 2 years after graduation.
The 86% graduation rate that we observed compares highly favorably to the UCD campus‐wide graduation rates for minority students of 12.5% at 4 years and 30.8% at 5 years. Although there may be selection bias in the students participating in HIP, the extremely high graduation rate is consistent with HIP meeting 1 or more of its stated objectives.
Many universities have prehealthcare pipeline programs that are designed to provide short‐term summer medical experiences, research opportunities, and assistance with the Medical College Admissions Test.[17, 18, 19] We believe, however, that several aspects of our program are unique. First, we designed HIP to be year‐long, rather than a summertime program. Continuing the mentoring and life coaching throughout the year may allow stronger relationships to develop between the mentor and the student. In addition, ongoing student‐mentor interactions during the time when a student may be encountering problems with their undergraduate basic science courses may be beneficial. Second, the Books‐to‐Bedside lectures series, which was designed to link the students' basic science training with clinical medicine, has not previously been described and may contribute to a higher rate of completion of their basic science training. Third, those aspects of the program resulting in increased peer interactions (eg, book club discussions, diversity lectures, and social gatherings) provided an important venue for students with similar interests to interact, an opportunity that is limited at UCD as it is primarily a commuter university.
A number of lessons were learned during the first year of the program. First, a program such as ours must include rigorous evaluation from the start to make a case for support to the university and key stakeholders. With this in mind, it is possible to obtain funding and ensure long‐term sustainability. Second, by involving UCD's chief diversity officer in the development, the program fostered a strong partnership between DH and UCD and facilitated growing the program. Third, the hospitalists who attended the diversity‐training aspects of the program stated through informal feedback that they felt better equipped to care for the underserved and felt that providing mentorship increased their personal job satisfaction. Fourth, the students requested more opportunities for them to participate in health disparities research and in shadowing in subspecialties in addition to internal medicine. In response to this feedback, we now offer research opportunities, lectures on health disparities research, and interactions with community leaders working in improving healthcare for the underserved.
Although influencing the graduation rate from graduate level schooling is beyond the scope of HIP, we can conclude that the large majority of students participating in HIP maintained their interest in the healthcare professions, graduated college, and that many went on to postgraduate healthcare training. The data we present pertain to the cohort of students in the first year of the HIP. As the program matures, we will continue to evaluate the long‐term outcomes of our students and hospitalist mentors. This may provide opportunities for other academic hospitalists to replicate our program in their own communities.
ACKNOWLEDGMENTS
Disclosure: The authors report no conflicts of interest.
- United States Census Bureau. An older and more diverse nation by midcentury. Available at: https://www.census.gov/newsroom/releases/archives/population/cb08–123.html. Accessed February 28, 2013.
- United States Census Bureau. State and county quick facts. Available at: http://quickfacts.census.gov/qfd/states/00000.html. Accessed February 28, 2013.
- Centers for Disease Control and Prevention. Surveillance of health status in minority communities—racial and ethnic approaches to community health across the U.S. (REACH US) risk factor survey, United States, 2009. Available at: http://cdc.gov/mmwr/preview/mmwrhtml/ss6006a1.htm. Accessed February 28, 2013.
- Association of American Medical Colleges. Diversity in the physician workforce: facts and figures 2010. Available at: https://members.aamc.org/eweb/upload/Diversity%20in%20the%20 Physician%20Workforce%20Facts%20and%20Figures%202010.pdf. Accessed April 29, 2014.
- Association of American Medical Colleges Executive Committee. The status of the new AAMC definition of “underrepresented in medicine” following the Supreme Court's decision in Grutter. Available at: https://www.aamc.org/download/54278/data/urm.pdf. Accessed May 25, 2014.
- . Physician Characteristics and Distribution in the US. 2013 ed. Chicago, IL: American Medical Association; 2013.
- , , , et al. The role of black and Hispanic physicians in providing health care for underserved populations. N Engl J Med. 1996;334:1305–1310.
- , , . The association among specialty, race, ethnicity, and practice location among California physicians in diverse Specialties. J Natl Med Assoc. 2012;104:46–52.
- , , , , Patient‐physician racial concordance and the perceived quality and use of health care. Arch Intern Med. 1999;159:997–1004.
- , . Race of physician and satisfaction with care among African‐American patients. J Natl Med Assoc. 2002;94:937–943.
- U.S. Department of Health and Human Services Health Resources and Services Administration Bureau of Health Professions. The rational for diversity in health professions: a review of the evidence. 2006. Available at: http://bhpr.hrsa.gov/healthworkforce/reports/diversityreviewevidence.pdf. Accessed March 30, 2014.
- . Association of American Medical Colleges. Diversity in medical education: facts and figures 2012. Available at: https://members.aamc.org/eweb/upload/Diversity%20in%20Medical%20Ed ucation%20Facts%20and%20Figures%202012.pdf. Accessed February 28, 2013.
- , , . The leaky pipeline: factors associated with early decline in interest in premedical studies among underrepresented minority undergraduate students. Acad Med. 2008;83:503–511.
- , . Perspective: adopting an asset bundles model to support and advance minority students' careers in academic medicine and the scientific pipeline. Acad Med. 2012;87:1488–1495.
- , , , . Contributors of black men's success in admission to and graduation from medical school. Acad Med. 2011;86:892–900.
- , . Premed survival: understanding the culling process in premedical undergraduate education. Acad Med. 2002;77:719–724.
- , , , . A novel enrichment program using cascading mentorship to increase diversity in the health care professions. Acad Med. 2013;88:1232–1238.
- , . A social and academic enrichment program promotes medical school matriculation and graduation for disadvantaged students. Educ Health. 2012;25:55–63.
- , , , . Addressing medical school diversity through an undergraduate partnership at Texas A83:512–515.
The fraction of the US population identifying themselves as ethnic minorities was 36% in 2010 and will exceed 50% by 2050.[1, 2] This has resulted in an increasing gap in healthcare, as minorities have well‐documented disparities in access to healthcare and a disproportionately high morbidity and mortality.[3] In 2008, only 12.3% of US physicians were from under‐represented minority (URM) groups (see Figure in Castillo‐Page 4) (ie, those racial and ethnic populations that are underrepresented in the medical profession relative to their numbers in the general population as defined by the American Association of Medical Colleges[4, 5]). Diversifying the healthcare workforce may be an effective approach to reducing healthcare disparities, as URM physicians are more likely to choose primary care specialties,[6] work in underserved communities with socioeconomic or racial mixes similar to their own, thereby increasing access to care,[6, 7, 8] increasing minority patient satisfaction, and improving the quality of care received by minorities.[9, 10, 11]
The number of URM students attending medical school is slowly increasing, but in 2011, only 15% of the matriculating medical school students were URMs (see Figure 12 and Table 10 in Castillo‐Page[12]), and medical schools actively compete for this limited number of applicants. To increase the pool of qualified candidates, more URM students need to graduate college and pursue postgraduate healthcare training.[12]
URM undergraduate freshmen with intentions to enter medical school are 50% less likely to apply to medical school by the time they are seniors than their non‐Latino, white, and Asian counterparts.[13] Higher attrition rates have been linked to students having negative experiences in the basic science courses and with a lack of role models and exposure to careers in healthcare.[13, 14, 15, 16] We developed a hospitalist‐led mentoring program that was focused on overcoming these perceived limitations. This report describes the program and follow‐up data from our first year cohort documenting its success.
METHODS
The Healthcare Interest Program (HIP) was developed by 2 hospitalists (L. C., E. C.) and a physician's assistant (C. N.) who worked at Denver Health (DH), a university‐affiliated public hospital. We worked in conjunction with the chief diversity officer of the University of Colorado, Denver (UCD), primarily a commuter university in metropolitan Denver, where URMs composed 51% of the 2011 freshmen class. We reviewed articles describing mentoring programs for undergraduate students, and by consensus, designed a 7‐component program, each of which was intended to address a specific barrier identified in the literature as possibly contributing to reduced interest of minority students in pursuing medical careers (Table 1).[13, 14, 15, 16]
| Component | Goal |
|---|---|
| Clinical shadowing | |
| Student meets with their mentor and/or with other healthcare providers (eg, pharmacist, nurse) 4 hours per day, 1 or 2 times per month. | Expose students to various healthcare careers and to care for underserved patients. |
| Mentoring | |
| Student meets with their mentor for life coaching, career counseling, and to learn interviewing techniques 4 hours per month | Expand ideas of opportunity, address barriers or concerns before they affect grades, write letter of recommendation |
| Books to Bedside lectures | |
| One lecture per month designed to integrate clinical medicine with the undergraduate basic sciences. Sample lectures include: The Physics of Electrocardiograms and The Biochemistry of Diabetic Ketoacidosis | Improve the undergraduate experience in the basic science courses |
| Book club | |
| Group discussions of books selected for their focus on healthcare disparities and cultural diversity; 2 or 3 books per year (eg, The Spirit Catches You and You Fall Down by Ann Fadiman, Just Like Us by Helen Thorpe) | Socialize, begin to understand and discuss health disparities and caring for the underserved. |
| Diversity lectures | |
| Three speakers per term, each discussing different aspects of health disparities research being conducted in the Denver metropolitan area | Understand the disparities affecting the students' communities. Inspire interest in becoming involved with research. |
| Social events | |
| Kickoff, winter, and end‐of‐year gatherings | Socializing, peer group support |
| Journaling and reflection essay | |
| Summary of hospital experience with mentor and thoughts regarding healthcare career goals and plans. | Formalize career goals |
During the 2009 to 2010 academic year, information about the program, together with an application, was e‐mailed to all students at UCD who self‐identified as having interest in healthcare careers. This information was also distributed at all prehealth clubs and gatherings (ie, to students expressing interest in graduate and professional programs in healthcare‐related fields). All sophomore and junior students who submitted an application and had grade point averages (GPA) 2.8 were interviewed by the program director. Twenty‐three students were selected on the basis of their GPAs (attempting to include those with a range of GPAs), interviews, and the essays prepared as part of their applications.
An e‐mail soliciting mentors was sent to all hospitalists physicians and midlevels working at DH; 25/30 volunteered, and 20 were selected on the basis of their gender (as mentors were matched to students based on gender). The HIP director met with the mentors in person to introduce the program and its goals. All mentors had been practicing hospital medicine for 10 years after their training, and all but 3 were non‐Latino white. Each student accepted into the program was paired with a hospitalist who served as their mentor for the year.
The mentors were instructed in life coaching in both e‐mails and individual discussions. Every 2 or 3 months each hospitalist was contacted by e‐mail to see if questions or problems had arisen and to emphasize the need to meet with their mentees monthly.
Students filled out a written survey after each Books‐to‐Bedside (described in Table 1) discussion. The HIP director met with each student for at least 1 hour per semester and gathered feedback regarding mentor‐mentee success, shadowing experience, and the quality of the book club. At the end of the academic year, students completed a written, anonymous survey assessing their impressions of the program and their intentions of pursuing additional training in healthcare careers (Table 2). We used descriptive statistics to analyze the data including frequencies and mean tests.
|
| Open‐ended questions: |
| 1. How did HIP or your HIP mentor affect your application to your healthcare field of interest (eg, letter of recommendation, clinical hours, change in healthcare career of interest)? |
| 2. How did the Books to Bedside presentation affect you? |
| 3. My healthcare professional school of interest is (eg, medical school, nursing school, physician assistant school, pharmacy school, physical therapy school, dental school). |
| 4. How many times per month were you able to shadow at Denver Health? |
| 5. How would you revise the program to improve it? |
| Yes/no questions: |
| 1. English is my primary language. |
| 2. I am the first in my immediate family to attend college |
| 3. Did you work while in school? |
| 4. Did you receive scholarships while in school? |
| 5. Prior to participating in this program, I had a role model in my healthcare field of interest. |
| 6. My role model is my HIP mentor. |
| 7. May we contact you in 2 to 3 years to obtain information regarding your acceptance into your healthcare field of interest? |
| Likert 5‐point questions: |
| 1. Participation in HIP expanded my perceptions of what I could accomplish in the healthcare field. |
| 2. Participation in HIP has increased my confidence that I will be accepted into my healthcare field of choice. |
| 3. I intend to go to my healthcare school in the state of Colorado. |
| 4. One of my long‐term goals is to work with people with health disparities (eg, underserved). |
| 5. One of my long‐term goals is to work in a rural environment. |
| 6. I have access to my prehealth advisors. |
| 7. I have access to my HIP mentor. |
| 8. Outside of the HIP, I have had access to clinical experience shadowing with a physician or physician assistant. |
| 9. If not accepted the first time, I will reapply to my healthcare field of interest. |
| 10. I would recommend HIP to my colleagues. |
Two years after completing the program, each student was contacted via e‐mail and/or phone to determine whether they were still pursuing healthcare careers.
RESULTS
Twenty‐three students were accepted into the program (14 female, 9 male, mean age 19 [standard deviation1]). Their GPAs ranged from 2.8 to 4.0. Eleven (48%) were the first in their family to attend college, 6 (26%) indicated that English was not their primary language, and 16 (70%) were working while attending school. All 23 students stayed in the HIP program for the full academic year.
Nineteen of the 23 students (83%) completed the survey at the end of the year. Of these, 19 (100%) strongly agreed that the HIP expanded their perceptions of what they might accomplish and increased their confidence in being able to succeed in a healthcare profession. All 19 (100%) stated that they hoped to care for underserved minority patients in the future. Sixteen (84%) strongly agreed that their role model in life was their HIP mentor. These findings suggest that many of the HIP components successfully accomplished their goals (Table 1).
Two‐year follow‐up was available for 21 of the 23 students (91%). Twenty (95%) remained committed to a career in healthcare, 18 (86%) had graduated college, 6 (29%) were enrolled in graduate training in the healthcare professions (2 in medical school, 1 in nursing school, and 3 in a master's programs in public health, counseling, and medical science, respectively), and 9 (43%) were in the process of applying to postgraduate healthcare training programs (7 to medical school, 1 to dental school, and 1 to nursing school, respectively). Five students were preparing to take the Medical College Admissions Test, and 7 were working at various jobs in the healthcare field (eg, phlebotomists, certified nurse assistants, research assistants). Of the 16 students who expressed an interest in attending medical school at the beginning of the program, 15 (94%) maintained that interest.
DISCUSSION
HIP was extremely well‐received by the participating students, the majority graduated college and remained committed to a career in healthcare, and 29% were enrolled in postgraduate training in healthcare professions 2 years after graduation.
The 86% graduation rate that we observed compares highly favorably to the UCD campus‐wide graduation rates for minority students of 12.5% at 4 years and 30.8% at 5 years. Although there may be selection bias in the students participating in HIP, the extremely high graduation rate is consistent with HIP meeting 1 or more of its stated objectives.
Many universities have prehealthcare pipeline programs that are designed to provide short‐term summer medical experiences, research opportunities, and assistance with the Medical College Admissions Test.[17, 18, 19] We believe, however, that several aspects of our program are unique. First, we designed HIP to be year‐long, rather than a summertime program. Continuing the mentoring and life coaching throughout the year may allow stronger relationships to develop between the mentor and the student. In addition, ongoing student‐mentor interactions during the time when a student may be encountering problems with their undergraduate basic science courses may be beneficial. Second, the Books‐to‐Bedside lectures series, which was designed to link the students' basic science training with clinical medicine, has not previously been described and may contribute to a higher rate of completion of their basic science training. Third, those aspects of the program resulting in increased peer interactions (eg, book club discussions, diversity lectures, and social gatherings) provided an important venue for students with similar interests to interact, an opportunity that is limited at UCD as it is primarily a commuter university.
A number of lessons were learned during the first year of the program. First, a program such as ours must include rigorous evaluation from the start to make a case for support to the university and key stakeholders. With this in mind, it is possible to obtain funding and ensure long‐term sustainability. Second, by involving UCD's chief diversity officer in the development, the program fostered a strong partnership between DH and UCD and facilitated growing the program. Third, the hospitalists who attended the diversity‐training aspects of the program stated through informal feedback that they felt better equipped to care for the underserved and felt that providing mentorship increased their personal job satisfaction. Fourth, the students requested more opportunities for them to participate in health disparities research and in shadowing in subspecialties in addition to internal medicine. In response to this feedback, we now offer research opportunities, lectures on health disparities research, and interactions with community leaders working in improving healthcare for the underserved.
Although influencing the graduation rate from graduate level schooling is beyond the scope of HIP, we can conclude that the large majority of students participating in HIP maintained their interest in the healthcare professions, graduated college, and that many went on to postgraduate healthcare training. The data we present pertain to the cohort of students in the first year of the HIP. As the program matures, we will continue to evaluate the long‐term outcomes of our students and hospitalist mentors. This may provide opportunities for other academic hospitalists to replicate our program in their own communities.
ACKNOWLEDGMENTS
Disclosure: The authors report no conflicts of interest.
- United States Census Bureau. An older and more diverse nation by midcentury. Available at: https://www.census.gov/newsroom/releases/archives/population/cb08–123.html. Accessed February 28, 2013.
- United States Census Bureau. State and county quick facts. Available at: http://quickfacts.census.gov/qfd/states/00000.html. Accessed February 28, 2013.
- Centers for Disease Control and Prevention. Surveillance of health status in minority communities—racial and ethnic approaches to community health across the U.S. (REACH US) risk factor survey, United States, 2009. Available at: http://cdc.gov/mmwr/preview/mmwrhtml/ss6006a1.htm. Accessed February 28, 2013.
- Association of American Medical Colleges. Diversity in the physician workforce: facts and figures 2010. Available at: https://members.aamc.org/eweb/upload/Diversity%20in%20the%20 Physician%20Workforce%20Facts%20and%20Figures%202010.pdf. Accessed April 29, 2014.
- Association of American Medical Colleges Executive Committee. The status of the new AAMC definition of “underrepresented in medicine” following the Supreme Court's decision in Grutter. Available at: https://www.aamc.org/download/54278/data/urm.pdf. Accessed May 25, 2014.
- . Physician Characteristics and Distribution in the US. 2013 ed. Chicago, IL: American Medical Association; 2013.
- , , , et al. The role of black and Hispanic physicians in providing health care for underserved populations. N Engl J Med. 1996;334:1305–1310.
- , , . The association among specialty, race, ethnicity, and practice location among California physicians in diverse Specialties. J Natl Med Assoc. 2012;104:46–52.
- , , , , Patient‐physician racial concordance and the perceived quality and use of health care. Arch Intern Med. 1999;159:997–1004.
- , . Race of physician and satisfaction with care among African‐American patients. J Natl Med Assoc. 2002;94:937–943.
- U.S. Department of Health and Human Services Health Resources and Services Administration Bureau of Health Professions. The rational for diversity in health professions: a review of the evidence. 2006. Available at: http://bhpr.hrsa.gov/healthworkforce/reports/diversityreviewevidence.pdf. Accessed March 30, 2014.
- . Association of American Medical Colleges. Diversity in medical education: facts and figures 2012. Available at: https://members.aamc.org/eweb/upload/Diversity%20in%20Medical%20Ed ucation%20Facts%20and%20Figures%202012.pdf. Accessed February 28, 2013.
- , , . The leaky pipeline: factors associated with early decline in interest in premedical studies among underrepresented minority undergraduate students. Acad Med. 2008;83:503–511.
- , . Perspective: adopting an asset bundles model to support and advance minority students' careers in academic medicine and the scientific pipeline. Acad Med. 2012;87:1488–1495.
- , , , . Contributors of black men's success in admission to and graduation from medical school. Acad Med. 2011;86:892–900.
- , . Premed survival: understanding the culling process in premedical undergraduate education. Acad Med. 2002;77:719–724.
- , , , . A novel enrichment program using cascading mentorship to increase diversity in the health care professions. Acad Med. 2013;88:1232–1238.
- , . A social and academic enrichment program promotes medical school matriculation and graduation for disadvantaged students. Educ Health. 2012;25:55–63.
- , , , . Addressing medical school diversity through an undergraduate partnership at Texas A83:512–515.
Letter to the Editor
Dr. Horwitz appropriately notes that anemia of chronic disease may be better described as anemia of inflammation.[1, 2] We used the more traditional nomenclature for the sake of clarity to those readers who may not be familiar with the newer terminology. We do agree that there is often a role for hematology evaluation, but believe it should be based on the needs of the individual case and the needs of the organization. To be effective, any algorithm must maintain some flexibility for clinical judgment, and must also meet the needs of local stakeholders. We recommend that prior to implementing a preoperative anemia algorithm it is reviewed by the appropriate parties, which would typically include, but not be limited to, clinical leadership in anesthesia, surgery, medicine, and hematology.
- , , , . Patient‐centered blood management. J Hosp Med. 2014;9:60–65.
- , . Anemia of chronic disease. N Engl J Med. 2005:352:1011–1023.
Dr. Horwitz appropriately notes that anemia of chronic disease may be better described as anemia of inflammation.[1, 2] We used the more traditional nomenclature for the sake of clarity to those readers who may not be familiar with the newer terminology. We do agree that there is often a role for hematology evaluation, but believe it should be based on the needs of the individual case and the needs of the organization. To be effective, any algorithm must maintain some flexibility for clinical judgment, and must also meet the needs of local stakeholders. We recommend that prior to implementing a preoperative anemia algorithm it is reviewed by the appropriate parties, which would typically include, but not be limited to, clinical leadership in anesthesia, surgery, medicine, and hematology.
Dr. Horwitz appropriately notes that anemia of chronic disease may be better described as anemia of inflammation.[1, 2] We used the more traditional nomenclature for the sake of clarity to those readers who may not be familiar with the newer terminology. We do agree that there is often a role for hematology evaluation, but believe it should be based on the needs of the individual case and the needs of the organization. To be effective, any algorithm must maintain some flexibility for clinical judgment, and must also meet the needs of local stakeholders. We recommend that prior to implementing a preoperative anemia algorithm it is reviewed by the appropriate parties, which would typically include, but not be limited to, clinical leadership in anesthesia, surgery, medicine, and hematology.
- , , , . Patient‐centered blood management. J Hosp Med. 2014;9:60–65.
- , . Anemia of chronic disease. N Engl J Med. 2005:352:1011–1023.
- , , , . Patient‐centered blood management. J Hosp Med. 2014;9:60–65.
- , . Anemia of chronic disease. N Engl J Med. 2005:352:1011–1023.
Letter to the Editor
There is one thing I would like to add to the flowsheet for management of preoperative anemia that Hohmuth et al.[1] have incorporated into their recent review titled Patient‐Centered Blood Management. Anemia of chronic disease, now called anemia of chronic inflammation,[2] is still a diagnosis of exclusion, and I would recommend a hematology evaluation before the final step of starting somebody on erythropoietic agents.
- , , , . Patient‐centered blood management. J Hosp Med. 2014;9(1):60–65.
- . The anemia of chronic inflammation. In: Balducci L, Ershler WB, Bennett JM, eds. Anemia in the Elderly. New York, NY: Springer; 2007:51–59.
There is one thing I would like to add to the flowsheet for management of preoperative anemia that Hohmuth et al.[1] have incorporated into their recent review titled Patient‐Centered Blood Management. Anemia of chronic disease, now called anemia of chronic inflammation,[2] is still a diagnosis of exclusion, and I would recommend a hematology evaluation before the final step of starting somebody on erythropoietic agents.
There is one thing I would like to add to the flowsheet for management of preoperative anemia that Hohmuth et al.[1] have incorporated into their recent review titled Patient‐Centered Blood Management. Anemia of chronic disease, now called anemia of chronic inflammation,[2] is still a diagnosis of exclusion, and I would recommend a hematology evaluation before the final step of starting somebody on erythropoietic agents.
- , , , . Patient‐centered blood management. J Hosp Med. 2014;9(1):60–65.
- . The anemia of chronic inflammation. In: Balducci L, Ershler WB, Bennett JM, eds. Anemia in the Elderly. New York, NY: Springer; 2007:51–59.
- , , , . Patient‐centered blood management. J Hosp Med. 2014;9(1):60–65.
- . The anemia of chronic inflammation. In: Balducci L, Ershler WB, Bennett JM, eds. Anemia in the Elderly. New York, NY: Springer; 2007:51–59.
New obesity algorithm covers complications in addition to BMI
LAS VEGAS– A newly introduced statement proposes to change how obesity is diagnosed and treated.
The American Association of Clinical Endocrinologists and the American College of Endocrinology are suggesting algorithms to determine stages for the disease, each of which comes with a set of therapy recommendations.
"Right now it’s obesity, or overweight/obesity, or Class 1, 2, 3 obesity – it’s all [body mass index]. BMI doesn’t convey actionability. It doesn’t convey a medical meaning," said Dr. W. Timothy Garvey, chair of the AACE Obesity Scientific Committee at the annual meeting of the American Association of Clinical Endocrinologists.

AACE/ACE leaders hope that their new diagnostic algorithm will fill that gap.
"We’re using weight loss therapy to treat the complications of obesity in a medical model," Dr. Garvey said.
According to the framework, which is not finalized yet, the diagnostic categories of obesity will be:
• Overweight: BMI of 25-29.9 kg/m2, with no obesity-related complications.
• Obesity Stage 0: BMI of at least 30, with no obesity-related complications.
• Obesity Stage 1: BMI of at least 25 and one or more complications that are mild to moderate in severity.
• Obesity stage 2: BMI of greater than or equal to 25 and one or more severe complications.
Also, a four-step diagnosis and treatment approach is recommended for all patients:
1. BMI screening and adjusting for ethnic differences.
2. Clinical evaluation for the presence of obesity-related complications, by using a checklist.
3. Staging for the severity of complications using complication-specific criteria.
4. Selection of prevention and/or intervention strategies targeting specific complications guided by the AACE/ACE obesity management algorithm.
AACE/ACE leaders pointed out that today there are better tools to treat obesity than ever before, including improvements in lifestyle intervention, new medications, and improvements in bariatric surgery, yet there’s limited access and penetrance of these tools in the clinic. They said they hoped the new algorithm would help incorporate available therapies into treating obese patients.
The algorithm emerged from the AACE/ACE 2014 Consensus Conference on Obesity, which included medical professionals, industry representatives, advocacy groups, and regulators. One of the findings that everyone agreed on was that the diagnostic definition of obesity needed to improve.
The current definition of obesity "didn’t give all the stakeholders a reason to buy into a concerted plan." Employers would say, "I bring somebody down from a BMI of 38 to 34. But what does that mean? "How is it benefiting me? How is it benefiting my company? Why would I want to invest in that? But if they’re treating Stage 2, that’s telling them that that person is overweight, has excessive body fat, and it’s impacting their health and they have complications that can be remedied by weight loss and use of more aggressive therapies. All of that is embedded in that simple term," Dr. Garvey said.
The AACE/ACE is not the first to issue a diagnosis or treatment guideline for obesity, which was declared a disease by the American Medical Association in 2013.
There are a lot of commonalities to the guidelines," said Dr. Garvey, professor and chair at the department of Nutrition Sciences at the University of Alabama at Birmingham. They’re all addressing obesity and therapy and attempt to improve patients’ health. "I think we’re more focused on using weight loss as a therapy to treat obesity-related complications," Dr. Garvey said.
AACE/ACE is holding another consensus conference later this year as a step toward finalizing the framework.
Dr. Garvey is a consultant for Daiichi Sankyo, Liposcience, Takeda, Vivus, Boehringer Ingelheim, Janssen, Eisai, and Novo Nordisk. He has received research funding from Merck, Astra Zeneca, Weight Watchers, Eisai, and Sanofi.
On Twitter @naseemmiller
LAS VEGAS– A newly introduced statement proposes to change how obesity is diagnosed and treated.
The American Association of Clinical Endocrinologists and the American College of Endocrinology are suggesting algorithms to determine stages for the disease, each of which comes with a set of therapy recommendations.
"Right now it’s obesity, or overweight/obesity, or Class 1, 2, 3 obesity – it’s all [body mass index]. BMI doesn’t convey actionability. It doesn’t convey a medical meaning," said Dr. W. Timothy Garvey, chair of the AACE Obesity Scientific Committee at the annual meeting of the American Association of Clinical Endocrinologists.
AACE/ACE leaders hope that their new diagnostic algorithm will fill that gap.
"We’re using weight loss therapy to treat the complications of obesity in a medical model," Dr. Garvey said.
According to the framework, which is not finalized yet, the diagnostic categories of obesity will be:
• Overweight: BMI of 25-29.9 kg/m2, with no obesity-related complications.
• Obesity Stage 0: BMI of at least 30, with no obesity-related complications.
• Obesity Stage 1: BMI of at least 25 and one or more complications that are mild to moderate in severity.
• Obesity stage 2: BMI of greater than or equal to 25 and one or more severe complications.
Also, a four-step diagnosis and treatment approach is recommended for all patients:
1. BMI screening and adjusting for ethnic differences.
2. Clinical evaluation for the presence of obesity-related complications, by using a checklist.
3. Staging for the severity of complications using complication-specific criteria.
4. Selection of prevention and/or intervention strategies targeting specific complications guided by the AACE/ACE obesity management algorithm.
AACE/ACE leaders pointed out that today there are better tools to treat obesity than ever before, including improvements in lifestyle intervention, new medications, and improvements in bariatric surgery, yet there’s limited access and penetrance of these tools in the clinic. They said they hoped the new algorithm would help incorporate available therapies into treating obese patients.
The algorithm emerged from the AACE/ACE 2014 Consensus Conference on Obesity, which included medical professionals, industry representatives, advocacy groups, and regulators. One of the findings that everyone agreed on was that the diagnostic definition of obesity needed to improve.
The current definition of obesity "didn’t give all the stakeholders a reason to buy into a concerted plan." Employers would say, "I bring somebody down from a BMI of 38 to 34. But what does that mean? "How is it benefiting me? How is it benefiting my company? Why would I want to invest in that? But if they’re treating Stage 2, that’s telling them that that person is overweight, has excessive body fat, and it’s impacting their health and they have complications that can be remedied by weight loss and use of more aggressive therapies. All of that is embedded in that simple term," Dr. Garvey said.
The AACE/ACE is not the first to issue a diagnosis or treatment guideline for obesity, which was declared a disease by the American Medical Association in 2013.
There are a lot of commonalities to the guidelines," said Dr. Garvey, professor and chair at the department of Nutrition Sciences at the University of Alabama at Birmingham. They’re all addressing obesity and therapy and attempt to improve patients’ health. "I think we’re more focused on using weight loss as a therapy to treat obesity-related complications," Dr. Garvey said.
AACE/ACE is holding another consensus conference later this year as a step toward finalizing the framework.
Dr. Garvey is a consultant for Daiichi Sankyo, Liposcience, Takeda, Vivus, Boehringer Ingelheim, Janssen, Eisai, and Novo Nordisk. He has received research funding from Merck, Astra Zeneca, Weight Watchers, Eisai, and Sanofi.
On Twitter @naseemmiller
AT AACE 2014

Frontotemporal dementia and its variants: What to look for
Frontotemporal dementia (FTD) is a neurologic disease that affects the frontal and the temporal lobes of the cerebral cortex.1 This disorder is observed most often in people between age 45 to 65, but also can manifest in younger or older persons.1 The cause varies among a range of pathologies affecting the anterior portions of the brain.2
Presentations
FTD presents with changes in personality, social skills, ability to concentrate, motivation, reasoning, and language abnormality.3 Memory loss is less prominent in this condition compared with other dementias; therefore, identification may be a diagnostic challenge. FTD can be misdiagnosed as a psychiatric illness or not recognized because social symptoms dominate over cognitive dysfunction. As the disease progresses, patients may become increasingly unable to plan or organize activities of daily living, behave appropriately, and react normally in social interactions.1
FTD has 3 diagnostic variants1-4:
Behavioral variant. Known as Pick disease or the “frontal variant,”1,2 this type of FTD manifests as changes in personality, improper behavior in social settings, personal neglect, or impulsivity, such as shoplifting or hypersexuality.
Primary progressive aphasia. Two types of language dysfunction are observed in FTD:
• Semantic dementia (SD)3: Left-sided SD presents with “meaningless speech” or “word substitutions” (eg, “chair” instead of “table”). Right-sided SD, however, is characterized by forgetting the faces of familiar people or objects.
• Primary nonfluent aphasia3: Language fluency is compromised. Persons with such language dysfunction cannot produce words easily, and their speech is stumbling and nonfluent.
FTD with motor neuron disease.4 The most common type of motor neuron disease associated with FTD is amyotrophic lateral sclerosis. Afflicted patients exhibit muscle weakness, spasms, and rigidity. This leads to difficulty in swallowing or breathing because the diaphragm and pharynx are paralyzed. Other diseases associated with FTD include corticobasal degeneration and progressive supranuclear palsy.
Diagnosis
In DSM-5, FTD has been renamed “frontotemporal lobar degeneration” under the category of “Major and Mild Neurocognitive Disorders.”5 The workup begins with a history, physical examination, and mental status assessment. Physical signs can include frontal-release, primitive reflexes. Early in the disease course, a palmomental reflex often is observed; later, as disease progress, the rooting reflex or palmar grasp may become apparent.1,5
Diagnosing FTD requires recognizing its symptoms and ruling out conditions such as Alzheimer’s disease, depression, and schizophrenia.6 Laboratory studies may help identify other conditions. Brain imaging, such as MRI, can depict frontotemporal pathology and rule in or exclude other diseases.3,5
Psychometric testing can evaluate memory or cognitive ability, which might be unremarkable during the initial phases of FTD.4 Further psychological assessments may provide objective verification of frontal lobe deficiencies in social skills or activities of daily living.3 Positron emission tomography and single-photon emission computed tomography may demonstrate areas of decreased activity or hypoperfusion in frontal and temporal lobes.7
Interventions
Treatment of FTD is limited to symptomatic therapy8; there are no specific, approved countermeasures available. Comorbid conditions, such as diabetes mellitus or hypertension, should be treated medically. Social interventions such as day care, increased supervision, and emotional support from the family can be effective adjuvants.2
Disclosures
The authors report no financial relationship whose products are mentioned in this article or with manufacturers of competing products.
1. Snowden JS, Neary D, Mann DM. Frontotemporal dementia. Br J Psychiatry. 2002;180:140-143.
2. Frontotemporal degeneration. The Association for Frontotemporal Degeneration. http://www.theaftd.org/ frontotemporal-degeneration/ftd-overview. Accessed April 24, 2014.
3. Neary D, Snowden JS, Gustafson L, et al. Frontotemporal lobar degeneration: a consensus on clinical diagnostic criteria. Neurology. 1998;51(6):1546-1554.
4. Clark CM, Forman MS. Frontotemporal lobar degeneration with motor neuron disease: a clinical and pathological spectrum. Arch Neurol. 2006;63(4):489-490.
5. Diagnostic and statistical manual of mental disorders. 5th ed. Washington, DC: American Psychiatric Association; 2013:614-618.
6. Frontotemporal dementia diagnosis. UCSF Medical Center. http://www.ucsfhealth.org/conditions/frontotemporal_ dementia/diagnosis.html. Accessed April 24, 2014.
7. McMurtray AM, Chen AK, Shapira JS, et al. Variations in regional SPECT hypoperfusion and clinical features in frontotemporal dementia. Neurology. 2006;66(4):517-522.
8. Miller BL, Lee SE. Frontotemporal dementia: treatment. Up To Date. http://www.uptodate.com/contents/frontotemporal-dementia-treatment?source=search_result&search=frontote mporal+dementia+treatment&selectedTitle=1~150. Updated December 30, 2013. Accessed April 24, 2014.
Frontotemporal dementia (FTD) is a neurologic disease that affects the frontal and the temporal lobes of the cerebral cortex.1 This disorder is observed most often in people between age 45 to 65, but also can manifest in younger or older persons.1 The cause varies among a range of pathologies affecting the anterior portions of the brain.2
Presentations
FTD presents with changes in personality, social skills, ability to concentrate, motivation, reasoning, and language abnormality.3 Memory loss is less prominent in this condition compared with other dementias; therefore, identification may be a diagnostic challenge. FTD can be misdiagnosed as a psychiatric illness or not recognized because social symptoms dominate over cognitive dysfunction. As the disease progresses, patients may become increasingly unable to plan or organize activities of daily living, behave appropriately, and react normally in social interactions.1
FTD has 3 diagnostic variants1-4:
Behavioral variant. Known as Pick disease or the “frontal variant,”1,2 this type of FTD manifests as changes in personality, improper behavior in social settings, personal neglect, or impulsivity, such as shoplifting or hypersexuality.
Primary progressive aphasia. Two types of language dysfunction are observed in FTD:
• Semantic dementia (SD)3: Left-sided SD presents with “meaningless speech” or “word substitutions” (eg, “chair” instead of “table”). Right-sided SD, however, is characterized by forgetting the faces of familiar people or objects.
• Primary nonfluent aphasia3: Language fluency is compromised. Persons with such language dysfunction cannot produce words easily, and their speech is stumbling and nonfluent.
FTD with motor neuron disease.4 The most common type of motor neuron disease associated with FTD is amyotrophic lateral sclerosis. Afflicted patients exhibit muscle weakness, spasms, and rigidity. This leads to difficulty in swallowing or breathing because the diaphragm and pharynx are paralyzed. Other diseases associated with FTD include corticobasal degeneration and progressive supranuclear palsy.
Diagnosis
In DSM-5, FTD has been renamed “frontotemporal lobar degeneration” under the category of “Major and Mild Neurocognitive Disorders.”5 The workup begins with a history, physical examination, and mental status assessment. Physical signs can include frontal-release, primitive reflexes. Early in the disease course, a palmomental reflex often is observed; later, as disease progress, the rooting reflex or palmar grasp may become apparent.1,5
Diagnosing FTD requires recognizing its symptoms and ruling out conditions such as Alzheimer’s disease, depression, and schizophrenia.6 Laboratory studies may help identify other conditions. Brain imaging, such as MRI, can depict frontotemporal pathology and rule in or exclude other diseases.3,5
Psychometric testing can evaluate memory or cognitive ability, which might be unremarkable during the initial phases of FTD.4 Further psychological assessments may provide objective verification of frontal lobe deficiencies in social skills or activities of daily living.3 Positron emission tomography and single-photon emission computed tomography may demonstrate areas of decreased activity or hypoperfusion in frontal and temporal lobes.7
Interventions
Treatment of FTD is limited to symptomatic therapy8; there are no specific, approved countermeasures available. Comorbid conditions, such as diabetes mellitus or hypertension, should be treated medically. Social interventions such as day care, increased supervision, and emotional support from the family can be effective adjuvants.2
Disclosures
The authors report no financial relationship whose products are mentioned in this article or with manufacturers of competing products.
1. Snowden JS, Neary D, Mann DM. Frontotemporal dementia. Br J Psychiatry. 2002;180:140-143.
2. Frontotemporal degeneration. The Association for Frontotemporal Degeneration. http://www.theaftd.org/ frontotemporal-degeneration/ftd-overview. Accessed April 24, 2014.
3. Neary D, Snowden JS, Gustafson L, et al. Frontotemporal lobar degeneration: a consensus on clinical diagnostic criteria. Neurology. 1998;51(6):1546-1554.
4. Clark CM, Forman MS. Frontotemporal lobar degeneration with motor neuron disease: a clinical and pathological spectrum. Arch Neurol. 2006;63(4):489-490.
5. Diagnostic and statistical manual of mental disorders. 5th ed. Washington, DC: American Psychiatric Association; 2013:614-618.
6. Frontotemporal dementia diagnosis. UCSF Medical Center. http://www.ucsfhealth.org/conditions/frontotemporal_ dementia/diagnosis.html. Accessed April 24, 2014.
7. McMurtray AM, Chen AK, Shapira JS, et al. Variations in regional SPECT hypoperfusion and clinical features in frontotemporal dementia. Neurology. 2006;66(4):517-522.
8. Miller BL, Lee SE. Frontotemporal dementia: treatment. Up To Date. http://www.uptodate.com/contents/frontotemporal-dementia-treatment?source=search_result&search=frontote mporal+dementia+treatment&selectedTitle=1~150. Updated December 30, 2013. Accessed April 24, 2014.