User login
Inpatients With Poor Vision
Vision impairment is an under‐recognized risk factor for adverse events among hospitalized patients.[1, 2, 3] Inpatients with poor vision are at increased risk for falls and delirium[1, 3] and have more difficulty taking medications.[4, 5] They may also be at risk for being unable to read critical health information, including consent forms and discharge instructions, or decreased quality of life such as simply ordering food from menus. However, vision is neither routinely tested nor documented for inpatients. Low‐cost ($8 and up) nonprescription reading glasses, known as readers may be a simple, high‐value intervention to improve inpatients' vision. We aimed to study initial feasibility and efficacy of screening and correcting inpatients' vision.
METHODS
From June 2012 through January 2014, research assistants (RAs) identified eligible (adults [18 years], English speaking) participants daily from electronic medical records as part of an ongoing study of general medicine inpatients measuring quality‐of‐care at the University of Chicago Medicine.[6] RAs tested visual acuity using Snellen pocket charts (participants wore corrective lenses if available). For eligible participants, readers were tested with sequential fitting (+2/+2.25/+2.75/+3.25) until vision was corrected (sufficient vision: at least 20/50 acuity in at least 1 eye).[7] Eligible participants included those with insufficient vision who were not already wearing corrective lenses and had no documented blindness or medically severe vision loss, for whom nonprescription readers would be unlikely to correct vision deficiencies such as cataracts or glaucoma. The study was approved by the University of Chicago Institutional Review Board (IRB #9967).
Of note, although readers are typically used in populations over 40 years of age, readers were fitted for all participants to assess their utility for any hospitalized adult patient. Upon completing the vision screening and readers interventions, participants received instruction on how to access vision care and how to obtain readers (if they corrected vision) after hospital discharge.
Descriptive statistics and tests of comparison, including t tests and [2] tests, were used when appropriate. All analyses were performed using Stata version 12 (StataCorp, College Station, TX).
RESULTS
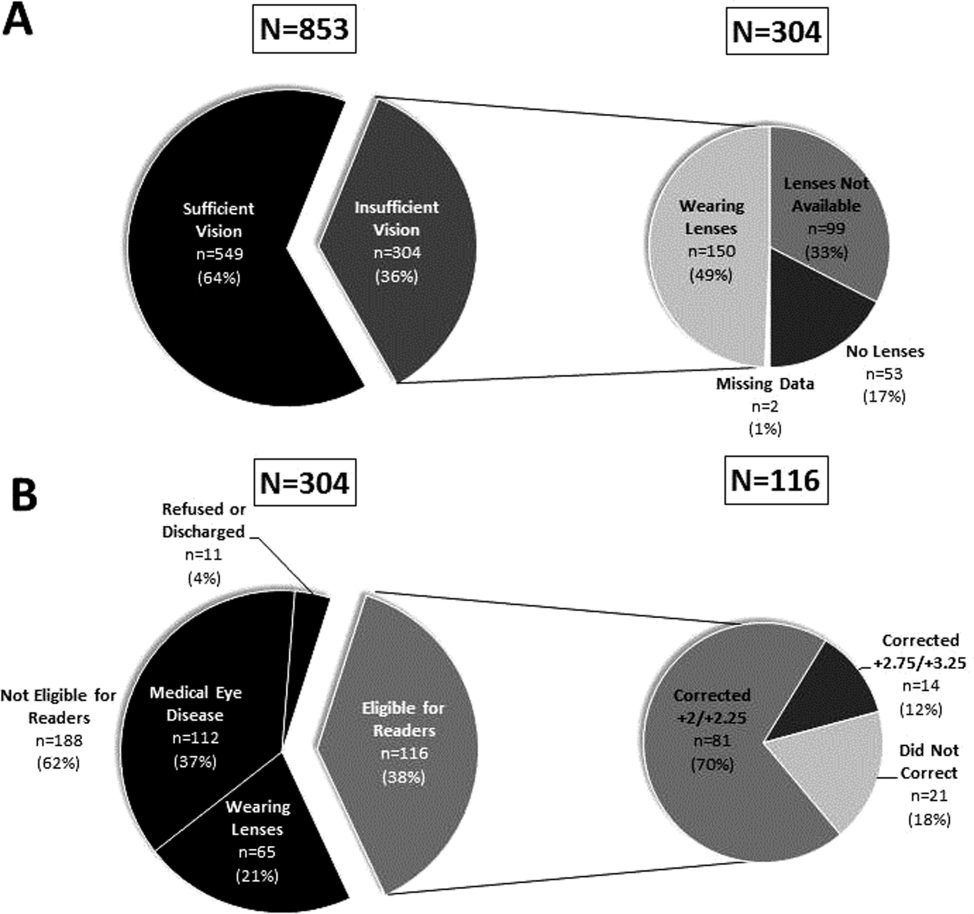
Over 800 participants' vision was screened (n=853); the majority were female (56%, 480/853), African American (76%, 650/853), with a mean age of 53.4 years (standard deviation 18.7), consistent with our study site's demographics. Over one‐third (36%, 304/853) of participants had insufficient vision. Older (65 years) participants (56%, 136/244) were more likely to have insufficient vision than younger participants (28%, 168/608; P0.001).
Participants with insufficient vision were wearing their own corrective lenses during the testing (150/304, 49%), did not use corrective lenses (53/304, 17%), or were without available corrective lenses (99/304, 33%) (Figure 1A).

One‐hundred sixteen of 304 participants approached for the readers intervention were eligible (112 reported medical eye disease, 65 were wearing lenses, and 11 refused or were discharged before intervention implementation).
Nonprescription readers corrected the majority of eligible participants' vision (82%, 95/116). Most participants' (81/116, 70%) vision was corrected using the 2 lowest calibration readers (+2/+2.25); another 14 participants' (12%) vision was corrected with higher‐strength lenses (+2.75/+3.25) (Figure 1B)
DISCUSSION
We found that over one‐third of the inpatients we examined have poor vision. Furthermore, among an easily identified subgroup of inpatients with poor vision, low‐cost readers successfully corrected most participants' vision. Although preventive health is not commonly considered an inpatient issue, hospitalists and other clinicians working in the inpatient setting can play an important role in identifying opportunities to provide high‐value care related to patients' vision.
Several important ethical, safety, and cost considerations related to these findings exist. Hospitalized patients commonly sign written informed consent; therefore, due diligence to ensure patients' ability to read and understand the forms is imperative. Further, inpatient delirium is common, particularly among older patients.[8] Existing or new onset delirium occurs in up to 24% to 35% of elderly inpatients.[8] Vision is an important risk factor for multifactorial inpatient delirium, and early vision correction has been shown to improve delirium rates, as part of a multicomponent intervention.[9] Hospital‐related patient costs per delirium episode have been estimated at $16,303 to $64,421.[10] The cost of a multicomponent intervention was $6341 per case of delirium prevented,[9] whereas only 1 potentially critical component, the cost of readers ($8+), would pale in comparison.[1] Vision screening takes approximately 2.25 minutes plus 2 to 6 minutes for the readers' assessment, with little training and high fidelity. Therefore, this easily implemented, potentially cost saving, intervention targeting inpatients with poor vision may improve patient safety and quality of life in the hospital and even after discharge.
Limitations of the study include considerations of generalizability, as participants were from a single, urban, academic medical center. Additionally, long‐term benefits of the readers intervention were not assessed in this study. Finally, RAs provided the assessments; therefore, further work is required to determine costs of efficient large‐scale clinical implementation through nurse‐led programs.
Despite these study limitations, the surprisingly high prevalence of poor vision among inpatients is a call to action for hospitalists. Future work should investigate the impact and cost of vision correction on hospital outcomes such as patient satisfaction, reduced rehospitalizations, and decreased delirium.[11]
Acknowledgements
The authors thank several individuals for their assistance with this project. Andrea Flores, MA, Senior Programmer, helped with programming and data support. Kristin Constantine, BA, Project Manager, helped with developing and implementing the database for this project. Edward Kim, BA, Project Manager, helped with management of the database and data collection. The authors also thank Ainoa Coltri and the Hospitalist Project research assistants for assistance with data collection, Frank Zadravecz, MPH, for assistance with the creation of figures, and Nicole Twu, MS, for assistance with the project. The authors thank other students who helped to collect data for this project, including Allison Louis, Victoria Moreira, and Esther Schoenfeld.
Disclosures: Dr. Press is supported by a career development award from the National Heart Lung and Blood Institute (NIH K23HL118151). A pilot award from The Center on the Demography and Economics of Aging (CoA, National Institute of Aging P30 AG012857) supported this project. Dr. Matthiesen and Ms. Ranadive received support from the Summer Research Program funded by the National Institutes on Aging Short‐Term Aging‐Related Research Program (T35AG029795). Dr. Matthiesen also received funding from the Calvin Fentress Fellowship Program. Dr. Hariprasad reports being a consultant or participating on a speaker's bureau for Alcon, Allergan, Regeneron, Genentech, Optos, OD‐OS, Bayer, Clearside Biomedical, and Ocular Therapeutix. Dr. Meltzer received funding from the National Institutes on Aging Short‐Term Aging‐Related Research Program (T35AG029795), and from the Agency for Healthcare Quality and Research through the Hospital Medicine and Economics Center for Education and Research in Therapeutics (U18 HS016967‐01), and from the National Institute of Aging through a Midcareer Career Development Award (K24 AG031326‐01), from the National Cancer Institute (KM1 CA156717), and from the National Center for Advancing Translational Science (2UL1TR000430‐06). Dr. Arora received funding from the National Institutes on Aging Short‐Term Aging‐Related Research Program (T35AG029795) and National Institutes on Aging (K23AG033763).
- , , , . Risk factors and risk assessment tools for falls in hospital in‐patients: a systematic review. Age Ageing. 2004;33(2):122–130.
- , , , , . More than meets the eye: relationship between low health literacy and poor vision in hospitalized patients. J Health Commun. 2013;18(suppl 1):197–204.
- , , , , , . Risk factors for delirium at discharge: development and validation of a predictive model. Arch Intern Med. 2007;167(13):1406–1413.
- , , , et al. Misuse of respiratory inhalers in hospitalized patients with asthma or COPD. J Gen Intern Med. 2011;26(6):635–642.
- , , . Can elderly people take their medicine? Patient Educ Couns. 2005;59(2):186–191.
- , , , et al. Effects of physician experience on costs and outcomes on an academic general medicine service: results of a trial of hospitalists. Ann Intern Med. 2002;137(11):866–874.
- . Prospective evaluation of visual acuity assessment: a comparison of Snellen versus ETDRS charts in clinical practice (An AOS Thesis). Trans Am Ophthalmol Soc. 2009;107:311–324.
- , , , et al. Delirium. The occurrence and persistence of symptoms among elderly hospitalized patients. Arch Intern Med. 1992;152(2):334–340.
- , , , et al. A multicomponent intervention to prevent delirium in hospitalized older patients. N Engl J Med. 1999;340(9):669–676.
- , , , , . One‐year health care costs associated with delirium in the elderly population. Arch Intern Med. 2008;168(1):27–32.
- , , , et al. A low‐vision rehabilitation program for patients with mild cognitive deficits. JAMA Ophthalmol. 2013;131(7):912–919.
Vision impairment is an under‐recognized risk factor for adverse events among hospitalized patients.[1, 2, 3] Inpatients with poor vision are at increased risk for falls and delirium[1, 3] and have more difficulty taking medications.[4, 5] They may also be at risk for being unable to read critical health information, including consent forms and discharge instructions, or decreased quality of life such as simply ordering food from menus. However, vision is neither routinely tested nor documented for inpatients. Low‐cost ($8 and up) nonprescription reading glasses, known as readers may be a simple, high‐value intervention to improve inpatients' vision. We aimed to study initial feasibility and efficacy of screening and correcting inpatients' vision.
METHODS
From June 2012 through January 2014, research assistants (RAs) identified eligible (adults [18 years], English speaking) participants daily from electronic medical records as part of an ongoing study of general medicine inpatients measuring quality‐of‐care at the University of Chicago Medicine.[6] RAs tested visual acuity using Snellen pocket charts (participants wore corrective lenses if available). For eligible participants, readers were tested with sequential fitting (+2/+2.25/+2.75/+3.25) until vision was corrected (sufficient vision: at least 20/50 acuity in at least 1 eye).[7] Eligible participants included those with insufficient vision who were not already wearing corrective lenses and had no documented blindness or medically severe vision loss, for whom nonprescription readers would be unlikely to correct vision deficiencies such as cataracts or glaucoma. The study was approved by the University of Chicago Institutional Review Board (IRB #9967).
Of note, although readers are typically used in populations over 40 years of age, readers were fitted for all participants to assess their utility for any hospitalized adult patient. Upon completing the vision screening and readers interventions, participants received instruction on how to access vision care and how to obtain readers (if they corrected vision) after hospital discharge.
Descriptive statistics and tests of comparison, including t tests and [2] tests, were used when appropriate. All analyses were performed using Stata version 12 (StataCorp, College Station, TX).
RESULTS
Over 800 participants' vision was screened (n=853); the majority were female (56%, 480/853), African American (76%, 650/853), with a mean age of 53.4 years (standard deviation 18.7), consistent with our study site's demographics. Over one‐third (36%, 304/853) of participants had insufficient vision. Older (65 years) participants (56%, 136/244) were more likely to have insufficient vision than younger participants (28%, 168/608; P0.001).
Participants with insufficient vision were wearing their own corrective lenses during the testing (150/304, 49%), did not use corrective lenses (53/304, 17%), or were without available corrective lenses (99/304, 33%) (Figure 1A).
One‐hundred sixteen of 304 participants approached for the readers intervention were eligible (112 reported medical eye disease, 65 were wearing lenses, and 11 refused or were discharged before intervention implementation).
Nonprescription readers corrected the majority of eligible participants' vision (82%, 95/116). Most participants' (81/116, 70%) vision was corrected using the 2 lowest calibration readers (+2/+2.25); another 14 participants' (12%) vision was corrected with higher‐strength lenses (+2.75/+3.25) (Figure 1B)
DISCUSSION
We found that over one‐third of the inpatients we examined have poor vision. Furthermore, among an easily identified subgroup of inpatients with poor vision, low‐cost readers successfully corrected most participants' vision. Although preventive health is not commonly considered an inpatient issue, hospitalists and other clinicians working in the inpatient setting can play an important role in identifying opportunities to provide high‐value care related to patients' vision.
Several important ethical, safety, and cost considerations related to these findings exist. Hospitalized patients commonly sign written informed consent; therefore, due diligence to ensure patients' ability to read and understand the forms is imperative. Further, inpatient delirium is common, particularly among older patients.[8] Existing or new onset delirium occurs in up to 24% to 35% of elderly inpatients.[8] Vision is an important risk factor for multifactorial inpatient delirium, and early vision correction has been shown to improve delirium rates, as part of a multicomponent intervention.[9] Hospital‐related patient costs per delirium episode have been estimated at $16,303 to $64,421.[10] The cost of a multicomponent intervention was $6341 per case of delirium prevented,[9] whereas only 1 potentially critical component, the cost of readers ($8+), would pale in comparison.[1] Vision screening takes approximately 2.25 minutes plus 2 to 6 minutes for the readers' assessment, with little training and high fidelity. Therefore, this easily implemented, potentially cost saving, intervention targeting inpatients with poor vision may improve patient safety and quality of life in the hospital and even after discharge.
Limitations of the study include considerations of generalizability, as participants were from a single, urban, academic medical center. Additionally, long‐term benefits of the readers intervention were not assessed in this study. Finally, RAs provided the assessments; therefore, further work is required to determine costs of efficient large‐scale clinical implementation through nurse‐led programs.
Despite these study limitations, the surprisingly high prevalence of poor vision among inpatients is a call to action for hospitalists. Future work should investigate the impact and cost of vision correction on hospital outcomes such as patient satisfaction, reduced rehospitalizations, and decreased delirium.[11]
Acknowledgements
The authors thank several individuals for their assistance with this project. Andrea Flores, MA, Senior Programmer, helped with programming and data support. Kristin Constantine, BA, Project Manager, helped with developing and implementing the database for this project. Edward Kim, BA, Project Manager, helped with management of the database and data collection. The authors also thank Ainoa Coltri and the Hospitalist Project research assistants for assistance with data collection, Frank Zadravecz, MPH, for assistance with the creation of figures, and Nicole Twu, MS, for assistance with the project. The authors thank other students who helped to collect data for this project, including Allison Louis, Victoria Moreira, and Esther Schoenfeld.
Disclosures: Dr. Press is supported by a career development award from the National Heart Lung and Blood Institute (NIH K23HL118151). A pilot award from The Center on the Demography and Economics of Aging (CoA, National Institute of Aging P30 AG012857) supported this project. Dr. Matthiesen and Ms. Ranadive received support from the Summer Research Program funded by the National Institutes on Aging Short‐Term Aging‐Related Research Program (T35AG029795). Dr. Matthiesen also received funding from the Calvin Fentress Fellowship Program. Dr. Hariprasad reports being a consultant or participating on a speaker's bureau for Alcon, Allergan, Regeneron, Genentech, Optos, OD‐OS, Bayer, Clearside Biomedical, and Ocular Therapeutix. Dr. Meltzer received funding from the National Institutes on Aging Short‐Term Aging‐Related Research Program (T35AG029795), and from the Agency for Healthcare Quality and Research through the Hospital Medicine and Economics Center for Education and Research in Therapeutics (U18 HS016967‐01), and from the National Institute of Aging through a Midcareer Career Development Award (K24 AG031326‐01), from the National Cancer Institute (KM1 CA156717), and from the National Center for Advancing Translational Science (2UL1TR000430‐06). Dr. Arora received funding from the National Institutes on Aging Short‐Term Aging‐Related Research Program (T35AG029795) and National Institutes on Aging (K23AG033763).
- , , , . Risk factors and risk assessment tools for falls in hospital in‐patients: a systematic review. Age Ageing. 2004;33(2):122–130.
- , , , , . More than meets the eye: relationship between low health literacy and poor vision in hospitalized patients. J Health Commun. 2013;18(suppl 1):197–204.
- , , , , , . Risk factors for delirium at discharge: development and validation of a predictive model. Arch Intern Med. 2007;167(13):1406–1413.
- , , , et al. Misuse of respiratory inhalers in hospitalized patients with asthma or COPD. J Gen Intern Med. 2011;26(6):635–642.
- , , . Can elderly people take their medicine? Patient Educ Couns. 2005;59(2):186–191.
- , , , et al. Effects of physician experience on costs and outcomes on an academic general medicine service: results of a trial of hospitalists. Ann Intern Med. 2002;137(11):866–874.
- . Prospective evaluation of visual acuity assessment: a comparison of Snellen versus ETDRS charts in clinical practice (An AOS Thesis). Trans Am Ophthalmol Soc. 2009;107:311–324.
- , , , et al. Delirium. The occurrence and persistence of symptoms among elderly hospitalized patients. Arch Intern Med. 1992;152(2):334–340.
- , , , et al. A multicomponent intervention to prevent delirium in hospitalized older patients. N Engl J Med. 1999;340(9):669–676.
- , , , , . One‐year health care costs associated with delirium in the elderly population. Arch Intern Med. 2008;168(1):27–32.
- , , , et al. A low‐vision rehabilitation program for patients with mild cognitive deficits. JAMA Ophthalmol. 2013;131(7):912–919.
NICE recommends apixaban for VTE

Image by Andre E.X. Brown
The UK’s National Institute for Health and Care Excellence (NICE) has issued a draft guidance recommending the anticoagulant apixaban (Eliquis) as an option for treating and preventing venous thromboembolism (VTE) in adults.
A NICE committee concluded that apixaban is clinically and cost-effective for this indication.
The draft guidance is now with consultees, who can appeal against it. Once NICE issues its final guidance on a technology, it replaces local recommendations.
“Apixaban, like the other newer oral anticoagulants already recommended by NICE for the treatment and secondary prevention of VTE, does not require frequent blood tests to monitor treatment and so represents a potential benefit for many people who have had a VTE,” said Carole Longson, NICE Health Technology Evaluation Centre Director.
“The committee also heard that apixaban is the only oral anticoagulant for which the licensed dose is lower for secondary prevention than for initial treatment of VTE. This could also be of potential benefit in terms of reducing the risk of bleeding where treatment is continued and therefore increase the chance that a person would take apixaban long-term.”
Clinical effectiveness
The NICE committee assessed the clinical effectiveness of apixaban based on results of the AMPLIFY and AMPLIFY-EXT studies.
Results of the AMPLIFY study indicated that apixaban is noninferior to standard treatment for recurrent VTE—initial parenteral enoxaparin overlapped with warfarin. Apixaban was comparable in efficacy to standard therapy and induced significantly less bleeding.
In AMPLIFY-EXT, researchers compared 12 months of treatment with apixaban at 2 doses—2.5 mg and 5 mg—to placebo in patients who had previously received anticoagulant therapy for 6 to 12 months to treat a prior VTE.
Both doses of apixaban effectively prevented VTE, VTE-related events, and death. And the incidence of bleeding events was low in all treatment arms.
The NICE committee noted that there were limited data in these trials pertaining to patients who needed less than 6 months of treatment and for patients still at high risk of recurrent VTE after 6 months of treatment.
However, the committee concluded that, despite these limitations, the AMPLIFY trials were the pivotal trials that informed the marketing authorization for apixaban. As such, they were sufficient to inform a recommendation for the whole population covered by the marketing authorization.
The committee did point out that there were no head-to-head trials evaluating the relative effectiveness of apixaban compared with rivaroxaban and dabigatran etexilate for treating and preventing VTE.
In addition, there were insufficient data to assess the effectiveness and safety of apixaban in patients with active cancer who had VTE, so it was not possible to make a specific recommendation for this group.
Cost-effectiveness
The recommended dose of apixaban as VTE treatment is 10 mg twice a day for the first 7 days, followed by 5 mg twice a day for at least 3 months. To prevent recurrent VTE, patients who have completed 6 months of VTE treatment should take apixaban at 2.5 mg twice a day.
The cost of apixaban is £1.10 per tablet for either the 2.5 mg or 5 mg dose (excluding tax). The daily cost of apixaban is £2.20. (Costs may vary in different settings because of negotiated procurement discounts.)
Analyses suggested that the incremental cost-effectiveness ratio of apixaban was less than £20,000 per quality-adjusted life-year gained for either 6 months or life-long treatment. Therefore, NICE concluded that apixaban is a cost-effective use of National Health Service resources. ![]()
FDA approves new antifungal drug

The US Food and Drug Administration (FDA) has approved isavuconazonium sulfate (Cresemba) to treat adults with invasive aspergillosis and invasive mucormycosis, life-threatening fungal infections that predominantly occur in immunocompromised patients.
Isavuconazonium sulfate is an azole antifungal agent that works by targeting the cell wall of a fungus. The drug is available in oral and intravenous formulations.
“[The] approval provides a new treatment option for patients with serious fungal infections and underscores the importance of having available safe and effective antifungal drugs,” said Edward Cox, MD, director of the Office of Antimicrobial Products in the FDA’s Center for Drug Evaluation and Research.
Clinical trials
The FDA approved isavuconazonium sulfate to treat invasive aspergillosis based on results of the phase 3 SECURE trial. The study included 516 adults with invasive aspergillosis who were randomized to receive isavuconazonium sulfate or voriconazole.
Isavuconazonium sulfate demonstrated non-inferiority to voriconazole on the primary endpoint of all-cause mortality. All-cause mortality through day 42 was 18.6% in the isavuconazonium sulfate arm and 20.2% in the voriconazole arm.
In addition, isavuconazonium sulfate demonstrated similar rates of mortality and non-fatal adverse events as voriconazole
The FDA approved isavuconazonium sulfate to treat invasive mucormycosis based on results of the phase 3 VITAL trial. This single-arm study included 37 patients with invasive mucormycosis who received isavuconazonium sulfate.
All-cause mortality in these patients was 38%. The efficacy of isavuconazonium sulfate as a treatment for invasive mucormycosis has not been evaluated in concurrent, controlled clinical trials.
The most frequent adverse events for patients treated with isavuconazonium sulfate in clinical trials were nausea (26%), vomiting (25%), diarrhea (22%), headache (17%), elevated liver chemistry tests (17%), hypokalemia (14%), constipation (13%), dyspnea (12%), cough (12%), peripheral edema (11%), and back pain (10%).
QIDP status
Isavuconazonium sulfate is the sixth approved antifungal/antibacterial drug product designated as a qualified infectious disease product (QIDP). This designation is given to antibacterial or antifungal products that treat serious or life-threatening infections.
As part of its QIDP designation, isavuconazonium sulfate was given priority review. The QIDP designation also qualifies the drug for an additional 5 years of marketing exclusivity to be added to certain exclusivity periods already provided by the Food, Drug, and Cosmetic Act.
As invasive aspergillosis and mucormycosis are rare, the FDA also granted isavuconazonium sulfate orphan drug designations to treat these infections.
Isavuconazonium sulfate is marketed as Cresemba by Astellas Pharma US, Inc., which is based in Northbrook, Illinois. For more information on the drug, see the full prescribing information. ![]()
Moms can (almost) have it all
They say you can’t have it all, and they’re right. But you can have most of it. By that I mean you can achieve a work-life balance that will enable you to thrive in your career while you raise your dream family. While this goal may never be easy, and you may always feel like you want to do more, give more, and reach more, that’s just the nature of the beast. We are all overachievers. That’s how we’re programmed; it’s in our DNA. Why else would we have taken on so much debt and sacrificed so many years for a career? And while many of us specifically chose hospital medicine so we could offset our stressful, hectic work life with plenty of time off for self and family, our reality is still replete with everyday challenges and, frequently, burnout.
We eagerly seek out best practices to optimize patient care, but how often do we seek advice from trusted colleagues on their “best practices” for balancing work and home? While talking with some of my female colleagues recently, I expressed my dismay that my dishwasher had broken and I frequently found myself washing dinner dishes as I juggled homework for my two 6-year-olds and responded to a seemingly incessant pager. One laughed as she recalled the pains she went through to have not one, but two dishwashers installed in her kitchen during her remodel. Washing dishes by hand simply wasn’t realistic for her. Her two little boys demanded whatever physical and emotional energy she had left after a stressful day at the hospital.

It is okay to admit that you don’t have all the answers, and it is cathartic to accept that you may never be the homemaker your mother was and forget about matching your grandmothers’ skillsets. At some Alcoholics Anonymous meetings, new members stand up and introduce themselves by saying, “Hello, my name is ___, and I am an alcoholic.” I personally felt like a huge weight had been lifted from my shoulders when one day, I finally acknowledged I didn’t have all the answers and I could never follow all of the parenting experts’ advice. After all, experts come and go, and with it, their expert recommendations. I don’t even want to abide by the “no more than 30 minutes of screen time per day” mantra. My parents raised five children on rerun after rerun of “The Andy Griffith Show,” “The Brady Bunch,” and other sitcoms, not to mention movies and musicals, and every one of us has a terminal degree, and still remember how much fun we had as children. My parents set high expectations, and they taught us how to reach them, plain and simple. We worked hard and we got to play hard, too.
The bottom line is that different techniques work for different people. Find out which ones work for you and your family and pursue them, regardless of what others may think. And above all, don’t let guilt get the best of you, because it will eat away at you and potentially destroy all you want to accomplish. You know, the guilt of missing a soccer game or a school play, or even the guilt of stopping for fast food when you are just too tired to cook a nutritious meal. Give yourself a break. The realistic goal is to optimize your work-life balance; the elusive one is to perfect it.
Dr. Hester is a hospitalist at Baltimore-Washington Medical Center in Glen Burnie, Md. She is the creator of the Patient Whiz, a patient-engagement app for iOS. Reach her at [email protected].
They say you can’t have it all, and they’re right. But you can have most of it. By that I mean you can achieve a work-life balance that will enable you to thrive in your career while you raise your dream family. While this goal may never be easy, and you may always feel like you want to do more, give more, and reach more, that’s just the nature of the beast. We are all overachievers. That’s how we’re programmed; it’s in our DNA. Why else would we have taken on so much debt and sacrificed so many years for a career? And while many of us specifically chose hospital medicine so we could offset our stressful, hectic work life with plenty of time off for self and family, our reality is still replete with everyday challenges and, frequently, burnout.
We eagerly seek out best practices to optimize patient care, but how often do we seek advice from trusted colleagues on their “best practices” for balancing work and home? While talking with some of my female colleagues recently, I expressed my dismay that my dishwasher had broken and I frequently found myself washing dinner dishes as I juggled homework for my two 6-year-olds and responded to a seemingly incessant pager. One laughed as she recalled the pains she went through to have not one, but two dishwashers installed in her kitchen during her remodel. Washing dishes by hand simply wasn’t realistic for her. Her two little boys demanded whatever physical and emotional energy she had left after a stressful day at the hospital.
It is okay to admit that you don’t have all the answers, and it is cathartic to accept that you may never be the homemaker your mother was and forget about matching your grandmothers’ skillsets. At some Alcoholics Anonymous meetings, new members stand up and introduce themselves by saying, “Hello, my name is ___, and I am an alcoholic.” I personally felt like a huge weight had been lifted from my shoulders when one day, I finally acknowledged I didn’t have all the answers and I could never follow all of the parenting experts’ advice. After all, experts come and go, and with it, their expert recommendations. I don’t even want to abide by the “no more than 30 minutes of screen time per day” mantra. My parents raised five children on rerun after rerun of “The Andy Griffith Show,” “The Brady Bunch,” and other sitcoms, not to mention movies and musicals, and every one of us has a terminal degree, and still remember how much fun we had as children. My parents set high expectations, and they taught us how to reach them, plain and simple. We worked hard and we got to play hard, too.
The bottom line is that different techniques work for different people. Find out which ones work for you and your family and pursue them, regardless of what others may think. And above all, don’t let guilt get the best of you, because it will eat away at you and potentially destroy all you want to accomplish. You know, the guilt of missing a soccer game or a school play, or even the guilt of stopping for fast food when you are just too tired to cook a nutritious meal. Give yourself a break. The realistic goal is to optimize your work-life balance; the elusive one is to perfect it.
Dr. Hester is a hospitalist at Baltimore-Washington Medical Center in Glen Burnie, Md. She is the creator of the Patient Whiz, a patient-engagement app for iOS. Reach her at [email protected].

Plasmapheresis in Refractory Pemphigus Vulgaris: Revisiting an Old Treatment Modality Used in Synchrony With Pulse Cyclophosphamide
To the Editor:
Pemphigus vulgaris is an uncommon autoimmune blistering dermatosis characterized by painful mucocutaneous erosions. It can be a life-threatening condition if left untreated. The autoimmune process is mediated by autoantibodies against the keratinocyte surface antigens desmoglein 1 and 3.1 Therapy is directed at lowering autoantibody levels with systemic corticosteroids and immunosuppressive agents. Use of these agents often is limited by collateral adverse effects.2 Refractory disease may occur despite the use of high-dose corticosteroids or a combination of other immunosuppressants. The level of these pathogenic autoantibodies generally parallels the extent of disease activity, and removing them with plasmapheresis followed by immunosuppression should result in therapeutic response.3 We report a case of refractory pemphigus vulgaris that was controlled with plasmapheresis used in synchrony with pulse cyclophosphamide.
A 48-year-old Chinese man first presented with mucocutaneous erosions 2 years ago, and a diagnosis of pemphigus vulgaris was confirmed based on typical histologic and immunofluorescence features. Histologic features included suprabasal acantholysis with an intraepidermal blister as well as basal keratinocytes attached to the dermal papillae and present along the entire dermoepidermal junction (Figure 1). Direct immunofluorescence demonstrated intercellular deposits of IgG and complements in the lower epidermis, and indirect immunofluorescence showed the presence of the pathogenic pemphigus autoantibodies. The patient was initially treated with prednisolone (up to 1 mg/kg daily) and mycophenolate mofetil (1 g twice daily) for 6 months with moderate disease response. Two months later he experienced a disease flare that was triggered by sun exposure and concomitant herpes simplex virus infection. He achieved moderate disease control with acyclovir, 3 days of intravenous immunoglobulin, and combination prednisolone and azathioprine. There was no other relevant medical history. For the last year, the patient received continuous prednisolone (varying doses 0.5–1 mg/kg daily), concomitant azathioprine (up to 3 mg/kg daily), and long-term prophylactic acyclovir, but he continued to have residual crusted erosions over the scalp and face (best score of 25 points based on the autoimmune bullous skin disorder intensity score [ABSIS] ranging from 0–150 points4). He was admitted at the current presentation with another, more severe disease flare with extensive painful erosions over the trunk, arms, legs, face, and scalp (80% body surface area involvement and ABSIS score of 120 points)(Figure 2)4 that occurred after azathioprine was temporarily ceased for 1 week due to transaminitis, and despite a temporary increment in prednisolone dose. There was, however, no significant oral mucosal involvement. The desmoglein 1 and 3 antibody levels were elevated at more than 300 U/mL and 186 U/mL, respectively (>20 U/mL indicates positivity). A 3-day course of pulse intravenous methylprednisolone (10 mg/kg) failed to achieve clinical improvement or reduction of antibody titers. The use of various immunosuppressive agents was limited by persistent transaminitis and transient leukopenia.
|


Because of remarkable morbidity, the patient underwent interim plasmapheresis for rapid disease control. Plasmapheresis was carried out through a pheresible central venous catheter. One plasma volume exchange was done each session, which was 5 L for the patient’s body weight and hematocrit. Equal volume of colloid comprising 2.5 L of fresh frozen plasma and 2.5 L of 5% albumin was used for replacement. Plasma exchange was performed with a cell separator by discontinuous flow centrifugation with 4% acid citrate dextrose as an anticoagulant. For each session of plasmapheresis, 16 cycles of exchange (each processing approximately 300 mL of blood) was carried out, the entire process lasting for 4 hours. The coagulation and biochemical profile was checked after each session of plasmapheresis and corrected when necessary. The patient underwent 9 sessions of plasmapheresis over a 3-week period, synchronized with pulse intravenous cyclophosphamide (15 mg/kg) immediately after completion of the plasmapheresis sessions, resulting in a remarkable decrease in pathogenic antibody titers to near undetectable levels and clinical improvement (Figure 3). The extensive erosions gradually healed with good reepithelialization, and there was a notable reduction in the ABSIS score to 12 points. He received 3 more monthly treatments with pulse intravenous cyclophosphamide (15 mg/kg) and is currently maintained on oral cyclophosphamide (2 mg/kg daily) and low-dose prednisolone (0.3 mg/kg daily). There was no subsequent disease relapse at 6-month follow-up, with the ABSIS score maintained at 5 points, and no increase in pathogenic autoantibody titers. The patient subsequently was lost to follow-up.
Patients with severe disease or refractory cases of pemphigus vulgaris that have been maintained on unacceptably high doses of corticosteroids or immunosuppressants that cannot be tapered without a disease flare may develop remarkable adverse effects, both from medications and from long-term immunosuppression.2 Our case illustrates the short-term benefit of plasmapheresis combined with immunosuppressants resulting in rapid disease control.
Plasmapheresis involves the selective removal of pathogenic materials from the circulation to achieve therapeutic effect, followed by appropriate replacement fluids. Treating pemphigus vulgaris with plasmapheresis was introduced in 1978 based on the rationale of removing pathogenic autoantibodies from the circulation.3,5 Using desmoglein enzyme-linked immunosorbent assay, it has been shown that one centrifugal plasmapheresis procedure eliminates approximately 15% of the IgG autoantibodies from the whole body.6 An average of 5 plasmapheresis sessions on alternate days usually is required to deplete the levels of pathogenic autoantibodies to near undetectable levels.7 Our case required 9 plasmapheresis sessions over 3 weeks to achieve good therapeutic response.
It seems that using plasmapheresis to treat pemphigus vulgaris has fallen out of favor due to its inability to prevent the antibody rebound occurring during weeks 1 and 2 posttreatment. Because of a feedback mechanism, a massive antibody depletion by plasmapheresis triggers a rebound synthesis of more autoantibodies by pathogenic B cells to titers comparable to or higher than those before plasmapheresis.8 The use of plasmapheresis should be supported by immunosuppressive therapy to prevent antibody feedback rebound. Due to the advent of available immunosuppressive agents in recent years, there is a resurgence in the successful use of this old treatment modality combined with immunosuppressive therapy in managing refractory pemphigus vulgaris.7,8 At present there is no clear data to support the use of one immunosuppressant versus another, but our case supports the use of pulse intravenous cyclophosphamide, as documented in other reports.7,9 The success of immunosuppressive agents at reducing antibody levels depends on the timing (immediately after plasmapheresis) as well as individual responsiveness to the immunosuppressant.7
Our armamentarium of therapies for refractory pemphigus vulgaris continues to evolve. A more selective method of removing antibodies by extracorporeal immunoadsorption has the benefit of higher removal rates and reduced inadvertent loss of other plasma components.10 The combination of protein A immunoadsorption with rituximab, a monoclonal anti-CD20 antibody that induces B-cell depletion, also has been shown to induce rapid and durable remission in refractory cases.11
Our case shows that plasmapheresis can be a useful alternative or adjunctive intervention in pemphigus vulgaris that is not responding to conventional therapy or in cases when steroids or immunosuppressants are contraindicated. There is a definite role for such therapeutic plasma exchanges in the rapid control of potentially life-threatening disease. Its benefits are optimized when used in synchrony with immunosuppressants immediately following plasmapheresis to prevent rebound effect of antibody depletion.
1. Udey MC, Stanley JR. Pemphigus–disease of antidesmosomal autoimmunity. JAMA. 1999;282:572-576.
2. Huilgol SC, Black MM. Management of the immunobullous disorders. II. pemphigus. Clin Exp Dermatol. 1995;20:283-293.
3. Cotterill JA, Barker DJ, Millard LG. Plasma exchange in the treatment of pemphigus vulgaris. Br J Dermatol. 1978;98:243.
4. Pfutze M, Niedermeier A, Hertl M, et al. Introducing a novel Autoimmune Bullous Skin Disorder Intensity Score (ABSIS) in pemphigus [published online ahead of print February 27, 2007]. Eur J Dermatol. 2007;17:4-11.
5. Ruocco V, Rossi A, Argenziano G, et al. Pathogenicity of the intercellular antibodies of pemphigus their periodic removal from the circulation by plasmapheresis. Br J Dermatol. 1978;98:237-241.
6. Nagasaka T, Fujii Y, Ishida A, et al. Evaluating efficacy of plasmapheresis for patients with pemphigus using desmoglein enzyme-linked immunosorbent assay [published online ahead of print January 30, 2008]. Br J Dermatol. 2008;158:685-690.
7. Turner MS, Sutton D, Sauder DN. The use of plasmapheresis and immunosuppression in the treatment of pemphigus vulgaris. J Am Acad Dermatol. 2000;43:1058-1064.
8. Roujeau JC, Andre C, Joneau Fabre M, et al. Plasma exchange in pemphigus. uncontrolled study of ten patients. Arch Dermatol. 1983;119:215-221.
9. Euler HH, Löffler H, Christophers E. Synchronization of plasmapheresis and pulse cyclophosphamide therapy in pemphigus vulgaris. Arch Dermatol. 1987;123:1205-1210.
10. Lüftl M, Stauber A, Mainka A, et al. Successful removal of pathogenic autoantibodies in pemphigus by immunoadsorption with a tryptophan-linked polyvinylalcohol adsorber. Br J Dermatol. 2003;149:598-605.
11. Shimanovich I, Nitschke M, Rose C, et al. Treatment of severe pemphigus with protein A immunoadsorption, rituximab and intravenous immunoglobulins. Br J Dermatol. 2008;158:382-388.
To the Editor:
Pemphigus vulgaris is an uncommon autoimmune blistering dermatosis characterized by painful mucocutaneous erosions. It can be a life-threatening condition if left untreated. The autoimmune process is mediated by autoantibodies against the keratinocyte surface antigens desmoglein 1 and 3.1 Therapy is directed at lowering autoantibody levels with systemic corticosteroids and immunosuppressive agents. Use of these agents often is limited by collateral adverse effects.2 Refractory disease may occur despite the use of high-dose corticosteroids or a combination of other immunosuppressants. The level of these pathogenic autoantibodies generally parallels the extent of disease activity, and removing them with plasmapheresis followed by immunosuppression should result in therapeutic response.3 We report a case of refractory pemphigus vulgaris that was controlled with plasmapheresis used in synchrony with pulse cyclophosphamide.
A 48-year-old Chinese man first presented with mucocutaneous erosions 2 years ago, and a diagnosis of pemphigus vulgaris was confirmed based on typical histologic and immunofluorescence features. Histologic features included suprabasal acantholysis with an intraepidermal blister as well as basal keratinocytes attached to the dermal papillae and present along the entire dermoepidermal junction (Figure 1). Direct immunofluorescence demonstrated intercellular deposits of IgG and complements in the lower epidermis, and indirect immunofluorescence showed the presence of the pathogenic pemphigus autoantibodies. The patient was initially treated with prednisolone (up to 1 mg/kg daily) and mycophenolate mofetil (1 g twice daily) for 6 months with moderate disease response. Two months later he experienced a disease flare that was triggered by sun exposure and concomitant herpes simplex virus infection. He achieved moderate disease control with acyclovir, 3 days of intravenous immunoglobulin, and combination prednisolone and azathioprine. There was no other relevant medical history. For the last year, the patient received continuous prednisolone (varying doses 0.5–1 mg/kg daily), concomitant azathioprine (up to 3 mg/kg daily), and long-term prophylactic acyclovir, but he continued to have residual crusted erosions over the scalp and face (best score of 25 points based on the autoimmune bullous skin disorder intensity score [ABSIS] ranging from 0–150 points4). He was admitted at the current presentation with another, more severe disease flare with extensive painful erosions over the trunk, arms, legs, face, and scalp (80% body surface area involvement and ABSIS score of 120 points)(Figure 2)4 that occurred after azathioprine was temporarily ceased for 1 week due to transaminitis, and despite a temporary increment in prednisolone dose. There was, however, no significant oral mucosal involvement. The desmoglein 1 and 3 antibody levels were elevated at more than 300 U/mL and 186 U/mL, respectively (>20 U/mL indicates positivity). A 3-day course of pulse intravenous methylprednisolone (10 mg/kg) failed to achieve clinical improvement or reduction of antibody titers. The use of various immunosuppressive agents was limited by persistent transaminitis and transient leukopenia.
|
Because of remarkable morbidity, the patient underwent interim plasmapheresis for rapid disease control. Plasmapheresis was carried out through a pheresible central venous catheter. One plasma volume exchange was done each session, which was 5 L for the patient’s body weight and hematocrit. Equal volume of colloid comprising 2.5 L of fresh frozen plasma and 2.5 L of 5% albumin was used for replacement. Plasma exchange was performed with a cell separator by discontinuous flow centrifugation with 4% acid citrate dextrose as an anticoagulant. For each session of plasmapheresis, 16 cycles of exchange (each processing approximately 300 mL of blood) was carried out, the entire process lasting for 4 hours. The coagulation and biochemical profile was checked after each session of plasmapheresis and corrected when necessary. The patient underwent 9 sessions of plasmapheresis over a 3-week period, synchronized with pulse intravenous cyclophosphamide (15 mg/kg) immediately after completion of the plasmapheresis sessions, resulting in a remarkable decrease in pathogenic antibody titers to near undetectable levels and clinical improvement (Figure 3). The extensive erosions gradually healed with good reepithelialization, and there was a notable reduction in the ABSIS score to 12 points. He received 3 more monthly treatments with pulse intravenous cyclophosphamide (15 mg/kg) and is currently maintained on oral cyclophosphamide (2 mg/kg daily) and low-dose prednisolone (0.3 mg/kg daily). There was no subsequent disease relapse at 6-month follow-up, with the ABSIS score maintained at 5 points, and no increase in pathogenic autoantibody titers. The patient subsequently was lost to follow-up.
Patients with severe disease or refractory cases of pemphigus vulgaris that have been maintained on unacceptably high doses of corticosteroids or immunosuppressants that cannot be tapered without a disease flare may develop remarkable adverse effects, both from medications and from long-term immunosuppression.2 Our case illustrates the short-term benefit of plasmapheresis combined with immunosuppressants resulting in rapid disease control.
Plasmapheresis involves the selective removal of pathogenic materials from the circulation to achieve therapeutic effect, followed by appropriate replacement fluids. Treating pemphigus vulgaris with plasmapheresis was introduced in 1978 based on the rationale of removing pathogenic autoantibodies from the circulation.3,5 Using desmoglein enzyme-linked immunosorbent assay, it has been shown that one centrifugal plasmapheresis procedure eliminates approximately 15% of the IgG autoantibodies from the whole body.6 An average of 5 plasmapheresis sessions on alternate days usually is required to deplete the levels of pathogenic autoantibodies to near undetectable levels.7 Our case required 9 plasmapheresis sessions over 3 weeks to achieve good therapeutic response.
It seems that using plasmapheresis to treat pemphigus vulgaris has fallen out of favor due to its inability to prevent the antibody rebound occurring during weeks 1 and 2 posttreatment. Because of a feedback mechanism, a massive antibody depletion by plasmapheresis triggers a rebound synthesis of more autoantibodies by pathogenic B cells to titers comparable to or higher than those before plasmapheresis.8 The use of plasmapheresis should be supported by immunosuppressive therapy to prevent antibody feedback rebound. Due to the advent of available immunosuppressive agents in recent years, there is a resurgence in the successful use of this old treatment modality combined with immunosuppressive therapy in managing refractory pemphigus vulgaris.7,8 At present there is no clear data to support the use of one immunosuppressant versus another, but our case supports the use of pulse intravenous cyclophosphamide, as documented in other reports.7,9 The success of immunosuppressive agents at reducing antibody levels depends on the timing (immediately after plasmapheresis) as well as individual responsiveness to the immunosuppressant.7
Our armamentarium of therapies for refractory pemphigus vulgaris continues to evolve. A more selective method of removing antibodies by extracorporeal immunoadsorption has the benefit of higher removal rates and reduced inadvertent loss of other plasma components.10 The combination of protein A immunoadsorption with rituximab, a monoclonal anti-CD20 antibody that induces B-cell depletion, also has been shown to induce rapid and durable remission in refractory cases.11
Our case shows that plasmapheresis can be a useful alternative or adjunctive intervention in pemphigus vulgaris that is not responding to conventional therapy or in cases when steroids or immunosuppressants are contraindicated. There is a definite role for such therapeutic plasma exchanges in the rapid control of potentially life-threatening disease. Its benefits are optimized when used in synchrony with immunosuppressants immediately following plasmapheresis to prevent rebound effect of antibody depletion.
1. Udey MC, Stanley JR. Pemphigus–disease of antidesmosomal autoimmunity. JAMA. 1999;282:572-576.
2. Huilgol SC, Black MM. Management of the immunobullous disorders. II. pemphigus. Clin Exp Dermatol. 1995;20:283-293.
3. Cotterill JA, Barker DJ, Millard LG. Plasma exchange in the treatment of pemphigus vulgaris. Br J Dermatol. 1978;98:243.
4. Pfutze M, Niedermeier A, Hertl M, et al. Introducing a novel Autoimmune Bullous Skin Disorder Intensity Score (ABSIS) in pemphigus [published online ahead of print February 27, 2007]. Eur J Dermatol. 2007;17:4-11.
5. Ruocco V, Rossi A, Argenziano G, et al. Pathogenicity of the intercellular antibodies of pemphigus their periodic removal from the circulation by plasmapheresis. Br J Dermatol. 1978;98:237-241.
6. Nagasaka T, Fujii Y, Ishida A, et al. Evaluating efficacy of plasmapheresis for patients with pemphigus using desmoglein enzyme-linked immunosorbent assay [published online ahead of print January 30, 2008]. Br J Dermatol. 2008;158:685-690.
7. Turner MS, Sutton D, Sauder DN. The use of plasmapheresis and immunosuppression in the treatment of pemphigus vulgaris. J Am Acad Dermatol. 2000;43:1058-1064.
8. Roujeau JC, Andre C, Joneau Fabre M, et al. Plasma exchange in pemphigus. uncontrolled study of ten patients. Arch Dermatol. 1983;119:215-221.
9. Euler HH, Löffler H, Christophers E. Synchronization of plasmapheresis and pulse cyclophosphamide therapy in pemphigus vulgaris. Arch Dermatol. 1987;123:1205-1210.
10. Lüftl M, Stauber A, Mainka A, et al. Successful removal of pathogenic autoantibodies in pemphigus by immunoadsorption with a tryptophan-linked polyvinylalcohol adsorber. Br J Dermatol. 2003;149:598-605.
11. Shimanovich I, Nitschke M, Rose C, et al. Treatment of severe pemphigus with protein A immunoadsorption, rituximab and intravenous immunoglobulins. Br J Dermatol. 2008;158:382-388.

Vertebrobasilar disease, low distal flow triggers strokes
NASHVILLE, TENN. – In patients with symptomatic vertebrobasilar disease, low distal flow measured noninvasively predicted a patient’s subsequent risk for stroke in a multicenter, prospective study of 72 patients.
The finding “has implications for investigating interventional or aggressive medical treatments,” which should be aimed at this high-risk subgroup of patients, Dr. Sepideh Amin-Hanjani said at the International Stroke Conference, sponsored by the American Heart Association.
Patients with “the highest risk for recurrence have the best chance to benefit from intervention,” said Dr. Amin-Hanjani, professor of neurosurgery and codirector of neurovascular surgery at the University of Illinois at Chicago. For the time being, no interventions for vertebrobasilar disease have proven efficacy and safety, but the new finding provides a way to identify the highest risk patients who stand to gain the most from intervention and should serve as the target population for future trials.
The VERiTAS (Vertebrobasilar Flow Evaluation and Risk of Transient Ischemic Attack and Stroke) trial enrolled 72 adults at any of five U.S. centers or at one in Canada. Enrolled patients had a recent stroke or transient ischemic attack in their vertebrobasilar territory plus angiographic evidence of at least 50% stenosis in an extra- or intracranial vertebral or basilar artery. All patients underwent quantitative MR angioplasty of their large vertebrobasilar arteries using software, Noninvasive Optimal Vessel Analysis (NOVA), that measures volumetric flow rates through vessels. Eighteen patients (25%) had low distal flow, defined as a greater than 20% reduction in flow, compared with normal, and 54 patients (75%) who had normal flow.
The study’s primary endpoint was an incident ischemic stroke in the vertebrobasilar territory during 12 months of follow-up. During a median follow-up of 23 months, 10 patients had this type of new stroke.
Among the 18 low-flow patients, four (22%) had a primary endpoint after 12 months, and among the 54 normal-flow patients, 2 (4%) had a primary endpoint after 12 months, a statistically significant difference, Dr. Amin-Hanjani reported at the conference.
In a multivariate analysis, low-flow at baseline linked with a significant, ninefold increased risk for incident stroke, compared with normal-flow patients. The location of the blockage – in the basilar region, vertebral region, or both – had no apparent impact on outcome.
About 30% of ischemic strokes occur in the posterior circulation, and about a third of those are caused by vertebrobasilar disease secondary to atherosclerosis. Overall patients who have had strokes of this type face a 10%-15% rate of new stroke annually despite receiving standard medical treatment, Dr. Amin-Hanjani said.
Dr. Amin-Hanjanihas received research grants from GE Healthcare and VasSol, the company that markets the NOVA software used in VERiTAS. A coauthor on the report has a significant ownership interest in VasSol.
On Twitter @mitchelzoler
The main message from VERiTAS is that low blood flow distal to vertebrobasilar arterial stenosis matters. When a patient with a posterior-circulation stroke has an occlusion or high-grade stenosis causing poor distal flow they have an increased risk for recurrent stroke.

|
| Mitchel L. Zoler/Frontline Medical News Dr. Colin P. Derdeyn |
The VERiTAS results move the field forward by providing another brick in the wall of evidence that reduced perfusion in patients with occlusive cerebrovascular disease identifies a group of patients who are at high risk for a future stroke. I believe that this sort of disease is fairly common, but clinicians often do not actively look for it because no treatment for it has been proven effective. Recent trial results failed to show benefit from either angioplasty or stenting.
The next step will be a trial focused on with low-flow patients that treats them with more aggressive medical management or with an intervention to try to identify some treatment that produces incremental benefit in this target population.
Until we see positive results in such a trial, the practical implications of the VERiTAS results are unclear. VERiTAS provides a good indication of the natural history of vertebrobasilar disease when patients receive today’s standard treatment. Patients with low distal flow had about a 20% rate of new strokes during 12 months of follow-up; outcomes were much better among patients with normal distal flow.
Some clinicians will see the high risk among low-flow patients as justification for some sort of intervention even though nothing has been proven to work. Others will take a more conservative approach and treat these patients with standard medical treatment for atherosclerotic disease, or enroll them into an intervention trial. Arguably, there is no reason to even measure distal flow on a routine basis right now because there is no proven way to act on this information.
The method used in VERiTAS to noninvasively measure distal flow – quantitative MR angiography with the NOVA software – is probably not widely used today, but the VERiTAS results might change that. The study’s findings show that this type of imaging can produce clinically meaningful measurements; not many other imaging technologies can say that as of now.
Dr. Colin P. Derdeyn is professor of neurology and director of the Center for Stroke and Cerebrovascular Disease at Washington University in St. Louis. He was a coinvestigator on VERiTAS. He has received research support from MicroVention and has a modest ownership interest in Pulse Therapeutics. He made these comments in an interview.
The main message from VERiTAS is that low blood flow distal to vertebrobasilar arterial stenosis matters. When a patient with a posterior-circulation stroke has an occlusion or high-grade stenosis causing poor distal flow they have an increased risk for recurrent stroke.
|
|
| Mitchel L. Zoler/Frontline Medical News Dr. Colin P. Derdeyn |
The VERiTAS results move the field forward by providing another brick in the wall of evidence that reduced perfusion in patients with occlusive cerebrovascular disease identifies a group of patients who are at high risk for a future stroke. I believe that this sort of disease is fairly common, but clinicians often do not actively look for it because no treatment for it has been proven effective. Recent trial results failed to show benefit from either angioplasty or stenting.
The next step will be a trial focused on with low-flow patients that treats them with more aggressive medical management or with an intervention to try to identify some treatment that produces incremental benefit in this target population.
Until we see positive results in such a trial, the practical implications of the VERiTAS results are unclear. VERiTAS provides a good indication of the natural history of vertebrobasilar disease when patients receive today’s standard treatment. Patients with low distal flow had about a 20% rate of new strokes during 12 months of follow-up; outcomes were much better among patients with normal distal flow.
Some clinicians will see the high risk among low-flow patients as justification for some sort of intervention even though nothing has been proven to work. Others will take a more conservative approach and treat these patients with standard medical treatment for atherosclerotic disease, or enroll them into an intervention trial. Arguably, there is no reason to even measure distal flow on a routine basis right now because there is no proven way to act on this information.
The method used in VERiTAS to noninvasively measure distal flow – quantitative MR angiography with the NOVA software – is probably not widely used today, but the VERiTAS results might change that. The study’s findings show that this type of imaging can produce clinically meaningful measurements; not many other imaging technologies can say that as of now.
Dr. Colin P. Derdeyn is professor of neurology and director of the Center for Stroke and Cerebrovascular Disease at Washington University in St. Louis. He was a coinvestigator on VERiTAS. He has received research support from MicroVention and has a modest ownership interest in Pulse Therapeutics. He made these comments in an interview.
NASHVILLE, TENN. – In patients with symptomatic vertebrobasilar disease, low distal flow measured noninvasively predicted a patient’s subsequent risk for stroke in a multicenter, prospective study of 72 patients.
The finding “has implications for investigating interventional or aggressive medical treatments,” which should be aimed at this high-risk subgroup of patients, Dr. Sepideh Amin-Hanjani said at the International Stroke Conference, sponsored by the American Heart Association.
Patients with “the highest risk for recurrence have the best chance to benefit from intervention,” said Dr. Amin-Hanjani, professor of neurosurgery and codirector of neurovascular surgery at the University of Illinois at Chicago. For the time being, no interventions for vertebrobasilar disease have proven efficacy and safety, but the new finding provides a way to identify the highest risk patients who stand to gain the most from intervention and should serve as the target population for future trials.
The VERiTAS (Vertebrobasilar Flow Evaluation and Risk of Transient Ischemic Attack and Stroke) trial enrolled 72 adults at any of five U.S. centers or at one in Canada. Enrolled patients had a recent stroke or transient ischemic attack in their vertebrobasilar territory plus angiographic evidence of at least 50% stenosis in an extra- or intracranial vertebral or basilar artery. All patients underwent quantitative MR angioplasty of their large vertebrobasilar arteries using software, Noninvasive Optimal Vessel Analysis (NOVA), that measures volumetric flow rates through vessels. Eighteen patients (25%) had low distal flow, defined as a greater than 20% reduction in flow, compared with normal, and 54 patients (75%) who had normal flow.
The study’s primary endpoint was an incident ischemic stroke in the vertebrobasilar territory during 12 months of follow-up. During a median follow-up of 23 months, 10 patients had this type of new stroke.
Among the 18 low-flow patients, four (22%) had a primary endpoint after 12 months, and among the 54 normal-flow patients, 2 (4%) had a primary endpoint after 12 months, a statistically significant difference, Dr. Amin-Hanjani reported at the conference.
In a multivariate analysis, low-flow at baseline linked with a significant, ninefold increased risk for incident stroke, compared with normal-flow patients. The location of the blockage – in the basilar region, vertebral region, or both – had no apparent impact on outcome.
About 30% of ischemic strokes occur in the posterior circulation, and about a third of those are caused by vertebrobasilar disease secondary to atherosclerosis. Overall patients who have had strokes of this type face a 10%-15% rate of new stroke annually despite receiving standard medical treatment, Dr. Amin-Hanjani said.
Dr. Amin-Hanjanihas received research grants from GE Healthcare and VasSol, the company that markets the NOVA software used in VERiTAS. A coauthor on the report has a significant ownership interest in VasSol.
On Twitter @mitchelzoler
AT THE INTERNATIONAL STROKE CONFERENCE
Key clinical point: Following posterior-circulation ischemic stroke, patients with vertebrobasilar disease and low distal blood flow had significantly more subsequent strokes, compared with normal-flow patients.
Major finding: Low distal flow patients had ninefold more strokes, compared with normal-flow patients during a 1-year follow-up period.
Data source: VERiTAS, a prospective, multicenter observational study of 72 patients with a prior stroke or transient ischemic attack in the vertebrobasilar territory.
Disclosures: Dr. Amin-Hanjani has received research grants from GE Healthcare and VasSol, the company that markets the NOVA software used in VERiTAS. A coauthor on the report has a significant ownership interest in VasSol.

Microbiome and innate immunity in the respiratory tract – a primer
The pathogenesis of respiratory infections such as acute otitis media (AOM), sinusitis, and pneumonia involves complex interactions among bacteria, respiratory viruses, and host immune responses.
My clinical and laboratory group and others have described respiratory infections as resulting from the growth of a single otopathogen, such as Streptococcus pneumoniae (Spn), nontypeable Haemophilus influenzae (NTHi), or Moraxella catarrhalis (Mcat) in the nasopharynx (NP) followed by ascension to the middle ear, sinuses, or descent to the lungs. Recent research from my group and others has resulted in a shift from a single pathogen focus toward consideration of respiratory infections as a polymicrobial disease. Bacterial and viral interactions are critical in respiratory infection pathogenesis. Commensal bacteria can alter virulence of bacterial pathogens and interfere with antibiotic treatment.
The traditional view of the immune system is that it is an assembly of human tissues, cells, and molecules that work to eliminate pathogens. Recent discoveries indicate that commensals play a central role in regulating human immune responses. Thus, the key questions in the field are:
1) How do members of the NP microbiome and innate immune responses maintain health in young children over time?
2) Do specific deleterious members of the NP microbiome alter host innate immune responses in a manner that predisposes to respiratory infections?
3) How does the microbiome and innate response in the NP differ when recovery, relapse of infection, or persistent infection occurs?
Virtually all young children are colonized by Spn, NTHi, or Mcat during the first 3 years of life. My group and others have shown that competitive interactions among bacteria influence whether these potential pathogens successfully colonize and cause respiratory infections. Recent studies have demonstrated that hundreds of different bacterial species colonize the upper respiratory tract. Diverse communities have been shown to be more stable and resistant to invasion by foreign species. Data from cross-sectional studies demonstrate that specific commensals, including Dolosigranulum, Corynebacterium, and Lactococcus, are associated with decreased risk of respiratory infections. Prior studies have been limited by the use of culture-based methods or have been cross sectional in design. Therefore, the optimal levels of diversity and NP commensals critical for maintaining health in the upper respiratory tract of children are currently unknown and under study by my group and others. Studies that utilize high-throughput culture-independent molecular detection methods are now used to identify optimal levels of diversity and commensal members of the microbiome critical for maintaining health homeostasis.
The innate immune system constitutes the first line of defense against respiratory pathogen colonization and respiratory virus infection. It relies on pattern recognition receptors on innate immune cells to detect evolutionarily conserved pathogen-associated molecular patterns expressed on pathogen surfaces. Toll-like receptors (TLRs) are crucial in the innate immune response; TLR 3, 7, and 8 recognize respiratory infection-associated viral pathogens. TLR2, 4, and 5 recognize respiratory infection-associated bacterial pathogens, and TLR9 and TLR13 recognize both viral and bacterial pathogens. The activation of TLRs triggers signaling cascades and regulates the expression of a wide range of cytokines leading to antimicrobial and inflammatory responses. Cytokines (there are dozens) associated with the pathogenesis, development, severity, and clinical outcomes of respiratory infections identify hypotheses that our group is exploring to expand our understanding of how innate responses might be manipulated to favor the child host. Importantly, it has already been shown that cytokine profiles differ in the NP depending on the number and type of bacteria and viruses involved.
My group recently has shown that serum IL-10 levels are significantly higher in AOM from Spn than are the levels associated with NTHi and Mcat, suggesting use of detection of this cytokine as a serum biomarker. Others have shown that the levels of IL-1-beta, TNF-alpha, IL-6, IL-8, IL-10, and IL-17a in middle ear fluids from children with recurrent AOM correlate significantly with higher bacterial load (and worse disease). Previous studies on cytokine responses associated with AOM have focused on limited numbers of cytokines and have not examined any relationship with commensals of the NP microbiome. Moreover, the subset of children who experience excessively frequent respiratory infections likely have disturbances in their microbiome (made worse with antibiotics) and innate immune response. Because of our growing knowledge about the microbiome and innate immune response, I see a compelling need to assess interactions of the NP microbiome and innate immune responses in children that are associated with sustained health and control of respiratory infections.
Dr. Pichichero, a specialist in pediatric infectious diseases, is director of the Research Institute, Rochester (N.Y.) General Hospital. He is also a pediatrician at Legacy Pediatrics in Rochester. Dr. Pichichero said the work was supported by a National Institutes of Health grant, and he had no relevant conflicts of interest. E-mail him at [email protected].
My test-ordering evolution as a rheumatologist
Perhaps one of the biggest ways in which I’ve evolved as a doctor over the 4.5 years I’ve been in private practice is that I am not so shy about ordering tests anymore.
My point is illustrated by the case of a lovely lady I met when I was starting out in practice who complained of being in pain all the time. She was referred to me for a very low titer antinuclear antibody and a barely positive rheumatoid factor. She’d had a very long history of severe depression and anxiety. She clearly connected her symptoms to having stopped her antidepressants. She attributed her dry mouth to her benzodiazepine. I told her that I thought she had fibromyalgia and that, as she herself pointed out, it was probably related to her emotional health. We talked about the lack of any real pharmacologic treatment for the illness. We addressed self-care: that she needed to sleep better, exercise more, and treat her depression.
Three years later she came back to me with hand swelling, hypergammaglobulinemia, renal tubular acidosis, this time with significantly higher ANA and RF titers, and hypocomplementemia. You guessed it; she has Sjögren’s syndrome.
Seeing patients 40 hours a week has been incredibly challenging but also incredibly rewarding. While the large number of cases that I’ve seen has sharpened my clinical eye, it has also broadened my differential diagnoses and improved my knowledge of when it will be helpful to order more tests.
It used to be that I was extremely conservative about ordering tests. This comes from having gone to med school in the Philippines, where each test was paid for by the patient out of pocket and GDP per capita is $2,765 (compared with $53,041 for the United States) and minimum wage is less than 2 dollars a day. Every CBC has to count. If a professor asked you why you were ordering a test, “to establish a baseline” was an unacceptable reason. When I started residency here, I was incredulous that the admitted patients got a CBC and chem-7 daily. This seemed like a huge and unjustifiable waste to me.
Today, I am not so uptight. Of course, I am still extremely thoughtful about ordering tests. I do not order tests without knowing what I am looking for, or how the result will affect management. But I also recognize that there is a non-zero probability that what I suspect is fibromyalgia is something else, something with a different prognosis, better or worse, something that needs to be managed and monitored differently.
After all, “clinical judgment” does not mean relying on the history and physical exam alone. Good clinical judgment requires medical knowledge, informed by experience, supplemented by test results, and complemented by an open, inquisitive mind.
Dr. Chan practices rheumatology in Pawtucket, R.I.

Common Presentation for Complex Condition
A month ago, a 33-year-old woman noticed skin changes on her arms and face. The affected areas have recently begun to itch and burn—particularly, the patient notes, since she spent an extended period in the sun over the weekend. She has used an antifungal cream (nystatin) on the rash, to no avail.
The patient denies joint pain, fever, and malaise. She has a sister with multiple sclerosis, but her family history is otherwise unremarkable. The patient’s only medication is oral contraceptives, which she has taken since the birth of her first and only child last year.

EXAMINATION
The patient is afebrile and in no particular distress. A florid red rash covers both cheeks, sparing the nose entirely. The margins are somewhat indurated and redder than the clearing centers. The follicular orifices are somewhat patulous, and a fine scale covers the affected areas of the face. The lateral brachial and triceps (sun-exposed) areas of both arms are similarly affected.
Punch biopsy reveals classic signs of lupus: vacuolar alteration of the basal cell layer, perivascular infiltrate around appendicial structures, and modest epidermal atrophy. Bloodwork yields no evidence of systemic lupus erythematosus (SLE).
What is the diagnosis?
DISCUSSION
Lupus, as a general topic, can be utterly confusing. Here are some facts that might help you make sense of the subject:
Purely cutaneous forms of lupus are commonly seen in dermatology; they manifest in sun-exposed skin as scaly annular lesions with clearing centers. Somewhat confusingly, however, cases of systemic lupus erythematosus (SLE) can present with similar cutaneous signs—and furthermore, patients with purely cutaneous lupus (subacute cutaneous lupus) may exhibit some systemic symptoms (just not enough to meet the strict criteria for SLE). Lupus in general is far more common in women than in men.
The “butterfly rash” seen in this case is uncommon but can occur in either cutaneous or systemic lupus. In most cases, though, this particular rash is a manifestation of seborrhea, psoriasis, rosacea or eczema—not lupus at all.
There are, of course, many other types of lupus. Another common form is discoid lupus (DLE), which manifests with round, scaly lesions on the head, neck, or ears; these are often misidentified as actinic keratosis, eczema, or psoriasis. DLE can be localized or generalized, purely cutaneous or a manifestation of SLE.
The key to diagnosis lies in first considering lupus in the differential and then biopsying the lesion (or sending the patient to someone who will). Once the clinical diagnosis is histologically confirmed (typical results include vacuolar interface dermatitis with sparse lymphocytic perivascular infiltrate), an immunologic workup is warranted. Also, depending on the predominant organ systems involved, the patient should be thoroughly evaluated by a dermatology or rheumatology specialist (or both).
Lupus is an autoimmune process, but in some ways it’s more useful to think of it as a form of vasculitis—which is why it can affect almost any organ system. The very first lupus patient I ever saw was in the psych ward having a psychotic break, which turned out to be secondary to a lupus-induced cerebritis. Since then, I’ve seen it affect the pericardium, kidneys, lungs, and joints. Lupus is even a major item in the differential of alopecia! SLE in particular is associated with an increase in thrombotic events and accounts for most early deaths from lupus (ie, within the first five years of diagnosis, when the cause of death is usually renal or pulmonary).
The patient in this case proved to have only cutaneous disease. She’ll respond nicely to a combination of sun protection and oral antimalarials (hydroxychloroquine) but will probably have recurrences every spring. Although unlikely to ever develop SLE, she is statistically more likely to develop other autoimmune diseases.
TAKE-HOME LEARNING POINTS
• Cutaneous lupus is more common than you might imagine. Lesions and eruptions in sun-exposed skin should prompt consideration of that item in the differential.
• Many forms of lupus have been identified, including neonatal lupus and overlapping syndromes involving lupus and lichen planus or even pemphigus.
• Though UV exposure is not always the cause, almost every type of lupus is worsened by UV light exposure.
• The differential for lupus is vast but includes psoriasis, sarcoidosis, dermatomyositis, and drug eruptions.
A month ago, a 33-year-old woman noticed skin changes on her arms and face. The affected areas have recently begun to itch and burn—particularly, the patient notes, since she spent an extended period in the sun over the weekend. She has used an antifungal cream (nystatin) on the rash, to no avail.
The patient denies joint pain, fever, and malaise. She has a sister with multiple sclerosis, but her family history is otherwise unremarkable. The patient’s only medication is oral contraceptives, which she has taken since the birth of her first and only child last year.
EXAMINATION
The patient is afebrile and in no particular distress. A florid red rash covers both cheeks, sparing the nose entirely. The margins are somewhat indurated and redder than the clearing centers. The follicular orifices are somewhat patulous, and a fine scale covers the affected areas of the face. The lateral brachial and triceps (sun-exposed) areas of both arms are similarly affected.
Punch biopsy reveals classic signs of lupus: vacuolar alteration of the basal cell layer, perivascular infiltrate around appendicial structures, and modest epidermal atrophy. Bloodwork yields no evidence of systemic lupus erythematosus (SLE).
What is the diagnosis?
DISCUSSION
Lupus, as a general topic, can be utterly confusing. Here are some facts that might help you make sense of the subject:
Purely cutaneous forms of lupus are commonly seen in dermatology; they manifest in sun-exposed skin as scaly annular lesions with clearing centers. Somewhat confusingly, however, cases of systemic lupus erythematosus (SLE) can present with similar cutaneous signs—and furthermore, patients with purely cutaneous lupus (subacute cutaneous lupus) may exhibit some systemic symptoms (just not enough to meet the strict criteria for SLE). Lupus in general is far more common in women than in men.
The “butterfly rash” seen in this case is uncommon but can occur in either cutaneous or systemic lupus. In most cases, though, this particular rash is a manifestation of seborrhea, psoriasis, rosacea or eczema—not lupus at all.
There are, of course, many other types of lupus. Another common form is discoid lupus (DLE), which manifests with round, scaly lesions on the head, neck, or ears; these are often misidentified as actinic keratosis, eczema, or psoriasis. DLE can be localized or generalized, purely cutaneous or a manifestation of SLE.
The key to diagnosis lies in first considering lupus in the differential and then biopsying the lesion (or sending the patient to someone who will). Once the clinical diagnosis is histologically confirmed (typical results include vacuolar interface dermatitis with sparse lymphocytic perivascular infiltrate), an immunologic workup is warranted. Also, depending on the predominant organ systems involved, the patient should be thoroughly evaluated by a dermatology or rheumatology specialist (or both).
Lupus is an autoimmune process, but in some ways it’s more useful to think of it as a form of vasculitis—which is why it can affect almost any organ system. The very first lupus patient I ever saw was in the psych ward having a psychotic break, which turned out to be secondary to a lupus-induced cerebritis. Since then, I’ve seen it affect the pericardium, kidneys, lungs, and joints. Lupus is even a major item in the differential of alopecia! SLE in particular is associated with an increase in thrombotic events and accounts for most early deaths from lupus (ie, within the first five years of diagnosis, when the cause of death is usually renal or pulmonary).
The patient in this case proved to have only cutaneous disease. She’ll respond nicely to a combination of sun protection and oral antimalarials (hydroxychloroquine) but will probably have recurrences every spring. Although unlikely to ever develop SLE, she is statistically more likely to develop other autoimmune diseases.
TAKE-HOME LEARNING POINTS
• Cutaneous lupus is more common than you might imagine. Lesions and eruptions in sun-exposed skin should prompt consideration of that item in the differential.
• Many forms of lupus have been identified, including neonatal lupus and overlapping syndromes involving lupus and lichen planus or even pemphigus.
• Though UV exposure is not always the cause, almost every type of lupus is worsened by UV light exposure.
• The differential for lupus is vast but includes psoriasis, sarcoidosis, dermatomyositis, and drug eruptions.
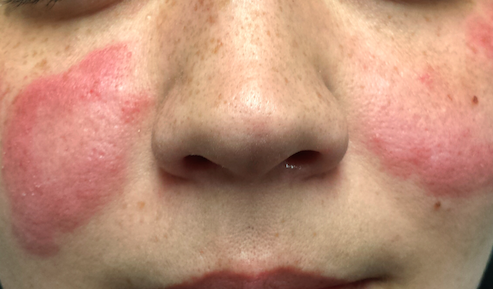
Thrombolysis gap for stroke octogenarians disappears
NASHVILLE, TENN. – By 2010, U.S. octogenarians with acute ischemic stroke received intravenous thrombolytic treatment about as often as younger patients, showing that a sharp, age-related disparity in thrombolytic use a decade before had disappeared, based on comprehensive national data.
The 2010 data from the Nationwide Inpatient Sample further showed that the sex-based disparity in treatment with intravenous tissue plasminogen activator (TPA) seen in 2000 resolved as well from 2000 to 2010, but other disparities worsened with declines during the period in use of TPA at rural hospitals relative to urban hospitals and at nonteaching hospitals, compared with teaching hospitals, Dr. Michelle P. Lin said at the International Stroke Conference.

Perhaps most importantly, the statistics showed a “dramatic” increase in TPA use among all age groups during the decade ending in 2010, when thrombolytic therapy was administered to 3.5%-3.9% of adult patients regardless of their age, said Dr. Lin of the department of neurology at the University of Southern California in Los Angeles. In 2000, U.S. patients received TPA at less than a third of that rate.
Low TPA use in 2000 among patients aged 80 or older in part reflected the low number of octogenarians enrolled in the trials that documented the safety and efficacy of TPA for acute ischemicstroke patients, Dr. Lin said at the International Stroke Conference, sponsored by the American Heart Association.
Data from the National Inpatient Sample included information on the treatment received by 5,932,175 patients with acute ischemic stroke at more than 1,000 U.S. hospitals during 2000-2010. The age breakdown of the nearly 6 millionpatients showed 28% were aged 18-64 years, 37% were65-79, and 35% were 80 years or older.
In 2000, medical staffs administered intravenous treatment with TPA to 1.02% of these patients aged 18-64 years, 0.92% of patients aged 65-79 years, and 0.47% of patients aged 80 or older. By 2010, the annual rates of TPA use ran 3.61% in those 18-64 years, 3.87% among those 65-79 years, and 3.55% in patients 80 years or older. In an adjusted analysis, this translated into a greater than threefold increase in TPA use among the 18- to 64-year-olds, a nearly fourfold rise in patients 65-79 years, and a nearly sevenfold jump among those 80 or older, a 24% average annual increased rate among the oldest patients, who averaged 86 years old, Dr. Lin reported.
The data also showed that among the octogenarians during 2000-2005, TPA use in women lagged behind use in men by a relative 15%, but this completely disappeared during 2006-2010, when usage rates in men and women evened out. TPA use among African Americans, Hispanics, and Asians, compared with whites, remained significantly below the rate in whites throughout the decade, although the extent of the disparity narrowed for African Americans and Asians during the second half of the decade, compared with the first half.
Dr. Lin and her associates also analyzed TPA use relative to the demographic setting of the hospital and its teaching status. During 2000-2010, the relative usage of TPA at rural hospitals, compared with urban hospitals, fell from 65% of the comparator level to 36%. Among nonteaching hospitals, the rate of TPA use dropped from 52% of the teaching hospitals’ level to 49%.
Dr. Lin said she had no relevant financial disclosures.
[email protected]
On Twitter @mitchelzoler
NASHVILLE, TENN. – By 2010, U.S. octogenarians with acute ischemic stroke received intravenous thrombolytic treatment about as often as younger patients, showing that a sharp, age-related disparity in thrombolytic use a decade before had disappeared, based on comprehensive national data.
The 2010 data from the Nationwide Inpatient Sample further showed that the sex-based disparity in treatment with intravenous tissue plasminogen activator (TPA) seen in 2000 resolved as well from 2000 to 2010, but other disparities worsened with declines during the period in use of TPA at rural hospitals relative to urban hospitals and at nonteaching hospitals, compared with teaching hospitals, Dr. Michelle P. Lin said at the International Stroke Conference.
Perhaps most importantly, the statistics showed a “dramatic” increase in TPA use among all age groups during the decade ending in 2010, when thrombolytic therapy was administered to 3.5%-3.9% of adult patients regardless of their age, said Dr. Lin of the department of neurology at the University of Southern California in Los Angeles. In 2000, U.S. patients received TPA at less than a third of that rate.
Low TPA use in 2000 among patients aged 80 or older in part reflected the low number of octogenarians enrolled in the trials that documented the safety and efficacy of TPA for acute ischemicstroke patients, Dr. Lin said at the International Stroke Conference, sponsored by the American Heart Association.
Data from the National Inpatient Sample included information on the treatment received by 5,932,175 patients with acute ischemic stroke at more than 1,000 U.S. hospitals during 2000-2010. The age breakdown of the nearly 6 millionpatients showed 28% were aged 18-64 years, 37% were65-79, and 35% were 80 years or older.
In 2000, medical staffs administered intravenous treatment with TPA to 1.02% of these patients aged 18-64 years, 0.92% of patients aged 65-79 years, and 0.47% of patients aged 80 or older. By 2010, the annual rates of TPA use ran 3.61% in those 18-64 years, 3.87% among those 65-79 years, and 3.55% in patients 80 years or older. In an adjusted analysis, this translated into a greater than threefold increase in TPA use among the 18- to 64-year-olds, a nearly fourfold rise in patients 65-79 years, and a nearly sevenfold jump among those 80 or older, a 24% average annual increased rate among the oldest patients, who averaged 86 years old, Dr. Lin reported.
The data also showed that among the octogenarians during 2000-2005, TPA use in women lagged behind use in men by a relative 15%, but this completely disappeared during 2006-2010, when usage rates in men and women evened out. TPA use among African Americans, Hispanics, and Asians, compared with whites, remained significantly below the rate in whites throughout the decade, although the extent of the disparity narrowed for African Americans and Asians during the second half of the decade, compared with the first half.
Dr. Lin and her associates also analyzed TPA use relative to the demographic setting of the hospital and its teaching status. During 2000-2010, the relative usage of TPA at rural hospitals, compared with urban hospitals, fell from 65% of the comparator level to 36%. Among nonteaching hospitals, the rate of TPA use dropped from 52% of the teaching hospitals’ level to 49%.
Dr. Lin said she had no relevant financial disclosures.
[email protected]
On Twitter @mitchelzoler
AT THE INTERNATIONAL STROKE CONFERENCE
Key clinical point: By 2010, U.S. ischemic stroke patients aged 80 or older received thrombolytic treatment as often as younger patients.
Major finding: In 2010, thrombolysis was used to treat 3.55% of U.S. stroke patients 80 years or older, 3.87% of those 65-79, and 3.61% of those 18-64.
Data source: The U.S. National Inpatient Sample for 2000-2010, which included 5,932,175 adults with acute ischemic stroke.
Disclosures: Dr. Lin said she had no relevant financial disclosures.