User login
Long-term DAPT offers ongoing post-MI benefit
SAN DIEGO – The idea that patients with established coronary disease can derive important, secondary-prevention benefit from prolonged dual-antiplatelet therapy received a major boost with the results of a major, international, controlled trial with more than 21,000 patients.
Results from the PEGASUS-TIMI 54 (Prevention of Cardiovascular Events in Patients with Prior Heart Attack Using Ticagrelor Compared to Placebo on a Background of Aspirin-Thrombolysis in Myocardial Infarction 54) showed putting post-myocardial infarction patients on dual-antiplatelet therapy (DAPT) with aspirin and the thienopyridine ticagrelor (Brilinta) for a median of 33 months cut the combined incidence of cardiovascular death, MI, or stroke by a relative 15%, compared with patients on aspirin alone as well as the other standard treatments used for post-MI patients, Dr. Marc S. Sabatine reported at the annual meeting of the American College of Cardiology.

The findings added to the growing body of evidence that long-term – and possibly lifelong – DAPT is a key part of secondary prevention. Last year, results from the DAPT (Dual Antiplatelet Therapy) trial (N. Engl. J. Med. 2014;371:2155-66) supplied evidence for this in acute coronary syndrome patients who had undergone percutaneous coronary intervention (PCI). The PEGASUS-TIMI 54 trial did not require that enrolled post-MI patients had undergone PCI, but the reality is that this is the way most MI patients get managed, and in PEGASUS-TIMI 54 roughly 83% of the patients had a PCI history.
The new findings also highlighted the risk-benefit trade-off that DAPT means for patients. In PEGASUS-TIMI 54 the increased incidence of major bleeding events roughly matched the decreased rate of major cardiovascular events prevented. But while the incidence of bleeds categorized as TIMI major bleeds more than doubled in the patients randomized to DAPT compared with those on aspirin only, the prolonged treatment with ticagrelor did not result in an increase in fatal bleeds or in intracranial hemorrhages, the two most feared types of TIMI major bleeds.
“I’d much rather prevent cardiovascular deaths, MIs, and strokes even at the expense of causing reversible, nonfatal bleeding events,” said Dr. Sabatine, professor of medicine at Harvard Medical School in Boston and chairman of the TIMI Study Group at Brigham and Women’s Hospital.
Another notable adverse effect from ticagrelor treatment was a roughly threefold increased incidence of dyspnea, which led to drug discontinuation in 5%-7% of patients, depending on whether they received ticagrelor at 60 mg b.i.d. or 90 mg b.i.d. The study results showed a reduced rate of both bleeding and dyspnea in patients randomized to receive the 60-mg b.i.d. dosage, compared with those who received the 90-mg b.i.d. dosage, which is the standard ticagrelor dosage and the formulation now sold. At the same time, the efficacy of the 60-mg b.i.d. dosage for preventing ischemic events equaled that of the higher dosage. But as of today, it is impossible for a physician to prescribe a 60-mg formulation of ticagrelor because the manufacturer does not sell it.

Several cardiologists PEGASUS-TIMI 54 at the meeting said that they agreed with Dr. Sabatine and felt that the benefits from prolonged DAPT with ticagrelor outweighed the downside of an increased bleeding risk.
“I think that the benefit is greater than the risk. None of us wants to see patients experience bleeding, but I was encouraged that fatal bleeds and intracranial hemorrhages were no different,” commented Dr. Elliott M. Antman, a professor of medicine at Harvard.
“The benefits outweigh the bleeding risk, but I wouldn’t trivialize the bleeding risk. Assessing a patient’s bleeding risk is really important,” commented Dr. Robert Harrington, professor of medicine at Stanford (Calif.) University.
But others at the meeting said that the elevated bleeding risk gave them pause. “There clearly is a price to be paid even if extended-duration DAPT reduces MI and stent thrombosis. I believe only the highest risk patients – those with acute coronary syndrome and ST-elevation MI – are the ones for whom I’d even consider it. Unless we can reduce bleeding risk, maybe with even lower doses [of ticagrelor], stopping aspirin, or using a reversal agent, we will be causing bleeds that are very relevant to patients,” commented Dr. Ajay J. Kirtane, an interventional cardiologist at Columbia University in New York.

Dr. Kirtane also questioned whether TIMI major bleeds was the appropriate measure of bleeding risk in the context of a study like PEGASUS-TIMI 54. “Historically, TIMI major bleeding was derived from studies of acute heart attack patients getting fibrinolytic therapy. That is a very different population from this one. In my mind, the combination of TIMI major and minor bleeding would be more encompassing, and for patients the bleeding risks of these therapies are real and have been associated with bad sequelae,” he said in an interview.
When placed in the context of prior reports the new findings also raise the possibility that the generic, and hence much cheaper, thienopyridine clopidogrel might provide roughly the same long-term benefit as more expensive ticagrelor, especially for patients without a genetic profile that makes them poor clopidogrel metabolizers. This may be an attractive option for patients who have a problem paying for ticagrelor long term.
“I’d rather prescribe a patient a cheaper medication that might be a bit less effective than create an economic hardship,” Dr. Harrington said in an interview. The results from the DAPT trial, which included some post-PCI patients who received long-term DAPT with clopidogrel plus aspirin “give you a certain comfort” with the idea of substituting clopidogrel for ticagrelor when affordability is a major concern, Dr. Harrington noted.
PEGASUS-TIMI 54 enrolled 21, 162 patients who were 1-3 years out from a prior myocardial infarction at 1,161 sites in 31 countries. Enrolled patients also had to be at least 50 years old, and have at least one additional risk factor for ischemic events such as age 65 years or older, diabetes, multivessel coronary artery disease, or chronic renal dysfunction. The enrolled patients averaged 1.7 years out from their index MI. Randomization assigned patients to treatment with 90 mg ticagrelor b.i.d., 60 mg ticagrelor b.i.d., or placebo, and all patients also received daily treatment with 75-150 mg aspirin.
After a median follow-up of 33 months on treatment, the combined rate of cardiovascular death, myocardial infarction, or stroke – the study’s primary endpoint – occurred in 7.85% of patients on the 90-mg ticagrelor dosage, 7.77% of those on the 60-mg dosage, and in 9.04% of patients on placebo receiving aspirin only, statistically significant differences for the study’s primary endpoint for each of the two ticagrelor dosages. Concurrent with the report at the meeting the results also appeared online (N. Engl. J. Med. 2015; [doi:10.1056/nejmoa1500857]). This translated into hazard ratios of 0.85 for the 90 mg dosage and 0.84 for the 60 mg dosage compared with placebo.
The study’s primary safety outcome was the incidence of TIMI major bleeding events, which occurred in 2.60% of patients on the higher ticagrelor dosage, 2.30% of those on the 60 mg dosage, and in 1.06% of those on placebo, which converted into hazard ratios of 2.69 for the 90-mg dosage and 2.32 for the lower dosage for TIMI major bleeds compared with aspirin alone.
On Twitter @mitchelzoler
The results from PEGASUS-TIMI 54 provide a powerful message for secondary prevention: Patients who have had a prior myocardial infarction remain at an increased risk for subsequent ischemic events, even when maintained on what is currently standard therapy and even when they are several years out from their event.

|
Dr. Richard C. Becker |
We have no perfect antiplatelet drugs. Treating patients like those enrolled in the trial with an agent like ticagrelor further reduced their risk for ischemic events, but at the price of increasing their risk for major bleeds. The good news was that the rates of fatal bleeds and intracranial hemorrhages did not increase with ticagrelor treatment. Selecting the right patients to treat with prolonged dual antiplatelet therapy (DAPT) requires good judgment as well as understanding the patient’s values and preferences. From the clinician’s perspective it is the fatal bleeds or intracranial hemorrhages that are most comparable to cardiovascular deaths, myocardial infarctions or strokes. Although I do not want to minimize the impact of other major or minor bleeds that might require transfusions, these are not considered as important for patient well being as the ischemic events that ticagrelor treatment reduced.
I believe that the findings from PEGASUS-TIMI 54 will work their way into everyday practice with clinicians increasingly keeping patients on prolonged DAPT following percutaneous coronary interventions or a myocardial infarction. Problems with bleeding or dyspnea usually appear relatively early for patients on DAPT. The new findings give us increased confidence that once these patients get to a year out from the onset of treatment they can safely continue treatment and derive ongoing benefit from it, especially higher-risk patients, even though the 60-mg formulation of ticagrelor is not currently available. The new results complement those reported last year from the DAPT trial, which also addressed the safety and incremental value of more prolonged DAPT for higher-risk MI and acute coronary syndrome patients.
Richard C. Becker, M.D. is professor and director of the University of Cincinnati Heart, Lung and Vascular Institute. He has been a consultant to and received research grants from AstraZeneca, the company that sponsored PEGASUS-TIMI 54 and that markets ticagrelor (Brilinta). He made these comments in an interview.
The results from PEGASUS-TIMI 54 provide a powerful message for secondary prevention: Patients who have had a prior myocardial infarction remain at an increased risk for subsequent ischemic events, even when maintained on what is currently standard therapy and even when they are several years out from their event.
|
|
Dr. Richard C. Becker |
We have no perfect antiplatelet drugs. Treating patients like those enrolled in the trial with an agent like ticagrelor further reduced their risk for ischemic events, but at the price of increasing their risk for major bleeds. The good news was that the rates of fatal bleeds and intracranial hemorrhages did not increase with ticagrelor treatment. Selecting the right patients to treat with prolonged dual antiplatelet therapy (DAPT) requires good judgment as well as understanding the patient’s values and preferences. From the clinician’s perspective it is the fatal bleeds or intracranial hemorrhages that are most comparable to cardiovascular deaths, myocardial infarctions or strokes. Although I do not want to minimize the impact of other major or minor bleeds that might require transfusions, these are not considered as important for patient well being as the ischemic events that ticagrelor treatment reduced.
I believe that the findings from PEGASUS-TIMI 54 will work their way into everyday practice with clinicians increasingly keeping patients on prolonged DAPT following percutaneous coronary interventions or a myocardial infarction. Problems with bleeding or dyspnea usually appear relatively early for patients on DAPT. The new findings give us increased confidence that once these patients get to a year out from the onset of treatment they can safely continue treatment and derive ongoing benefit from it, especially higher-risk patients, even though the 60-mg formulation of ticagrelor is not currently available. The new results complement those reported last year from the DAPT trial, which also addressed the safety and incremental value of more prolonged DAPT for higher-risk MI and acute coronary syndrome patients.
Richard C. Becker, M.D. is professor and director of the University of Cincinnati Heart, Lung and Vascular Institute. He has been a consultant to and received research grants from AstraZeneca, the company that sponsored PEGASUS-TIMI 54 and that markets ticagrelor (Brilinta). He made these comments in an interview.
SAN DIEGO – The idea that patients with established coronary disease can derive important, secondary-prevention benefit from prolonged dual-antiplatelet therapy received a major boost with the results of a major, international, controlled trial with more than 21,000 patients.
Results from the PEGASUS-TIMI 54 (Prevention of Cardiovascular Events in Patients with Prior Heart Attack Using Ticagrelor Compared to Placebo on a Background of Aspirin-Thrombolysis in Myocardial Infarction 54) showed putting post-myocardial infarction patients on dual-antiplatelet therapy (DAPT) with aspirin and the thienopyridine ticagrelor (Brilinta) for a median of 33 months cut the combined incidence of cardiovascular death, MI, or stroke by a relative 15%, compared with patients on aspirin alone as well as the other standard treatments used for post-MI patients, Dr. Marc S. Sabatine reported at the annual meeting of the American College of Cardiology.
The findings added to the growing body of evidence that long-term – and possibly lifelong – DAPT is a key part of secondary prevention. Last year, results from the DAPT (Dual Antiplatelet Therapy) trial (N. Engl. J. Med. 2014;371:2155-66) supplied evidence for this in acute coronary syndrome patients who had undergone percutaneous coronary intervention (PCI). The PEGASUS-TIMI 54 trial did not require that enrolled post-MI patients had undergone PCI, but the reality is that this is the way most MI patients get managed, and in PEGASUS-TIMI 54 roughly 83% of the patients had a PCI history.
The new findings also highlighted the risk-benefit trade-off that DAPT means for patients. In PEGASUS-TIMI 54 the increased incidence of major bleeding events roughly matched the decreased rate of major cardiovascular events prevented. But while the incidence of bleeds categorized as TIMI major bleeds more than doubled in the patients randomized to DAPT compared with those on aspirin only, the prolonged treatment with ticagrelor did not result in an increase in fatal bleeds or in intracranial hemorrhages, the two most feared types of TIMI major bleeds.
“I’d much rather prevent cardiovascular deaths, MIs, and strokes even at the expense of causing reversible, nonfatal bleeding events,” said Dr. Sabatine, professor of medicine at Harvard Medical School in Boston and chairman of the TIMI Study Group at Brigham and Women’s Hospital.
Another notable adverse effect from ticagrelor treatment was a roughly threefold increased incidence of dyspnea, which led to drug discontinuation in 5%-7% of patients, depending on whether they received ticagrelor at 60 mg b.i.d. or 90 mg b.i.d. The study results showed a reduced rate of both bleeding and dyspnea in patients randomized to receive the 60-mg b.i.d. dosage, compared with those who received the 90-mg b.i.d. dosage, which is the standard ticagrelor dosage and the formulation now sold. At the same time, the efficacy of the 60-mg b.i.d. dosage for preventing ischemic events equaled that of the higher dosage. But as of today, it is impossible for a physician to prescribe a 60-mg formulation of ticagrelor because the manufacturer does not sell it.
Several cardiologists PEGASUS-TIMI 54 at the meeting said that they agreed with Dr. Sabatine and felt that the benefits from prolonged DAPT with ticagrelor outweighed the downside of an increased bleeding risk.
“I think that the benefit is greater than the risk. None of us wants to see patients experience bleeding, but I was encouraged that fatal bleeds and intracranial hemorrhages were no different,” commented Dr. Elliott M. Antman, a professor of medicine at Harvard.
“The benefits outweigh the bleeding risk, but I wouldn’t trivialize the bleeding risk. Assessing a patient’s bleeding risk is really important,” commented Dr. Robert Harrington, professor of medicine at Stanford (Calif.) University.
But others at the meeting said that the elevated bleeding risk gave them pause. “There clearly is a price to be paid even if extended-duration DAPT reduces MI and stent thrombosis. I believe only the highest risk patients – those with acute coronary syndrome and ST-elevation MI – are the ones for whom I’d even consider it. Unless we can reduce bleeding risk, maybe with even lower doses [of ticagrelor], stopping aspirin, or using a reversal agent, we will be causing bleeds that are very relevant to patients,” commented Dr. Ajay J. Kirtane, an interventional cardiologist at Columbia University in New York.
Dr. Kirtane also questioned whether TIMI major bleeds was the appropriate measure of bleeding risk in the context of a study like PEGASUS-TIMI 54. “Historically, TIMI major bleeding was derived from studies of acute heart attack patients getting fibrinolytic therapy. That is a very different population from this one. In my mind, the combination of TIMI major and minor bleeding would be more encompassing, and for patients the bleeding risks of these therapies are real and have been associated with bad sequelae,” he said in an interview.
When placed in the context of prior reports the new findings also raise the possibility that the generic, and hence much cheaper, thienopyridine clopidogrel might provide roughly the same long-term benefit as more expensive ticagrelor, especially for patients without a genetic profile that makes them poor clopidogrel metabolizers. This may be an attractive option for patients who have a problem paying for ticagrelor long term.
“I’d rather prescribe a patient a cheaper medication that might be a bit less effective than create an economic hardship,” Dr. Harrington said in an interview. The results from the DAPT trial, which included some post-PCI patients who received long-term DAPT with clopidogrel plus aspirin “give you a certain comfort” with the idea of substituting clopidogrel for ticagrelor when affordability is a major concern, Dr. Harrington noted.
PEGASUS-TIMI 54 enrolled 21, 162 patients who were 1-3 years out from a prior myocardial infarction at 1,161 sites in 31 countries. Enrolled patients also had to be at least 50 years old, and have at least one additional risk factor for ischemic events such as age 65 years or older, diabetes, multivessel coronary artery disease, or chronic renal dysfunction. The enrolled patients averaged 1.7 years out from their index MI. Randomization assigned patients to treatment with 90 mg ticagrelor b.i.d., 60 mg ticagrelor b.i.d., or placebo, and all patients also received daily treatment with 75-150 mg aspirin.
After a median follow-up of 33 months on treatment, the combined rate of cardiovascular death, myocardial infarction, or stroke – the study’s primary endpoint – occurred in 7.85% of patients on the 90-mg ticagrelor dosage, 7.77% of those on the 60-mg dosage, and in 9.04% of patients on placebo receiving aspirin only, statistically significant differences for the study’s primary endpoint for each of the two ticagrelor dosages. Concurrent with the report at the meeting the results also appeared online (N. Engl. J. Med. 2015; [doi:10.1056/nejmoa1500857]). This translated into hazard ratios of 0.85 for the 90 mg dosage and 0.84 for the 60 mg dosage compared with placebo.
The study’s primary safety outcome was the incidence of TIMI major bleeding events, which occurred in 2.60% of patients on the higher ticagrelor dosage, 2.30% of those on the 60 mg dosage, and in 1.06% of those on placebo, which converted into hazard ratios of 2.69 for the 90-mg dosage and 2.32 for the lower dosage for TIMI major bleeds compared with aspirin alone.
On Twitter @mitchelzoler
AT ACC 15
Key clinical point: Myocardial infarction patients 1-3 years out from their event who took long-term dual-antiplatelet therapy with aspirin and ticagrelor had significantly fewer major ischemic events but also significantly more major bleeding events.
Major finding: Treatment with ticagrelor plus aspirin for 3 years cut major ischemic events by a relative 15% compared with aspirin alone.
Data source: PEGASUS-TIMI 54, a multicenter, randomized trial with 21,162 patients.
Disclosures: PEGASUS-TIMI 54 was sponsored by AstraZeneca, the company that markets ticagrelor (Brilinta). Dr. Sabatine has received research support from AstraZeneca and from several other companies, and has been a consultant to several drug companies. Dr. Antman has received research support from AstraZeneca, Eli Lilly, and Daiichi Sankyo. Dr. Harrington was an investigator for the trial that led to ticagrelor’s marketing approval and received research support from AstraZeneca and several other companies. Dr. Kirtane has received research support from AstraZeneca and six other companies.

MI survivors face higher cancer risk
SAN DIEGO– The risk of developing cancer is significantly higher in survivors of an acute MI compared to the general population, according to a large Danish national registry study.
“Greater focus on long-term cancer risk is warranted in MI survivors. This could potentially have implications on future patient care for MI patients, outpatient follow-up strategies, and distribution of health care resources,” Morten Winther Malmborg said at the annual meeting of the American College of Cardiology.

He presented a nationwide cohort study including 3,005,734 Danish adults with no baseline history of MI or cancer who were followed for up to 17 years in the comprehensive Danish National Patient Registry. During the study period, 125,926 of these individuals had a nonfatal MI.
The subsequent incidence of cancer in the MI survivors was 167 cases per 10,000 person-years compared with 95 per 10,000 person-years in the control group, reported Mr. Malmborg, a fourth-year medical student at the University of Copenhagen.
Cancer diagnoses of all types were highest by far in the first 6 months post-MI, which he attributed to surveillance bias, since that was a period of increased medical contact. However, after he and his coinvestigators excluded the cancers diagnosed during that initial 6-month period, the post-MI group still had a highly significant 11% increased relative risk for cancer overall during the period from 6 months through 17 years post-MI.
The younger a patient was when the MI occurred, the greater the subsequent cancer risk. Individuals who had a nonfatal MI at age 30-54 had a 44% greater risk of cancer overall at 6 months–17 years post-MI compared, with the control group. Those who had an MI at age 55-69 had a 19% increased cancer risk compared to controls, while those whose MI occurred at age 70-99 had a modest but still statistically significant 5% increase in cancer risk.
Particularly striking, according to Mr. Malmborg, was the MI survivors’ 44% increased relative risk for lung cancer and 31% increase in bladder cancer during the period from 6 months–17 years post-MI compared with the general population. In contrast, rates of breast, prostate, and colon cancer weren’t significantly different between MI survivors and the general population with no history of MI.
This observational study didn’t address the mechanisms involved in MI survivors’ increased cancer risk. Although the Danish registry didn’t include information of smoking status, Mr. Malmborg speculated that smoking may figure prominently, since it is a major shared risk factor for cardiovascular disease as well as lung and bladder cancer in particular. Other shared risk factors for cardiovascular disease and cancer include obesity, sedentary lifestyle, and excessive alcohol use.
This is the first large-scale study to look at cancer risk post-MI. It’s an increasingly relevant issue because the advances in cardiac care that have brought improved long-term survival following acute MI means more patients with a history of MI are likely to die from noncardiac causes, Mr. Malmborg observed.
He and his coinvestigators are now performing a number-needed-to-screen analysis to help them determine whether structured, formal creening for cancer following an MI should be done routinely.
The study was supported by Danish national medical research funds. The presenter reported having no financial conflicts.
SAN DIEGO– The risk of developing cancer is significantly higher in survivors of an acute MI compared to the general population, according to a large Danish national registry study.
“Greater focus on long-term cancer risk is warranted in MI survivors. This could potentially have implications on future patient care for MI patients, outpatient follow-up strategies, and distribution of health care resources,” Morten Winther Malmborg said at the annual meeting of the American College of Cardiology.
He presented a nationwide cohort study including 3,005,734 Danish adults with no baseline history of MI or cancer who were followed for up to 17 years in the comprehensive Danish National Patient Registry. During the study period, 125,926 of these individuals had a nonfatal MI.
The subsequent incidence of cancer in the MI survivors was 167 cases per 10,000 person-years compared with 95 per 10,000 person-years in the control group, reported Mr. Malmborg, a fourth-year medical student at the University of Copenhagen.
Cancer diagnoses of all types were highest by far in the first 6 months post-MI, which he attributed to surveillance bias, since that was a period of increased medical contact. However, after he and his coinvestigators excluded the cancers diagnosed during that initial 6-month period, the post-MI group still had a highly significant 11% increased relative risk for cancer overall during the period from 6 months through 17 years post-MI.
The younger a patient was when the MI occurred, the greater the subsequent cancer risk. Individuals who had a nonfatal MI at age 30-54 had a 44% greater risk of cancer overall at 6 months–17 years post-MI compared, with the control group. Those who had an MI at age 55-69 had a 19% increased cancer risk compared to controls, while those whose MI occurred at age 70-99 had a modest but still statistically significant 5% increase in cancer risk.
Particularly striking, according to Mr. Malmborg, was the MI survivors’ 44% increased relative risk for lung cancer and 31% increase in bladder cancer during the period from 6 months–17 years post-MI compared with the general population. In contrast, rates of breast, prostate, and colon cancer weren’t significantly different between MI survivors and the general population with no history of MI.
This observational study didn’t address the mechanisms involved in MI survivors’ increased cancer risk. Although the Danish registry didn’t include information of smoking status, Mr. Malmborg speculated that smoking may figure prominently, since it is a major shared risk factor for cardiovascular disease as well as lung and bladder cancer in particular. Other shared risk factors for cardiovascular disease and cancer include obesity, sedentary lifestyle, and excessive alcohol use.
This is the first large-scale study to look at cancer risk post-MI. It’s an increasingly relevant issue because the advances in cardiac care that have brought improved long-term survival following acute MI means more patients with a history of MI are likely to die from noncardiac causes, Mr. Malmborg observed.
He and his coinvestigators are now performing a number-needed-to-screen analysis to help them determine whether structured, formal creening for cancer following an MI should be done routinely.
The study was supported by Danish national medical research funds. The presenter reported having no financial conflicts.
AT ACC 15
Key clinical point: Closer monitoring for development of cancer in MI survivors may be warranted.
Major finding: The incidence of cancer overall was 167 cases per 10,000 person-years in acute MI survivors, compared with 95 per 10,000 person-years in the general population without a history of MI or prior cancer.
Data source: An observational study of more than 3 million adults enrolled in the Danish National Patient Registry, roughly 126,000 of whom were diagnosed with a first nonfatal MI during the study period.
Disclosures: The study was supported by Danish national medical research funds. The presenter reported having no financial conflicts.

Research paves way for new SCID treatment

Image courtesy of the Salk
Institute of Biological Studies
Researchers say they have devised a way to correct a genetic defect in cells from a patient with X-linked severe combined immunodeficiency (SCID-X1).
The group generated induced pluripotent stem cells (iPSCs) using a sample from an infant with SCID-X1, then used the gene-editing technique TALEN to correct the defect in those iPSCs.
And this allowed the iPSCs to generate mature natural killer (NK) cells and T-cell precursors.
The researchers said this is the first evidence of genomic correction of iPSCs derived from a patient with SCID-X1 that resulted in the regeneration of mature lymphoid cells in vitro.
And the work, which is published in Cell Stem Cell, holds promise for the development of new treatments for this disease.
“This work demonstrates a new method that could lead to a more effective and less invasive treatment for this devastating disease,” said study author Inder Verma, PhD, of The Salk Institute of Biological Studies in La Jolla, California.
“It also has the potential to lay the foundation to cure other deadly and rare blood disorders.”
Dr Verma and his colleagues began this research by securing a sample of bone marrow from a deceased infant with SCID-X1. The subject harbored a novel splice-site mutation (c.468+3A > C) of the IL-2Rγ gene, which results in a lack of functional NK and T cells.
The researchers used the subject’s sample to create iPSC lines and used TALEN to correct the mutation in those iPSCs.
“We use TALEN-based genome editing to change just one nucleotide in one gene to correct the deficiency,” said study author Tushar Menon, PhD, also of the Salk Institute. “The technique is literally that precise.”
The team then compared the corrected iPSCs to uncorrected SCID-X1 iPSCs and control iPSCs generated from cord-blood-derived endothelial cells and dermal fibroblasts.
Like control cells, the corrected iPSCs were able to differentiate into mature NK cells that expressed both inhibitory and activating receptors (KIR/CD158b and CD16, respectively).
The corrected iPSCs could also differentiate into T-cell precursors but not mature T cells. The researchers are currently working on producing mature T cells.
“Ultimately, we hope these efforts will help lead to the ‘holy grail’ in the field: the ability to create stem cells from iPSCs capable of generating all types of blood and immune cells,” Dr Verma said.
He and his colleagues noted, however, that further improvements of their protocol will be needed to obtain sufficient cells for clinical use. ![]()
VIDEO: Growing evidence supports prolonged DAPT for ACS
SAN DIEGO – Current guidelines call for treating acute coronary syndrome patients with dual antiplatelet therapy (aspirin plus a thienopyridine) for at least 1 year following their event, but results from recent large, randomized trials suggest that many patients continue to benefit from treatment that extends beyond the first year, Dr. Richard C. Becker said during an interview at the annual meeting of the American College of Cardiology.
New results reported at the meeting from the PEGASUS-TIMI (Prevention of Cardiovascular Events in Patients with Prior Heart Attack Using Ticagrelor Compared to Placebo on a Background of Aspirin-Thrombolysis in Myocardial Infarction) 54 trial highlight the long-term risk for ischemic events faced by patients following an acute coronary syndrome (N. Engl. J. Med. 2025;[doi: 10.1056/NEJMoa0904327]. The results also underscore the importance of risk assessment, and the importance of tailoring treatment to ACS patients based not only on their long-term risk from their cardiovascular disease but also their risk for adverse bleeding events secondary to prolonged, aggressive antiplatelet therapy. The PEGASUS-TIMI 54 results complement the findings reported last year from the DAPT (Dual Antiplatelet Therapy) trial (N. Engl. J. Med. 2014;371:2155-66), he said.
The video associated with this article is no longer available on this site. Please view all of our videos on the MDedge YouTube channel
Based on the accumulated evidence, ACS patients who have done well clinically on DAPT after 1 year and are deemed at low risk for bleeding and other complications are good candidates for more prolonged DAPT treatment, said Dr. Becker, professor and director of the University of Cincinnati Heart, Lung & Vascular Institute.
PEGASUS-TIMI 54 ws sponsored by AstraZeneca, which markets ticagrelor (Brilinta). Dr. Becker has been a consultant to and received research support from AstraZeneca.
On Twitter @mitchelzoler
AT ACC 15

Digoxin linked to higher mortality in AF
SAN DIEGO – Digoxin increases the risk of death by 27% in patients with atrial fibrillation, a meta-analysis of 19 studies showed.
Patients with AF and kidney failure faced a 60% to 70 % increase in mortality compared to their counterparts not taking digoxin, according to a press release on the study.
A weaker association between digoxin and death was observed in AF patients who also had heart failure, a finding the authors suggest warrants further investigation.
“Until further research can be done, I would suggest physicians use caution when prescribing digoxin for patients with atrial fibrillation, especially given that there are alternative drugs available that might be safer,” lead author Dr. Waqas Qureshi said in a statement.
The results were released in advance of their March 15 presentation at the annual meeting of the American College of Cardiology in San Diego.
About 5.6 million Americans have atrial fibrillation (AF) and roughly 1 in 5 are prescribed digoxin for heart rate control.
Current guidelines recommend digoxin as first-line therapy in patients who aren’t physically active and as a second-line drug for more active patients.
“Based on consistent results coming out of many studies, our results suggest digoxin should be downgraded from its position as a front-line agent for certain patients with atrial fibrillation,” Dr. Qureshi, a clinical and research cardiology fellow at Wake Forest School of Medicine in Winston-Salem, N.C., recommended.
The authors reviewed 19 studies including five cohort and randomized controlled trials involving 501,681 patients. Of these, 458,311 patients had AF and 111,978 were prescribed digoxin.
In a random effects model, digoxin was associated with an increased risk of mortality, with a pooled hazard ratio of 1.27 (95% confidence interval 1.19-1.36; P value < .001).
Several studies in the meta-analysis suggest that higher blood levels of digoxin increase the risk of death. The mechanism behind the increased mortality is not known, although previous studies have suggested digoxin increases the risk of thromboembolism.
The meta-analysis accounted for risk factors and co-morbidities reported in the various studies, but it’s possible that some confounding factors may not have been accounted for, the authors acknowledge.
“The study points to the need for a well-structured, targeted trial to investigate digoxin’s safety,” Dr. Qureshi stated.
Digoxin remains a commonly used agent for control of ventricular rate in atrial fibrillation (AF) and is accepted as a valid therapy. Despite endorsement of digoxin in clinical practice guidelines for rate control in atrial fibrillation, there are only limited, conflicting, and mostly older observational data on the safety of digoxin in AF. There have been no appropriately designed clinical trials to assess the safety of digoxin in any patient population. In heart failure cohorts, the effectiveness and safety of digoxin has been shown to vary by serum digoxin concentrations, indicating possible moderation by kidney function.
The meta-analysis of five cohort studies and randomized controlled trials by Dr. Qureshi and colleagues concludes that digoxin is associated with a 27% increased risk of mortality in patients with AF. These results confirm another recently published analysis with similar conclusions, TREAT-AF (J. Am. Coll. Cardiol. 2014;64:660-8).
The TREAT-AF study was a retrospective analysis of patients with newly diagnosed AF. In this study, treatment with digoxin was independently associated with mortality, regardless of age, sex, kidney function, heart failure status, concomitant therapies, or drug adherence. Sensitivity analyses to assess the possible impact of unmeasured confounders make it highly unlikely that any influenced the result of the TREAT-AF Study.
Prospective studies are needed to confirm the findings of these observational reports and to explore the mechanisms responsible for the increased risk of mortality in patients with AF treated with digoxin. In the meantime, physicians should consider alternatives to digoxin in managing patients with AF.
N.A. Mark Estes III, MD, is professor of medicine at Tufts University, Boston. He has no relevant disclosures.
SAN DIEGO – Digoxin increases the risk of death by 27% in patients with atrial fibrillation, a meta-analysis of 19 studies showed.
Patients with AF and kidney failure faced a 60% to 70 % increase in mortality compared to their counterparts not taking digoxin, according to a press release on the study.
A weaker association between digoxin and death was observed in AF patients who also had heart failure, a finding the authors suggest warrants further investigation.
“Until further research can be done, I would suggest physicians use caution when prescribing digoxin for patients with atrial fibrillation, especially given that there are alternative drugs available that might be safer,” lead author Dr. Waqas Qureshi said in a statement.
The results were released in advance of their March 15 presentation at the annual meeting of the American College of Cardiology in San Diego.
About 5.6 million Americans have atrial fibrillation (AF) and roughly 1 in 5 are prescribed digoxin for heart rate control.
Current guidelines recommend digoxin as first-line therapy in patients who aren’t physically active and as a second-line drug for more active patients.
“Based on consistent results coming out of many studies, our results suggest digoxin should be downgraded from its position as a front-line agent for certain patients with atrial fibrillation,” Dr. Qureshi, a clinical and research cardiology fellow at Wake Forest School of Medicine in Winston-Salem, N.C., recommended.
The authors reviewed 19 studies including five cohort and randomized controlled trials involving 501,681 patients. Of these, 458,311 patients had AF and 111,978 were prescribed digoxin.
In a random effects model, digoxin was associated with an increased risk of mortality, with a pooled hazard ratio of 1.27 (95% confidence interval 1.19-1.36; P value < .001).
Several studies in the meta-analysis suggest that higher blood levels of digoxin increase the risk of death. The mechanism behind the increased mortality is not known, although previous studies have suggested digoxin increases the risk of thromboembolism.
The meta-analysis accounted for risk factors and co-morbidities reported in the various studies, but it’s possible that some confounding factors may not have been accounted for, the authors acknowledge.
“The study points to the need for a well-structured, targeted trial to investigate digoxin’s safety,” Dr. Qureshi stated.
FROM ACC 2015
Key clinical point: Alternatives to digoxin should be considered when prescribing for patients with atrial fibrillation.
Major finding: Digoxin was associated with an increased risk of mortality in patients with AF (Hazard ratio, 1.27; P < 001).
Data source: Pooled analysis of 19 studies involving 501,681 patients, 458,311 with atrial fibrillation.
Disclosures: Dr. Qureshi and his co-authors reported having no financial disclosures.
Make the Diagnosis - March 2015
Diagnosis: Bleomycin-induced flagellate hyperpigmentation
Bleomycin is an antineoplastic agent. Most reported side effects involve the lung and skin since these organs have lower concentrations of the enzyme that detoxifies bleomycin. Other dermatologic side effects of bleomycin include Raynaud's phenomenon, hyperkeratosis, nailbed changes, and peeling of the skin on the palmar and plantar surfaces.
Flagellate erythema has been described in relation to bleomycin treatment along with other reported associations with peplomycin (a bleomycin derivative), docetaxel, dermatomyositis, adult-onset Still's disease, and shiitake mushroom dermatitis. The rash may appear following administration of bleomycin by any route and has been shown to be dose independent. Onset occurs anytime from 1 day to several months after exposure to the offending agent. Patients typically present with history of itching followed by the appearance of red linear streaks, which are most commonly found on the trunk. Over time, the erythema will resolve to postinflammatory hyperpigmentation.
The exact cause is unknown, but it is thought that scratching causes vasodilation with bleomycin accumulating in the skin. Diagnosis is made by physical examination of the characteristic appearance of the rash along with the history of chemotherapy. A skin biopsy may be performed. In most cases, the rash resolves spontaneously within 6-8 months. Severe rashes may warrant discontinuation of bleomycin. Using antihistamines and topical and oral corticosteroids in conjunction with bleomycin may reduce the incidence of flagellate erythema/hyperpigmentation.

This case and photo were submitted by Dr. Damon McClain, a dermatologist in Camp Lejeune, N.C., and by Parteek Singla. A 26-year-old male presented with asymptomatic hyperpigmented streaks on his back. He was receiving chemotherapy for testicular cancer. He received dexamethasone with his first chemotherapy treatment and had no cutaneous eruption at that time. He was not given a steroid with his second dose of chemotherapy. The lesions began an hour after that dose. Initially, the lesions were red and pruritic, and then they turned brown. The patient had no nailfold changes on examination. He had no other medical problems and reported that he had not eaten any unusual foods.

New approach to gene therapy for hemophilia

that can develop hemophilia B
Gene therapy that produces a potent clotting factor holds promise for treating hemophilia B, researchers have reported in Blood.
The group administered adeno-associated viral-8 (AAV-8) vectors encoding the clotting factor FIX-Padua to mice and dogs with hemophilia B.
The treatment appeared to be safe and effective, did not prompt the formation of inhibitory antibodies, and even eradicated pre-existing inhibitors in one of the dogs.
“Our findings may provide a new approach to gene therapy for hemophilia and perhaps other genetic diseases that have similar complications from inhibiting antibodies,” said study author Valder R. Arruda, MD, PhD, of The Children’s Hospital of Philadelphia in Pennsylvania.
For years, researchers have investigated gene therapy strategies that deliver DNA sequences carrying genetic code to produce clotting factor in patients. But this approach has been hindered by the body’s immune response against vectors.
Those responses, which defeated initial benefits seen in experimental human gene therapy, were dose-dependent. So Dr Arruda and his colleagues decided to test gene therapy that used lower doses of AAV-8 vector to produce FIX-Padua.
Dr Arruda was part of a team that discovered FIX-Padua in a young Italian man with thrombophilia. A mutation in the factor IX gene produced the clotting factor, which was named after the patient’s city of residence.
FIX-Padua is hyperfunctional, clotting blood 8 to 12 times more strongly than wild-type factor IX. Therefore, in the current study, the researchers needed to strike a balance—to relieve severe hemophilia in dogs by using a dose strong enough to allow clotting but not enough to cause thrombosis or stimulate immune reactions.
“Our ultimate goal is to translate this approach to humans by adapting this variant protein found in one patient to benefit other patients with the opposite disease,” Dr Arruda said
He and his colleagues tested the safety of canine FIX-Padua (AAV-cFIX-Padua) in 3 dogs, all with naturally occurring types of hemophilia B.
Two of the dogs had never been exposed to clotting factor and had never developed antibodies. Injections of AAV-cFIX-Padua changed their hemophilia from severe to mild. They had no bleeding episodes for up to 2 years and did not develop inhibitory antibodies or thrombosis.
The third dog, Wiley, already had inhibitory antibodies before receiving AAV-cFIX-Padua. Like his peers, Wiley responded to the treatment, and that response persisted for 3 years. AAV-cFIX-Padua also eradicated his inhibitors, which marks the first time this occurred in an animal model with pre-existing antibodies.
Another set of experiments in mice suggested the gene therapy is safe and effective. Mice that received AAV encoding human FIX-Padua (AAV-hFIX-Padua) did not develop antibodies.
And the researchers found that AAV-hFIX-Padua was comparable to wild-type human FIX with regard to long-term expression and toxicity.
Dr Arruda noted that larger studies are needed in dogs with pre-existing inhibitors to confirm these encouraging early results.
In the meantime, at least one clinical trial is making use of FIX-Padua in adult patients with hemophilia B—at the University of North Carolina at Chapel Hill, under Paul Monahan, MD. Leaders of a separate trial being planned at Spark Therapeutics in Philadelphia, under Katherine A. High, MD, are contemplating using FIX-Padua as well. ![]()
Colorectal Cancer: Screening and Surveillance Recommendations
From the Boston University School of Medicine, Boston, MA.
Abstract
- Objective: To review recommendations for colorectal cancer (CRC) screening.
- Methods: Review of the literature.
- Results: In the United States, CRC is the third most commonly diagnosed cancer and the third leading cause of cancer death. CRC screening can reduce mortality through the detection of early-stage disease and the detection and removal of adenomatous polyps. There are several modalities for CRC screening, with current technology falling into 2 general categories: stool tests, which include tests for occult blood or exfoliated DNA; and structural exams, which include flexible sigmoidoscopy, colonoscopy, double-contrast barium enema, and CT colonography. The preferred CRC prevention test for average-risk individuals is colonoscopy starting at age 50 with subsequent examinations every 10 years. Patients unwilling to undergo screening colonoscopy may be offered flexible sigmoidoscopy, CT colonography, or fecal immunohistochemical test. Surveillance examinations should occur based on polyp findings on index colonoscopy. There is no recommendation to continue screening after age 75, though physicians can make a determination based on a patient’s health and risk/benefit profile. Current guidelines recommend against offering screening to patients over age 85.
- Conclusion: Increasing access to and utilization of CRC screening tests is likely to lead to improvements in mortality reduction, as only about half of people aged 50 or older report having received CRC testing consistent with current guidelines.
In the United States, colorectal cancer (CRC) is the third most commonly diagnosed cancer and the third leading cause of cancer death in both men and women [1]. In 2014, an estimated 136,830 people were diagnosed with CRC and about 50,310 people died of the disease [2]. Colorectal cancer usually develops slowly over a period of 10 to 15 years. The tumor typically begins as a noncancerous polyp, classically an adenomatous polyp or adenoma, though fewer than 10% of adenomas will progress to cancer [3]. Adenomas are common; an estimated one-third to one-half of all individuals will eventually develop 1 or more adenomas [4,5]. In the United States, the lifetime risk of being diagnosed with CRC is approximately 5% for both men and women [6]. Incidence rates for CRC increase with age, with an incidence rate more than 15 times higher in adults aged 50 years and older compared with those aged 20 to 49 years [7].
Certain demographic subgroups have been shown to be at higher risk. Overall, CRC incidence and mortality rates are about 35% to 40% higher in men than in women. The reasons for this are not completely understood but likely reflect complex interactions between gender-related differences in exposure to hormones and risk factors [8]. CRC incidence and mortality rates are highest in African-American men and women; incidence rates are 20% higher and mortality rates are about 45% higher than those in whites. Prior to 1989, incidence rates were predominantly higher in white men than in African American men and were similar for women of both races. Since that time, although incidence rates have declined as a whole [9], incidence rates have been higher for African Americans than whites in both men and women This crossover likely reflects a combination of greater access to and utilization of recommended screening tests among whites (resulting in detection and removal of precancerous polyps), as well as racial differences in trends for CRC risk factors [10].
CRC screening can reduce mortality through the detection of early-stage disease and the detection and removal of ademomatous polyps [11]. Increasing access to and utilization of CRC screening tests is likely to lead to improvements in mortality reduction, as only about half of people aged 50 or older report having received CRC testing consistent with current guidelines [1].
Case Study
Initial Presentation
A 55-year-old white male presents for a routine visit and asks about colon cancer screening. His father was diagnosed with colon cancer at the age of 78. Overall, he feels well and does not have any particular complaints. His bowel habits are normal and he denies melena and hematochezia. His past medical history is significant for diabetes, hypertension, and obesity. He was a previous smoker and has a few alcoholic drinks on the weekends. His physical exam is unremarkable. Results of recent blood work are normal and there is no evidence of anemia.
What are this patient’s risk factors for developing colon cancer?
Risk Factors for CRC
There are numerous factors that are thought to influence risk for CRC. Nonmodifiable risk factors include a personal or family history of CRC or adenomatous polyps, and a personal history of chronic inflammatory bowel disease. Modifiable risk factors that have been associated with an increased risk of CRC in epidemiologic studies include physical inactivity, obesity, high consumption of red or processed meats, smoking, and moderate-to-heavy alcohol consumption. In fact, a prospective study showed that up to 23% of colorectal cancers were considered to be potentially avoidable by adhering to multiple healthy lifestyle recommendations including maintaining a healthy weight, being physically active at least 30 minutes per day, eating a healthy diet, and avoiding smoking and drinking excessive amounts of alcohol [12].
People with a first-degree relative (parent, sibling, or offspring) who has had CRC have 2 to 3 times the risk of developing the disease compared with individuals with no family history; if the relative was diagnosed at a young age or if there is more than 1 affected relative, risk increases to 3 to 6 times that of the general population [13,14]. About 5% of patients with CRC have a well-defined genetic syndrome that causes the disease [15]. The most common of these is Lynch syndrome (also known as hereditary nonpolyposis colorectal cancer or HNPCC), which accounts for 2% to 4% of all CRC cases [16]. Although individuals with Lynch syndrome are predisposed to numerous types of cancer, risk of CRC is highest. A recent study of CRC in 147 Lynch syndrome families in the United States found lifetime risk of CRC to be 66% in men and 43% in women, with a median age at diagnosis of 42 years and 47 years, respectively [17]. Familial adenomatous polyposis (FAP) is the second most common predisposing genetic syndrome; for these individuals, the lifetime risk of CRC approaches 100% without intervention (eg, colectomy) [16].
People who have inflammatory bowel disease of the colon (both ulcerative colitis and Crohn’s disease) have an increased risk of developing CRC that correlates with the extent and the duration of the inflammation [18]. It is estimated that 18% of patients with a 30-year history of ulcerative colitis will develop CRC [19]. In addition, several studies have found an association between diabetes and increased risk of CRC [20,21]. Though adult-onset type 2 diabetes (the most common type) and CRC share similar risk factors, including physical inactivity and obesity, a positive association between diabetes and CRC has been found even after accounting for physical activity, body mass index, and waist circumference [22].
Being overweight or obese is also associated with a higher risk of CRC, with stronger associations more consistently observed in men than in women. Obesity increases the risk of CRC independent of physical activity. Abdominal obesity (measured by waist circumference) may be a more important risk factor for colon cancer than overall obesity in both men and women [23–25]. Diet and lifestyle strongly influence CRC risk; however, research on the role of specific dietary elements on CRC risk is still accumulating. Several studies, including one by the American Cancer Society, have found that high consumption of red and/or processed meat increases the risk of both colon and rectal cancer [23,26,27]. Further analyses indicate that the association between CRC and red meat may be related to the cooking process, because a higher risk of CRC is observed particularly among those individuals who consume meat that has been cooked at a high temperature for a long period of time [28]. In contrast to findings from earlier research, more recent large, prospective studies do not indicate a major relationship between CRC and vegetable, fruit, or fiber consumption [28,29]. However, some studies suggest that people with very low fruit and vegetable intake are at above-average risk for CRC [30,31]. Consumption of milk and calcium may decrease the risk of developing CRC [28,29,32].
In November 2009, the International Agency for Research on Cancer reported that there is now sufficient evidence to conclude that tobacco smoking causes CRC [33]. Colorectal cancer has been linked to even moderate alcohol use. Individuals who have a lifetime average of 2 to 4 alcoholic drinks per day have a 23% higher risk of CRC than those who consume less than 1 drink per day [34].
Protective Factors
One of the most consistently reported relationships between colon cancer risk and behavior is the protective effect of physical activity [35]. Based on these findings, as well as the numerous other health benefits of regular physical activity, the American Cancer Society recommends engaging in at least moderate activity for 30 minutes or more on 5 or more days per week.
Accumulating research suggests that aspirin-like drugs, postmenopausal hormones, and calcium supplements may help prevent CRC. Extensive evidence suggests that long-term, regular use of aspirin and other nonsteroidal anti-inflammatory drugs (NSAIDs) is asso-ciated with lower risk of CRC. The American Cancer Society does not currently recommend use of these drugs as chemoprevention because of the potential side effects of gastrointestinal bleeding from aspirin and other traditional NSAIDs and heart attacks from selective cyclooxygenase-2 (COX-2) inhibitors. However, people who are already taking NSAIDs for chronic arthritis or aspirin for heart disease prevention may have a lower risk of CRC as a positive side effect [36,37].
There is substantial evidence that women who use postmenopausal hormones have lower rates of CRC than those who do not. A decreased risk of CRC is especially evident in women who use hormones long-term, although the risk returns to that of nonusers within 3 years of cessation. Despite its positive effect on CRC risk, the use of postmenopausal hormones increases the risk of breast and other cancers as well as cardiovascular disease, and therefore it is not recommended for the prevention of CRC. At present, the American Cancer Society does not recommend any medications or supplements to prevent CRC because of uncertainties about their effectiveness, appropriate dosing, and potential toxicity [38–40].
Case Continued
The physician tells the patient that there are several environmental factors that may predispose him to developing CRC. He recommends that the patient follow a healthy lifestyle, including eating 5 servings of fruits and vegetables daily, minimizing consumption of red meats, exercising for 30 minutes at least 5 days per week, drinking only moderate amounts of alcohol, and continuing to take his aspirin in the setting of his diabetes. He also asks the patient if he would be interested in talking about weight loss and working together to make a plan.
The patient is appreciative of this information and wants to know what CRC creening test the physician recommends.
What screening test should be recommended?
Screening Options
There are several modalities for CRC screening, with current technology falling into 2 general categories: stool tests, which include tests for occult blood or exfoliated DNA; and structural exams, which include flexible sigmoidoscopy, colonoscopy, double-contrast barium enema (DCBE), and computed tomographic (CT) colonography. Stool tests are best suited for the detection of CRC, although they also will deliver positive findings for some advanced adenomas, while the structural exams can achieve both detection and prevention of CRC through identification and removal of adenomatous polyps [41]. These tests may be used alone or in combination to improve sensitivity or, in some instances, to ensure a complete examination of the colon if the initial test cannot be completed.
In principle, all adults should have access to the full range of options for CRC screening, and the availability of lower-cost, less invasive options in most practice settings is a public health advantage [11]. However, the availability of multiple testing options can overwhelm the primary care provider and presents challenges for practices in trying to support an office policy that can manage a broad range of testing choices, their follow-up requirements, and shared decision making related to the options. Shared decision making around CRC screening options is both demanding and time consuming and is complicated by the different characteristics of the tests and the test-specific requirements for individuals undergoing screening [42].
Recommended Tests
The joint guideline on screening for CRC from the American Cancer Society, the US Multi-Society Task Force on Colorectal Cancer, and the American College of Radiology (the MSTF guideline) [11] is of the strong opinion that tests designed to detect early cancer and prevent cancer through the detection and removal of adenomatous polyps (the structural exams) should be encouraged if resources are available and patients are willing to undergo an invasive test [11]. In clinical settings in which economic issues preclude primary screening with colonoscopy, or for patients who decline invasive tests, clinicians may offer stool- based testing. However, providers and patients should understand that these tests are less likely to prevent cancer compared with the invasive tests, they must be repeated at regular intervals to be effective (ie, programmatic sensitivity), and if the test is abnormal, a colonoscopy will be needed to follow up. Therefore, if patients are not willing to have repeated testing or pursue colonoscopy if the test is abnormal, these programs will not be effective and should not be recommended [11].
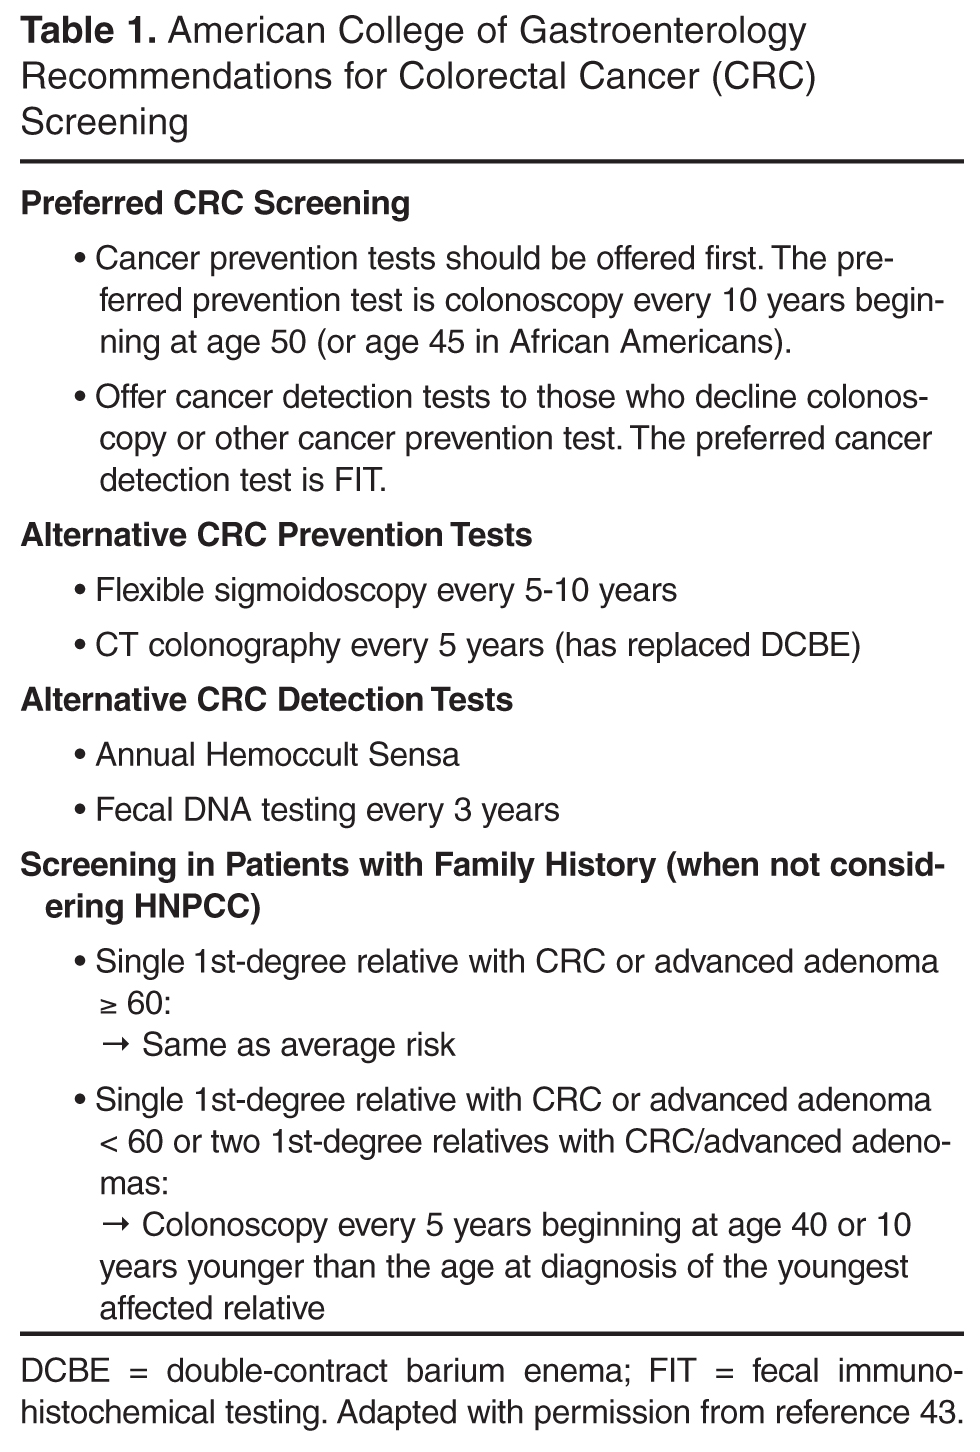
Stool-Based Testing
Stool blood tests are conventionally known as fecal occult blood tests (FOBT) because they are designed to detect the presence of occult blood in stool. FOBT falls into 2 primary categories based on the detected analyte: guaiac-based and FIT. Blood in the stool is a nonspecific finding but may originate from CRC or larger (> 1 to 2 cm) polyps. Because small adenomatous polyps do not tend to bleed and bleeding from cancers or large polyps may be intermittent or undetectable in a single sample of stool, the proper use of stool blood tests requires annual testing that consists of collecting specimens (2 or 3, depending on the product) from consecutive bowel movements [45–47].
Guaiac-based FOBT
Guaiac-based FOBT (gFOBT) is the most common stool blood test for CRC screening and the only CRC screening test for which there is evidence of efficacy from randomized controlled trials [11]. The usual gFOBT protocol consists of collecting 2 samples from each of 3 consecutive bowel movements at home. Prior to testing with a sensitive guaiac-based test, individuals usually will be instructed to avoid aspirin and other NSAIDs, vitamin C, red meat, poultry, fish, and some raw vegetables because of diet-test interactions that can increase the risk of both false-positive and false-negative (specifically, vitamin C) results [48]. Collection of all 3 samples is important because test sensitivity improves with each additional stool sample [41]. Three large randomized controlled trials with gFOBT have demonstrated that screened patients have cancers detected at an early and more curable stage than unscreened patients. Over time (8 to 13 years), each of the trials demonstrated significant reductions in CRC mortality of 15% to 33% [49–51]. However, the reported sensitivity of a single gFOBT varies considerably [52].
FIT
FIT has several technological advantages when compared with gFOBT. FIT detects human globin, a protein that along with heme constitutes human hemoglobin. Thus, FIT is more specific for human blood than guaiac-based tests, which rely on detection of peroxidase in human blood and also react to the peroxidase that is present in dietary constituents such as rare red meat, cruciferous vegetables, and some fruits [53]. Furthermore, unlike gFOBT, FIT is not subject to false-negative results in the presence of high-dose vitamin C supplements, which block the peroxidase reaction. In addition, because globin is degraded by digestive enzymes in the upper gastrointestinal tract, FIT is also more specific for lower gastrointestinal bleeding, thus improving the specificity for CRC. Finally, the sample collection process for patients for some variants of FIT are less demanding than gFOBT, requiring fewer samples or less direct handling of stool, which may increase FIT’s appeal. Although FIT has superior performance characteristics when compared with older guaiac-based Hemoccult II cards [54–56], the spectrum of benefits, limitations, and harms is similar to a gFOBT with high sensitivity [41]. As for adherence with FIT, there were 10% and 12% gains in adherence with FIT in the first 2 randomized controlled trials comparing FIT with guaiac-based testing [57,58]. Therefore, FIT is preferred over Hemoccult Sensa and is the preferred annual cancer detection test when colonoscopy is not an option [43]. The American College of Gastroenterology supports the joint guideline recommendation [11] that older guaiac-based fecal occult blood testing be abandoned as a method for CRC screening.
sDNA
Fecal DNA testing uses knowledge of molecular genomics and provides the basis of a new method of CRC screening that tests stool for the presence of known DNA alterations in the adenoma-carcinoma sequence of colorectal carcinogenesis [11]. Three different types of fecal DNA testing kits have been evaluated. The sensitivity for cancer in each version was superior to traditional guaiac-based occult blood testing, but the sensitivities ranged from 52%–87%, with the specificities ranging from 82%–95%. Based on the accumulation of evidence since the last update of joint guideline, the joint guideline panel concluded that there now are sufficient data to include sDNA as an acceptable option for CRC screening [11].
As for overall recommendations for stool-based testing, the ACG supports the joint guideline recommendation that older guaiac-based fecal occult blood testing be abandoned as a method for CRC screening. Because of more extensive data (compared with Hemoccult Sensa), and the high cost of fecal DNA testing, the American College of Gastroenterology recommends FIT as the preferred cancer detection test in cases where colonoscopy is not an option [43].
Invasive Tests Other than Colonoscopy
The use of flexible sigmoidoscopy for CRC screening is supported by high-quality case-control and cohort studies [46]. The chief advantage of flexible sigmoidoscopy is that it can be performed with a simple preparation (2 enemas), without sedation, and by a variety of practitioners in diverse settings. The main limitation of the procedure is that it does not examine the entire colon but only the rectum, sigmoid, and descending colon. The effectiveness of a flexible sigmoidoscopy program is based on the assumption that if an adenoma is detected during the procedure, the patient would be referred for colonoscopy to examine the entire colon.
DCBE is an imaging modality which can evaluate the entire colon in almost all cases and can detect most cancers and the majority of significant polyps. However, the lower sensitivity for significant adenomas when compared with colonoscopy may result in less favorable outcomes regarding CRC morbidity and mortality. Double-contrast barium enema is no longer recommended as an alternative CRC prevention test because its use has declined dramatically and also as its effectiveness for polyp detection is less than CT colonography [43].
CT Colonography
CT colonography every 5 years is endorsed as an alternative to colonoscopy every 10 years because of its recent performance in the American College of Imaging Network Trial 6664 (also known as the National CT Colonography Trial) [59]. The principle performance feature that justifies inclusion of CT colonography as a viable alternative in patients who decline colonoscopy is that the sensitivity for polyps ≥ 1 cm in size was 90% in the most recent multicenter US trial [59]. In this study, 25% of radiologists who were tested for entry into the trial but performed poorly were excluded from participation, and thus lower sensitivity might be expected in actual clinical practice. CT colonography probably has a lower risk of perforation than colonoscopy in most settings, but for several reasons it is not considered the equivalent of colonoscopy as a screening strategy. First, the evidence to support an effect of endoscopic screening on prevention of incident CRC and mortality is overwhelming compared with that for CT colonography. Second, the inability of CT colonography to adequately detect polyps 5 mm and smaller, which constitutes 80% of colorectal neoplasms, and whose natural history is still not understood, necessitates performance of the test at 5-year rather than 10-year intervals [43]. Finally, false-positives are common, and the specificity for polyps ≥ 1 cm in size was only 86% in the National CT Colonography Trial, with a positive predictive value of 23% [59]. The American College of Gastroenterology recommends that asymptomatic patients be informed of the possibility of radiation risk associated with one or repeated CT colonography studies, though the exact risk associated with radiation is unclear [60,61].
The value of extracolonic findings detected by CT colonography is mixed, with substantial costs associated with incidental findings, but occasional important extracolonic findings are detected, such as asymptomatic cancers and large abdominal aortic aneurysms. As a final point, the ACG is also concerned about the potential impact of CT colonography on adherence with follow-up colonoscopy and thus on polypectomy rates. Thus, if CT colonography substantially improves adherence, it should improve polypectomy rates and thereby reduce CRC, even if only large polyps are detected and referred for colonoscopy. On the other hand, if CT colonography largely displaces patients who would otherwise be willing to undergo colonoscopy, then polypectomy rates will fall substantially, which could significantly increase the CRC incidence [62]. Thus, for multiple reasons and pending additional study, CT colonography should be offered to patients who decline colonoscopy. It should be noted that CT colonography should only be offered for the purposes of CRC screening and should not be used for diagnostic workup of symptoms (eg, patient with active bleeding or inflammatory bowel disease).
When should screening begin?
The American College of Gastroenterology continues to recommend that screening begin at age 50 years in average-risk persons (ie, those without a family history of colorectal neoplasia), except for African Americans, in whom it should begin at age 45 years [43]. The USPSTF does not currently provide specific recommendations based on race or ethnicity, but certain other subgroups of the average-risk population might warrant initiation of screening at an earlier or later age, depending on their risk. For example, the incident risk of CRC has been described to be greater in men than women [63]. In reviewing the literature, the writing committee also identified heavy cigarette smoking and obesity as linked to an increased risk of CRC and to the development of CRC at an earlier age.
For patients with a family history of CRC or adenomatous polyps, the 2008 MSTF guideline recommends initiation of screening at age 40 [11]. The American College of Gastroenterology recommendations for screening in patients with a family history are shown in Table 1. From a practical perspective, many clinicians have found that patients are often not aware of whether their first-degree relatives had advanced adenomas vs. small tubular adenomas, or whether their family members had non-neoplastic vs. neoplastic polyps. Given these difficulties, the American College of Gastroenterology now recommends that adenomas only be counted as equal to a family history of cancer when there is a clear history, or medical report containing evidence, or other evidence to indicate that family members had advanced adenomas (an adenoma ≥ 1 cm in size, or with high-grade dysplasia, or with villous elements) [43]. Continuation of the old recommendation to screen first-degree relatives of patients with only small tubular adenomas could result in most of the population being screened at age 40, with doubtful benefit.
What are screening considerations in patients with genetic syndromes?
Patients with features of an inherited CRC syndrome should be advised to pursue genetic counseling with a licensed genetic counselor and, if appropriate, genetic testing. Individuals with FAP should undergo adenomatous polyposis coli (APC) mutation testing and, if negative, MYH mutation testing. Patients with FAP or at risk of FAP based upon family history should undergo annual colonoscopy until colectomy is deemed by both physician and patient as the best treatment [64]. Patients with a retained rectum after total colectomy and ileorectal anastomosis, ileal pouch, after total proctocolectomy and ileal pouch anal anastomosis, or stoma after total proctocolectomy and end ileostomy, should undergo endoscopic assessment approximately every 6 to 12 months after surgery, depending on the polyp burden seen. Individuals with oligopolyposis (< 100 colorectal polyps) should be sent for genetic counseling, consideration of APC and MYH mutation testing, and individualized colonoscopy surveillance depending on the size, number, and pathology of polyps seen. Upper endoscopic surveillance is recommended in individuals with FAP, but there are no established guidelines for endoscopic surveillance in MAP (MYH-associated polyposis) [43].
Patients who meet the Bethesda criteria for HNPCC [65] can be screened by 2 different mechanisms. One is a DNA-based test for microsatellite instability of either the patient’s or a family member’s tumor. The other mechanism is to assess by immunohistochemical staining for evidence of mismatch repair proteins (eg, MLH1, MSH2, MSH6). In those patients in whom deleterious mutations are found, the affected individual should undergo colonoscopy every 2 years beginning at age 20 to 25 years until age 40 years, then annually thereafter [43]. If genetic testing is negative (ie, no deleterious mutation is found), but the patient is still felt to clinically have Lynch syndrome, then they should still be surveyed in the same way.
Case Continued
The physician recommends colonoscopy as the screening modality as it is the most efficient and accurate way of finding precancerous lesions and the most effective way of preventing CRC by removing precancerous lesions. He also explains that because the patient’s father developed CRC after the age of 60, this does not place the patient in a higher risk category and he can follow screening recommendations for “average-risk” individuals.
Screening
The patient undergoes colonoscopy. Two 5-mm adenomas in the transverse colon are detected and removed.
When should he have a repeat colonoscopy?
Surveillance Intervals
New data have recently emerged on the risk of interval cancer after colonoscopy. The overall rate of interval cancer is estimated to be 1.1–2.7 per 1000 person-years of follow-up. There are several reasons that may account for why patients develop interval cancers: (1) important lesions may be missed at baseline colonoscopy, (2) adenomas may be incompletely removed at the time of baseline colonoscopy, and (3) interval CRC may be biologically different or more aggressive than prevalent CRC. In order to minimize the risk of interval cancer development, it is important to perform a high-quality baseline screening colonoscopy examination as this is associated with lowering the risk of interval cancer [66]. A high-quality colonoscopy entails completion of the procedure to the cecum (with photodocumentation of the appendiceal orifice and ileocecal valve) with careful inspection of folds including adequate bowel cleanliness and a withdrawal time > 6 minutes.
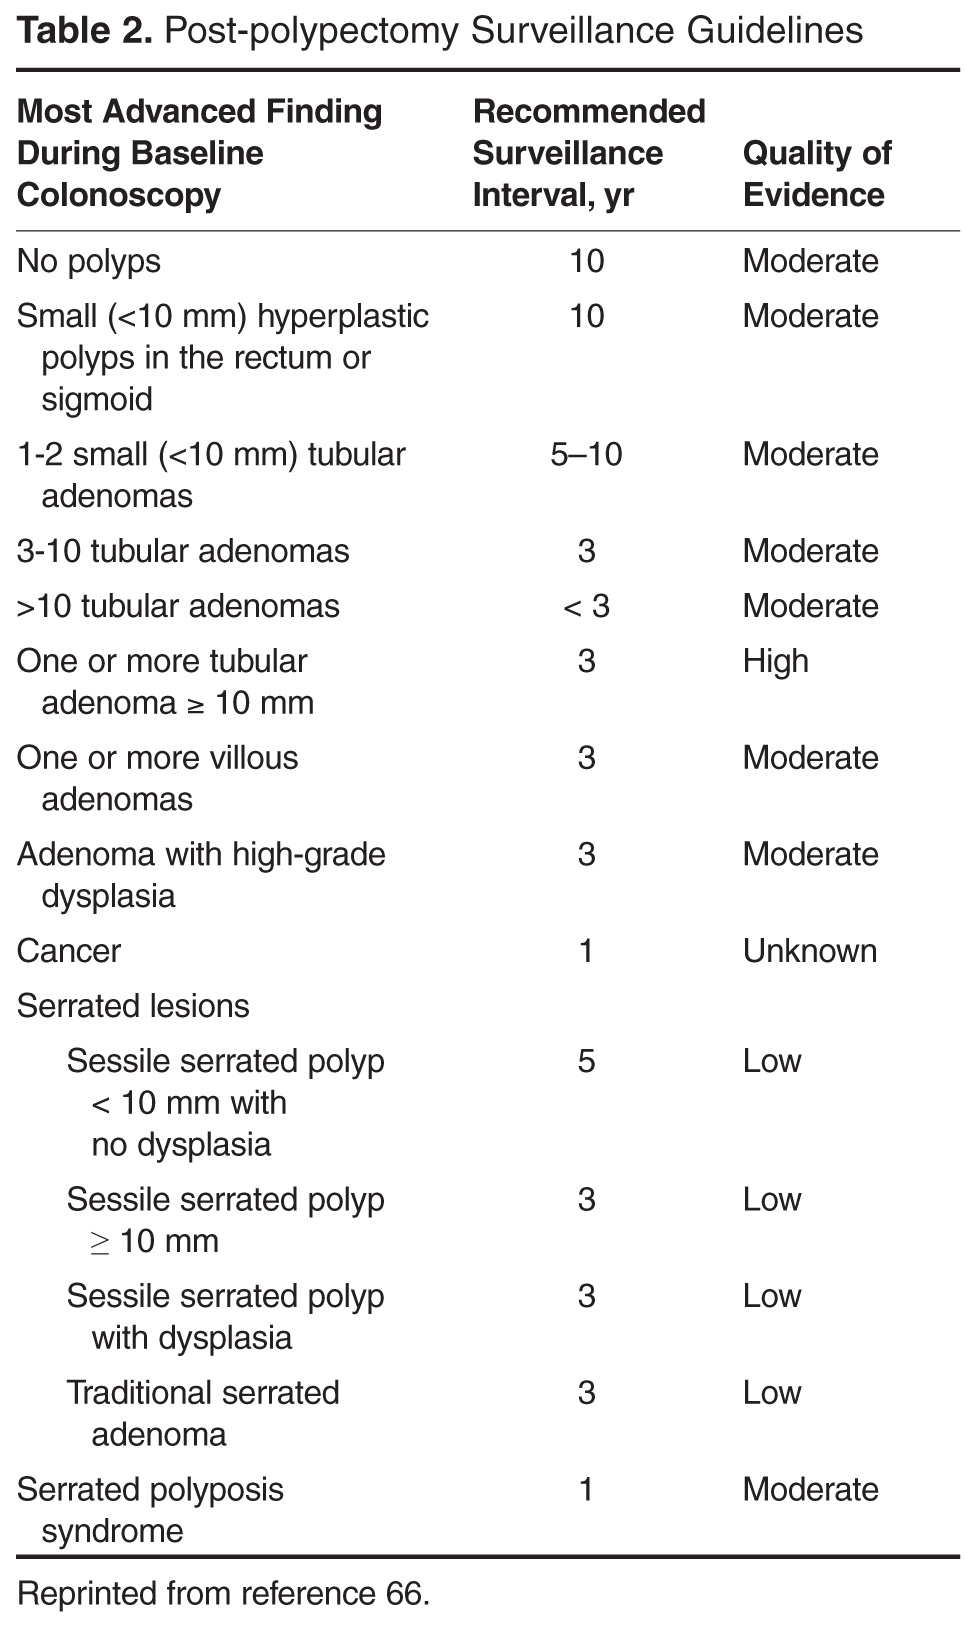
Baseline Colonoscopy Findings
No Polyps
Several prospective observational studies in different populations have shown that the risk of advanced adenomas within 5 years after negative findings on colonoscopy is low (1.3%–2.4%) relative to the rate on initial screening examination (4%–10%) [68–73]. In these studies, interval cancers were rare within 5 years. A sigmoidoscopy randomized controlled trial performed in the United Kingdom demonstrated a reduction in CRC incidence and mortality at 10 years in patients who received one-time sigmoidoscopy compared with controls—a benefit limited to the distal colon [46]. This is the first randomized study to show the effectiveness of endoscopic screening, an effect that appears to have at least a 10-year duration [74]. Thus, in patients who have a baseline colonoscopic evaluation without any adenomas or polyps and are average-risk individuals, the recommendation for the next examination is in 10 years [66].
Distal Hyperplastic Polyps < 10 mm
There is considerable evidence that patients with only rectal or sigmoid hyperplastic polyps (HPs) appear to represent a low-risk cohort. Studies have focused on whether the finding in the distal colon was a marker of risk for advanced neoplasia elsewhere and most studies show no such relationship [67]. Prior and current evidence suggests that distal HPs <10 mm are benign without neoplastic potential. If the most advanced lesions at baseline colonoscopy are distal HPs <10 mm, the interval for colonoscopic follow-up should be 10 years [66].
1-2 Tubular Adenomas < 10 mm
Prior evidence suggested that patients with low-risk adenomas (<10 mm, no villous histology or high-grade dysplasia) had a lower risk of developing advanced adenomas during follow-up compared with patients with high risk adenomas (≥ 10mm, villous histology or high -grade dysplasia). At that time in 2006, consensus on the task force was that an interval of 5 years would be acceptable in this low-risk group [75]. Data published since 2006 endorse the assessment that patients with 1–2 tubular adenomas with low-grade dysplasia <10 mm represent a low-risk group. Three new studies suggest that this group may have only a small, nonsignificant increase in risk of advanced neoplasia within 5 years compared with individuals with no baseline neoplasia. The evidence now supports a surveillance interval of longer than 5 years for most patients and can be extended to 10 years based on the quality of the preparation and colonoscopy [66].
3–10 Tubular Adenomas
Two independent meta-analyses in 2006 found that patients with 3 or more adenomas at baseline had an increased RR for adenomas during surveillance, ranging from 1.7 to 4.8 [47,75]. New information from the VA study and the National Cancer Institute Pooling Project also support these prior findings. Patients with 3 or more adenomas have a level of risk for advanced neoplasia similar to other patients with advanced neoplasia (adenoma >10 mm, adenoma with high grade dysplasia) and thus, repeat examination should be performed in 3 years [66,68,76].
> 10 Adenomas
Only a small proportion of patients undergoing screening colonoscopy will have >10 adenomas. The 2006 guidelines for colonoscopy surveillance after polypectomy noted that such patients should be considered for evaluation of hereditary CRC syndromes [67]. Early follow-up surveillance colonoscopy is based on clinical judgment because there is little evidence to support a firm recommendation. At present, the recommendation is to consider follow-up in less than 3 years after a baseline colonoscopy [66].
1 or More Tubular Adenomas ≥ 10mm
The 2006 MSTF guideline reviewed data related to adenoma size, demonstrating that most studies showed a 2- to 5-fold increased risk of advanced neoplasia during follow-up if the baseline examination had one or more adenomas ≥ 10 mm [67]. Newer, additional data shows that patients with one or more adenomas ≥ 10 mm have an increased risk of advanced neoplasia during surveillance compared with those with no neoplasia or small (< 10 mm) adenomas [68,76]. Thus, the recommendations remains that repeat examination should be performed in 3 years [66]. If there is question about complete removal of an adenoma (ie, piecemeal resection), early follow-up colonoscopy is warranted [66].
1 or More Villous Adenomas
The 2006 MSTF guideline considers adenomas with villous histology to be high risk [67]. The NCI Pooling Project analyzed polyp histology as a risk factor for development of interval advanced neoplasia. Compared with patients with tubular adenomas, those with baseline polyp(s) showing adenomas with villous or tubulovillous histology (TVA) had increased risk of advanced neoplasia during follow-up (16.8% vs 9.7%; adjusted OR, 1.28; 95% CI, 1.07–1.52) [76]. Patients with one or more adenomas with villous histology were also found to have an increased risk of advanced neoplasia during surveillance compared with those with no neoplasia or small (<10 mm) tubular adenomas. Thus, the recommendation remains that repeat examination should be performed in 3 years [66].
Adenoma with High-Grade Dysplasia (HGD)
The 2006 MSTF guideline concluded that the presence of HGD in an adenoma was associated with both villous histology and larger size, which are both risk factors for advanced neoplasia during surveillance [67]. In a univariate analysis from the NCI Pooling Project, HGD was strongly associated with risk of advanced neoplasia during surveillance (OR, 1.77; 95% CI, 1.41–2.22) [76]. Thus, the recommendation remains that repeat examination should be performed in 3 years [66].
Serrated Lesions
A total of 20% to 30% of CRCs arise through a molecular pathway characterized by hypermethylation of genes, known as CgG Island Methylator Phenotype (CIMP) [77]. Precursors are believed to be serrated polyps. Tumors in this pathway have a high frequency of BRAF mutation, and up to 50% are microsatellite unstable. CIMP-positive tumors are overrepresented in interval cancers, particularly in the proximal colon. The principal precursor of hypermethylated cancers is probably the sessile serrated polyp (synonymous with sessile serrated adenoma). These polyps are difficult to detect at endoscopy. They may be the same color as surrounding colonic mucosa, have indiscrete edges, are nearly always flat or sessile, and may have a layer of adherent mucus and obscure the vascular pattern.
Recent studies show that proximal colon location or size ≥ 10 mm may be markers of risk for synchronous advanced adenomas elsewhere in the colon [78,79]. Surveillance after colonoscopy was evaluated in one study, which found that coexisting serrated polyps and high-risk adenomas (HRA; ie, size ≥ 10 mm, villous histology, or presence of HGD) is associated with a higher risk of advanced neoplasia at surveillance [78]. This study also found that if small proximal serrated polyps are the only finding at baseline, the risk of adenomas during surveillance is similar to that of patients with low-risk adenomas (LRA; ie, 1–2 small adenomas).
The current evidence suggests that size (>10 mm), histology (a sessile serrated polyp is a more significant lesion than an HP; a sessile serrated polyp with cytological dysplasia is more advanced than a sessile serrated polyp without dysplasia), and location (proximal to the sigmoid colon) are risk factors that might be associated with higher risk of CRC. A sessile serrated polyp ≥ 10 mm and a sessile serrated polyp with cytological dysplasia should be managed like a HRA with repeat colonoscopy occurring in 3 years. Serrated polyps that are <10 mm in size and do not have cytological dysplasia may have lower risk and can be managed like LRA with repeat colonoscopy occurring in 5 years [66].
Follow-up After Surveillance
In a 2009 study, 564 participants underwent 2 surveillance colonoscopies after an index procedure and 10.3% had high-risk findings at the third study examination. If the second examination showed high-risk findings, then results from the first examination added no significant information about the probability of high-risk findings on the third examination (18.2% for high-risk findings on the first examination vs. 20.0% for low-risk findings on the first examination; P = 0.78). If the second examination showed no adenomas, then the results from the first examination added significant information about the probability of high-risk findings on the third exam-ination (12.3% if the first examination had high-risk findings vs. 4.9% if the first examination had low-risk findings; P = 0.015) [80]. Thus, information from 2 previous colonoscopies appears to be helpful in defining the risk of neoplasia for individual patients and in the future, guidelines might consider accounting for the results of 2 exams to tailor surveillance intervals for patients.
When should screening / surveillance be stopped?
There is considerable new evidence that the risks of colonoscopy increase with advancing age [81,82]. Neither surveillance nor screening colonoscopy should be performed when the risk of the preparation, sedation, or procedure outweighs the potential benefit. For patients aged 75–85 years, the USPSTF recommends against routine screening but argues for individualization based on comorbidities and findings on any prior colonoscopy. The USPSTF recommends against continued screening after age 85 years because risk could exceed potential benefit [44].
In terms of surveillance of prior adenomas, the 75-85 year age group may still benefit from surveillance because patients with prior HRA are at higher risk for developing advanced neoplasia compared with average-risk screenees. However, the decision to continue surveillance in this population should be individualized and based on an assessment of benefit and risk in the context of the person’s estimated life expectancy [66]. More importantly, it should be noted that an individual’s most important and impactful screening colonoscopy is his or her first one and therefore, from a public health standpoint, great effort should be taken to increase the number of people in a population who undergo screening rather than simply targeting those who need surveillance for prior polyps. This is ever true in settings with limited resources.
Case Conclusion
The physician discusses the findings from the colonoscopy (2 small adenomas) with the patient and recommends a repeat colonoscopy in 5 to 10 years.
Summary
Colorectal cancer is one of the leading causes of cancer-related death in the United States. Since the advent of colonoscopy and the implementation of CRC screening efforts, the rates of CRC have started to decline. There are several environmental factors which have been associated with the development of CRC including obesity, dietary intake, physical activity and smoking. At present, there are multiple tools available for CRC prevention, but the most accurate and effective method is currently colonoscopy. Stool-based tests like FIT should be offered when a patient declines colonoscopy. For those interested in colonoscopy, average-risk individuals should be screened starting at the age of 50 with subsequent examinations every 10 years. Surveillance examinations should occur based on polyp findings on index colonoscopy. There is no recommendation to continue screening after the age of 75, though physicians can determine this based on patients health and risk/benefit profile. Current guidelines recommend against offering any screening to patients over the age of 85. Despite these recommendations, almost half of the eligible screening population has yet to undergo appropriate CRC screening. Future work should include public health efforts to improve access and appeal of widespread CRC screening regardless of modality. While colonoscopy is considered the most effective screening test, the best test is still the one the patient gets.
Corresponding author: Audrey H. Calderwood, MD, MS, 85 E. Concord St., Rm. 7724, Boston, MA 02118, [email protected].
Financial disclosures: None.
1. American Cancer Society. Colorectal cancer facts & figures 2014–2016. Atlanta: American Cancer Society; 2014.
2. Ries L, Melbert D, Krapcho M, et al. SEER cancer statistics review, 1975–2011. Bethesda, MD: National Cancer Institute; 2014.
3. Levine JS, Ahnen DJ. Clinical practice. Adenomatous polyps of the colon. N Engl J Med 2006;355:2551–7.
4. Bond JH. Polyp guideline: diagnosis, treatment, and surveillance for patients with colorectal polyps. Practice Parameters Committee of the American College of Gastroenterology. Am J Gastroenterol 2000;95:3053–63.
5. Schatzkin A, Freedman LS, Dawsey SM, Lanza E. Interpreting precursor studies: what polyp trials tell us about large-bowel cancer. J Natl Cancer Inst 1994;86:1053–7.
6. DevCan: Probability of developing or dying of cancer software, version 6.5.0; Statistical Research and Applications Branch, National Cancer Institute, 2005. http://srab.cancer.gov/devcan [computer program].
7. Surveillance, Epidemiology, and End Results (SEER) Program (www.seer.cancer.gov), National Cancer Institute, DCCPS, Surveillance Research Program, Cancer Statistics Branch, released April 2010, based on the November 2009 submission.
8. Murphy G, Devesa SS, Cross AJ, et al. Sex disparities in colorectal cancer incidence by anatomic subsite, race and age. Int J Cancer 2011;128:1668–7.
9. Edwards BK, Ward E, Kohler BA, et al. Annual report to the nation on the status of cancer, 1975-2006, featuring colorectal cancer trends and impact of interventions (risk factors, screening, and treatment) to reduce future rates. Cancer 2010;116:544–73.
10. Irby K, Anderson WF, Henson DE, Devesa SS. Emerging and widening colorectal carcinoma disparities between Blacks and Whites in the United States (1975-2002). Cancer Epidemiol Biomarkers Prev 2006;15:792–7.
11. Levin B, Lieberman DA, McFarland B, et al. Screening and surveillance for the early detection of colorectal cancer and adenomatous polyps, 2008: a joint guideline from the American Cancer Society, the US Multi-Society Task Force on Colorectal Cancer, and the American College of Radiology. CA Cancer J Clin 2008;58:130–60.
12. Kirkegaard H, Johnsen NF, Christensen J, et al. Association of adherence to lifestyle recommendations and risk of colorectal cancer: a prospective Danish cohort study. BMJ 2010;341:c5504.
13. Butterworth AS, Higgins JP, Pharoah P. Relative and absolute risk of colorectal cancer for individuals with a family history: a meta-analysis. Eur J Cancer 2006;42:216–27.
14. Johns LE, Houlston RS. A systematic review and meta-analysis of familial colorectal cancer risk. Am J Gastroenterol 2001;96:2992–3003.
15. Lynch HT, de la Chapelle A. Hereditary colorectal cancer. N Engl J Med 2003;348:919–32.
16. Jasperson KW, Tuohy TM, Neklason DW, Burt RW. Hereditary and familial colon cancer. Gastroenterology 2010;138:2044–58.
17. Stoffel E, Mukherjee B, Raymond VM, et al. Calculation of risk of colorectal and endometrial cancer among patients with Lynch syndrome. Gastroenterology 2009;137:1621–7.
18. Bernstein CN, Blanchard JF, Kliewer E, Wajda A. Cancer risk in patients with inflammatory bowel disease: a population-based study. Cancer 2001;91:854–62.
19. Eaden JA, Abrams KR, Mayberry JF. The risk of colorectal cancer in ulcerative colitis: a meta-analysis. Gut 2001;48:526–35.
20. Larsson SC, Orsini N, Wolk A. Diabetes mellitus and risk of colorectal cancer: a meta-analysis. J Natl Cancer Inst 2005;97:1679–87.
21. Campbell PT, Deka A, Jacobs EJ, et al. Prospective study reveals associations between colorectal cancer and type 2 diabetes mellitus or insulin use in men. Gastroenterology 2010;139:1138–46.
22. Larsson SC, Giovannucci E, Wolk A. Diabetes and colorectal cancer incidence in the cohort of Swedish men. Diabetes Care 2005;28:1805–7.
23. Huxley RR, Ansary-Moghaddam A, Clifton P, et al. The impact of dietary and lifestyle risk factors on risk of colorectal cancer: a quantitative overview of the epidemiological evidence. Int J Cancer 2009;125:171–80.
24. Larsson SC, Wolk A. Obesity and colon and rectal cancer risk: a meta-analysis of prospective studies. Am J Clin Nutr 2007;86:556–65.
25. Wang Y, Jacobs EJ, Patel AV, et al. A prospective study of waist circumference and body mass index in relation to colorectal cancer incidence. Cancer Causes Control 2008;19:783–92.
26. Chao A, Thun MJ, Connell CJ, et al. Meat consumption and risk of colorectal cancer. JAMA 2005;293:172–82.
27. Cross AJ, Ferrucci LM, Risch A, et al. A large prospective study of meat consumption and colorectal cancer risk: an investigation of potential mechanisms underlying this association. Cancer Res 2010;70:2406–14.
28. Chan AT, Giovannucci EL. Primary prevention of colorectal cancer. Gastroenterology 2010;138:2029–43.
29. Food, nutrition, physical activity, and the prevention of cancer: a global perspective. Washington DC: World Cancer Research Fund/American Institute for Cancer Research; 2007.
30. McCullough ML, Robertson AS, Chao A, et al. A prospective study of whole grains, fruits, vegetables and colon cancer risk. Cancer Causes Control 2003;14:959–70.
31. Terry P, Giovannucci E, Michels KB, et al. Fruit, vegetables, dietary fiber, and risk of colorectal cancer. J Natl Cancer Inst 2001;93:525–33.
32. Cho E, Smith-Warner SA, Spiegelman D, et al. Dairy foods, calcium, and colorectal cancer: a pooled analysis of 10 cohort studies. J Natl Cancer Inst 2004;96:1015–22.
33. Secretan B, Straif K, Baan R, et al. A review of human carcinogens--Part E: tobacco, areca nut, alcohol, coal smoke, and salted fish. Lancet Oncol 2009;10:1033–4.
34. Ferrari P, Jenab M, Norat T, et al. Lifetime and baseline alcohol intake and risk of colon and rectal cancers in the European prospective investigation into cancer and nutrition (EPIC). Int J Cancer 2007;121:2065–72.
35. Samad AK, Taylor RS, Marshall T, Chapman MA. A meta-analysis of the association of physical activity with reduced risk of colorectal cancer. Colorectal Dis 2005;7:204–13.
36. Flossmann E, Rothwell PM. Effect of aspirin on long-term risk of colorectal cancer: consistent evidence from randomised and observational studies. Lancet 2007;369:1603–13.
37. Rothwell PM, Wilson M, Elwin CE, et al. Long-term effect of aspirin on colorectal cancer incidence and mortality: 20-year follow-up of five randomised trials. Lancet 2010;376:1741–50.
38. Hildebrand JS, Jacobs EJ, Campbell PT, et al. Colorectal cancer incidence and postmenopausal hormone use by type, recency, and duration in cancer prevention study II. Cancer Epidemiol Biomarkers Prev 2009;18:2835–41.
39. Heiss G, Wallace R, Anderson GL, et al. Health risks and benefits 3 years after stopping randomized treatment with estrogen and progestin. JAMA 2008;299:1036–45.
40. Rossouw JE, Anderson GL, Prentice RL, et al. Risks and benefits of estrogen plus progestin in healthy postmenopausal women: principal results From the Women’s Health Initiative randomized controlled trial. JAMA 2002;288:321–33.
41. Lieberman DA,Weiss DG. One-time screening for colorectal cancer with combined fecal occult-blood testing and examination of the distal colon. N Engl J Med 2001;345:555–60.
42. Lafata JE, Divine G, Moon C,Williams LK. Patient-physician colorectal cancer screening discussions and screening use. Am J Prev Med 2006;31:202–9.
43. Rex DK, Johnson DA, Andersone JC, et al. American College of Gastroenterology guidelines for colorectal cancer screening 2008. Am J Gastroenterol 2009;104:739–50.
44. U.S. Preventive Services Task Force. Screening for colorectal cancer: U.S. Preventive Services Task Force recommendation statement. Ann Intern Med 2008;149:627–37.
45. Smith RA, von Eschenbach AC,Wender R, et al. American Cancer Society guidelines for the early detection of cancer: update of early detection guidelines for prostate, colorectal, and endometrial cancers. Also: update 2001—testing for early lung cancer detection. CA Cancer J Clin 2001;51:38–75.
46. Winawer S, Fletcher R, Rex D, et al. Colorectal cancer screening and surveillance: clinical guidelines and rationale—update based on new evidence. Gastroenterology 2003;124:544–60.
47. Rex DK, Kahi CJ, Levin B, et al. Guidelines for colonoscopy surveillance after cancer resection: a consensus update by the American Cancer Society and the US Multi-Society Task Force on Colorectal Cancer. Gastroenterology 2006;130:1865–71.
48. Ransohoff DF, Lang CA. Screening for colorectal cancer with the fecal occult blood test: a background paper. American College of Physicians. Ann Intern Med 1997;126:811–22.
49. Hardcastle JD, Chamberlain JO, Robinson MH, et al. Randomised controlled trial of faecal-occult blood screening for colorectal cancer. Lancet 1996;348:1472–7.
50. Kronborg O, Fenger C, Olsen J, et al. Randomised study of screening for colorectal cancer with faecal-occult blood test. Lancet 1996;348:1467–71.
51. Wilson JMG, Junger G. Principles and practice of screening for disease. Geneva: World Health Organization; 1968.
52. Allison JE, Tekawa IS, Ransom LJ, Adrain AL. A comparison of fecal occult-blood tests for colorectal-cancer screening. N Engl J Med 1996;334:155–9.
53. Caligiore P, Macrae FA, St John DJ, et al. Peroxidase levels in food: relevance to colorectal cancer screening. Am J Clin Nutr 1982;35:1487–9.
54. Nakajima M, Saito H, Soma Y, et al. Prevention of advanced colorectal cancer by screening using the immunochemical faecal occult blood test: a case-control study. Br J Cancer 2003;89:23–8.
55. Lee KJ, Inoue M, Otani T, et al. Colorectal cancer screening using fecal occult blood test and subsequent risk of colorectal cancer: a prospective cohort study in Japan. Cancer Detect Prev 2007;31:3–11.
56. Zappa M, Csatiglione G, Gazzini G, et al. Effect of faecal occult blood testing on colorectal mortality: results of a population-based case-control study in the district of Florence, Italy. Int J Cancer 1997;73:208–10.
57. van Rossum LG, van Rijn AF, Laheij RJ, et al. Random comparison of guaiac and immunochemical fecal occult blood tests for colorectal cancer in a screening population. Gastroenterology 2008;135:82–90.
58. Hol L, van Leerdam ME, van Ballegooijen M, et al. Attendance to screening for colorectal cancer in the Netherlands; randomized controlled trial comparing two different forms of faecal occult blood tests and sigmoidoscopy. Gastroenterology 2008;134:A87.
59. Johnson CD, Chen MH, Toledano AY, et al. Accuracy of CT colonography for detection of large adenomas and cancers.
N Engl J Med 2008;359:1207–17.
60. Brenner DJ, Georgsson MA. Mass screening with CT colonography: should the radiation exposure be of concern? Gastroenterology 2005;129:328–37.
61. Brenner DJ, Hall EJ. Computed tomography—an increasing source of radiation exposure. N Engl J Med 2007;35: 2277–84.
62. Hur C, Chung DC, Schoen RE, et al. The management of small polyps found by virtual colonoscopy: results of a decision analysis. Clin Gastroenterol Hepatol 2007;5:237–44.
63. Chu KC, Tarone RE, Chow WH, et al. Temporal patterns in colorectal cancer incidence, survival, and mortality from 1950 through 1990. J Natl Cancer Inst 1994;86:997–1006.
64. Vasen HF, Moslein G, Alonso A, et al. Guidelines for the clinical management of familial adenomatous polyposis (FAP). Gut 2008;57:704–13.
65. Umar A, Boland CR, Terdiman PJ, et al. Revised Bethesda guidelines for hereditary nonpolyposis colorectal Cancer (Lynch syndrome) and microsatellite instability. J Natl Cancer Inst 2004;96:261–8.
66. Lieberman DA, Rex DR, Winawer SJ, et al. Guidelines for colonoscopy surveillance after screening and polypectomy: a consensus update by the US Multi-Society Task Force on Colorectal Cancer. Gastroenterology 2012;143:844–57.
67. Winawer SJ, Zauber AG, Fletcher RH, et al. Guidelines for colonoscopy surveillance after polypectomy: a consensus update by the US Multi-Society Task Force on colorectal cancer and the American Cancer Society. Gastroenterology 2006;130:1872–85.
68. Lieberman DA, Weiss DG, Harford WV, et al. Five year colon surveillance after screening colonoscopy. Gastroenterology 2007;133:1077–85.
69. Imperiale TF, Glowinski EA, Lin-Cooper C, et al. Five-year risk of colorectal neoplasia after negative screening colonoscopy. N Engl J Med 2008;359:1218–24.
70. Leung WK, Lau JYW, Suen BY, et al. Repeat screening colonoscopy 5 years after normal baseline screening colonoscopy in average-risk Chinese: a prospective study. Am J Gastroenterol 2009;104:2028–34.
71. Brenner H, Haug U, Arndt V, et al. Low risk of colorectal cancer and advanced adenomas more than 10 years after negative colonoscopy. Gastroenterology 2010;138:870–6.
72. Miller H, Mukherjee R, Tian J, et al. Colonoscopy surveillance after polypectomy may be extended beyond five years. J Clin Gastroenterol 2010;44:e162–e166.
73. Chung SJ, Kim YS, Yang SY, et al. Five-year risk for advanced colorectal neoplasia after initial colonoscopy according to the baseline risk stratification: a prospective study in 2452 asymptomatic Koreans. Gut 2011;60:1537–43.
74. Atkin WS, Edwards R, Kralj-Hans I, et al. Once-only flexible sigmoidoscopy screening in prevention of colorectal cancer: a multicentre randomised controlled trial. Lancet 2010;375:1624–33.
75. Saini SD, Kim HM, Schoenfeld P. Incidence of advanced adenomas at surveillance colonoscopy in patients with a personal history of colon adenomas: a meta-analysis and systematic review. Gastrointest Endosc 2006;64:614–26.
76. Martinez ME, Baron JA, Lieberman DA, et al. A pooled analysis of advanced colorectal neoplasia diagnoses following colonoscopic polypectomy. Gastroenterology 2009;136:832–41.
77. Leggett B, Whitehall V. Role of the serrated pathway in colorectal cancer pathogenesis. Gastroenterology 2010;138:
2088–100.
78. Schreiner MA, Weiss DG, Lieberman DA. Proximal and large nonneoplastic serrated polyps: association with synchronous neoplasia at screening colonoscopy and with interval neoplasia at follow- up colonoscopy. Gastroenterology 2010;139:1497–502.
79. Hiraoka S, Kato J, Fujiki S, et al. The presence of large serrated polyps increases risk for colorectal cancer. Gastroenterology 2010;139:1503–10.
80. Robertson DJ, Burke CA, Welch HG, et al. Using the results of a baseline and a surveillance colonoscopy to predict recurrent adenomas with high-risk characteristics. Ann Intern Med 2009;151:103–9.
81. Warren JL, Klabunde CN, Mariotto AB, et al. Adverse events after outpatient colonoscopy in the Medicare population. Ann Intern Med 2009;150:849–57.
82. Ko CW, Riffle S, Michaels L, et al. Serious complications within 30 days of screening and surveillance colonoscopy: a multicenter study. Clin Gastroenterol Hepatol 2010;8:166–73.
From the Boston University School of Medicine, Boston, MA.
Abstract
- Objective: To review recommendations for colorectal cancer (CRC) screening.
- Methods: Review of the literature.
- Results: In the United States, CRC is the third most commonly diagnosed cancer and the third leading cause of cancer death. CRC screening can reduce mortality through the detection of early-stage disease and the detection and removal of adenomatous polyps. There are several modalities for CRC screening, with current technology falling into 2 general categories: stool tests, which include tests for occult blood or exfoliated DNA; and structural exams, which include flexible sigmoidoscopy, colonoscopy, double-contrast barium enema, and CT colonography. The preferred CRC prevention test for average-risk individuals is colonoscopy starting at age 50 with subsequent examinations every 10 years. Patients unwilling to undergo screening colonoscopy may be offered flexible sigmoidoscopy, CT colonography, or fecal immunohistochemical test. Surveillance examinations should occur based on polyp findings on index colonoscopy. There is no recommendation to continue screening after age 75, though physicians can make a determination based on a patient’s health and risk/benefit profile. Current guidelines recommend against offering screening to patients over age 85.
- Conclusion: Increasing access to and utilization of CRC screening tests is likely to lead to improvements in mortality reduction, as only about half of people aged 50 or older report having received CRC testing consistent with current guidelines.
In the United States, colorectal cancer (CRC) is the third most commonly diagnosed cancer and the third leading cause of cancer death in both men and women [1]. In 2014, an estimated 136,830 people were diagnosed with CRC and about 50,310 people died of the disease [2]. Colorectal cancer usually develops slowly over a period of 10 to 15 years. The tumor typically begins as a noncancerous polyp, classically an adenomatous polyp or adenoma, though fewer than 10% of adenomas will progress to cancer [3]. Adenomas are common; an estimated one-third to one-half of all individuals will eventually develop 1 or more adenomas [4,5]. In the United States, the lifetime risk of being diagnosed with CRC is approximately 5% for both men and women [6]. Incidence rates for CRC increase with age, with an incidence rate more than 15 times higher in adults aged 50 years and older compared with those aged 20 to 49 years [7].
Certain demographic subgroups have been shown to be at higher risk. Overall, CRC incidence and mortality rates are about 35% to 40% higher in men than in women. The reasons for this are not completely understood but likely reflect complex interactions between gender-related differences in exposure to hormones and risk factors [8]. CRC incidence and mortality rates are highest in African-American men and women; incidence rates are 20% higher and mortality rates are about 45% higher than those in whites. Prior to 1989, incidence rates were predominantly higher in white men than in African American men and were similar for women of both races. Since that time, although incidence rates have declined as a whole [9], incidence rates have been higher for African Americans than whites in both men and women This crossover likely reflects a combination of greater access to and utilization of recommended screening tests among whites (resulting in detection and removal of precancerous polyps), as well as racial differences in trends for CRC risk factors [10].
CRC screening can reduce mortality through the detection of early-stage disease and the detection and removal of ademomatous polyps [11]. Increasing access to and utilization of CRC screening tests is likely to lead to improvements in mortality reduction, as only about half of people aged 50 or older report having received CRC testing consistent with current guidelines [1].
Case Study
Initial Presentation
A 55-year-old white male presents for a routine visit and asks about colon cancer screening. His father was diagnosed with colon cancer at the age of 78. Overall, he feels well and does not have any particular complaints. His bowel habits are normal and he denies melena and hematochezia. His past medical history is significant for diabetes, hypertension, and obesity. He was a previous smoker and has a few alcoholic drinks on the weekends. His physical exam is unremarkable. Results of recent blood work are normal and there is no evidence of anemia.
What are this patient’s risk factors for developing colon cancer?
Risk Factors for CRC
There are numerous factors that are thought to influence risk for CRC. Nonmodifiable risk factors include a personal or family history of CRC or adenomatous polyps, and a personal history of chronic inflammatory bowel disease. Modifiable risk factors that have been associated with an increased risk of CRC in epidemiologic studies include physical inactivity, obesity, high consumption of red or processed meats, smoking, and moderate-to-heavy alcohol consumption. In fact, a prospective study showed that up to 23% of colorectal cancers were considered to be potentially avoidable by adhering to multiple healthy lifestyle recommendations including maintaining a healthy weight, being physically active at least 30 minutes per day, eating a healthy diet, and avoiding smoking and drinking excessive amounts of alcohol [12].
People with a first-degree relative (parent, sibling, or offspring) who has had CRC have 2 to 3 times the risk of developing the disease compared with individuals with no family history; if the relative was diagnosed at a young age or if there is more than 1 affected relative, risk increases to 3 to 6 times that of the general population [13,14]. About 5% of patients with CRC have a well-defined genetic syndrome that causes the disease [15]. The most common of these is Lynch syndrome (also known as hereditary nonpolyposis colorectal cancer or HNPCC), which accounts for 2% to 4% of all CRC cases [16]. Although individuals with Lynch syndrome are predisposed to numerous types of cancer, risk of CRC is highest. A recent study of CRC in 147 Lynch syndrome families in the United States found lifetime risk of CRC to be 66% in men and 43% in women, with a median age at diagnosis of 42 years and 47 years, respectively [17]. Familial adenomatous polyposis (FAP) is the second most common predisposing genetic syndrome; for these individuals, the lifetime risk of CRC approaches 100% without intervention (eg, colectomy) [16].
People who have inflammatory bowel disease of the colon (both ulcerative colitis and Crohn’s disease) have an increased risk of developing CRC that correlates with the extent and the duration of the inflammation [18]. It is estimated that 18% of patients with a 30-year history of ulcerative colitis will develop CRC [19]. In addition, several studies have found an association between diabetes and increased risk of CRC [20,21]. Though adult-onset type 2 diabetes (the most common type) and CRC share similar risk factors, including physical inactivity and obesity, a positive association between diabetes and CRC has been found even after accounting for physical activity, body mass index, and waist circumference [22].
Being overweight or obese is also associated with a higher risk of CRC, with stronger associations more consistently observed in men than in women. Obesity increases the risk of CRC independent of physical activity. Abdominal obesity (measured by waist circumference) may be a more important risk factor for colon cancer than overall obesity in both men and women [23–25]. Diet and lifestyle strongly influence CRC risk; however, research on the role of specific dietary elements on CRC risk is still accumulating. Several studies, including one by the American Cancer Society, have found that high consumption of red and/or processed meat increases the risk of both colon and rectal cancer [23,26,27]. Further analyses indicate that the association between CRC and red meat may be related to the cooking process, because a higher risk of CRC is observed particularly among those individuals who consume meat that has been cooked at a high temperature for a long period of time [28]. In contrast to findings from earlier research, more recent large, prospective studies do not indicate a major relationship between CRC and vegetable, fruit, or fiber consumption [28,29]. However, some studies suggest that people with very low fruit and vegetable intake are at above-average risk for CRC [30,31]. Consumption of milk and calcium may decrease the risk of developing CRC [28,29,32].
In November 2009, the International Agency for Research on Cancer reported that there is now sufficient evidence to conclude that tobacco smoking causes CRC [33]. Colorectal cancer has been linked to even moderate alcohol use. Individuals who have a lifetime average of 2 to 4 alcoholic drinks per day have a 23% higher risk of CRC than those who consume less than 1 drink per day [34].
Protective Factors
One of the most consistently reported relationships between colon cancer risk and behavior is the protective effect of physical activity [35]. Based on these findings, as well as the numerous other health benefits of regular physical activity, the American Cancer Society recommends engaging in at least moderate activity for 30 minutes or more on 5 or more days per week.
Accumulating research suggests that aspirin-like drugs, postmenopausal hormones, and calcium supplements may help prevent CRC. Extensive evidence suggests that long-term, regular use of aspirin and other nonsteroidal anti-inflammatory drugs (NSAIDs) is asso-ciated with lower risk of CRC. The American Cancer Society does not currently recommend use of these drugs as chemoprevention because of the potential side effects of gastrointestinal bleeding from aspirin and other traditional NSAIDs and heart attacks from selective cyclooxygenase-2 (COX-2) inhibitors. However, people who are already taking NSAIDs for chronic arthritis or aspirin for heart disease prevention may have a lower risk of CRC as a positive side effect [36,37].
There is substantial evidence that women who use postmenopausal hormones have lower rates of CRC than those who do not. A decreased risk of CRC is especially evident in women who use hormones long-term, although the risk returns to that of nonusers within 3 years of cessation. Despite its positive effect on CRC risk, the use of postmenopausal hormones increases the risk of breast and other cancers as well as cardiovascular disease, and therefore it is not recommended for the prevention of CRC. At present, the American Cancer Society does not recommend any medications or supplements to prevent CRC because of uncertainties about their effectiveness, appropriate dosing, and potential toxicity [38–40].
Case Continued
The physician tells the patient that there are several environmental factors that may predispose him to developing CRC. He recommends that the patient follow a healthy lifestyle, including eating 5 servings of fruits and vegetables daily, minimizing consumption of red meats, exercising for 30 minutes at least 5 days per week, drinking only moderate amounts of alcohol, and continuing to take his aspirin in the setting of his diabetes. He also asks the patient if he would be interested in talking about weight loss and working together to make a plan.
The patient is appreciative of this information and wants to know what CRC creening test the physician recommends.
What screening test should be recommended?
Screening Options
There are several modalities for CRC screening, with current technology falling into 2 general categories: stool tests, which include tests for occult blood or exfoliated DNA; and structural exams, which include flexible sigmoidoscopy, colonoscopy, double-contrast barium enema (DCBE), and computed tomographic (CT) colonography. Stool tests are best suited for the detection of CRC, although they also will deliver positive findings for some advanced adenomas, while the structural exams can achieve both detection and prevention of CRC through identification and removal of adenomatous polyps [41]. These tests may be used alone or in combination to improve sensitivity or, in some instances, to ensure a complete examination of the colon if the initial test cannot be completed.
In principle, all adults should have access to the full range of options for CRC screening, and the availability of lower-cost, less invasive options in most practice settings is a public health advantage [11]. However, the availability of multiple testing options can overwhelm the primary care provider and presents challenges for practices in trying to support an office policy that can manage a broad range of testing choices, their follow-up requirements, and shared decision making related to the options. Shared decision making around CRC screening options is both demanding and time consuming and is complicated by the different characteristics of the tests and the test-specific requirements for individuals undergoing screening [42].
Recommended Tests
The joint guideline on screening for CRC from the American Cancer Society, the US Multi-Society Task Force on Colorectal Cancer, and the American College of Radiology (the MSTF guideline) [11] is of the strong opinion that tests designed to detect early cancer and prevent cancer through the detection and removal of adenomatous polyps (the structural exams) should be encouraged if resources are available and patients are willing to undergo an invasive test [11]. In clinical settings in which economic issues preclude primary screening with colonoscopy, or for patients who decline invasive tests, clinicians may offer stool- based testing. However, providers and patients should understand that these tests are less likely to prevent cancer compared with the invasive tests, they must be repeated at regular intervals to be effective (ie, programmatic sensitivity), and if the test is abnormal, a colonoscopy will be needed to follow up. Therefore, if patients are not willing to have repeated testing or pursue colonoscopy if the test is abnormal, these programs will not be effective and should not be recommended [11].
Stool-Based Testing
Stool blood tests are conventionally known as fecal occult blood tests (FOBT) because they are designed to detect the presence of occult blood in stool. FOBT falls into 2 primary categories based on the detected analyte: guaiac-based and FIT. Blood in the stool is a nonspecific finding but may originate from CRC or larger (> 1 to 2 cm) polyps. Because small adenomatous polyps do not tend to bleed and bleeding from cancers or large polyps may be intermittent or undetectable in a single sample of stool, the proper use of stool blood tests requires annual testing that consists of collecting specimens (2 or 3, depending on the product) from consecutive bowel movements [45–47].
Guaiac-based FOBT
Guaiac-based FOBT (gFOBT) is the most common stool blood test for CRC screening and the only CRC screening test for which there is evidence of efficacy from randomized controlled trials [11]. The usual gFOBT protocol consists of collecting 2 samples from each of 3 consecutive bowel movements at home. Prior to testing with a sensitive guaiac-based test, individuals usually will be instructed to avoid aspirin and other NSAIDs, vitamin C, red meat, poultry, fish, and some raw vegetables because of diet-test interactions that can increase the risk of both false-positive and false-negative (specifically, vitamin C) results [48]. Collection of all 3 samples is important because test sensitivity improves with each additional stool sample [41]. Three large randomized controlled trials with gFOBT have demonstrated that screened patients have cancers detected at an early and more curable stage than unscreened patients. Over time (8 to 13 years), each of the trials demonstrated significant reductions in CRC mortality of 15% to 33% [49–51]. However, the reported sensitivity of a single gFOBT varies considerably [52].
FIT
FIT has several technological advantages when compared with gFOBT. FIT detects human globin, a protein that along with heme constitutes human hemoglobin. Thus, FIT is more specific for human blood than guaiac-based tests, which rely on detection of peroxidase in human blood and also react to the peroxidase that is present in dietary constituents such as rare red meat, cruciferous vegetables, and some fruits [53]. Furthermore, unlike gFOBT, FIT is not subject to false-negative results in the presence of high-dose vitamin C supplements, which block the peroxidase reaction. In addition, because globin is degraded by digestive enzymes in the upper gastrointestinal tract, FIT is also more specific for lower gastrointestinal bleeding, thus improving the specificity for CRC. Finally, the sample collection process for patients for some variants of FIT are less demanding than gFOBT, requiring fewer samples or less direct handling of stool, which may increase FIT’s appeal. Although FIT has superior performance characteristics when compared with older guaiac-based Hemoccult II cards [54–56], the spectrum of benefits, limitations, and harms is similar to a gFOBT with high sensitivity [41]. As for adherence with FIT, there were 10% and 12% gains in adherence with FIT in the first 2 randomized controlled trials comparing FIT with guaiac-based testing [57,58]. Therefore, FIT is preferred over Hemoccult Sensa and is the preferred annual cancer detection test when colonoscopy is not an option [43]. The American College of Gastroenterology supports the joint guideline recommendation [11] that older guaiac-based fecal occult blood testing be abandoned as a method for CRC screening.
sDNA
Fecal DNA testing uses knowledge of molecular genomics and provides the basis of a new method of CRC screening that tests stool for the presence of known DNA alterations in the adenoma-carcinoma sequence of colorectal carcinogenesis [11]. Three different types of fecal DNA testing kits have been evaluated. The sensitivity for cancer in each version was superior to traditional guaiac-based occult blood testing, but the sensitivities ranged from 52%–87%, with the specificities ranging from 82%–95%. Based on the accumulation of evidence since the last update of joint guideline, the joint guideline panel concluded that there now are sufficient data to include sDNA as an acceptable option for CRC screening [11].
As for overall recommendations for stool-based testing, the ACG supports the joint guideline recommendation that older guaiac-based fecal occult blood testing be abandoned as a method for CRC screening. Because of more extensive data (compared with Hemoccult Sensa), and the high cost of fecal DNA testing, the American College of Gastroenterology recommends FIT as the preferred cancer detection test in cases where colonoscopy is not an option [43].
Invasive Tests Other than Colonoscopy
The use of flexible sigmoidoscopy for CRC screening is supported by high-quality case-control and cohort studies [46]. The chief advantage of flexible sigmoidoscopy is that it can be performed with a simple preparation (2 enemas), without sedation, and by a variety of practitioners in diverse settings. The main limitation of the procedure is that it does not examine the entire colon but only the rectum, sigmoid, and descending colon. The effectiveness of a flexible sigmoidoscopy program is based on the assumption that if an adenoma is detected during the procedure, the patient would be referred for colonoscopy to examine the entire colon.
DCBE is an imaging modality which can evaluate the entire colon in almost all cases and can detect most cancers and the majority of significant polyps. However, the lower sensitivity for significant adenomas when compared with colonoscopy may result in less favorable outcomes regarding CRC morbidity and mortality. Double-contrast barium enema is no longer recommended as an alternative CRC prevention test because its use has declined dramatically and also as its effectiveness for polyp detection is less than CT colonography [43].
CT Colonography
CT colonography every 5 years is endorsed as an alternative to colonoscopy every 10 years because of its recent performance in the American College of Imaging Network Trial 6664 (also known as the National CT Colonography Trial) [59]. The principle performance feature that justifies inclusion of CT colonography as a viable alternative in patients who decline colonoscopy is that the sensitivity for polyps ≥ 1 cm in size was 90% in the most recent multicenter US trial [59]. In this study, 25% of radiologists who were tested for entry into the trial but performed poorly were excluded from participation, and thus lower sensitivity might be expected in actual clinical practice. CT colonography probably has a lower risk of perforation than colonoscopy in most settings, but for several reasons it is not considered the equivalent of colonoscopy as a screening strategy. First, the evidence to support an effect of endoscopic screening on prevention of incident CRC and mortality is overwhelming compared with that for CT colonography. Second, the inability of CT colonography to adequately detect polyps 5 mm and smaller, which constitutes 80% of colorectal neoplasms, and whose natural history is still not understood, necessitates performance of the test at 5-year rather than 10-year intervals [43]. Finally, false-positives are common, and the specificity for polyps ≥ 1 cm in size was only 86% in the National CT Colonography Trial, with a positive predictive value of 23% [59]. The American College of Gastroenterology recommends that asymptomatic patients be informed of the possibility of radiation risk associated with one or repeated CT colonography studies, though the exact risk associated with radiation is unclear [60,61].
The value of extracolonic findings detected by CT colonography is mixed, with substantial costs associated with incidental findings, but occasional important extracolonic findings are detected, such as asymptomatic cancers and large abdominal aortic aneurysms. As a final point, the ACG is also concerned about the potential impact of CT colonography on adherence with follow-up colonoscopy and thus on polypectomy rates. Thus, if CT colonography substantially improves adherence, it should improve polypectomy rates and thereby reduce CRC, even if only large polyps are detected and referred for colonoscopy. On the other hand, if CT colonography largely displaces patients who would otherwise be willing to undergo colonoscopy, then polypectomy rates will fall substantially, which could significantly increase the CRC incidence [62]. Thus, for multiple reasons and pending additional study, CT colonography should be offered to patients who decline colonoscopy. It should be noted that CT colonography should only be offered for the purposes of CRC screening and should not be used for diagnostic workup of symptoms (eg, patient with active bleeding or inflammatory bowel disease).
When should screening begin?
The American College of Gastroenterology continues to recommend that screening begin at age 50 years in average-risk persons (ie, those without a family history of colorectal neoplasia), except for African Americans, in whom it should begin at age 45 years [43]. The USPSTF does not currently provide specific recommendations based on race or ethnicity, but certain other subgroups of the average-risk population might warrant initiation of screening at an earlier or later age, depending on their risk. For example, the incident risk of CRC has been described to be greater in men than women [63]. In reviewing the literature, the writing committee also identified heavy cigarette smoking and obesity as linked to an increased risk of CRC and to the development of CRC at an earlier age.
For patients with a family history of CRC or adenomatous polyps, the 2008 MSTF guideline recommends initiation of screening at age 40 [11]. The American College of Gastroenterology recommendations for screening in patients with a family history are shown in Table 1. From a practical perspective, many clinicians have found that patients are often not aware of whether their first-degree relatives had advanced adenomas vs. small tubular adenomas, or whether their family members had non-neoplastic vs. neoplastic polyps. Given these difficulties, the American College of Gastroenterology now recommends that adenomas only be counted as equal to a family history of cancer when there is a clear history, or medical report containing evidence, or other evidence to indicate that family members had advanced adenomas (an adenoma ≥ 1 cm in size, or with high-grade dysplasia, or with villous elements) [43]. Continuation of the old recommendation to screen first-degree relatives of patients with only small tubular adenomas could result in most of the population being screened at age 40, with doubtful benefit.
What are screening considerations in patients with genetic syndromes?
Patients with features of an inherited CRC syndrome should be advised to pursue genetic counseling with a licensed genetic counselor and, if appropriate, genetic testing. Individuals with FAP should undergo adenomatous polyposis coli (APC) mutation testing and, if negative, MYH mutation testing. Patients with FAP or at risk of FAP based upon family history should undergo annual colonoscopy until colectomy is deemed by both physician and patient as the best treatment [64]. Patients with a retained rectum after total colectomy and ileorectal anastomosis, ileal pouch, after total proctocolectomy and ileal pouch anal anastomosis, or stoma after total proctocolectomy and end ileostomy, should undergo endoscopic assessment approximately every 6 to 12 months after surgery, depending on the polyp burden seen. Individuals with oligopolyposis (< 100 colorectal polyps) should be sent for genetic counseling, consideration of APC and MYH mutation testing, and individualized colonoscopy surveillance depending on the size, number, and pathology of polyps seen. Upper endoscopic surveillance is recommended in individuals with FAP, but there are no established guidelines for endoscopic surveillance in MAP (MYH-associated polyposis) [43].
Patients who meet the Bethesda criteria for HNPCC [65] can be screened by 2 different mechanisms. One is a DNA-based test for microsatellite instability of either the patient’s or a family member’s tumor. The other mechanism is to assess by immunohistochemical staining for evidence of mismatch repair proteins (eg, MLH1, MSH2, MSH6). In those patients in whom deleterious mutations are found, the affected individual should undergo colonoscopy every 2 years beginning at age 20 to 25 years until age 40 years, then annually thereafter [43]. If genetic testing is negative (ie, no deleterious mutation is found), but the patient is still felt to clinically have Lynch syndrome, then they should still be surveyed in the same way.
Case Continued
The physician recommends colonoscopy as the screening modality as it is the most efficient and accurate way of finding precancerous lesions and the most effective way of preventing CRC by removing precancerous lesions. He also explains that because the patient’s father developed CRC after the age of 60, this does not place the patient in a higher risk category and he can follow screening recommendations for “average-risk” individuals.
Screening
The patient undergoes colonoscopy. Two 5-mm adenomas in the transverse colon are detected and removed.
When should he have a repeat colonoscopy?
Surveillance Intervals
New data have recently emerged on the risk of interval cancer after colonoscopy. The overall rate of interval cancer is estimated to be 1.1–2.7 per 1000 person-years of follow-up. There are several reasons that may account for why patients develop interval cancers: (1) important lesions may be missed at baseline colonoscopy, (2) adenomas may be incompletely removed at the time of baseline colonoscopy, and (3) interval CRC may be biologically different or more aggressive than prevalent CRC. In order to minimize the risk of interval cancer development, it is important to perform a high-quality baseline screening colonoscopy examination as this is associated with lowering the risk of interval cancer [66]. A high-quality colonoscopy entails completion of the procedure to the cecum (with photodocumentation of the appendiceal orifice and ileocecal valve) with careful inspection of folds including adequate bowel cleanliness and a withdrawal time > 6 minutes.
Baseline Colonoscopy Findings
No Polyps
Several prospective observational studies in different populations have shown that the risk of advanced adenomas within 5 years after negative findings on colonoscopy is low (1.3%–2.4%) relative to the rate on initial screening examination (4%–10%) [68–73]. In these studies, interval cancers were rare within 5 years. A sigmoidoscopy randomized controlled trial performed in the United Kingdom demonstrated a reduction in CRC incidence and mortality at 10 years in patients who received one-time sigmoidoscopy compared with controls—a benefit limited to the distal colon [46]. This is the first randomized study to show the effectiveness of endoscopic screening, an effect that appears to have at least a 10-year duration [74]. Thus, in patients who have a baseline colonoscopic evaluation without any adenomas or polyps and are average-risk individuals, the recommendation for the next examination is in 10 years [66].
Distal Hyperplastic Polyps < 10 mm
There is considerable evidence that patients with only rectal or sigmoid hyperplastic polyps (HPs) appear to represent a low-risk cohort. Studies have focused on whether the finding in the distal colon was a marker of risk for advanced neoplasia elsewhere and most studies show no such relationship [67]. Prior and current evidence suggests that distal HPs <10 mm are benign without neoplastic potential. If the most advanced lesions at baseline colonoscopy are distal HPs <10 mm, the interval for colonoscopic follow-up should be 10 years [66].
1-2 Tubular Adenomas < 10 mm
Prior evidence suggested that patients with low-risk adenomas (<10 mm, no villous histology or high-grade dysplasia) had a lower risk of developing advanced adenomas during follow-up compared with patients with high risk adenomas (≥ 10mm, villous histology or high -grade dysplasia). At that time in 2006, consensus on the task force was that an interval of 5 years would be acceptable in this low-risk group [75]. Data published since 2006 endorse the assessment that patients with 1–2 tubular adenomas with low-grade dysplasia <10 mm represent a low-risk group. Three new studies suggest that this group may have only a small, nonsignificant increase in risk of advanced neoplasia within 5 years compared with individuals with no baseline neoplasia. The evidence now supports a surveillance interval of longer than 5 years for most patients and can be extended to 10 years based on the quality of the preparation and colonoscopy [66].
3–10 Tubular Adenomas
Two independent meta-analyses in 2006 found that patients with 3 or more adenomas at baseline had an increased RR for adenomas during surveillance, ranging from 1.7 to 4.8 [47,75]. New information from the VA study and the National Cancer Institute Pooling Project also support these prior findings. Patients with 3 or more adenomas have a level of risk for advanced neoplasia similar to other patients with advanced neoplasia (adenoma >10 mm, adenoma with high grade dysplasia) and thus, repeat examination should be performed in 3 years [66,68,76].
> 10 Adenomas
Only a small proportion of patients undergoing screening colonoscopy will have >10 adenomas. The 2006 guidelines for colonoscopy surveillance after polypectomy noted that such patients should be considered for evaluation of hereditary CRC syndromes [67]. Early follow-up surveillance colonoscopy is based on clinical judgment because there is little evidence to support a firm recommendation. At present, the recommendation is to consider follow-up in less than 3 years after a baseline colonoscopy [66].
1 or More Tubular Adenomas ≥ 10mm
The 2006 MSTF guideline reviewed data related to adenoma size, demonstrating that most studies showed a 2- to 5-fold increased risk of advanced neoplasia during follow-up if the baseline examination had one or more adenomas ≥ 10 mm [67]. Newer, additional data shows that patients with one or more adenomas ≥ 10 mm have an increased risk of advanced neoplasia during surveillance compared with those with no neoplasia or small (< 10 mm) adenomas [68,76]. Thus, the recommendations remains that repeat examination should be performed in 3 years [66]. If there is question about complete removal of an adenoma (ie, piecemeal resection), early follow-up colonoscopy is warranted [66].
1 or More Villous Adenomas
The 2006 MSTF guideline considers adenomas with villous histology to be high risk [67]. The NCI Pooling Project analyzed polyp histology as a risk factor for development of interval advanced neoplasia. Compared with patients with tubular adenomas, those with baseline polyp(s) showing adenomas with villous or tubulovillous histology (TVA) had increased risk of advanced neoplasia during follow-up (16.8% vs 9.7%; adjusted OR, 1.28; 95% CI, 1.07–1.52) [76]. Patients with one or more adenomas with villous histology were also found to have an increased risk of advanced neoplasia during surveillance compared with those with no neoplasia or small (<10 mm) tubular adenomas. Thus, the recommendation remains that repeat examination should be performed in 3 years [66].
Adenoma with High-Grade Dysplasia (HGD)
The 2006 MSTF guideline concluded that the presence of HGD in an adenoma was associated with both villous histology and larger size, which are both risk factors for advanced neoplasia during surveillance [67]. In a univariate analysis from the NCI Pooling Project, HGD was strongly associated with risk of advanced neoplasia during surveillance (OR, 1.77; 95% CI, 1.41–2.22) [76]. Thus, the recommendation remains that repeat examination should be performed in 3 years [66].
Serrated Lesions
A total of 20% to 30% of CRCs arise through a molecular pathway characterized by hypermethylation of genes, known as CgG Island Methylator Phenotype (CIMP) [77]. Precursors are believed to be serrated polyps. Tumors in this pathway have a high frequency of BRAF mutation, and up to 50% are microsatellite unstable. CIMP-positive tumors are overrepresented in interval cancers, particularly in the proximal colon. The principal precursor of hypermethylated cancers is probably the sessile serrated polyp (synonymous with sessile serrated adenoma). These polyps are difficult to detect at endoscopy. They may be the same color as surrounding colonic mucosa, have indiscrete edges, are nearly always flat or sessile, and may have a layer of adherent mucus and obscure the vascular pattern.
Recent studies show that proximal colon location or size ≥ 10 mm may be markers of risk for synchronous advanced adenomas elsewhere in the colon [78,79]. Surveillance after colonoscopy was evaluated in one study, which found that coexisting serrated polyps and high-risk adenomas (HRA; ie, size ≥ 10 mm, villous histology, or presence of HGD) is associated with a higher risk of advanced neoplasia at surveillance [78]. This study also found that if small proximal serrated polyps are the only finding at baseline, the risk of adenomas during surveillance is similar to that of patients with low-risk adenomas (LRA; ie, 1–2 small adenomas).
The current evidence suggests that size (>10 mm), histology (a sessile serrated polyp is a more significant lesion than an HP; a sessile serrated polyp with cytological dysplasia is more advanced than a sessile serrated polyp without dysplasia), and location (proximal to the sigmoid colon) are risk factors that might be associated with higher risk of CRC. A sessile serrated polyp ≥ 10 mm and a sessile serrated polyp with cytological dysplasia should be managed like a HRA with repeat colonoscopy occurring in 3 years. Serrated polyps that are <10 mm in size and do not have cytological dysplasia may have lower risk and can be managed like LRA with repeat colonoscopy occurring in 5 years [66].
Follow-up After Surveillance
In a 2009 study, 564 participants underwent 2 surveillance colonoscopies after an index procedure and 10.3% had high-risk findings at the third study examination. If the second examination showed high-risk findings, then results from the first examination added no significant information about the probability of high-risk findings on the third examination (18.2% for high-risk findings on the first examination vs. 20.0% for low-risk findings on the first examination; P = 0.78). If the second examination showed no adenomas, then the results from the first examination added significant information about the probability of high-risk findings on the third exam-ination (12.3% if the first examination had high-risk findings vs. 4.9% if the first examination had low-risk findings; P = 0.015) [80]. Thus, information from 2 previous colonoscopies appears to be helpful in defining the risk of neoplasia for individual patients and in the future, guidelines might consider accounting for the results of 2 exams to tailor surveillance intervals for patients.
When should screening / surveillance be stopped?
There is considerable new evidence that the risks of colonoscopy increase with advancing age [81,82]. Neither surveillance nor screening colonoscopy should be performed when the risk of the preparation, sedation, or procedure outweighs the potential benefit. For patients aged 75–85 years, the USPSTF recommends against routine screening but argues for individualization based on comorbidities and findings on any prior colonoscopy. The USPSTF recommends against continued screening after age 85 years because risk could exceed potential benefit [44].
In terms of surveillance of prior adenomas, the 75-85 year age group may still benefit from surveillance because patients with prior HRA are at higher risk for developing advanced neoplasia compared with average-risk screenees. However, the decision to continue surveillance in this population should be individualized and based on an assessment of benefit and risk in the context of the person’s estimated life expectancy [66]. More importantly, it should be noted that an individual’s most important and impactful screening colonoscopy is his or her first one and therefore, from a public health standpoint, great effort should be taken to increase the number of people in a population who undergo screening rather than simply targeting those who need surveillance for prior polyps. This is ever true in settings with limited resources.
Case Conclusion
The physician discusses the findings from the colonoscopy (2 small adenomas) with the patient and recommends a repeat colonoscopy in 5 to 10 years.
Summary
Colorectal cancer is one of the leading causes of cancer-related death in the United States. Since the advent of colonoscopy and the implementation of CRC screening efforts, the rates of CRC have started to decline. There are several environmental factors which have been associated with the development of CRC including obesity, dietary intake, physical activity and smoking. At present, there are multiple tools available for CRC prevention, but the most accurate and effective method is currently colonoscopy. Stool-based tests like FIT should be offered when a patient declines colonoscopy. For those interested in colonoscopy, average-risk individuals should be screened starting at the age of 50 with subsequent examinations every 10 years. Surveillance examinations should occur based on polyp findings on index colonoscopy. There is no recommendation to continue screening after the age of 75, though physicians can determine this based on patients health and risk/benefit profile. Current guidelines recommend against offering any screening to patients over the age of 85. Despite these recommendations, almost half of the eligible screening population has yet to undergo appropriate CRC screening. Future work should include public health efforts to improve access and appeal of widespread CRC screening regardless of modality. While colonoscopy is considered the most effective screening test, the best test is still the one the patient gets.
Corresponding author: Audrey H. Calderwood, MD, MS, 85 E. Concord St., Rm. 7724, Boston, MA 02118, [email protected].
Financial disclosures: None.
1. American Cancer Society. Colorectal cancer facts & figures 2014–2016. Atlanta: American Cancer Society; 2014.
2. Ries L, Melbert D, Krapcho M, et al. SEER cancer statistics review, 1975–2011. Bethesda, MD: National Cancer Institute; 2014.
3. Levine JS, Ahnen DJ. Clinical practice. Adenomatous polyps of the colon. N Engl J Med 2006;355:2551–7.
4. Bond JH. Polyp guideline: diagnosis, treatment, and surveillance for patients with colorectal polyps. Practice Parameters Committee of the American College of Gastroenterology. Am J Gastroenterol 2000;95:3053–63.
5. Schatzkin A, Freedman LS, Dawsey SM, Lanza E. Interpreting precursor studies: what polyp trials tell us about large-bowel cancer. J Natl Cancer Inst 1994;86:1053–7.
6. DevCan: Probability of developing or dying of cancer software, version 6.5.0; Statistical Research and Applications Branch, National Cancer Institute, 2005. http://srab.cancer.gov/devcan [computer program].
7. Surveillance, Epidemiology, and End Results (SEER) Program (www.seer.cancer.gov), National Cancer Institute, DCCPS, Surveillance Research Program, Cancer Statistics Branch, released April 2010, based on the November 2009 submission.
8. Murphy G, Devesa SS, Cross AJ, et al. Sex disparities in colorectal cancer incidence by anatomic subsite, race and age. Int J Cancer 2011;128:1668–7.
9. Edwards BK, Ward E, Kohler BA, et al. Annual report to the nation on the status of cancer, 1975-2006, featuring colorectal cancer trends and impact of interventions (risk factors, screening, and treatment) to reduce future rates. Cancer 2010;116:544–73.
10. Irby K, Anderson WF, Henson DE, Devesa SS. Emerging and widening colorectal carcinoma disparities between Blacks and Whites in the United States (1975-2002). Cancer Epidemiol Biomarkers Prev 2006;15:792–7.
11. Levin B, Lieberman DA, McFarland B, et al. Screening and surveillance for the early detection of colorectal cancer and adenomatous polyps, 2008: a joint guideline from the American Cancer Society, the US Multi-Society Task Force on Colorectal Cancer, and the American College of Radiology. CA Cancer J Clin 2008;58:130–60.
12. Kirkegaard H, Johnsen NF, Christensen J, et al. Association of adherence to lifestyle recommendations and risk of colorectal cancer: a prospective Danish cohort study. BMJ 2010;341:c5504.
13. Butterworth AS, Higgins JP, Pharoah P. Relative and absolute risk of colorectal cancer for individuals with a family history: a meta-analysis. Eur J Cancer 2006;42:216–27.
14. Johns LE, Houlston RS. A systematic review and meta-analysis of familial colorectal cancer risk. Am J Gastroenterol 2001;96:2992–3003.
15. Lynch HT, de la Chapelle A. Hereditary colorectal cancer. N Engl J Med 2003;348:919–32.
16. Jasperson KW, Tuohy TM, Neklason DW, Burt RW. Hereditary and familial colon cancer. Gastroenterology 2010;138:2044–58.
17. Stoffel E, Mukherjee B, Raymond VM, et al. Calculation of risk of colorectal and endometrial cancer among patients with Lynch syndrome. Gastroenterology 2009;137:1621–7.
18. Bernstein CN, Blanchard JF, Kliewer E, Wajda A. Cancer risk in patients with inflammatory bowel disease: a population-based study. Cancer 2001;91:854–62.
19. Eaden JA, Abrams KR, Mayberry JF. The risk of colorectal cancer in ulcerative colitis: a meta-analysis. Gut 2001;48:526–35.
20. Larsson SC, Orsini N, Wolk A. Diabetes mellitus and risk of colorectal cancer: a meta-analysis. J Natl Cancer Inst 2005;97:1679–87.
21. Campbell PT, Deka A, Jacobs EJ, et al. Prospective study reveals associations between colorectal cancer and type 2 diabetes mellitus or insulin use in men. Gastroenterology 2010;139:1138–46.
22. Larsson SC, Giovannucci E, Wolk A. Diabetes and colorectal cancer incidence in the cohort of Swedish men. Diabetes Care 2005;28:1805–7.
23. Huxley RR, Ansary-Moghaddam A, Clifton P, et al. The impact of dietary and lifestyle risk factors on risk of colorectal cancer: a quantitative overview of the epidemiological evidence. Int J Cancer 2009;125:171–80.
24. Larsson SC, Wolk A. Obesity and colon and rectal cancer risk: a meta-analysis of prospective studies. Am J Clin Nutr 2007;86:556–65.
25. Wang Y, Jacobs EJ, Patel AV, et al. A prospective study of waist circumference and body mass index in relation to colorectal cancer incidence. Cancer Causes Control 2008;19:783–92.
26. Chao A, Thun MJ, Connell CJ, et al. Meat consumption and risk of colorectal cancer. JAMA 2005;293:172–82.
27. Cross AJ, Ferrucci LM, Risch A, et al. A large prospective study of meat consumption and colorectal cancer risk: an investigation of potential mechanisms underlying this association. Cancer Res 2010;70:2406–14.
28. Chan AT, Giovannucci EL. Primary prevention of colorectal cancer. Gastroenterology 2010;138:2029–43.
29. Food, nutrition, physical activity, and the prevention of cancer: a global perspective. Washington DC: World Cancer Research Fund/American Institute for Cancer Research; 2007.
30. McCullough ML, Robertson AS, Chao A, et al. A prospective study of whole grains, fruits, vegetables and colon cancer risk. Cancer Causes Control 2003;14:959–70.
31. Terry P, Giovannucci E, Michels KB, et al. Fruit, vegetables, dietary fiber, and risk of colorectal cancer. J Natl Cancer Inst 2001;93:525–33.
32. Cho E, Smith-Warner SA, Spiegelman D, et al. Dairy foods, calcium, and colorectal cancer: a pooled analysis of 10 cohort studies. J Natl Cancer Inst 2004;96:1015–22.
33. Secretan B, Straif K, Baan R, et al. A review of human carcinogens--Part E: tobacco, areca nut, alcohol, coal smoke, and salted fish. Lancet Oncol 2009;10:1033–4.
34. Ferrari P, Jenab M, Norat T, et al. Lifetime and baseline alcohol intake and risk of colon and rectal cancers in the European prospective investigation into cancer and nutrition (EPIC). Int J Cancer 2007;121:2065–72.
35. Samad AK, Taylor RS, Marshall T, Chapman MA. A meta-analysis of the association of physical activity with reduced risk of colorectal cancer. Colorectal Dis 2005;7:204–13.
36. Flossmann E, Rothwell PM. Effect of aspirin on long-term risk of colorectal cancer: consistent evidence from randomised and observational studies. Lancet 2007;369:1603–13.
37. Rothwell PM, Wilson M, Elwin CE, et al. Long-term effect of aspirin on colorectal cancer incidence and mortality: 20-year follow-up of five randomised trials. Lancet 2010;376:1741–50.
38. Hildebrand JS, Jacobs EJ, Campbell PT, et al. Colorectal cancer incidence and postmenopausal hormone use by type, recency, and duration in cancer prevention study II. Cancer Epidemiol Biomarkers Prev 2009;18:2835–41.
39. Heiss G, Wallace R, Anderson GL, et al. Health risks and benefits 3 years after stopping randomized treatment with estrogen and progestin. JAMA 2008;299:1036–45.
40. Rossouw JE, Anderson GL, Prentice RL, et al. Risks and benefits of estrogen plus progestin in healthy postmenopausal women: principal results From the Women’s Health Initiative randomized controlled trial. JAMA 2002;288:321–33.
41. Lieberman DA,Weiss DG. One-time screening for colorectal cancer with combined fecal occult-blood testing and examination of the distal colon. N Engl J Med 2001;345:555–60.
42. Lafata JE, Divine G, Moon C,Williams LK. Patient-physician colorectal cancer screening discussions and screening use. Am J Prev Med 2006;31:202–9.
43. Rex DK, Johnson DA, Andersone JC, et al. American College of Gastroenterology guidelines for colorectal cancer screening 2008. Am J Gastroenterol 2009;104:739–50.
44. U.S. Preventive Services Task Force. Screening for colorectal cancer: U.S. Preventive Services Task Force recommendation statement. Ann Intern Med 2008;149:627–37.
45. Smith RA, von Eschenbach AC,Wender R, et al. American Cancer Society guidelines for the early detection of cancer: update of early detection guidelines for prostate, colorectal, and endometrial cancers. Also: update 2001—testing for early lung cancer detection. CA Cancer J Clin 2001;51:38–75.
46. Winawer S, Fletcher R, Rex D, et al. Colorectal cancer screening and surveillance: clinical guidelines and rationale—update based on new evidence. Gastroenterology 2003;124:544–60.
47. Rex DK, Kahi CJ, Levin B, et al. Guidelines for colonoscopy surveillance after cancer resection: a consensus update by the American Cancer Society and the US Multi-Society Task Force on Colorectal Cancer. Gastroenterology 2006;130:1865–71.
48. Ransohoff DF, Lang CA. Screening for colorectal cancer with the fecal occult blood test: a background paper. American College of Physicians. Ann Intern Med 1997;126:811–22.
49. Hardcastle JD, Chamberlain JO, Robinson MH, et al. Randomised controlled trial of faecal-occult blood screening for colorectal cancer. Lancet 1996;348:1472–7.
50. Kronborg O, Fenger C, Olsen J, et al. Randomised study of screening for colorectal cancer with faecal-occult blood test. Lancet 1996;348:1467–71.
51. Wilson JMG, Junger G. Principles and practice of screening for disease. Geneva: World Health Organization; 1968.
52. Allison JE, Tekawa IS, Ransom LJ, Adrain AL. A comparison of fecal occult-blood tests for colorectal-cancer screening. N Engl J Med 1996;334:155–9.
53. Caligiore P, Macrae FA, St John DJ, et al. Peroxidase levels in food: relevance to colorectal cancer screening. Am J Clin Nutr 1982;35:1487–9.
54. Nakajima M, Saito H, Soma Y, et al. Prevention of advanced colorectal cancer by screening using the immunochemical faecal occult blood test: a case-control study. Br J Cancer 2003;89:23–8.
55. Lee KJ, Inoue M, Otani T, et al. Colorectal cancer screening using fecal occult blood test and subsequent risk of colorectal cancer: a prospective cohort study in Japan. Cancer Detect Prev 2007;31:3–11.
56. Zappa M, Csatiglione G, Gazzini G, et al. Effect of faecal occult blood testing on colorectal mortality: results of a population-based case-control study in the district of Florence, Italy. Int J Cancer 1997;73:208–10.
57. van Rossum LG, van Rijn AF, Laheij RJ, et al. Random comparison of guaiac and immunochemical fecal occult blood tests for colorectal cancer in a screening population. Gastroenterology 2008;135:82–90.
58. Hol L, van Leerdam ME, van Ballegooijen M, et al. Attendance to screening for colorectal cancer in the Netherlands; randomized controlled trial comparing two different forms of faecal occult blood tests and sigmoidoscopy. Gastroenterology 2008;134:A87.
59. Johnson CD, Chen MH, Toledano AY, et al. Accuracy of CT colonography for detection of large adenomas and cancers.
N Engl J Med 2008;359:1207–17.
60. Brenner DJ, Georgsson MA. Mass screening with CT colonography: should the radiation exposure be of concern? Gastroenterology 2005;129:328–37.
61. Brenner DJ, Hall EJ. Computed tomography—an increasing source of radiation exposure. N Engl J Med 2007;35: 2277–84.
62. Hur C, Chung DC, Schoen RE, et al. The management of small polyps found by virtual colonoscopy: results of a decision analysis. Clin Gastroenterol Hepatol 2007;5:237–44.
63. Chu KC, Tarone RE, Chow WH, et al. Temporal patterns in colorectal cancer incidence, survival, and mortality from 1950 through 1990. J Natl Cancer Inst 1994;86:997–1006.
64. Vasen HF, Moslein G, Alonso A, et al. Guidelines for the clinical management of familial adenomatous polyposis (FAP). Gut 2008;57:704–13.
65. Umar A, Boland CR, Terdiman PJ, et al. Revised Bethesda guidelines for hereditary nonpolyposis colorectal Cancer (Lynch syndrome) and microsatellite instability. J Natl Cancer Inst 2004;96:261–8.
66. Lieberman DA, Rex DR, Winawer SJ, et al. Guidelines for colonoscopy surveillance after screening and polypectomy: a consensus update by the US Multi-Society Task Force on Colorectal Cancer. Gastroenterology 2012;143:844–57.
67. Winawer SJ, Zauber AG, Fletcher RH, et al. Guidelines for colonoscopy surveillance after polypectomy: a consensus update by the US Multi-Society Task Force on colorectal cancer and the American Cancer Society. Gastroenterology 2006;130:1872–85.
68. Lieberman DA, Weiss DG, Harford WV, et al. Five year colon surveillance after screening colonoscopy. Gastroenterology 2007;133:1077–85.
69. Imperiale TF, Glowinski EA, Lin-Cooper C, et al. Five-year risk of colorectal neoplasia after negative screening colonoscopy. N Engl J Med 2008;359:1218–24.
70. Leung WK, Lau JYW, Suen BY, et al. Repeat screening colonoscopy 5 years after normal baseline screening colonoscopy in average-risk Chinese: a prospective study. Am J Gastroenterol 2009;104:2028–34.
71. Brenner H, Haug U, Arndt V, et al. Low risk of colorectal cancer and advanced adenomas more than 10 years after negative colonoscopy. Gastroenterology 2010;138:870–6.
72. Miller H, Mukherjee R, Tian J, et al. Colonoscopy surveillance after polypectomy may be extended beyond five years. J Clin Gastroenterol 2010;44:e162–e166.
73. Chung SJ, Kim YS, Yang SY, et al. Five-year risk for advanced colorectal neoplasia after initial colonoscopy according to the baseline risk stratification: a prospective study in 2452 asymptomatic Koreans. Gut 2011;60:1537–43.
74. Atkin WS, Edwards R, Kralj-Hans I, et al. Once-only flexible sigmoidoscopy screening in prevention of colorectal cancer: a multicentre randomised controlled trial. Lancet 2010;375:1624–33.
75. Saini SD, Kim HM, Schoenfeld P. Incidence of advanced adenomas at surveillance colonoscopy in patients with a personal history of colon adenomas: a meta-analysis and systematic review. Gastrointest Endosc 2006;64:614–26.
76. Martinez ME, Baron JA, Lieberman DA, et al. A pooled analysis of advanced colorectal neoplasia diagnoses following colonoscopic polypectomy. Gastroenterology 2009;136:832–41.
77. Leggett B, Whitehall V. Role of the serrated pathway in colorectal cancer pathogenesis. Gastroenterology 2010;138:
2088–100.
78. Schreiner MA, Weiss DG, Lieberman DA. Proximal and large nonneoplastic serrated polyps: association with synchronous neoplasia at screening colonoscopy and with interval neoplasia at follow- up colonoscopy. Gastroenterology 2010;139:1497–502.
79. Hiraoka S, Kato J, Fujiki S, et al. The presence of large serrated polyps increases risk for colorectal cancer. Gastroenterology 2010;139:1503–10.
80. Robertson DJ, Burke CA, Welch HG, et al. Using the results of a baseline and a surveillance colonoscopy to predict recurrent adenomas with high-risk characteristics. Ann Intern Med 2009;151:103–9.
81. Warren JL, Klabunde CN, Mariotto AB, et al. Adverse events after outpatient colonoscopy in the Medicare population. Ann Intern Med 2009;150:849–57.
82. Ko CW, Riffle S, Michaels L, et al. Serious complications within 30 days of screening and surveillance colonoscopy: a multicenter study. Clin Gastroenterol Hepatol 2010;8:166–73.
Psychosocial Variables May Predict Likelihood of Weight Regain After Weight Loss
Study Overview
Objective. To identify psychosocial predictors of weight loss maintenance in a multi-site clinical trial following a group-based weight loss program.
Design. Secondary analysis of a 2-phase randomized controlled trial. The first phase was a 6-month group-based weight loss program and the second phase was a 30-month trial comparing weight loss maintenance strategies.
Setting and participants. The patients studied were participants in the Weight Loss Maintenance trial [1], which was conducted at 4 US clinical centers. Eligible participants were overweight and obese adults with a BMI between 25 to 45 who were actively taking medication for hypertension, dyslipidemia, or both. 1685 patients were recruited into the weight-loss phase, and those who lost at least 4 kg (n = 1032) were then randomly assigned to 1 of the 3 maintenance arms: (a) self-directed with minimal intervention (control), (b) interactive technology that consisted of unlimited, interactive study website access, or (c) personal contact consisting of monthly, personalized telephone calls and quarterly face-to-face contact with a study interventionist. There was 1 death in each treatment group, so a total of 1029 participants were included in the analyses.
Main outcome measures. The researchers examined the associations between psychosocial variables and weight change outcomes at 12 and 30 months. Patients completed 5 self-report measures at the time of randomization into phase 2 of the study: a social support and exercise survey, a social support and eating habits survey, the SF-36, the Patient Health Questionnaire Depression Scale, and the Perceived Stress Scale.
Results. Of the 1029 participants initially included for analyses, 2 failed to provide complete data on the social support scales and 2 were identified as outliers at both 12 and 30 months. This resulted in a final sample size of 1025 participants; 63% were women, 61% were non-Latino white, and 38% were black. The mean age was 55.6 years. All groups regained weight, with the personal contact group having the least amount of gain. However, the mean weight at 30 months remained significantly lower than the mean weight at entry into phase 1.
Only 3 psychosocial variables were significantly related to weight loss at 12 and 30 months. At both time marks, less weight regain was associated with higher SF-36 mental health composite scores (P < 0.01). Interestingly, for black participants at the 12-month mark, more weight regain was associated with higher exercise encouragement from friends (P < 0.05). At 30 months, more weight regain was associated with friends’ encouragement for healthy eating (P < 0.05).
Conclusion. The psychosocial variables that were self-reported upon entering phase 2 may predict the ability of an individual to maintain weight loss at 12 and 30 months. The significant, complex interactions between these variables, race, sex, and treatment interventions need to be further studied for proper incorporation into a weight loss maintenance program.
Commentary
The case for the obesity epidemic has been long established. Unfortunately, the causes for weight gain can be complicated and multifactorial. Factors associated with weight gain include nonmodifiable factors such as age, sex, and race as well as modifiable factors like lifestyle, eating habits, and perceived stress [2]. The CDC states that about 78.6 million American adults are overweight or obese [3], and about 25% to 40% of US adults attempt to lose weight each year [4]. It is unclear what proportion of those who lose weight are successful at maintaining their weight loss [5,6].
Researchers and practitioners alike understand that maintaining weight loss is difficult. Most studies on weight regain have focused on biological and lifestyle factors [7]. This article did a good job in detailing gaps in knowledge and supporting the need for further study of psychosocial variables. The results demonstrated complex, interactive relationships between multiple factors. Three psychosocial variables were found to be statistically significant in relation to weight loss, but more significant relationships were found between race, perceived stress, and weight loss.
As a secondary analysis, this study carries the strengths of the initial study, including a 30-month study duration. In addition, this study was randomized and included 3 different treatment arms. Lastly, there was a large representation of black participants, and the authors suggested that the results may offer and initial characterization of this population.
A limitation of this study was the use of self-reported data, which may be subject to be bias and be less reliable than direct measured data. Also, these measures were apparently taken only once prior to the beginning of phase 2 with no rationale provided. Psychosocial variables such as social support, quality of life, and perceived stress are dynamic and cannot be accurately encapsulated in isolated moments in time. The sample’s diversity was also lacking as there were few Hispanics and no Asian
participants.
Applications for Clinical Practice
A few significant, interactive relationships were discovered in this examination and require further study. Continued research and a better understanding of these complex relationships are needed.
—Angela M. Godwin Beoku-Betts, MSN, FNP–BC
1. Svetkey LP, Stevens VJ, Brantley PJ, et al; Weight Loss Maintenance Collaborative Research Group. Comparison of strategies for sustaining weight loss: the weight loss maintenance randomized controlled trial. JAMA 2008;299:1139–48.
2. Grundy SM. Multifactorial causation of obesity: implications for prevention. Am J Clin Nutr. 1998 Mar;67(3 Suppl):563S–72S.
3. Ogden CL, Carroll MD, Kit BK, Flegal KM. Prevalence of childhood and adult obesity in the United States, 2011–2012. JAMA 2014;311:806–14.
4. Williamson DF, Serdula MK, Anda RF, et al. Weight loss attempts in adults: goals, duration, and rate of weight loss. Am J Public Health 1992;82:1251–7.
5. The National Weight Control Registry. (1994). Accessed 5 Oct 2014 at www.nwcr.ws/default.htm.
6. Kraschnewski JL, Boan J, Esposito J, et al. Long-term weight loss maintenance in the United States. Int J Obes (Lond) 2010;34:1644–54.
7. Maclean PS, Bergouignan A, Cornier MA, Jackman MR. Biology’s response to dieting: the impetus for weight regain. Am J Physiol Regul Integr Comp Physiol 2011;301:R581–600.
Study Overview
Objective. To identify psychosocial predictors of weight loss maintenance in a multi-site clinical trial following a group-based weight loss program.
Design. Secondary analysis of a 2-phase randomized controlled trial. The first phase was a 6-month group-based weight loss program and the second phase was a 30-month trial comparing weight loss maintenance strategies.
Setting and participants. The patients studied were participants in the Weight Loss Maintenance trial [1], which was conducted at 4 US clinical centers. Eligible participants were overweight and obese adults with a BMI between 25 to 45 who were actively taking medication for hypertension, dyslipidemia, or both. 1685 patients were recruited into the weight-loss phase, and those who lost at least 4 kg (n = 1032) were then randomly assigned to 1 of the 3 maintenance arms: (a) self-directed with minimal intervention (control), (b) interactive technology that consisted of unlimited, interactive study website access, or (c) personal contact consisting of monthly, personalized telephone calls and quarterly face-to-face contact with a study interventionist. There was 1 death in each treatment group, so a total of 1029 participants were included in the analyses.
Main outcome measures. The researchers examined the associations between psychosocial variables and weight change outcomes at 12 and 30 months. Patients completed 5 self-report measures at the time of randomization into phase 2 of the study: a social support and exercise survey, a social support and eating habits survey, the SF-36, the Patient Health Questionnaire Depression Scale, and the Perceived Stress Scale.
Results. Of the 1029 participants initially included for analyses, 2 failed to provide complete data on the social support scales and 2 were identified as outliers at both 12 and 30 months. This resulted in a final sample size of 1025 participants; 63% were women, 61% were non-Latino white, and 38% were black. The mean age was 55.6 years. All groups regained weight, with the personal contact group having the least amount of gain. However, the mean weight at 30 months remained significantly lower than the mean weight at entry into phase 1.
Only 3 psychosocial variables were significantly related to weight loss at 12 and 30 months. At both time marks, less weight regain was associated with higher SF-36 mental health composite scores (P < 0.01). Interestingly, for black participants at the 12-month mark, more weight regain was associated with higher exercise encouragement from friends (P < 0.05). At 30 months, more weight regain was associated with friends’ encouragement for healthy eating (P < 0.05).
Conclusion. The psychosocial variables that were self-reported upon entering phase 2 may predict the ability of an individual to maintain weight loss at 12 and 30 months. The significant, complex interactions between these variables, race, sex, and treatment interventions need to be further studied for proper incorporation into a weight loss maintenance program.
Commentary
The case for the obesity epidemic has been long established. Unfortunately, the causes for weight gain can be complicated and multifactorial. Factors associated with weight gain include nonmodifiable factors such as age, sex, and race as well as modifiable factors like lifestyle, eating habits, and perceived stress [2]. The CDC states that about 78.6 million American adults are overweight or obese [3], and about 25% to 40% of US adults attempt to lose weight each year [4]. It is unclear what proportion of those who lose weight are successful at maintaining their weight loss [5,6].
Researchers and practitioners alike understand that maintaining weight loss is difficult. Most studies on weight regain have focused on biological and lifestyle factors [7]. This article did a good job in detailing gaps in knowledge and supporting the need for further study of psychosocial variables. The results demonstrated complex, interactive relationships between multiple factors. Three psychosocial variables were found to be statistically significant in relation to weight loss, but more significant relationships were found between race, perceived stress, and weight loss.
As a secondary analysis, this study carries the strengths of the initial study, including a 30-month study duration. In addition, this study was randomized and included 3 different treatment arms. Lastly, there was a large representation of black participants, and the authors suggested that the results may offer and initial characterization of this population.
A limitation of this study was the use of self-reported data, which may be subject to be bias and be less reliable than direct measured data. Also, these measures were apparently taken only once prior to the beginning of phase 2 with no rationale provided. Psychosocial variables such as social support, quality of life, and perceived stress are dynamic and cannot be accurately encapsulated in isolated moments in time. The sample’s diversity was also lacking as there were few Hispanics and no Asian
participants.
Applications for Clinical Practice
A few significant, interactive relationships were discovered in this examination and require further study. Continued research and a better understanding of these complex relationships are needed.
—Angela M. Godwin Beoku-Betts, MSN, FNP–BC
1. Svetkey LP, Stevens VJ, Brantley PJ, et al; Weight Loss Maintenance Collaborative Research Group. Comparison of strategies for sustaining weight loss: the weight loss maintenance randomized controlled trial. JAMA 2008;299:1139–48.
2. Grundy SM. Multifactorial causation of obesity: implications for prevention. Am J Clin Nutr. 1998 Mar;67(3 Suppl):563S–72S.
3. Ogden CL, Carroll MD, Kit BK, Flegal KM. Prevalence of childhood and adult obesity in the United States, 2011–2012. JAMA 2014;311:806–14.
4. Williamson DF, Serdula MK, Anda RF, et al. Weight loss attempts in adults: goals, duration, and rate of weight loss. Am J Public Health 1992;82:1251–7.
5. The National Weight Control Registry. (1994). Accessed 5 Oct 2014 at www.nwcr.ws/default.htm.
6. Kraschnewski JL, Boan J, Esposito J, et al. Long-term weight loss maintenance in the United States. Int J Obes (Lond) 2010;34:1644–54.
7. Maclean PS, Bergouignan A, Cornier MA, Jackman MR. Biology’s response to dieting: the impetus for weight regain. Am J Physiol Regul Integr Comp Physiol 2011;301:R581–600.
Are Mortality Benefits from Bariatric Surgery Observed in a Nontraditional Surgical Population? Evidence from a VA Dataset
Study Overview
Objective. To determine the association between bariatric surgery and long-term mortality rates among patients with severe obesity.
Design. Retrospective cohort study.
Setting and participants. This analysis relied upon data from Veteran’s Administration (VA) patients undergoing bariatric surgery between 2000 and 2011 and a group of matched controls. For this data-only study, a waiver of informed consent was obtained. Investigators first used the VA Surgical Quality Improvement Program (SQIP) dataset to identify all bariatric surgical procedures performed at VA hospitals between 2000 and the end of 2011, excluding patients who had any evidence of body mass index (BMI) less than 35 kg/m2 and those with certain baseline diagnoses that would be considered contraindications for surgery, as well as those who had prolonged inpatient stays immediately prior to their surgical date. No upper or lower age limits appear to have been specified, and no upper BMI limit appeared to have been set.
Once all surgical patients were identified, the investigators attempted to find a group of similar control patients who had not undergone surgery. Initially they pulled candidate matches for each surgical patient based on having the same sex, age-group (within 5 years), BMI category (35-40, 40-50, >50), diabetes status (present or absent), racial category, and VA region. From these candidates, they selected up to 3 of the closest matches on age, BMI, and a composite comorbidity score based on inpatient and outpatient claims in the year prior to surgery. The authors specified that controls could convert to surgical patients during the follow-up period, in which case their data was censored beginning with the surgical procedure. However, if a control patient underwent surgery during 2012 or 2013, censoring was not possible given that the dataset for identifying surgeries contained only procedures performed through the end of 2011.
Main outcome measures. The primary outcome of interest was time to death (any cause) beginning at the date of surgery (or baseline date for nonsurgical controls) through the end of 2013. The investigators built Cox proportional hazards models to evaluate survival using multivariable models to adjust for baseline characteristics, including those involved in the matching process, as well as others that might have differentially impacted both likelihood of undergoing surgery and mortality risk. These included marital status, insurance markers of low income or disability, and a number of comorbid medical and psychiatric diagnoses.
In addition to the main analyses, the investigators also looked for effect modification of the surgery-mortality relationship by a patient’s sex and presence or absence of diabetes at the time of surgery, as well as the time period in which their surgery was conducted, dichotomized around the year 2006. This year was selected for several reasons, including that it was the year in which a VA-wide comprehensive weight management and surgical selection program was instituted.
Results. The surgical cohort was made up of 2500 patients, and there were 7462 matched controls. The surgical and control groups were similar with respect to matched baseline characteristics, tested using standardized differences (as opposed to t test or chi-square). Mean (SD) age was 52 (8.8) years for surgical patients versus 53 (8.7) years for controls. 74% of patients in both the surgical and control groups were men, and 81% in both groups were white (ethnicity not specified). Mean (SD) baseline BMI was 47 (7.9) kg/m2 in the surgical group and 46 (7.3) kg/m2 for controls.
Some between-group differences were present for baseline characteristics that had not been included in the matching protocol. More surgical patients than controls had diagnoses of hypertension (80% surgical vs. 70% control), dyslipidemia (61% vs. 52%), arthritis (27% vs. 15%), depression (44% vs. 32%), GERD (35% vs.19%), and fatty liver disease (6.6% vs. 0.6%). In contrast, more control patients than surgical patients had diagnoses of alcohol abuse (6.2% in controls vs. 3.9% in surgical) and schizophrenia (4.9% vs. 1.8%). Also, although a number of different surgical types were represented in the cohort, the vast majority of procedures were classified as Roux-en-Y gastric bypasses (RYGB). 53% of the procedures were open RYGB, 21% were laparoscopic RYGB, 10% were adjustable gastric bands (AGB), and 15% were vertical sleeve gastrectomies (VSG).
Mortality was lower among surgical patients than among matched controls during a mean follow-up time of 6.9 years for surgical patients and 6.6 years for controls. Namely, the 1-, 5- and 10-year cumulative mortality rates for surgical patients were: 2.4%, 6.4%, and 13.8%. Unadjusted mortality rates for nonsurgical controls were lower initially (1.7% at 1 year), but then much higher at years 5 (10.4%), and 10 (23.9%). In multivariable Cox models, the hazard ratio (HR) for mortality in bariatric patients versus controls was nonsignificant at 1 year of follow-up. However, between 1 and 5 years after surgery (or after baseline), multivariable models showed an HR (95% CI) of 0.45 (0.36–0.56) for mortality among surgical patients versus controls. For those with more than 5 years of follow up, the HR was similar (0.47, 95% CI 0.39–0.58) for death among surgical versus control patients. The investigators found that the year during which a patient underwent surgery (before or after 2006) did impact mortality during the first postoperative year, with those who had earlier procedures (2000-2005) exhibiting a significantly higher risk of death in that year relative to non-operative controls (HR 1.66, 95% CI 1.19–2.33). No significant sex or diabetes interactions were observed for the surgery-mortality relationship in multivariable Cox models. There was no information provided as to the breakdown of cause of death within the larger “all-cause mortality” outcome.
Conclusion. Bariatric surgery was associated with significantly lower all-cause mortality among surgical patients in the VA over a 5- to 14-year follow-up period compared with a group of severely obese VA patients who did not undergo surgery.
Commentary
Rates of severe obesity (BMI ≥ 35 kg/m2) have risen at a faster pace than those of obesity in the United States over the past decade [1], driving clinicians, patients and payers to search for effective methods of treating this condition. Bariatric surgery has emerged as the most effective treatment for severe obesity; however, the existing surgical literature is predominated by studies with short- or medium-term postoperative follow-up and homogenous participant populations containing large numbers of younger non-Hispanic white women. Research from the Swedish Obesity Study (SOS), as well as smaller US-based studies, has suggested that severely obese patients who undergo bariatric surgery have better long-term survival than their nonsurgical counterparts [2,3].Counter to this finding, a previous medium-term study utilizing data from VA hospitals did not find that surgery conferred a mortality benefit among this largely male, older, and sicker patient population [4].The current study, by the same group of investigators, attempts to update the previous finding by including more recent surgical data and a longer follow-up period, to see whether or not a survival benefit appears to emerge for VA patients undergoing bariatric surgery.
A major strength of this study was the use of a large and comprehensive clinical dataset, a strength of many studies utilizing data from the VA. The availability of clinical data such as BMI, as well as diagnostic codes and sociodemographic variables, allowed the authors to match and adjust for a number of potential confounders of the surgery-mortality relationship. Another unique feature of VA data is that members of this health care system can often be followed regardless of their location, as the unified medical record transfers between states. This is in contrast to many claims-based or single-center studies of surgery, where patients are lost to follow-up if they move or transfer insurance providers. This study clearly benefited from this aspect of VA data, with a mean postoperative follow-up period of over 5 years in both study groups, much longer than is typically observed in bariatric surgical studies, and probably a necessary feature for examining more of a rare outcome such as mortality (as opposed to comparing weight loss or diabetes remission). Another clear contribution of this study is that it focused on a group of patients not typical of bariatric cohorts—this group was slightly older and sicker, with far more men than women, and therefore at a much higher risk of mortality than the typically younger females that are part of most studies.
Although the authors did adjust for many factors when comparing the surgical and nonsurgical groups, it is possible, as with any observational study, that unmeasured confounders may have been present. Psychosocial and behavioral features that may be linked both to a person’s likelihood of undergoing surgery, and to their mortality risk are of particular concern. It is worth noting, for example, that far more patients in the nonsurgical group were identified as schizophrenic, and that the rate of schizophrenia in that severely obese group was much higher than that of the general population. This pattern may have some relationship to the weight-gain promoting effect of antipsychotic medications and the unfortunate reality that patients with severe obesity and severe mental illness may not be as well equipped to seek out surgery (or viewed as acceptable candidates) as those without severe mental illness. One possible limitation mentioned by the authors was that control group patients who underwent surgery in 2012 or 2013 would not have been recognized (and thus had their data censored in this study), possibly leading to incorrect categorization of exposure category for some amount of person-time during follow-up. In general, though, there is a low likelihood of this phenomenon impacting the findings, given both the relative infrequency of crossover observed in the cohort prior to 2011, and the relatively short amount of person-time any later crossovers would have contributed in the later years of the study.
Although codes for baseline disease states were adjusted for in multivariable analyses, the surgical patients were in general a medically sicker group at baseline than control patients. As the authors point out, if anything, this should have biased the findings in favor of seeing higher mortality rate in the surgical group, the opposite of what was found. Further strengthening the finding of a correlation between survival and surgery is the mix of procedure types included in this study. Over half of the procedures were open RYGB surgeries, with far fewer of the more modern and lower risk procedures (eg, laparoscopic RYGB) represented. Again, this mix of procedures would be expected to result in an overestimation of mortality in surgical patients relative to what might be observed if all patients had been drawn from later years of the cohort, as surgical technique evolved.
Applications for Clinical Practice
This study adds to the evidence that patients with severe obesity who undergo bariatric surgery have a lower risk of death up to 10 years after their surgery compared with patients who do not have these procedures. The findings of this work should provide encouragement, particularly for managaing older adults with more longstanding comorbidities. Those who are strongly motivated to pursue weight loss surgery, and who are deemed good candidates by bariatric teams, may add years to their lives by undergoing one of these procedures. As always, however, the quality of life experienced by patients after surgery, and a realistic expectation of the ways in which surgery will fundamentally change their lifestyle, must be a critical part of the discussion.
—Kristina Lewis, MD, MPH
1. Sturm R, Hattori A. Morbid obesity rates continue to rise rapidly in the United States. Int J Obesity 2013;37:889-91.
2. Sjostrom L, Narbo K, Sjostrom CD, et al. Effects of bariatric surgery on mortality in Swedish obese subjects. N Engl J Med 2007;357:741–52.
3. Adams TD, Gress RE, Smith SC, et al. Long-term mortality after gastric bypass surgery. N Engl J Med 2007;357:753–61.
4. Maciejewski ML, Livingston EH, Smith VA, et al. Survival among high-risk patients after bariatric surgery. JAMA 2011;305:2419–26.
Study Overview
Objective. To determine the association between bariatric surgery and long-term mortality rates among patients with severe obesity.
Design. Retrospective cohort study.
Setting and participants. This analysis relied upon data from Veteran’s Administration (VA) patients undergoing bariatric surgery between 2000 and 2011 and a group of matched controls. For this data-only study, a waiver of informed consent was obtained. Investigators first used the VA Surgical Quality Improvement Program (SQIP) dataset to identify all bariatric surgical procedures performed at VA hospitals between 2000 and the end of 2011, excluding patients who had any evidence of body mass index (BMI) less than 35 kg/m2 and those with certain baseline diagnoses that would be considered contraindications for surgery, as well as those who had prolonged inpatient stays immediately prior to their surgical date. No upper or lower age limits appear to have been specified, and no upper BMI limit appeared to have been set.
Once all surgical patients were identified, the investigators attempted to find a group of similar control patients who had not undergone surgery. Initially they pulled candidate matches for each surgical patient based on having the same sex, age-group (within 5 years), BMI category (35-40, 40-50, >50), diabetes status (present or absent), racial category, and VA region. From these candidates, they selected up to 3 of the closest matches on age, BMI, and a composite comorbidity score based on inpatient and outpatient claims in the year prior to surgery. The authors specified that controls could convert to surgical patients during the follow-up period, in which case their data was censored beginning with the surgical procedure. However, if a control patient underwent surgery during 2012 or 2013, censoring was not possible given that the dataset for identifying surgeries contained only procedures performed through the end of 2011.
Main outcome measures. The primary outcome of interest was time to death (any cause) beginning at the date of surgery (or baseline date for nonsurgical controls) through the end of 2013. The investigators built Cox proportional hazards models to evaluate survival using multivariable models to adjust for baseline characteristics, including those involved in the matching process, as well as others that might have differentially impacted both likelihood of undergoing surgery and mortality risk. These included marital status, insurance markers of low income or disability, and a number of comorbid medical and psychiatric diagnoses.
In addition to the main analyses, the investigators also looked for effect modification of the surgery-mortality relationship by a patient’s sex and presence or absence of diabetes at the time of surgery, as well as the time period in which their surgery was conducted, dichotomized around the year 2006. This year was selected for several reasons, including that it was the year in which a VA-wide comprehensive weight management and surgical selection program was instituted.
Results. The surgical cohort was made up of 2500 patients, and there were 7462 matched controls. The surgical and control groups were similar with respect to matched baseline characteristics, tested using standardized differences (as opposed to t test or chi-square). Mean (SD) age was 52 (8.8) years for surgical patients versus 53 (8.7) years for controls. 74% of patients in both the surgical and control groups were men, and 81% in both groups were white (ethnicity not specified). Mean (SD) baseline BMI was 47 (7.9) kg/m2 in the surgical group and 46 (7.3) kg/m2 for controls.
Some between-group differences were present for baseline characteristics that had not been included in the matching protocol. More surgical patients than controls had diagnoses of hypertension (80% surgical vs. 70% control), dyslipidemia (61% vs. 52%), arthritis (27% vs. 15%), depression (44% vs. 32%), GERD (35% vs.19%), and fatty liver disease (6.6% vs. 0.6%). In contrast, more control patients than surgical patients had diagnoses of alcohol abuse (6.2% in controls vs. 3.9% in surgical) and schizophrenia (4.9% vs. 1.8%). Also, although a number of different surgical types were represented in the cohort, the vast majority of procedures were classified as Roux-en-Y gastric bypasses (RYGB). 53% of the procedures were open RYGB, 21% were laparoscopic RYGB, 10% were adjustable gastric bands (AGB), and 15% were vertical sleeve gastrectomies (VSG).
Mortality was lower among surgical patients than among matched controls during a mean follow-up time of 6.9 years for surgical patients and 6.6 years for controls. Namely, the 1-, 5- and 10-year cumulative mortality rates for surgical patients were: 2.4%, 6.4%, and 13.8%. Unadjusted mortality rates for nonsurgical controls were lower initially (1.7% at 1 year), but then much higher at years 5 (10.4%), and 10 (23.9%). In multivariable Cox models, the hazard ratio (HR) for mortality in bariatric patients versus controls was nonsignificant at 1 year of follow-up. However, between 1 and 5 years after surgery (or after baseline), multivariable models showed an HR (95% CI) of 0.45 (0.36–0.56) for mortality among surgical patients versus controls. For those with more than 5 years of follow up, the HR was similar (0.47, 95% CI 0.39–0.58) for death among surgical versus control patients. The investigators found that the year during which a patient underwent surgery (before or after 2006) did impact mortality during the first postoperative year, with those who had earlier procedures (2000-2005) exhibiting a significantly higher risk of death in that year relative to non-operative controls (HR 1.66, 95% CI 1.19–2.33). No significant sex or diabetes interactions were observed for the surgery-mortality relationship in multivariable Cox models. There was no information provided as to the breakdown of cause of death within the larger “all-cause mortality” outcome.
Conclusion. Bariatric surgery was associated with significantly lower all-cause mortality among surgical patients in the VA over a 5- to 14-year follow-up period compared with a group of severely obese VA patients who did not undergo surgery.
Commentary
Rates of severe obesity (BMI ≥ 35 kg/m2) have risen at a faster pace than those of obesity in the United States over the past decade [1], driving clinicians, patients and payers to search for effective methods of treating this condition. Bariatric surgery has emerged as the most effective treatment for severe obesity; however, the existing surgical literature is predominated by studies with short- or medium-term postoperative follow-up and homogenous participant populations containing large numbers of younger non-Hispanic white women. Research from the Swedish Obesity Study (SOS), as well as smaller US-based studies, has suggested that severely obese patients who undergo bariatric surgery have better long-term survival than their nonsurgical counterparts [2,3].Counter to this finding, a previous medium-term study utilizing data from VA hospitals did not find that surgery conferred a mortality benefit among this largely male, older, and sicker patient population [4].The current study, by the same group of investigators, attempts to update the previous finding by including more recent surgical data and a longer follow-up period, to see whether or not a survival benefit appears to emerge for VA patients undergoing bariatric surgery.
A major strength of this study was the use of a large and comprehensive clinical dataset, a strength of many studies utilizing data from the VA. The availability of clinical data such as BMI, as well as diagnostic codes and sociodemographic variables, allowed the authors to match and adjust for a number of potential confounders of the surgery-mortality relationship. Another unique feature of VA data is that members of this health care system can often be followed regardless of their location, as the unified medical record transfers between states. This is in contrast to many claims-based or single-center studies of surgery, where patients are lost to follow-up if they move or transfer insurance providers. This study clearly benefited from this aspect of VA data, with a mean postoperative follow-up period of over 5 years in both study groups, much longer than is typically observed in bariatric surgical studies, and probably a necessary feature for examining more of a rare outcome such as mortality (as opposed to comparing weight loss or diabetes remission). Another clear contribution of this study is that it focused on a group of patients not typical of bariatric cohorts—this group was slightly older and sicker, with far more men than women, and therefore at a much higher risk of mortality than the typically younger females that are part of most studies.
Although the authors did adjust for many factors when comparing the surgical and nonsurgical groups, it is possible, as with any observational study, that unmeasured confounders may have been present. Psychosocial and behavioral features that may be linked both to a person’s likelihood of undergoing surgery, and to their mortality risk are of particular concern. It is worth noting, for example, that far more patients in the nonsurgical group were identified as schizophrenic, and that the rate of schizophrenia in that severely obese group was much higher than that of the general population. This pattern may have some relationship to the weight-gain promoting effect of antipsychotic medications and the unfortunate reality that patients with severe obesity and severe mental illness may not be as well equipped to seek out surgery (or viewed as acceptable candidates) as those without severe mental illness. One possible limitation mentioned by the authors was that control group patients who underwent surgery in 2012 or 2013 would not have been recognized (and thus had their data censored in this study), possibly leading to incorrect categorization of exposure category for some amount of person-time during follow-up. In general, though, there is a low likelihood of this phenomenon impacting the findings, given both the relative infrequency of crossover observed in the cohort prior to 2011, and the relatively short amount of person-time any later crossovers would have contributed in the later years of the study.
Although codes for baseline disease states were adjusted for in multivariable analyses, the surgical patients were in general a medically sicker group at baseline than control patients. As the authors point out, if anything, this should have biased the findings in favor of seeing higher mortality rate in the surgical group, the opposite of what was found. Further strengthening the finding of a correlation between survival and surgery is the mix of procedure types included in this study. Over half of the procedures were open RYGB surgeries, with far fewer of the more modern and lower risk procedures (eg, laparoscopic RYGB) represented. Again, this mix of procedures would be expected to result in an overestimation of mortality in surgical patients relative to what might be observed if all patients had been drawn from later years of the cohort, as surgical technique evolved.
Applications for Clinical Practice
This study adds to the evidence that patients with severe obesity who undergo bariatric surgery have a lower risk of death up to 10 years after their surgery compared with patients who do not have these procedures. The findings of this work should provide encouragement, particularly for managaing older adults with more longstanding comorbidities. Those who are strongly motivated to pursue weight loss surgery, and who are deemed good candidates by bariatric teams, may add years to their lives by undergoing one of these procedures. As always, however, the quality of life experienced by patients after surgery, and a realistic expectation of the ways in which surgery will fundamentally change their lifestyle, must be a critical part of the discussion.
—Kristina Lewis, MD, MPH
1. Sturm R, Hattori A. Morbid obesity rates continue to rise rapidly in the United States. Int J Obesity 2013;37:889-91.
2. Sjostrom L, Narbo K, Sjostrom CD, et al. Effects of bariatric surgery on mortality in Swedish obese subjects. N Engl J Med 2007;357:741–52.
3. Adams TD, Gress RE, Smith SC, et al. Long-term mortality after gastric bypass surgery. N Engl J Med 2007;357:753–61.
4. Maciejewski ML, Livingston EH, Smith VA, et al. Survival among high-risk patients after bariatric surgery. JAMA 2011;305:2419–26.