User login
A Systematic Review of Tibialis Anterior Tendon Rupture Treatments and Outcomes
Subcutaneous rupture of the tibialis anterior (TA) tendon has been reported predominantly in case reports and small case series because of the relative rarity of the injury. Unlike traumatic lacerations or open injuries to the tendon, subcutaneous injuries often go unnoticed by patients because of compensation by surrounding dorsiflexors of the foot and toes—namely, the extensor hallucis longus (EHL) and the extensor digitorum longus (EDL).1 This can delay presentation to an orthopedic surgeon and lead to difficulties in treatment, such as allograft or autograft being required if primary repair is no longer possible. Case reports and series have described treatment methods as well as anecdotal evidence of outcomes after operative repair or conservative treatment, but there have been no comprehensive systematic reviews of outcomes after various types of treatment. Authors have come to conclusions about expected outcomes based on patient age, time to treatment, treatment used, and other variables, but no reviews have examined these variables across multiple studies. Given the low level of the evidence presented in most of these reports, it is difficult to perform a meta-analysis of the data.
Instead, we systematically reviewed 87 cases from all pertinent studies and examined commonly reported data, such as patient age, time to treatment, treatment used, and outcome. Using the PICO (population, intervention, comparison, outcome) model for systematic reviews, we looked at patients who had closed, spontaneous, complete rupture of the TA tendon and underwent operative repair or conservative treatment of the injury. Outcomes surveyed included successful operative repair or conservative treatment, as measured by objective systems, such as MMSS (Manual Muscle Strength Scale) score, AOFAS (American Orthopaedic Foot and Ankle Society) hindfoot score, and FAOS (Foot and Ankle Outcome Score) testing, or by subjective description of posttreatment outcome.
We intend this review to serve as a guide for surgeons who find themselves treating a ruptured TA tendon, a relatively rare injury. They will be able to select the operative technique or conservative treatment that best matches the patient’s needs, based on comparison with previous case studies.
Materials and Methods
The cases reviewed for this study were found through a comprehensive PubMed search and an independent review of references cited in similar articles. Articles included were published between 1975 and 2012, inclusive. The latest search was performed on March 22, 2013. The search criteria were tibialis anterior [Title/Abstract] OR anterior tibial [Title/Abstract] AND rupture [Title/Abstract]) AND surgery. Only English-language articles, or articles already translated into English, were included. Eligible studies described cases of closed tendon rupture. No traumatic lacerations or open ruptures were included. If a study described both open and subcutaneous ruptures, only the subcutaneous cases were included. Further, partial ruptures were not included. In addition, ruptures caused directly by a known comorbid condition—for example, a rupture caused by a gouty tophaceous deposit at the site of rupture2—were not included. Data were extracted from publications independently and analyzed in a Microsoft Excel workbook (Microsoft, Redmond, Washington). Variables examined included patient age and sex, side involved, time to treatment, mechanism of injury, defect size, predisposing comorbidities, surgery or conservative treatment, type of operative repair (if applicable), graft used (if applicable), pretreatment function (by independent scoring system, if applicable), and posttreatment function. These variables were not necessarily reported in all the studies.
A potential bias exists in our PubMed search. As the query was specific for studies that included operative repair of a ruptured TA tendon, case studies that involved only conservative treatment were excluded. However, the primary goal of this review was to compare operative possibilities and the patient characteristics and outcomes associated with these surgeries.
Results
Figure 1 shows the criteria used to select eligible papers for review. Twenty-three papers matched the criteria.3-25 Data were independently extracted from these papers, as described in the Methods section. Again, not all variables were reported by all authors. Sammarco and colleagues21 reported time to treatment as a mean for 2 groups: 8 cases defined as “early” treatment (mean time to treatment, 0.625 months) and 11 defined as “late” treatment (mean time to treatment, 10.7 months). These mean times were therefore used independently for each case in calculating mean time to treatment for this systematic review.
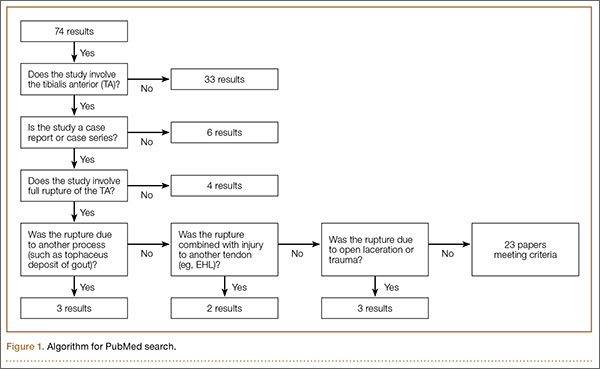
Table 1 lists the demographics. There were 40 male and 25 female patients, and 22 cases in which sex was not specified. Mean age was 63.9 years (surgery group), 72.4 years (conservative treatment group), and 65.8 years (overall). Of the 87 patients, 72 underwent surgery, and 15 were treated with conservative measures.
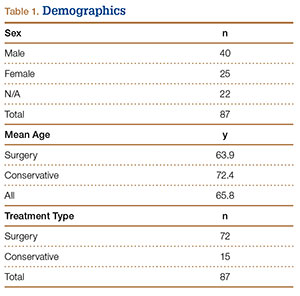
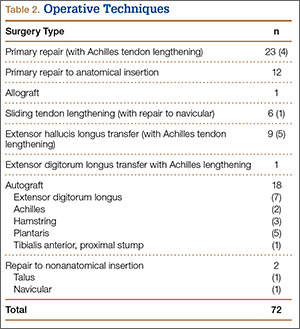
Table 2 lists the operative techniques identified. Of the 72 surgeries, 23 were primary repairs, 12 were primary repairs of the anatomical insertion, and 18 involved use of autograft.
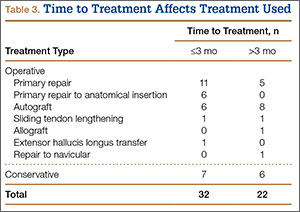
Time to treatment was available for 54 of the 87 cases (Table 3). Primary repair was most often performed in cases in which the injury was less than 3 months old, and autograft was most often used in cases in which the injury occurred more than 3 months before presentation.
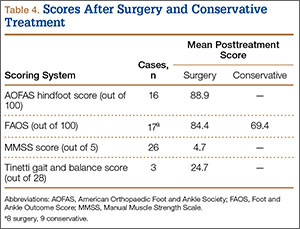
Posttreatment outcome scores were available for 59 cases. Only 3 authors reported preoperative scores.5,21,24 None of the authors who used conservative treatment measures reported pretreatment scores. Scores used included the MMSS score (26 cases), the AOFAS hindfoot score (16 cases),26 the FAOS (17 cases),27 and the Tinetti gait and balance score (3 cases; the author also used the MMSS score).28Table 4 lists the mean posttreatment scores for patients who underwent surgery and patients treated conservatively. AOFAS, MMSS, and Tinetti scores and FAOS were used by authors presenting operative treatment outcomes. Only posttreatment FAOS was available for both surgery (84.4/100) and conservative treatment (69.4/100).
Discussion
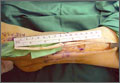
Closed rupture of the TA tendon is a relatively rare entity occurring mostly in older patients without any history of acute, traumatic injury. Some patients, however, recall a particular moment of rupture, often accompanied immediately by pain and swelling, which eventually resolve. Later sequelae include footdrop with associated steppage gait and a palpable mass on the dorsal aspect of the ankle.3,21 Chronic TA tendon rupture can also lead to clawing of the toes as the other foot extensors (EHL, EDL) overcompensate. Cohen and Gordon1 described the case of a patient who ruptured a TA tendon 25 years earlier and then, in the absence of operative repair, developed hypertrophy of the EHL and the EDL. This extensor substitution led to hammer toes and plantar prominence of the metatarsal heads, ultimately leading to moderate pain and a neuroma. Although this particular outcome is likely rare, the more common sequelae of footdrop, flatfoot, Achilles tendon contracture, and compromised gait are reason enough to consider operative repair for any ruptured TA tendon.
Most previous studies of TA tendon rupture were case reports and case studies. In the largest series, Sammarco and colleagues21 described 19 cases of closed rupture. These included 3 traumatic cases, 1 by blunt trauma to the tendon and 2 of open laceration, all treated surgically with various methods. Unfortunately, these 3 traumatic cases were not separated in the authors’ analysis and therefore had to be included in this systematic review. Including them here did not compromise our goals in this review, which included examining typical patient demographics and the most common methods of operative repair.
Conservative measures remain a treatment possibility for some patients. We found that patients treated with conservative measures historically have been older (mean age, 72.4 years) than patients treated surgically (mean age, 63.9 years). However, advanced age itself is not a contraindication for operative repair of a TA tendon rupture, and authors have described positive outcomes for active, elderly (>70 years) patients who wanted to maintain their activity level and therefore opted for operative repair.7,8,10,13,16,24 Ouzounian and Anderson18 described functional limitations (eg, persistent footdrop, slapfoot gait, limitations in walking) after conservative treatment with an ankle-foot orthosis. Operative repair offers the chance for better functional outcome for patients who are surgical candidates and lead even a mildly active lifestyle.
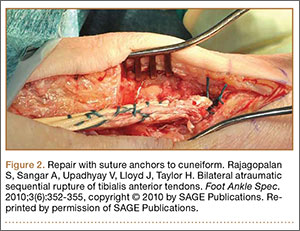
Of operative repair methods, primary repair is used most often. This technique, however, must be allowed by the gap between the 2 ruptured ends after débridement of any necrotic tissue. If the distal stump is not viable, primary repair of the proximal stump to the native anatomical insertion is feasible. Figure 2, reprinted from a case report by Rajagopalan and colleagues,19 shows a ligament–osseous reattachment of the proximal stump using suture anchors to the medial cuneiform. Both primary repair and repair to the anatomical insertion can be augmented with Achilles tendon lengthening if needed to achieve balance between flexor and extensor functions of the ankle.
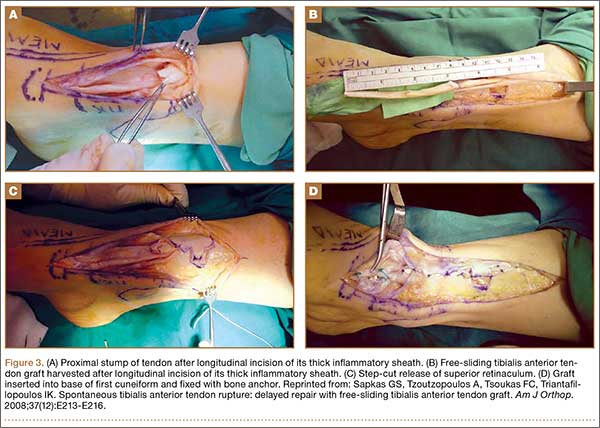
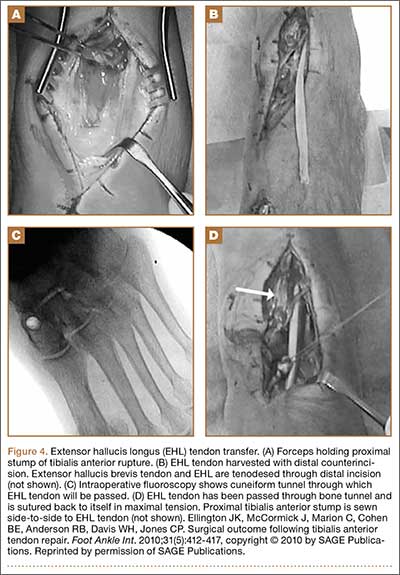
If the gap between the 2 stumps cannot be covered by the native tendon, then autograft, another surgical technique with positive outcomes, can be used. The most popular autograft sites historically have been the EDL, Achilles, and plantaris tendons. In addition, Goehring and Liakos9 described 3 cases of good results with semitendinosus autograft. Sapkas and colleagues22 used a free-sliding TA graft harvested from the healthy tissue of the proximal tendon stump. Their technique is depicted in Figure 3. Sliding tendon lengthening, well described by Trout and colleagues24 in a case study, is feasible for use of the native tendon when there is a gap to bridge between the 2 stumps of ruptured tendon. EHL or EDL transfer with or without Achilles lengthening is another option, albeit historically less often used.6,7 This technique is depicted in Figure 4, reprinted from a case series by Ellington and colleagues,7 who used EHL transfer with and without Achilles tendon lengthening in 9 cases.
Last, less popular techniques have included repair to sites other than the medial cuneiform, including the neck of the talus and the navicular bone.10,13 An Achilles tendon allograft was used in a case described by Aderinto and Gross3 to repair a ruptured tendon found incidentally on preoperative examination for a scheduled knee arthroplasty. The patient had a postoperative MMSS score of 4/5.
Overall, primary repair is clearly preferred, but successful outcomes can be achieved by other means. As Table 3 shows, primary repair is more often used for ruptures less than 3 months old, and autograft for older ruptures. Although which operative technique to use can be decided after necrotic tissue is débrided, surgeons should try to ascertain age of injury ahead of time so that, going into surgery, they will have a better idea of the feasibility of primary repair.
Posttreatment ankle scores were not widely available. As Table 4 indicates, only FAOS was used for the conservative treatment cases. However, raw mean FAOS and raw mean AOFAS hindfoot, MMSS, and Tinetti scores showed that good outcomes and high scores can be achieved with surgery. Further, the mean FAOS reported by Gwynne-Jones and colleagues10 and Markarian and colleagues13 showed a clinically significant difference between surgery and conservative treatment. DiDomenico and colleagues,5 Sammarco and colleagues,21 and Trout and colleagues24 were the only authors who reported pretreatment and posttreatment scores.
We intend this systematic review of the literature on closed TA rupture to serve as a guide for surgeons who find themselves treating this relatively rare injury, which often presents with only a chief complaint of the foot catching while walking. Overall, the literature shows that operative repair provides very good outcomes for many patients. Patients who are surgical candidates and amenable to surgery can be counseled that operative repair leads to fewer sequelae, such as persistent footdrop and flatfooted gait, with a strong likelihood of return to baseline activity status. Patients who are not surgical candidates or are strongly against surgery can be offered conservative treatment with an ankle-foot orthosis or physical therapy, but they should also be counseled that persistent gait abnormalities and weakness in dorsiflexion are likely outcomes. Surgeons must also consider age of injury (time from probable rupture to presentation), estimating a particular moment of rupture if unknown by the patient. They can then gauge the feasibility of primary repair and, during surgery, decide which technique (primary repair, tendon transfer, autograft, or other technique) will produce the best results. They can also use scores such as the FAOS and the AOFAS hindfoot, MMSS, and Tinetti scores to compare preoperative and postoperative function, though subjective reports of return to previous activity can also serve as markers of successful repair.
This review highlights the need for further study regarding the treatment of TA ruptures. Larger, randomized studies with validated scoring systems for preoperative and postoperative function would offer more insight onto the best treatment options for these complex injuries.
1. Cohen DA, Gordon DH. The long-term effects of an untreated tibialis anterior tendon rupture. J Am Podiatr Med Assoc. 1999;89(3):149-152.
2. Jerome JTJ, Varghese M, Sankaran B, Thomas S, Thirumagal SK. Tibialis anterior tendon rupture in gout—case report and literature review. Foot Ankle Surg. 2008;14(3):166-169.
3. Aderinto J, Gross A. Delayed repair of tibialis anterior tendon rupture with Achilles tendon allograft. J Foot Ankle Surg. 2011;50(3):340-342.
4. Constantinou M, Wilson A. Traumatic tear of tibialis anterior during a Gaelic football game: a case report. Br J Sports Med. 2004;38(6):e30.
5. DiDomenico LA, Williams K, Petrolla AF. Spontaneous rupture of the anterior tibial tendon in a diabetic patient: results of operative treatment. J Foot Ankle Surg. 2008;47(5):463-467.
6. Dooley BJ, Kudelka P, Menelaus MB. Subcutaneous rupture of the tendon of tibialis anterior. J Bone Joint Surg Br. 1980;62(4):471-472.
7. Ellington JK, McCormick J, Marion C, et al. Surgical outcome following tibialis anterior tendon repair. Foot Ankle Int. 2010;31(5):412-417.
8. ElMaraghy A, Devereaux MW. Bone tunnel fixation for repair of tibialis anterior tendon rupture. Foot Ankle Surg. 2010;16(2):e47-e50.
9. Goehring M, Liakos P. Long-term outcomes following anterior tibialis tendon reconstruction with hamstring autograft in a series of 3 cases. J Foot Ankle Surg. 2009;48(2):196-202.
10. Gwynne-Jones D, Garneti N, Wyatt M. Closed tibialis anterior tendon rupture: a case series. Foot Ankle Int. 2009;30(8):758-762.
11. Kashyap S, Prince R. Spontaneous rupture of the tibialis anterior tendon. A case report. Clin Orthop. 1987;(216):159-161.
12. Kausch T, Rütt J. Subcutaneous rupture of the tibialis anterior tendon: review of the literature and a case report. Arch Orthop Trauma Surg. 1998;117(4-5):290-293.
13. Markarian GG, Kelikian AS, Brage M, Trainor T, Dias L. Anterior tibialis tendon ruptures: an outcome analysis of operative versus nonoperative treatment. Foot Ankle Int. 1998;19(12):792-802.
14. Meyn MA Jr. Closed rupture of the anterior tibial tendon. A case report and review of the literature. Clin Orthop. 1975;(113):154-157.
15. Miller RR, Mahan KT. Closed rupture of the anterior tibial tendon. A case report. J Am Podiatr Med Assoc. 1998;88(8):394-399.
16. Neumayer F, Djembi YR, Gerin A, Masquelet AC. Closed rupture of the tibialis anterior tendon: a report of 2 cases. J Foot Ankle Surg. 2009;48(4):457-461.
17. Otte S, Klinger HM, Lorenz F, Haerer T. Operative treatment in case of a closed rupture of the anterior tibial tendon. Arch Orthop Trauma Surg. 2002;122(3):188-190.
18. Ouzounian TJ, Anderson R. Anterior tibial tendon rupture. Foot Ankle Int. 1995;16(7):406-410.
19. Rajagopalan S, Sangar A, Upadhyay V, Lloyd J, Taylor H. Bilateral atraumatic sequential rupture of tibialis anterior tendons. Foot Ankle Spec. 2010;3(6):352-355.
20. Rimoldi RL, Oberlander MA, Waldrop JI, Hunter SC. Acute rupture of the tibialis anterior tendon: a case report. Foot Ankle. 1991;12(3):176-177.
21. Sammarco VJ, Sammarco GJ, Henning C, Chaim S. Surgical repair of acute and chronic tibialis anterior tendon ruptures. J Bone Joint Surg Am. 2009;91(2):325-332.
22. Sapkas GS, Tzoutzopoulos A, Tsoukas FC, Triantafillopoulos IK. Spontaneous tibialis anterior tendon rupture: delayed repair with free-sliding tibialis anterior tendon graft. Am J Orthop. 2008;37(12):E213-E216.
23. Stuart MJ. Traumatic disruption of the anterior tibial tendon while cross-country skiing. A case report. Clin Orthop. 1992;(281):193-194.
24. Trout BM, Hosey G, Wertheimer SJ. Rupture of the tibialis anterior tendon. J Foot Ankle Surg. 2000;39(1):54-58.
25. Van Acker G, Pingen F, Luitse J, Goslings C. Rupture of the tibialis anterior tendon. Acta Orthop Belg. 2006;72(1):105-107.
26. Kitaoka HB, Alexander IJ, Adelaar RS, Nunley JA, Myerson MS, Sanders M. Clinical rating systems for the ankle-hindfoot, midfoot, hallux, and lesser toes. Foot Ankle Int. 1994;15(7):349-353.
27. Roos EM, Brandsson S, Karlsson J. Validation of the foot and ankle outcome score for ankle ligament reconstruction. Foot Ankle Int. 2001;22(10):788-794.
28. Tinetti ME, Williams TF, Mayewski R. Fall risk index for elderly patients based on number of chronic disabilities. Am J Med. 1986;80(3):429-434.
Subcutaneous rupture of the tibialis anterior (TA) tendon has been reported predominantly in case reports and small case series because of the relative rarity of the injury. Unlike traumatic lacerations or open injuries to the tendon, subcutaneous injuries often go unnoticed by patients because of compensation by surrounding dorsiflexors of the foot and toes—namely, the extensor hallucis longus (EHL) and the extensor digitorum longus (EDL).1 This can delay presentation to an orthopedic surgeon and lead to difficulties in treatment, such as allograft or autograft being required if primary repair is no longer possible. Case reports and series have described treatment methods as well as anecdotal evidence of outcomes after operative repair or conservative treatment, but there have been no comprehensive systematic reviews of outcomes after various types of treatment. Authors have come to conclusions about expected outcomes based on patient age, time to treatment, treatment used, and other variables, but no reviews have examined these variables across multiple studies. Given the low level of the evidence presented in most of these reports, it is difficult to perform a meta-analysis of the data.
Instead, we systematically reviewed 87 cases from all pertinent studies and examined commonly reported data, such as patient age, time to treatment, treatment used, and outcome. Using the PICO (population, intervention, comparison, outcome) model for systematic reviews, we looked at patients who had closed, spontaneous, complete rupture of the TA tendon and underwent operative repair or conservative treatment of the injury. Outcomes surveyed included successful operative repair or conservative treatment, as measured by objective systems, such as MMSS (Manual Muscle Strength Scale) score, AOFAS (American Orthopaedic Foot and Ankle Society) hindfoot score, and FAOS (Foot and Ankle Outcome Score) testing, or by subjective description of posttreatment outcome.
We intend this review to serve as a guide for surgeons who find themselves treating a ruptured TA tendon, a relatively rare injury. They will be able to select the operative technique or conservative treatment that best matches the patient’s needs, based on comparison with previous case studies.
Materials and Methods
The cases reviewed for this study were found through a comprehensive PubMed search and an independent review of references cited in similar articles. Articles included were published between 1975 and 2012, inclusive. The latest search was performed on March 22, 2013. The search criteria were tibialis anterior [Title/Abstract] OR anterior tibial [Title/Abstract] AND rupture [Title/Abstract]) AND surgery. Only English-language articles, or articles already translated into English, were included. Eligible studies described cases of closed tendon rupture. No traumatic lacerations or open ruptures were included. If a study described both open and subcutaneous ruptures, only the subcutaneous cases were included. Further, partial ruptures were not included. In addition, ruptures caused directly by a known comorbid condition—for example, a rupture caused by a gouty tophaceous deposit at the site of rupture2—were not included. Data were extracted from publications independently and analyzed in a Microsoft Excel workbook (Microsoft, Redmond, Washington). Variables examined included patient age and sex, side involved, time to treatment, mechanism of injury, defect size, predisposing comorbidities, surgery or conservative treatment, type of operative repair (if applicable), graft used (if applicable), pretreatment function (by independent scoring system, if applicable), and posttreatment function. These variables were not necessarily reported in all the studies.
A potential bias exists in our PubMed search. As the query was specific for studies that included operative repair of a ruptured TA tendon, case studies that involved only conservative treatment were excluded. However, the primary goal of this review was to compare operative possibilities and the patient characteristics and outcomes associated with these surgeries.
Results
Figure 1 shows the criteria used to select eligible papers for review. Twenty-three papers matched the criteria.3-25 Data were independently extracted from these papers, as described in the Methods section. Again, not all variables were reported by all authors. Sammarco and colleagues21 reported time to treatment as a mean for 2 groups: 8 cases defined as “early” treatment (mean time to treatment, 0.625 months) and 11 defined as “late” treatment (mean time to treatment, 10.7 months). These mean times were therefore used independently for each case in calculating mean time to treatment for this systematic review.
Table 1 lists the demographics. There were 40 male and 25 female patients, and 22 cases in which sex was not specified. Mean age was 63.9 years (surgery group), 72.4 years (conservative treatment group), and 65.8 years (overall). Of the 87 patients, 72 underwent surgery, and 15 were treated with conservative measures.
Table 2 lists the operative techniques identified. Of the 72 surgeries, 23 were primary repairs, 12 were primary repairs of the anatomical insertion, and 18 involved use of autograft.
Time to treatment was available for 54 of the 87 cases (Table 3). Primary repair was most often performed in cases in which the injury was less than 3 months old, and autograft was most often used in cases in which the injury occurred more than 3 months before presentation.
Posttreatment outcome scores were available for 59 cases. Only 3 authors reported preoperative scores.5,21,24 None of the authors who used conservative treatment measures reported pretreatment scores. Scores used included the MMSS score (26 cases), the AOFAS hindfoot score (16 cases),26 the FAOS (17 cases),27 and the Tinetti gait and balance score (3 cases; the author also used the MMSS score).28Table 4 lists the mean posttreatment scores for patients who underwent surgery and patients treated conservatively. AOFAS, MMSS, and Tinetti scores and FAOS were used by authors presenting operative treatment outcomes. Only posttreatment FAOS was available for both surgery (84.4/100) and conservative treatment (69.4/100).
Discussion
Closed rupture of the TA tendon is a relatively rare entity occurring mostly in older patients without any history of acute, traumatic injury. Some patients, however, recall a particular moment of rupture, often accompanied immediately by pain and swelling, which eventually resolve. Later sequelae include footdrop with associated steppage gait and a palpable mass on the dorsal aspect of the ankle.3,21 Chronic TA tendon rupture can also lead to clawing of the toes as the other foot extensors (EHL, EDL) overcompensate. Cohen and Gordon1 described the case of a patient who ruptured a TA tendon 25 years earlier and then, in the absence of operative repair, developed hypertrophy of the EHL and the EDL. This extensor substitution led to hammer toes and plantar prominence of the metatarsal heads, ultimately leading to moderate pain and a neuroma. Although this particular outcome is likely rare, the more common sequelae of footdrop, flatfoot, Achilles tendon contracture, and compromised gait are reason enough to consider operative repair for any ruptured TA tendon.
Most previous studies of TA tendon rupture were case reports and case studies. In the largest series, Sammarco and colleagues21 described 19 cases of closed rupture. These included 3 traumatic cases, 1 by blunt trauma to the tendon and 2 of open laceration, all treated surgically with various methods. Unfortunately, these 3 traumatic cases were not separated in the authors’ analysis and therefore had to be included in this systematic review. Including them here did not compromise our goals in this review, which included examining typical patient demographics and the most common methods of operative repair.
Conservative measures remain a treatment possibility for some patients. We found that patients treated with conservative measures historically have been older (mean age, 72.4 years) than patients treated surgically (mean age, 63.9 years). However, advanced age itself is not a contraindication for operative repair of a TA tendon rupture, and authors have described positive outcomes for active, elderly (>70 years) patients who wanted to maintain their activity level and therefore opted for operative repair.7,8,10,13,16,24 Ouzounian and Anderson18 described functional limitations (eg, persistent footdrop, slapfoot gait, limitations in walking) after conservative treatment with an ankle-foot orthosis. Operative repair offers the chance for better functional outcome for patients who are surgical candidates and lead even a mildly active lifestyle.
Of operative repair methods, primary repair is used most often. This technique, however, must be allowed by the gap between the 2 ruptured ends after débridement of any necrotic tissue. If the distal stump is not viable, primary repair of the proximal stump to the native anatomical insertion is feasible. Figure 2, reprinted from a case report by Rajagopalan and colleagues,19 shows a ligament–osseous reattachment of the proximal stump using suture anchors to the medial cuneiform. Both primary repair and repair to the anatomical insertion can be augmented with Achilles tendon lengthening if needed to achieve balance between flexor and extensor functions of the ankle.
If the gap between the 2 stumps cannot be covered by the native tendon, then autograft, another surgical technique with positive outcomes, can be used. The most popular autograft sites historically have been the EDL, Achilles, and plantaris tendons. In addition, Goehring and Liakos9 described 3 cases of good results with semitendinosus autograft. Sapkas and colleagues22 used a free-sliding TA graft harvested from the healthy tissue of the proximal tendon stump. Their technique is depicted in Figure 3. Sliding tendon lengthening, well described by Trout and colleagues24 in a case study, is feasible for use of the native tendon when there is a gap to bridge between the 2 stumps of ruptured tendon. EHL or EDL transfer with or without Achilles lengthening is another option, albeit historically less often used.6,7 This technique is depicted in Figure 4, reprinted from a case series by Ellington and colleagues,7 who used EHL transfer with and without Achilles tendon lengthening in 9 cases.
Last, less popular techniques have included repair to sites other than the medial cuneiform, including the neck of the talus and the navicular bone.10,13 An Achilles tendon allograft was used in a case described by Aderinto and Gross3 to repair a ruptured tendon found incidentally on preoperative examination for a scheduled knee arthroplasty. The patient had a postoperative MMSS score of 4/5.
Overall, primary repair is clearly preferred, but successful outcomes can be achieved by other means. As Table 3 shows, primary repair is more often used for ruptures less than 3 months old, and autograft for older ruptures. Although which operative technique to use can be decided after necrotic tissue is débrided, surgeons should try to ascertain age of injury ahead of time so that, going into surgery, they will have a better idea of the feasibility of primary repair.
Posttreatment ankle scores were not widely available. As Table 4 indicates, only FAOS was used for the conservative treatment cases. However, raw mean FAOS and raw mean AOFAS hindfoot, MMSS, and Tinetti scores showed that good outcomes and high scores can be achieved with surgery. Further, the mean FAOS reported by Gwynne-Jones and colleagues10 and Markarian and colleagues13 showed a clinically significant difference between surgery and conservative treatment. DiDomenico and colleagues,5 Sammarco and colleagues,21 and Trout and colleagues24 were the only authors who reported pretreatment and posttreatment scores.
We intend this systematic review of the literature on closed TA rupture to serve as a guide for surgeons who find themselves treating this relatively rare injury, which often presents with only a chief complaint of the foot catching while walking. Overall, the literature shows that operative repair provides very good outcomes for many patients. Patients who are surgical candidates and amenable to surgery can be counseled that operative repair leads to fewer sequelae, such as persistent footdrop and flatfooted gait, with a strong likelihood of return to baseline activity status. Patients who are not surgical candidates or are strongly against surgery can be offered conservative treatment with an ankle-foot orthosis or physical therapy, but they should also be counseled that persistent gait abnormalities and weakness in dorsiflexion are likely outcomes. Surgeons must also consider age of injury (time from probable rupture to presentation), estimating a particular moment of rupture if unknown by the patient. They can then gauge the feasibility of primary repair and, during surgery, decide which technique (primary repair, tendon transfer, autograft, or other technique) will produce the best results. They can also use scores such as the FAOS and the AOFAS hindfoot, MMSS, and Tinetti scores to compare preoperative and postoperative function, though subjective reports of return to previous activity can also serve as markers of successful repair.
This review highlights the need for further study regarding the treatment of TA ruptures. Larger, randomized studies with validated scoring systems for preoperative and postoperative function would offer more insight onto the best treatment options for these complex injuries.
1. Cohen DA, Gordon DH. The long-term effects of an untreated tibialis anterior tendon rupture. J Am Podiatr Med Assoc. 1999;89(3):149-152.
2. Jerome JTJ, Varghese M, Sankaran B, Thomas S, Thirumagal SK. Tibialis anterior tendon rupture in gout—case report and literature review. Foot Ankle Surg. 2008;14(3):166-169.
3. Aderinto J, Gross A. Delayed repair of tibialis anterior tendon rupture with Achilles tendon allograft. J Foot Ankle Surg. 2011;50(3):340-342.
4. Constantinou M, Wilson A. Traumatic tear of tibialis anterior during a Gaelic football game: a case report. Br J Sports Med. 2004;38(6):e30.
5. DiDomenico LA, Williams K, Petrolla AF. Spontaneous rupture of the anterior tibial tendon in a diabetic patient: results of operative treatment. J Foot Ankle Surg. 2008;47(5):463-467.
6. Dooley BJ, Kudelka P, Menelaus MB. Subcutaneous rupture of the tendon of tibialis anterior. J Bone Joint Surg Br. 1980;62(4):471-472.
7. Ellington JK, McCormick J, Marion C, et al. Surgical outcome following tibialis anterior tendon repair. Foot Ankle Int. 2010;31(5):412-417.
8. ElMaraghy A, Devereaux MW. Bone tunnel fixation for repair of tibialis anterior tendon rupture. Foot Ankle Surg. 2010;16(2):e47-e50.
9. Goehring M, Liakos P. Long-term outcomes following anterior tibialis tendon reconstruction with hamstring autograft in a series of 3 cases. J Foot Ankle Surg. 2009;48(2):196-202.
10. Gwynne-Jones D, Garneti N, Wyatt M. Closed tibialis anterior tendon rupture: a case series. Foot Ankle Int. 2009;30(8):758-762.
11. Kashyap S, Prince R. Spontaneous rupture of the tibialis anterior tendon. A case report. Clin Orthop. 1987;(216):159-161.
12. Kausch T, Rütt J. Subcutaneous rupture of the tibialis anterior tendon: review of the literature and a case report. Arch Orthop Trauma Surg. 1998;117(4-5):290-293.
13. Markarian GG, Kelikian AS, Brage M, Trainor T, Dias L. Anterior tibialis tendon ruptures: an outcome analysis of operative versus nonoperative treatment. Foot Ankle Int. 1998;19(12):792-802.
14. Meyn MA Jr. Closed rupture of the anterior tibial tendon. A case report and review of the literature. Clin Orthop. 1975;(113):154-157.
15. Miller RR, Mahan KT. Closed rupture of the anterior tibial tendon. A case report. J Am Podiatr Med Assoc. 1998;88(8):394-399.
16. Neumayer F, Djembi YR, Gerin A, Masquelet AC. Closed rupture of the tibialis anterior tendon: a report of 2 cases. J Foot Ankle Surg. 2009;48(4):457-461.
17. Otte S, Klinger HM, Lorenz F, Haerer T. Operative treatment in case of a closed rupture of the anterior tibial tendon. Arch Orthop Trauma Surg. 2002;122(3):188-190.
18. Ouzounian TJ, Anderson R. Anterior tibial tendon rupture. Foot Ankle Int. 1995;16(7):406-410.
19. Rajagopalan S, Sangar A, Upadhyay V, Lloyd J, Taylor H. Bilateral atraumatic sequential rupture of tibialis anterior tendons. Foot Ankle Spec. 2010;3(6):352-355.
20. Rimoldi RL, Oberlander MA, Waldrop JI, Hunter SC. Acute rupture of the tibialis anterior tendon: a case report. Foot Ankle. 1991;12(3):176-177.
21. Sammarco VJ, Sammarco GJ, Henning C, Chaim S. Surgical repair of acute and chronic tibialis anterior tendon ruptures. J Bone Joint Surg Am. 2009;91(2):325-332.
22. Sapkas GS, Tzoutzopoulos A, Tsoukas FC, Triantafillopoulos IK. Spontaneous tibialis anterior tendon rupture: delayed repair with free-sliding tibialis anterior tendon graft. Am J Orthop. 2008;37(12):E213-E216.
23. Stuart MJ. Traumatic disruption of the anterior tibial tendon while cross-country skiing. A case report. Clin Orthop. 1992;(281):193-194.
24. Trout BM, Hosey G, Wertheimer SJ. Rupture of the tibialis anterior tendon. J Foot Ankle Surg. 2000;39(1):54-58.
25. Van Acker G, Pingen F, Luitse J, Goslings C. Rupture of the tibialis anterior tendon. Acta Orthop Belg. 2006;72(1):105-107.
26. Kitaoka HB, Alexander IJ, Adelaar RS, Nunley JA, Myerson MS, Sanders M. Clinical rating systems for the ankle-hindfoot, midfoot, hallux, and lesser toes. Foot Ankle Int. 1994;15(7):349-353.
27. Roos EM, Brandsson S, Karlsson J. Validation of the foot and ankle outcome score for ankle ligament reconstruction. Foot Ankle Int. 2001;22(10):788-794.
28. Tinetti ME, Williams TF, Mayewski R. Fall risk index for elderly patients based on number of chronic disabilities. Am J Med. 1986;80(3):429-434.
Atrial fibrillation patients on dronedarone at greater risk for all-cause hospitalizations
Among nongeriatric atrial fibrillation patients without structural heart disease, those on dronedarone had a greater risk of atrial fibrillation, cardiovascular, and all-cause hospitalizations, compared with patients on amiodarone, sotalol, and class Ic drugs, a study published in Circulation showed. Amiodarone had the lowest risk of atrial fibrillation and cardiovascular hospitalizations, but not overall hospitalizations.

Nancy M. Allen LaPointe, Pharm. D., of the Duke University Medical Center, Durham, N.C., and her associates identified 8,562 atrial fibrillation patients on antiarrhythmic drugs (with a median age of 56 years) from the MarketScan database between 2006 and 2010, and found that the risk of hospitalization for atrial fibrillation was greater with dronedarone than class Ic drugs (hazard ratio, 1.59; 95% confidence interval, 1.13-2.24), amiodarone (HR, 2.63; 1.77-3.89), and sotalol (HR, 1.72; CI, 1.17-2.54), but was lower with amiodarone versus class Ic (HR, 0.68; CI, 0.57-0.80) drugs and sotalol (HR, 0.63; CI, 0.53-0.75).
“There are many potential reasons for these differences in hospitalization rates, including differences in side effects and efficacy of each drug in this patient population. … Additional studies are needed to confirm our findings and focus on potential explanations for differences in hospitalization rates for different AADs [antiarrhythmic drugs],” the investigators wrote.
Read the full article here: Circ. Cardiovasc. Qual. Outcomes 2015 (doi:10.1161/circoutcomes.114.001499).
Among nongeriatric atrial fibrillation patients without structural heart disease, those on dronedarone had a greater risk of atrial fibrillation, cardiovascular, and all-cause hospitalizations, compared with patients on amiodarone, sotalol, and class Ic drugs, a study published in Circulation showed. Amiodarone had the lowest risk of atrial fibrillation and cardiovascular hospitalizations, but not overall hospitalizations.
Nancy M. Allen LaPointe, Pharm. D., of the Duke University Medical Center, Durham, N.C., and her associates identified 8,562 atrial fibrillation patients on antiarrhythmic drugs (with a median age of 56 years) from the MarketScan database between 2006 and 2010, and found that the risk of hospitalization for atrial fibrillation was greater with dronedarone than class Ic drugs (hazard ratio, 1.59; 95% confidence interval, 1.13-2.24), amiodarone (HR, 2.63; 1.77-3.89), and sotalol (HR, 1.72; CI, 1.17-2.54), but was lower with amiodarone versus class Ic (HR, 0.68; CI, 0.57-0.80) drugs and sotalol (HR, 0.63; CI, 0.53-0.75).
“There are many potential reasons for these differences in hospitalization rates, including differences in side effects and efficacy of each drug in this patient population. … Additional studies are needed to confirm our findings and focus on potential explanations for differences in hospitalization rates for different AADs [antiarrhythmic drugs],” the investigators wrote.
Read the full article here: Circ. Cardiovasc. Qual. Outcomes 2015 (doi:10.1161/circoutcomes.114.001499).

AHA/ACC updates hypertension guidelines for CAD patients
The first update to U.S. guidelines for managing hypertension in adult patients with coronary artery disease in 8 years reset the target blood pressure for most of these patients to less than 140/90 mm Hg, and highlighted beta-blockers, renin-angiotensin-aldosterone system blockers, and thiazide diuretics as the mainstays of drug treatment for these patients.
The main messages in the new scientific statement from the American Heart Association, American College of Cardiology, and American Society of Hypertension, released on March 31 in an article published online (Hypertension 2015 [doi:10.116/HYP.0000000000000018]) are the blood pressure targets set for patients with coronary artery disease (CAD) and the designations of the preferred drugs to use to achieve the blood pressure goals when lifestyle measures alone prove inadequate, said Dr. Clive Rosendorff, chair of the panel that wrote the new statement.
But the statement also highlighted that a blood pressure target of less than 130/80 mm Hg “could be considered” and was reasonable for selected CAD patients whom physicians judge capable of achieving this lower blood pressure level safely and who are at especially high risk for cerebrovascular events.
“We felt the best evidence [to prevent future cardiovascular events] was to reduce pressure below 140/90 mm Hg, but a goal pressure of less than 130/80 mm Hg may be appropriate in some cases; we left it to the discretion of physicians to decide which blood pressure target to choose,” said Dr. Rosendorff, professor of medicine at Mount Sinai Hospital in New York.
The default blood pressure goal of less than 140/90 for most CAD patients represented an increase from the less than 130/80 mm Hg goal set by the prior edition of this guideline, issued in 2007 (Circulation 2007;115:2761-88). Current evidence for the lower blood pressure target of less than 130/80 mm Hg “was not as strong,” Dr. Rosendorff said in an interview. He suggested that physicians consider using the lower target for patients who are younger, reasonably healthy, able to tolerate a regimen that brings them to a lower blood pressure without an increase in angina or other significant effects caused by the drugs themselves, do not experience compromised renal function with reduced blood pressure, and have an increased risk for cerebrovascular events.
“These guidelines are not rigid, and should involve a discussion with the patient of the benefits and risks,” he said.
The new statement targets a blood pressure goal of less than 150/90 mm Hg for CAD patients who are more than 80 years old.
The new target for CAD patients represents something of a response to the blood pressure target of less than 150/90 mm Hg for people at least 60 years old recommended last year in recommendations made by the panel originally assembled as the Eighth Joint National Committee (JNC 8) (JAMA 2014;311:507-20). Although the JNC 8 recommendations aimed at the general population in a primary prevention setting, as opposed to CAD patients for whom secondary prevention is the goal, the target of less than 150/90 mm Hg became “highly controversial” and was a factor in composing the new recommendation, Dr. Rosendorff said. He also stressed that the AHA, ACC, and ASH have assembled a group that is formulating new recommendations for diagnosing and managing hypertension for the general population in a primary prevention setting that will come out sometime in the future.
The new hypertension guideline for CAD patients and the 2014 statement from the JNC 8 panel should be seen as distinct recommendations because they targeted different patient populations and because they were based on different ground rules for evidence, said Dr. Suzanne Oparil, one of three people who served on both writing groups. The JNC 8 group focused exclusively on findings from randomized, controlled trials that used hard cardiovascular disease endpoints. The writing committee for the new guidelines targeted specifically at CAD patients also considered evidence from epidemiologic studies. In addition, the new guidelines is targeted at primarily a cardiologist audience, while the 2014 JNC 8 guidelines were written primarily for primary care physicians, she said in an interview.
“I do not believe that the new CAD guidelines will change practice. They reflect what most cardiologists already do,” said Dr. Oparil, professor of medicine and director of the vascular biology and hypertension program at the University of Alabama, Birmingham.
Regarding antihypertensive drug selection the new statement endorses a focus on treating hypertensive patients with established CAD with a beta-blocker, a renin-angiotensin-aldosterone system blocker such as an ACE inhibitor or angiotensin-receptor blocker, and a thiazide or thiazide-like diuretic. Hypertensive patients with CAD should immediately start on all three drug classes, Dr. Rosendorff said.
“For patients with established CAD, a treatment with a beta-blocker moves from the limbo they are in for treating uncomplicated hypertension to center stage,” he said. The statement gives more detailed guidance on which specific drugs from the beta-blocker class have the best evidence for efficacy in various types of patients with CAD.
Dr. Rosendorff had no disclosures. Dr. Oparil has been a consultant to Bayer, Daiichi Sankyo, and Pfizer, and has received research grants from Medtronic, Merck, Novartis, and Takeda.
On Twitter @mitchelzoler
The new statement on treating hypertension in patients with established coronary artery disease clears up what had been a confusing situation for U.S. physicians during the past year.
In early 2014, the panel that had originally been assembled as the Eighth Joint National Committee (JNC 8) issued a statement that called for a blood pressure target of less than 150/90 mm Hg for people 60 years or older (JAMA 2014;311:507-20). People were very confused about that, and may have erroneously believed that this recommendation applied to patients with CAD. I and many of my colleagues believe that having a recommendation to treat to just less than 150/90 mm Hg potentially put millions of CAD patients at risk, especially at risk for stroke. The new statement highlights the high risk faced by CAD patients who need special attention to their blood pressure.

|
| Mitchel L. Zoler/Fronbtline Medical News Dr. Elliott M. Antman |
The epidemiologic evidence clearly shows that increased blood pressure relates to an increased risk for cardiovascular events across a blood pressure range from 115/75 mm Hg to 185/115 mm Hg.
The new recommendations for CAD patients also say that a target blood pressure of less than 130/80 mm Hg may be preferred for selected patients, although the statement does not offer clear steps on how to identify these patients. Physicians must use their clinical judgment.
In my practice, I make sure not to drop a patient’s creatinine clearance to an unacceptably low level, and I would especially consider the lower target for patients with a history of heart failure or left ventricular dilatation or hypertrophy. I believe that in the past, physicians have been too conservative about blood pressure reduction in CAD patients, in part out of a concern about reducing perfusion pressure too much. I believe that if a CAD patient can tolerate a lower blood pressure and the treatment it takes to achieve it, then it is better to be more aggressive.
We also must always remember that the lifestyle modifications, including less dietary sodium, weight loss, and exercise, are the first steps to reducing blood pressure.
Dr. Elliott M. Antman is professor of medicine at Harvard University in Boston and president of the American Heart Association. He had no relevant disclosures. He made these comments in an interview.
The new statement on treating hypertension in patients with established coronary artery disease clears up what had been a confusing situation for U.S. physicians during the past year.
In early 2014, the panel that had originally been assembled as the Eighth Joint National Committee (JNC 8) issued a statement that called for a blood pressure target of less than 150/90 mm Hg for people 60 years or older (JAMA 2014;311:507-20). People were very confused about that, and may have erroneously believed that this recommendation applied to patients with CAD. I and many of my colleagues believe that having a recommendation to treat to just less than 150/90 mm Hg potentially put millions of CAD patients at risk, especially at risk for stroke. The new statement highlights the high risk faced by CAD patients who need special attention to their blood pressure.
|
|
| Mitchel L. Zoler/Fronbtline Medical News Dr. Elliott M. Antman |
The epidemiologic evidence clearly shows that increased blood pressure relates to an increased risk for cardiovascular events across a blood pressure range from 115/75 mm Hg to 185/115 mm Hg.
The new recommendations for CAD patients also say that a target blood pressure of less than 130/80 mm Hg may be preferred for selected patients, although the statement does not offer clear steps on how to identify these patients. Physicians must use their clinical judgment.
In my practice, I make sure not to drop a patient’s creatinine clearance to an unacceptably low level, and I would especially consider the lower target for patients with a history of heart failure or left ventricular dilatation or hypertrophy. I believe that in the past, physicians have been too conservative about blood pressure reduction in CAD patients, in part out of a concern about reducing perfusion pressure too much. I believe that if a CAD patient can tolerate a lower blood pressure and the treatment it takes to achieve it, then it is better to be more aggressive.
We also must always remember that the lifestyle modifications, including less dietary sodium, weight loss, and exercise, are the first steps to reducing blood pressure.
Dr. Elliott M. Antman is professor of medicine at Harvard University in Boston and president of the American Heart Association. He had no relevant disclosures. He made these comments in an interview.
The first update to U.S. guidelines for managing hypertension in adult patients with coronary artery disease in 8 years reset the target blood pressure for most of these patients to less than 140/90 mm Hg, and highlighted beta-blockers, renin-angiotensin-aldosterone system blockers, and thiazide diuretics as the mainstays of drug treatment for these patients.
The main messages in the new scientific statement from the American Heart Association, American College of Cardiology, and American Society of Hypertension, released on March 31 in an article published online (Hypertension 2015 [doi:10.116/HYP.0000000000000018]) are the blood pressure targets set for patients with coronary artery disease (CAD) and the designations of the preferred drugs to use to achieve the blood pressure goals when lifestyle measures alone prove inadequate, said Dr. Clive Rosendorff, chair of the panel that wrote the new statement.
But the statement also highlighted that a blood pressure target of less than 130/80 mm Hg “could be considered” and was reasonable for selected CAD patients whom physicians judge capable of achieving this lower blood pressure level safely and who are at especially high risk for cerebrovascular events.
“We felt the best evidence [to prevent future cardiovascular events] was to reduce pressure below 140/90 mm Hg, but a goal pressure of less than 130/80 mm Hg may be appropriate in some cases; we left it to the discretion of physicians to decide which blood pressure target to choose,” said Dr. Rosendorff, professor of medicine at Mount Sinai Hospital in New York.
The default blood pressure goal of less than 140/90 for most CAD patients represented an increase from the less than 130/80 mm Hg goal set by the prior edition of this guideline, issued in 2007 (Circulation 2007;115:2761-88). Current evidence for the lower blood pressure target of less than 130/80 mm Hg “was not as strong,” Dr. Rosendorff said in an interview. He suggested that physicians consider using the lower target for patients who are younger, reasonably healthy, able to tolerate a regimen that brings them to a lower blood pressure without an increase in angina or other significant effects caused by the drugs themselves, do not experience compromised renal function with reduced blood pressure, and have an increased risk for cerebrovascular events.
“These guidelines are not rigid, and should involve a discussion with the patient of the benefits and risks,” he said.
The new statement targets a blood pressure goal of less than 150/90 mm Hg for CAD patients who are more than 80 years old.
The new target for CAD patients represents something of a response to the blood pressure target of less than 150/90 mm Hg for people at least 60 years old recommended last year in recommendations made by the panel originally assembled as the Eighth Joint National Committee (JNC 8) (JAMA 2014;311:507-20). Although the JNC 8 recommendations aimed at the general population in a primary prevention setting, as opposed to CAD patients for whom secondary prevention is the goal, the target of less than 150/90 mm Hg became “highly controversial” and was a factor in composing the new recommendation, Dr. Rosendorff said. He also stressed that the AHA, ACC, and ASH have assembled a group that is formulating new recommendations for diagnosing and managing hypertension for the general population in a primary prevention setting that will come out sometime in the future.
The new hypertension guideline for CAD patients and the 2014 statement from the JNC 8 panel should be seen as distinct recommendations because they targeted different patient populations and because they were based on different ground rules for evidence, said Dr. Suzanne Oparil, one of three people who served on both writing groups. The JNC 8 group focused exclusively on findings from randomized, controlled trials that used hard cardiovascular disease endpoints. The writing committee for the new guidelines targeted specifically at CAD patients also considered evidence from epidemiologic studies. In addition, the new guidelines is targeted at primarily a cardiologist audience, while the 2014 JNC 8 guidelines were written primarily for primary care physicians, she said in an interview.
“I do not believe that the new CAD guidelines will change practice. They reflect what most cardiologists already do,” said Dr. Oparil, professor of medicine and director of the vascular biology and hypertension program at the University of Alabama, Birmingham.
Regarding antihypertensive drug selection the new statement endorses a focus on treating hypertensive patients with established CAD with a beta-blocker, a renin-angiotensin-aldosterone system blocker such as an ACE inhibitor or angiotensin-receptor blocker, and a thiazide or thiazide-like diuretic. Hypertensive patients with CAD should immediately start on all three drug classes, Dr. Rosendorff said.
“For patients with established CAD, a treatment with a beta-blocker moves from the limbo they are in for treating uncomplicated hypertension to center stage,” he said. The statement gives more detailed guidance on which specific drugs from the beta-blocker class have the best evidence for efficacy in various types of patients with CAD.
Dr. Rosendorff had no disclosures. Dr. Oparil has been a consultant to Bayer, Daiichi Sankyo, and Pfizer, and has received research grants from Medtronic, Merck, Novartis, and Takeda.
On Twitter @mitchelzoler
FROM HYPERTENSION
Revision Anterior Cruciate Ligament Reconstruction With Bone–Patellar Tendon–Bone Allograft and Extra-Articular Iliotibial Band Tenodesis
Primary anterior cruciate ligament (ACL) reconstruction has satisfactory outcomes in 75% to 97% of patients.1-3 Despite this high success rate, the number of revision ACL reconstructions has risen4 and is likely underreported.5 Recurrent instability occurs if the reconstructed ligament fails to provide adequate anterior and rotational knee stability. Causes of graft failure include repeat trauma, early return to high-demand activity, poor operative technique (including poor graft placement), failure to address concomitant pathology, and perioperative complications (eg, infection, stiffness).4 In addition, most patients who have revision ACL reconstruction received autograft tissue in the initial surgery, and allograft is thus not uncommon in revision ACL surgery. Allograft tissue has longer incorporation times6 and increased incidence of recurrent postoperative instability when compared with autograft tissue.7 Extra-articular tenodesis may thus be used to provide additional stability to the revision allograft tissue while it incorporates.
In this article, we describe our use of an extra-articular iliotibial band (ITB) tenodesis as an augmentative procedure in patients undergoing revision ACL reconstruction with bone–patellar tendon–bone (BPTB) allograft.
Surgical Technique
After induction of anesthesia and careful positioning, the patient is prepared and draped in the usual sterile fashion. Standard anteromedial, anterolateral, and superolateral outflow portals are established, and diagnostic arthroscopy is performed to inspect the cruciate ligaments, menisci, and articular cartilage (Figure 1). Peripheral meniscal tears should be repaired (Figure 2), and central or inner tears should be débrided to a stable rim. If meniscal repair is performed, sutures should be tied at the end of the case. Unstable articular cartilage defects should also be débrided. An 8- to 12-cm lateral hockey-stick incision is then made from the Gerdy tubercle to the inferior edge of the lateral femoral epicondyle in preparation for the ITB tenodesis (Figure 1). The lateral collateral ligament (LCL), the lateral head of the gastrocnemius, and the ITB are identified. The peroneal nerve should be significantly distal to the working field.

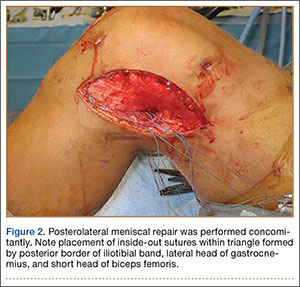
Remnants of the previous ACL graft are débrided, and, if necessary, a modified notchplasty is performed. A position for the new femoral tunnel is located and is confirmed with intraoperative fluoroscopy. This tunnel is established with compaction drill bits and dilated to the appropriate diameter through the anteromedial portal with the knee in 120° of flexion.
BPTB allograft is prepared first by cutting its central third to the desired diameter (Figure 3). The bone-plug ends are prepared with compaction pliers. Two 2.0-mm drill holes are made in each of the allograft bone plugs, and a No. 5 Ti-Cron suture (Covidien, New Haven, Connecticut) is placed through each of the holes. We typically use 2 sutures on each bone plug.
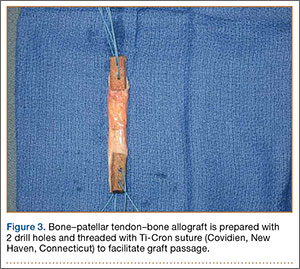
A tibial tunnel is then established with an ACL drill guide under arthroscopic visualization and intraoperative fluoroscopy for confirmation of correct pin placement. We use Kirschner wires (with parallel pin guides as needed), compaction drills, and dilators to create a well-positioned tunnel of the appropriate diameter. The allograft is then passed through the tibia and femur in retrograde fashion. We secure the femoral side with an AO (Arbeitsgemeinschaft für Osteosynthesefragen) 4.5-mm bicortical screw and washer. Our tibial fixation is secured after the ITB tenodesis. The knee is then cycled a dozen times.
In preparation for the ITB tenodesis, we lengthen our previously made incision by about 4 cm proximally along the posterior aspect of the ITB. The central portion of the ITB is then outlined at the Gerdy tubercle and split with a No. 10 blade. This generally leaves an approximately 12- to 14-mm strip of ITB centrally (Figure 4). This portion should be gently lifted from the underlying tissue attachments distally at the insertion on the Gerdy tubercle. The interval between the LCL and lateral capsule of the knee is identified, and a No. 2 Ti-Cron whip-stitch is thrown through the free end of the ITB graft (Figure 5). The anterior aspect of the femoral tunnel is at the distal aspect of the lateral femoral condyle, and the posterior aspect is at the juncture of the proximal LCL and the lateral head of the gastrocnemius. The cortices of these landmarks should be perforated with a drill, and a curved instrument should be used to create a bone tunnel at this location (Figure 6). The tibial tunnel is just posterior and distal to the Gerdy tubercle and should be created in similar fashion. The graft is then passed underneath the LCL (Figure 7), through the proximal tunnel that has been created on the lateral femoral condyle, and then back down through the LCL and back onto itself after exiting the tibial tunnel (Figure 8). With the knee at 30° of flexion, the ITB graft is tensioned and sutured down to intact ITB fascia just proximal to the tibial tunnel orifice (Figure 9). We check knee range of motion (ROM) and then perform a Lachman test to assess changes in knee stability. The pivot shift examination is omitted to avoid placing excessive stress on the tenodesis. The tibial side of the patellar tendon allograft is then tensioned and secured over an AO 4.5-mm bicortical screw with washer with the knee in full extension. The screw is then tightened at 30° of knee flexion.
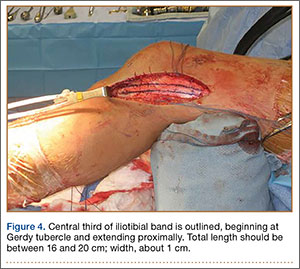
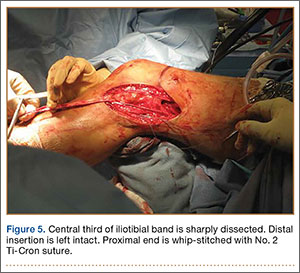
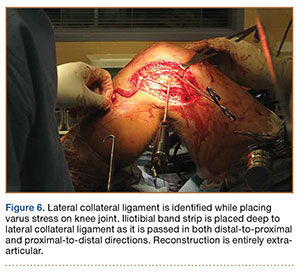
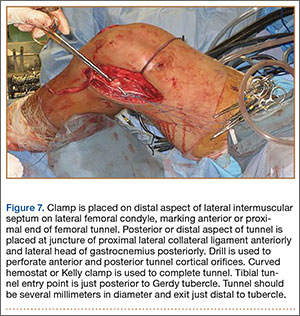
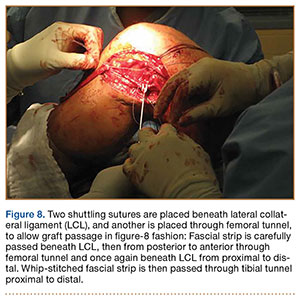
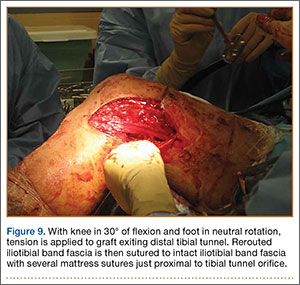
The ITB fascia is closed to the lateral femoral epicondyle with a running heavy suture, and all incisions are then irrigated and closed (Figures 10, 11). Standard sterile surgical dressing, Cryo/Cuff (Aircast, Vista, California), and brace are applied with the knee locked at 20°. Patients are generally discharged home the same day and followed up in clinic 1 week after surgery.
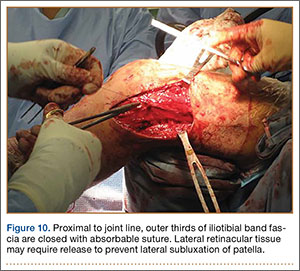
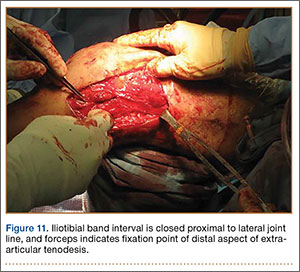
Complications
The peroneal nerve must be identified and protected during the open lateral procedure. In addition, the need for the extra lateral incision poses a slightly higher risk for infection compared with the traditional arthroscopic revision ACL procedure. Last, the additional tunnels required for the tenodesis can increase the theoretical potential for distal femur fracture and ACL graft fixation failure on the femoral side.
Postoperative Management
The operative knee is kept in extension in a brace locked at 20° for week 1 after surgery. Isometric quadriceps exercises are started immediately after surgery. Flexion to 90° is allowed starting week 2 after surgery, when the patient begins supervised active/passive flexion and progressive ROM exercises. In most cases, full ROM should be achieved by 6 to 8 weeks after surgery. Patients are progressed in their weight-bearing status by about 25% of their body weight per week, and use of crutches should be discontinued by week 4 after surgery. The brace should be discontinued by week 6 after surgery, when use of stationary bicycle and closed chain exercises begin. The patient may begin jogging when the operative leg regains 80% of contralateral quadriceps strength via Cybex strength testing. Functional drills begin in month 6, but patients should be counseled against returning to sport any earlier than 9 months after surgery.
Discussion
Achieving a successful outcome in revision ACL surgery (vs primary ACL surgery) is a significant challenge. Any of numerous factors can make the revision surgery more challenging, including existing poorly placed tunnels, tunnel expansion, lack of ideal graft choice, loss of secondary stabilizers, and deviations of the weight-bearing axis. Therefore, outcomes of revision surgery tend to be more moderate than outcomes of primary procedures.4,8-12
Revision ACL reconstruction techniques are varied and can involve use of autograft or allograft tissue as well as extra-articular augmentation techniques. Diamantopoulos and colleagues8 reported the outcomes of revision ACL reconstruction using bone–tendon–bone, hamstring, or quadriceps autografts in 107 patients. The majority of patients had improved outcome measures (mean Lysholm score improved from 51.5 to 88.5) and side-to-side laxity measurements. However, only 36.4% returned to preinjury activity level. Similarly, Noyes and Barber-Westin9 reported the outcomes of revision ACL reconstruction using quadriceps tendon–patellar bone autograft in 21 patients. Although there was significant improvement in terms of symptoms and activity level, 4 of the 21 knees were graded abnormal or severely abnormal on the IKDC (International Knee Documentation Committee) ligament rating. In a systematic review, pooled results of revision ACL reconstructions reiterated the above results.10 Eight hundred sixty-three patients from 21 studies were included in the analysis, which found significantly worse subjective outcomes than for primary procedures and a dramatically higher failure rate for the re-reconstructed ACL.
Several authors have directly compared primary cohorts with revision cohorts. Ahn and colleagues11 compared the outcomes of 59 revision ACL reconstructions with those of 117 primary reconstructions at a single institution. Although statistical comparison of stability between primary and revision ACL reconstructions showed no difference, revision reconstructions fared more poorly in terms of quality of life and return to activity compared with primary reconstructions. In a large cohort study of the Danish registry, revisions were found to have worse subjective outcomes than primary reconstructions as well.12 The study also found that the rerupture risk was significantly higher (relative risk, 2.05) when allograft was used.
Given the inferior results of revision surgery, our technique is recommended to augment the stability of reconstructed knees in the setting of revision ACL reconstruction. Adding the extra-articular procedure may augment the revised graft and protect it from excessive stress.13 A cadaver study compared double-bundle ACL reconstruction with single-bundle hamstring reconstruction plus extra-articular lateral tenodesis and found improved internal rotation control at 30° of flexion in the latter.14 Using contralateral 4-strand hamstring autograft in combination with an extra-articular lateral augment can have encouraging outcomes. Ferretti and colleagues15 reported an average Lysholm score of 95 in 12 patients who underwent this revision procedure and good anterior-to-posterior stability in 11 of the 12 patients. Trojani and colleagues16 reported on a cohort of 163 patients who underwent ACL revision surgery over a 10-year period. The authors found that 80% of patients with a lateral extra-articular tenodesis performed to augment their revision reconstruction had a negative pivot shift at long-term follow-up—versus only 63% of patients who underwent isolated revision ACL reconstruction. This finding was statistically significant, but the authors did not find any differences in IKDC scores between groups. These results support the initial biomechanical findings of Engebretsen and colleagues,17 who found that adding a lateral tenodesis decreased the forces on the reconstructed graft by 15%.
Conclusion
This technique allows for protection of the intra-articular allograft ligament reconstruction with improved rotational control that may potentially allow for improved subjective outcomes and protect against graft failure. Given the common pitfalls with stability in revision ACL surgery with allograft, this lateral extra-articular procedure can be an important structural augmentation in this challenging clinical issue in knee surgery.
1. Bach BR Jr. Revision anterior cruciate ligament surgery. Arthroscopy. 2003;19(suppl 1):14-29.
2. Baer GS, Harner CD. Clinical outcomes of allograft versus autograft in anterior cruciate ligament reconstruction. Clin Sports Med. 2007;26(4):661-681.
3. Spindler KP, Kuhn JE, Freedman KB, Matthews CE, Dittus RS, Harrell FE Jr. Anterior cruciate ligament reconstruction autograft choice: bone–tendon–bone versus hamstring: does it really matter? A systematic review. Am J Sports Med. 2004;32(8):1986-1995.
4. Kamath GV, Redfern JC, Greis PE, Burks RT. Revision anterior cruciate ligament reconstruction. Am J Sports Med. 2011;39(1):199-217.
5. Gianotti SM, Marshall SW, Hume PA, Bunt L. Incidence of anterior cruciate ligament injury and other knee ligament injuries: a national population-based study. J Sci Med Sport. 2009;12(6):622-627.
6. Jackson DW, Grood ES, Goldstein JD, et al. A comparison of patellar tendon autograft and allograft used for anterior cruciate ligament reconstruction in the goat model. Am J Sports Med. 1993;21(2):176-185.
7. Mascarenhas R, Tranovich M, Karpie JC, Irrgang JJ, Fu FH, Harner CD. Patellar tendon anterior cruciate ligament reconstruction in the high-demand patient: evaluation of autograft versus allograft reconstruction. Arthroscopy. 2010;26(9 Suppl):S58-S66.
8. Diamantopoulos AP, Lorbach O, Paessler HH. Anterior cruciate ligament revision reconstruction: results in 107 patients. Am J Sports Med. 2008;36(5):851-860.
9. Noyes FR, Barber-Westin SD. Anterior cruciate ligament revision reconstruction: results using a quadriceps tendon–patellar bone autograft. Am J Sports Med. 2006;34(4):553-564.
10. Wright RW, Gill CS, Chen L, et al. Outcome of revision anterior cruciate ligament reconstruction: a systematic review. J Bone Joint Surg Am. 2012;94(6):531-536.
11. Ahn JH, Lee YS, Ha HC. Comparison of revision surgery with primary anterior cruciate ligament reconstruction and outcome of revision surgery between different graft materials. Am J Sports Med. 2008;36(10):1889-1895.
12. Lind M, Menhert F, Pedersen AB. Incidence and outcome after revision anterior cruciate ligament reconstruction: results from the Danish registry for knee ligament reconstructions. Am J Sports Med. 2012;40(7):1551-1557.
13. Ferretti A, Conteduca F, Monaco E, De Carli A, D’Arrigo C. Revision anterior cruciate ligament reconstruction with doubled semitendinosus and gracilis tendons and lateral extra-articular reconstruction. J Bone Joint Surg Am. 2006;88(11):2373-2379.
14. Monaco E, Labianca L, Conteduca F, De Carli A, Ferretti A. Double bundle or single bundle plus extraarticular tenodesis in ACL reconstruction? A CAOS study. Knee Surg Sports Traumatol Arthrosc. 2007;15(10):1168-1174.
15. Ferretti A, Monaco E, Caperna L, Palma T, Conteduca F. Revision ACL reconstruction using contralateral hamstrings. Knee Surg Sports Traumatol Arthrosc. 2013;21(3):690-695.
16. Trojani C, Beaufils P, Burdin G, et al. Revision ACL reconstruction: influence of a lateral tenodesis. Knee Surg Sports Traumatol Arthrosc. 2012;20(8):1565-1570.
17. Engebretsen L, Lew WD, Lewis JL, Hunter RE. The effect of an iliotibial tenodesis on intraarticular graft forces and knee joint motion. Am J Sports Med. 1990;18(2):169-176.
Primary anterior cruciate ligament (ACL) reconstruction has satisfactory outcomes in 75% to 97% of patients.1-3 Despite this high success rate, the number of revision ACL reconstructions has risen4 and is likely underreported.5 Recurrent instability occurs if the reconstructed ligament fails to provide adequate anterior and rotational knee stability. Causes of graft failure include repeat trauma, early return to high-demand activity, poor operative technique (including poor graft placement), failure to address concomitant pathology, and perioperative complications (eg, infection, stiffness).4 In addition, most patients who have revision ACL reconstruction received autograft tissue in the initial surgery, and allograft is thus not uncommon in revision ACL surgery. Allograft tissue has longer incorporation times6 and increased incidence of recurrent postoperative instability when compared with autograft tissue.7 Extra-articular tenodesis may thus be used to provide additional stability to the revision allograft tissue while it incorporates.
In this article, we describe our use of an extra-articular iliotibial band (ITB) tenodesis as an augmentative procedure in patients undergoing revision ACL reconstruction with bone–patellar tendon–bone (BPTB) allograft.
Surgical Technique
After induction of anesthesia and careful positioning, the patient is prepared and draped in the usual sterile fashion. Standard anteromedial, anterolateral, and superolateral outflow portals are established, and diagnostic arthroscopy is performed to inspect the cruciate ligaments, menisci, and articular cartilage (Figure 1). Peripheral meniscal tears should be repaired (Figure 2), and central or inner tears should be débrided to a stable rim. If meniscal repair is performed, sutures should be tied at the end of the case. Unstable articular cartilage defects should also be débrided. An 8- to 12-cm lateral hockey-stick incision is then made from the Gerdy tubercle to the inferior edge of the lateral femoral epicondyle in preparation for the ITB tenodesis (Figure 1). The lateral collateral ligament (LCL), the lateral head of the gastrocnemius, and the ITB are identified. The peroneal nerve should be significantly distal to the working field.
Remnants of the previous ACL graft are débrided, and, if necessary, a modified notchplasty is performed. A position for the new femoral tunnel is located and is confirmed with intraoperative fluoroscopy. This tunnel is established with compaction drill bits and dilated to the appropriate diameter through the anteromedial portal with the knee in 120° of flexion.
BPTB allograft is prepared first by cutting its central third to the desired diameter (Figure 3). The bone-plug ends are prepared with compaction pliers. Two 2.0-mm drill holes are made in each of the allograft bone plugs, and a No. 5 Ti-Cron suture (Covidien, New Haven, Connecticut) is placed through each of the holes. We typically use 2 sutures on each bone plug.
A tibial tunnel is then established with an ACL drill guide under arthroscopic visualization and intraoperative fluoroscopy for confirmation of correct pin placement. We use Kirschner wires (with parallel pin guides as needed), compaction drills, and dilators to create a well-positioned tunnel of the appropriate diameter. The allograft is then passed through the tibia and femur in retrograde fashion. We secure the femoral side with an AO (Arbeitsgemeinschaft für Osteosynthesefragen) 4.5-mm bicortical screw and washer. Our tibial fixation is secured after the ITB tenodesis. The knee is then cycled a dozen times.
In preparation for the ITB tenodesis, we lengthen our previously made incision by about 4 cm proximally along the posterior aspect of the ITB. The central portion of the ITB is then outlined at the Gerdy tubercle and split with a No. 10 blade. This generally leaves an approximately 12- to 14-mm strip of ITB centrally (Figure 4). This portion should be gently lifted from the underlying tissue attachments distally at the insertion on the Gerdy tubercle. The interval between the LCL and lateral capsule of the knee is identified, and a No. 2 Ti-Cron whip-stitch is thrown through the free end of the ITB graft (Figure 5). The anterior aspect of the femoral tunnel is at the distal aspect of the lateral femoral condyle, and the posterior aspect is at the juncture of the proximal LCL and the lateral head of the gastrocnemius. The cortices of these landmarks should be perforated with a drill, and a curved instrument should be used to create a bone tunnel at this location (Figure 6). The tibial tunnel is just posterior and distal to the Gerdy tubercle and should be created in similar fashion. The graft is then passed underneath the LCL (Figure 7), through the proximal tunnel that has been created on the lateral femoral condyle, and then back down through the LCL and back onto itself after exiting the tibial tunnel (Figure 8). With the knee at 30° of flexion, the ITB graft is tensioned and sutured down to intact ITB fascia just proximal to the tibial tunnel orifice (Figure 9). We check knee range of motion (ROM) and then perform a Lachman test to assess changes in knee stability. The pivot shift examination is omitted to avoid placing excessive stress on the tenodesis. The tibial side of the patellar tendon allograft is then tensioned and secured over an AO 4.5-mm bicortical screw with washer with the knee in full extension. The screw is then tightened at 30° of knee flexion.
The ITB fascia is closed to the lateral femoral epicondyle with a running heavy suture, and all incisions are then irrigated and closed (Figures 10, 11). Standard sterile surgical dressing, Cryo/Cuff (Aircast, Vista, California), and brace are applied with the knee locked at 20°. Patients are generally discharged home the same day and followed up in clinic 1 week after surgery.
Complications
The peroneal nerve must be identified and protected during the open lateral procedure. In addition, the need for the extra lateral incision poses a slightly higher risk for infection compared with the traditional arthroscopic revision ACL procedure. Last, the additional tunnels required for the tenodesis can increase the theoretical potential for distal femur fracture and ACL graft fixation failure on the femoral side.
Postoperative Management
The operative knee is kept in extension in a brace locked at 20° for week 1 after surgery. Isometric quadriceps exercises are started immediately after surgery. Flexion to 90° is allowed starting week 2 after surgery, when the patient begins supervised active/passive flexion and progressive ROM exercises. In most cases, full ROM should be achieved by 6 to 8 weeks after surgery. Patients are progressed in their weight-bearing status by about 25% of their body weight per week, and use of crutches should be discontinued by week 4 after surgery. The brace should be discontinued by week 6 after surgery, when use of stationary bicycle and closed chain exercises begin. The patient may begin jogging when the operative leg regains 80% of contralateral quadriceps strength via Cybex strength testing. Functional drills begin in month 6, but patients should be counseled against returning to sport any earlier than 9 months after surgery.
Discussion
Achieving a successful outcome in revision ACL surgery (vs primary ACL surgery) is a significant challenge. Any of numerous factors can make the revision surgery more challenging, including existing poorly placed tunnels, tunnel expansion, lack of ideal graft choice, loss of secondary stabilizers, and deviations of the weight-bearing axis. Therefore, outcomes of revision surgery tend to be more moderate than outcomes of primary procedures.4,8-12
Revision ACL reconstruction techniques are varied and can involve use of autograft or allograft tissue as well as extra-articular augmentation techniques. Diamantopoulos and colleagues8 reported the outcomes of revision ACL reconstruction using bone–tendon–bone, hamstring, or quadriceps autografts in 107 patients. The majority of patients had improved outcome measures (mean Lysholm score improved from 51.5 to 88.5) and side-to-side laxity measurements. However, only 36.4% returned to preinjury activity level. Similarly, Noyes and Barber-Westin9 reported the outcomes of revision ACL reconstruction using quadriceps tendon–patellar bone autograft in 21 patients. Although there was significant improvement in terms of symptoms and activity level, 4 of the 21 knees were graded abnormal or severely abnormal on the IKDC (International Knee Documentation Committee) ligament rating. In a systematic review, pooled results of revision ACL reconstructions reiterated the above results.10 Eight hundred sixty-three patients from 21 studies were included in the analysis, which found significantly worse subjective outcomes than for primary procedures and a dramatically higher failure rate for the re-reconstructed ACL.
Several authors have directly compared primary cohorts with revision cohorts. Ahn and colleagues11 compared the outcomes of 59 revision ACL reconstructions with those of 117 primary reconstructions at a single institution. Although statistical comparison of stability between primary and revision ACL reconstructions showed no difference, revision reconstructions fared more poorly in terms of quality of life and return to activity compared with primary reconstructions. In a large cohort study of the Danish registry, revisions were found to have worse subjective outcomes than primary reconstructions as well.12 The study also found that the rerupture risk was significantly higher (relative risk, 2.05) when allograft was used.
Given the inferior results of revision surgery, our technique is recommended to augment the stability of reconstructed knees in the setting of revision ACL reconstruction. Adding the extra-articular procedure may augment the revised graft and protect it from excessive stress.13 A cadaver study compared double-bundle ACL reconstruction with single-bundle hamstring reconstruction plus extra-articular lateral tenodesis and found improved internal rotation control at 30° of flexion in the latter.14 Using contralateral 4-strand hamstring autograft in combination with an extra-articular lateral augment can have encouraging outcomes. Ferretti and colleagues15 reported an average Lysholm score of 95 in 12 patients who underwent this revision procedure and good anterior-to-posterior stability in 11 of the 12 patients. Trojani and colleagues16 reported on a cohort of 163 patients who underwent ACL revision surgery over a 10-year period. The authors found that 80% of patients with a lateral extra-articular tenodesis performed to augment their revision reconstruction had a negative pivot shift at long-term follow-up—versus only 63% of patients who underwent isolated revision ACL reconstruction. This finding was statistically significant, but the authors did not find any differences in IKDC scores between groups. These results support the initial biomechanical findings of Engebretsen and colleagues,17 who found that adding a lateral tenodesis decreased the forces on the reconstructed graft by 15%.
Conclusion
This technique allows for protection of the intra-articular allograft ligament reconstruction with improved rotational control that may potentially allow for improved subjective outcomes and protect against graft failure. Given the common pitfalls with stability in revision ACL surgery with allograft, this lateral extra-articular procedure can be an important structural augmentation in this challenging clinical issue in knee surgery.
1. Bach BR Jr. Revision anterior cruciate ligament surgery. Arthroscopy. 2003;19(suppl 1):14-29.
2. Baer GS, Harner CD. Clinical outcomes of allograft versus autograft in anterior cruciate ligament reconstruction. Clin Sports Med. 2007;26(4):661-681.
3. Spindler KP, Kuhn JE, Freedman KB, Matthews CE, Dittus RS, Harrell FE Jr. Anterior cruciate ligament reconstruction autograft choice: bone–tendon–bone versus hamstring: does it really matter? A systematic review. Am J Sports Med. 2004;32(8):1986-1995.
4. Kamath GV, Redfern JC, Greis PE, Burks RT. Revision anterior cruciate ligament reconstruction. Am J Sports Med. 2011;39(1):199-217.
5. Gianotti SM, Marshall SW, Hume PA, Bunt L. Incidence of anterior cruciate ligament injury and other knee ligament injuries: a national population-based study. J Sci Med Sport. 2009;12(6):622-627.
6. Jackson DW, Grood ES, Goldstein JD, et al. A comparison of patellar tendon autograft and allograft used for anterior cruciate ligament reconstruction in the goat model. Am J Sports Med. 1993;21(2):176-185.
7. Mascarenhas R, Tranovich M, Karpie JC, Irrgang JJ, Fu FH, Harner CD. Patellar tendon anterior cruciate ligament reconstruction in the high-demand patient: evaluation of autograft versus allograft reconstruction. Arthroscopy. 2010;26(9 Suppl):S58-S66.
8. Diamantopoulos AP, Lorbach O, Paessler HH. Anterior cruciate ligament revision reconstruction: results in 107 patients. Am J Sports Med. 2008;36(5):851-860.
9. Noyes FR, Barber-Westin SD. Anterior cruciate ligament revision reconstruction: results using a quadriceps tendon–patellar bone autograft. Am J Sports Med. 2006;34(4):553-564.
10. Wright RW, Gill CS, Chen L, et al. Outcome of revision anterior cruciate ligament reconstruction: a systematic review. J Bone Joint Surg Am. 2012;94(6):531-536.
11. Ahn JH, Lee YS, Ha HC. Comparison of revision surgery with primary anterior cruciate ligament reconstruction and outcome of revision surgery between different graft materials. Am J Sports Med. 2008;36(10):1889-1895.
12. Lind M, Menhert F, Pedersen AB. Incidence and outcome after revision anterior cruciate ligament reconstruction: results from the Danish registry for knee ligament reconstructions. Am J Sports Med. 2012;40(7):1551-1557.
13. Ferretti A, Conteduca F, Monaco E, De Carli A, D’Arrigo C. Revision anterior cruciate ligament reconstruction with doubled semitendinosus and gracilis tendons and lateral extra-articular reconstruction. J Bone Joint Surg Am. 2006;88(11):2373-2379.
14. Monaco E, Labianca L, Conteduca F, De Carli A, Ferretti A. Double bundle or single bundle plus extraarticular tenodesis in ACL reconstruction? A CAOS study. Knee Surg Sports Traumatol Arthrosc. 2007;15(10):1168-1174.
15. Ferretti A, Monaco E, Caperna L, Palma T, Conteduca F. Revision ACL reconstruction using contralateral hamstrings. Knee Surg Sports Traumatol Arthrosc. 2013;21(3):690-695.
16. Trojani C, Beaufils P, Burdin G, et al. Revision ACL reconstruction: influence of a lateral tenodesis. Knee Surg Sports Traumatol Arthrosc. 2012;20(8):1565-1570.
17. Engebretsen L, Lew WD, Lewis JL, Hunter RE. The effect of an iliotibial tenodesis on intraarticular graft forces and knee joint motion. Am J Sports Med. 1990;18(2):169-176.
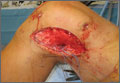
10 evidence-based recommendations to prevent surgical site infection after cesarean delivery
Infection is the second leading cause of pregnancy-related mortality in the United States, responsible for 13.6% of all maternal deaths.1 Cesarean delivery is the single most important risk factor for puerperal infection, increasing its incidence approximately 5- to 20-fold.2
Given that cesarean deliveries represent 32.7% of all births in the United States,3 the overall health and socioeconomic burden of these infections is substantial. In addition, more than half of all pregnancies are complicated by maternal obesity, which is associated with an increased risk of cesarean delivery as well as subsequent wound complications.4
In this review, we offer 10 evidence-based strategies to prevent surgical site infection (SSI) after cesarean delivery.
1 Maintain strict glycemic control in women with diabetes
Perioperative hyperglycemia is associated with an increased risk of postoperative infection in patients with diabetes
Ramos M, Khalpey Z, Lipsitz S, et al. Relationship of perioperative hyperglycemia and postoperative infections in patients who undergo general and vascular surgery. Ann Surg. 2008;248(4):585–591.
Hanazaki K, Maeda H, Okabayashi T. Relationship between perioperative glycemic control and postoperative infections. World J Gastroenterol. 2009;15(33):4122–4125.
Although data are limited on the impact of perioperative glycemic control on postcesarean infection rates, the association has been well documented in the general surgery literature. Results of a retrospective cohort study of 995 patients undergoing general or vascular surgery demonstrated that postoperative hyperglycemia increased the risk of infection by 30% for every 40-point increase in serum glucose levels from normoglycemia (defined as <110 mg/dL) (odds ratio, 1.3; 95% confidence interval [CI], 1.03–1.64).5 Hyperglycemia causes abnormalities of leukocyte function, including impaired granulocyte adherence, impaired phagocytosis, delayed chemotaxis, and depressed bactericidal capacity. And all of these abnormalities in leukocyte function appear to improve with strict glycemic control, although the target range for blood glucose remains uncertain.6
2 Recommend preoperative antiseptic showering
Ask patients to shower with 4% chlorhexidine gluconate the night before surgery to reduce the presence of bacterial skin flora
Mangram AJ, Horan TC, Pearson ML, et al; Hospital Infection Control Practices Advisory Committee. Guideline for prevention of surgical site infection, 1999. Infect Control Hosp Epidemiol. 1999;20(4):247–278.
Chlebicki MP, Safdar N, O’Horo JC, Maki DG. Preoperative chlorhexidine shower or bath for prevention of surgical site infection: a meta-analysis. Am J Infect Control. 2013;41(2):167–173.
According to the Centers for Disease Control and Prevention, preoperative showering with chlorhexidine reduces the presence of bacterial skin flora. A study of more than 700 patients showed that preoperative showers with chlorhexidine reduced bacterial colony counts 9-fold, compared with only 1.3-fold for povidone-iodine.7 Whether this translates into a reduction in SSI remains controversial, in large part because of poor quality of the existing prospective trials, which used different agents, concentrations, and methods of skin preparation.8
Small clinical trials have found a benefit to chlorhexidine treatment the day before surgery.9,10 However, a recent meta-analysis of 16 randomized trials failed to show a significant reduction in the rate of SSI with chlorhexidine compared with soap, placebo, or no washing (relative risk [RR], 0.90; 95% CI, 0.77–1.05).11
3 Administer intravenous antibiotic prophylaxis
All patients who undergo cesarean delivery should be given appropriate antibiotic prophylaxis within 60 minutes before the skin incision
American College of Obstetricians and Gynecologists. ACOG Practice Bulletin No. 120: Use of prophylactic antibiotics in labor and delivery. Obstet Gynecol. 2011;117(6):1472–1483.
Costantine MM, Rahman M, Ghulmiyah L, et al. Timing of perioperative antibiotics for cesarean delivery: a meta-analysis. Am J Obstet Gynecol. 2008;199(3):301.e1–e6.
The American College of Obstetricians and Gynecologists (ACOG) recommends the use of a single dose of a narrow-spectrum, first-generation cephalosporin (or a single dose of clindamycin with an aminoglycoside for those with a significant penicillin allergy) as SSI chemoprophylaxis for cesarean delivery.12 Due to concerns about fetal antibiotic exposure, such prophylaxis traditionally has been given after clamping of the umbilical cord. However, results of a recent meta-analysis of 5 randomized controlled trials demonstrated that antibiotic prophylaxis significantly reduced infectious morbidity (RR, 0.50; 95% CI, 0.33–0.78) when it was given 60 minutes before the skin incision, with no significant effect on neonatal outcome.13
4 Give a higher dose of preoperative antibiotics in obese women
Given the increased volume of distribution and the increased risk of postcesarean infection in the obese population, a higher dose of preoperative antibiotic prophylaxis is recommended
Robinson HE, O’Connell CM, Joseph KS, McLeod NL. Maternal outcomes in pregnancies complicated by obesity. Obstet Gynecol. 2005;106(6):1357–1364.
Pevzner L, Swank M, Krepel C, et al. Effects of maternal obesity on tissue concentrations of prophylactic cefazolin during cesarean delivery. Obstet Gynecol. 2011;117(4):877–882.
The impact of maternal obesity on the risk of SSI after cesarean delivery was illustrated in a 2005 retrospective cohort study of 10,134 obese women. Moderately obese women with a prepregnancy weight of 90 to 100 kg were 1.6 times (95% CI, 1.31–1.95) more likely to have a wound infection, and severely obese women (>120 kg) were 4.45 times (95% CI, 3.00–6.61) more likely to have a wound infection after cesarean delivery, compared with women of normal weight.14
Moreover, a study of tissue concentrations of prophylactic cefazolin in obese women demonstrated that concentrations within adipose tissue at the site of the skin incision were inversely proportional to maternal body mass index (BMI).15 Given these findings, consideration should be given to using a higher dose of preoperative antibiotic prophylaxis in obese women, specifically 3 g of intravenous (IV) cefazolin for women with a BMI greater than 30 kg/m2 or an absolute weight of more than 100 kg.12
5 Use clippers for preoperative hair removal
If hair removal is necessary to perform the skin incision for cesarean delivery, the use of clippers is preferred
Tanner J, Norrie P, Melen K. Preoperative hair removal to reduce surgical site infection. Cochrane Database Syst Rev. 2011;11:CD004122.
In a Cochrane review of 3 randomized clinical trials comparing preoperative hair-removal techniques, shaving was associated with an increased risk of SSI, compared with clipping (RR, 2.09; 95% CI, 1.15–3.80).15 Shaving is thought to result in microscopic skin abrasions that can serve as foci for bacterial growth.
Interestingly, in this same Cochrane review, a separate analysis of 6 studies failed to show a benefit of preoperative hair removal by any means, compared with no hair removal,15 suggesting that routine hair removal may not be indicated for all patients.
6 Use chlorhexidine-alcohol for skin prep
Prepare the skin with chlorhexidine-alcohol immediately before surgery
Darouiche RO, Wall MJ Jr, Itani KM, et al. Chlorhexidine-alcohol versus povidone-iodine for surgical-site antisepsis. N Engl J Med. 2010;362(1):18–26.
Kunkle CM, Marchan J, Safadi S, Whitman S, Chmait RH. Chlorhexidine gluconate versus povidone iodine at cesarean delivery: a randomized controlled trial. J Matern Fetal Neonatal Med. 2014;18:1–5.
Data from a randomized multicenter trial of 849 patients showed that the use of a chlorhexidine-alcohol skin preparation immediately before surgery lowered the rate of SSI after clean-contaminated surgery, compared with povidone-iodine (RR, 0.59; 95% CI, 0.41–0.85).16 Studies focusing on cesarean delivery alone are limited, although 1 small randomized trial found that chlorhexidine treatment significantly reduced bacterial growth at 18 hours after cesarean, compared with povidone-iodine (RR, 0.23; 95% CI, 0.07–0.70).17
7 Consider an alcohol-based hand rub for preoperative antisepsis
Alcohol-based hand rubs may be more effective than conventional surgical scrub
Shen NJ, Pan SC, Sheng WH, et al. Comparative antimicrobial efficacy of alcohol-based hand rub and conventional surgical scrub in a medical center [published online ahead of print September 21, 2013]. J Microbiol Immunol Infect. pii:S1684–1182(13)00150–3.
Tanner J, Swarbrook S, Stuart J. Surgical hand antisepsis to reduce surgical site infection. Cochrane Database Syst Rev. 2008;1:CD004288.
Several agents are available for preoperative surgical hand antisepsis, including newer alcohol-based rubs and conventional aqueous scrubs that contain either chlorhexidine gluconate or povidone-iodine. In a prospective cohort study of 128 health care providers, use of an alcohol-based rub for surgical hand antisepsis was associated with a lower rate of positive bacterial culture (6.2%), compared with a chlorhexidine-based conventional scrub (47.6%; P<.001).18 However, if an aqueous-based scrub is the only option available for surgical hand antisepsis, a Cochrane review found that chlorhexidine gluconate scrubs were more effective than povidone-iodine scrubs in 3 trials, resulting in fewer colony-forming units of bacteria on the hands of the surgical team.19
8 Close the skin with subcuticular sutures
Use of subcuticular sutures for skin closure is associated with a lower risk of wound complications, compared with staples
Mackeen AD, Schuster M, Berghella V. Suture versus staples for skin closure after cesarean: a meta-analysis [published online ahead of print December 19, 2014]. Am J Obstet Gynecol. doi:10.1016/j.ajog.2014.12.020.
A meta-analysis of 12 randomized controlled trials including 3,112 women demonstrated that subcuticular closure is associated with a decreased risk of wound complications, compared with staple closure (RR, 0.49; 95% CI, 0.28–0.87). The reduced risk remained significant even when stratified by obesity. Both closure techniques were shown to be equivalent with regard to postoperative pain, cosmetic outcome, and patient satisfaction.20
9 Close the subcutaneous tissue
Closure of the subcutaneous fat is associated with a decreased risk of wound disruption for women with a tissue thickness of more than 2 cm
Chelmow D, Rodriguez EJ, Sabatini MM. Suture closure of subcutaneous fat and wound disruption after cesarean delivery: a meta-analysis. Obstet Gynecol. 2004;103(5 pt 1):974–980.
Dahlke JD, Mendez-Figueroa H, Rouse DJ, Berghella V, Baxter JK, Chauhan SP. Evidence-based surgery for cesarean delivery: an updated systematic review. Am J Obstet Gynecol. 2013;209(4):294–306.
A meta-analysis of 5 randomized controlled trials demonstrated that suture closure of subcutaneous fat is associated with a 34% decrease in the risk of wound disruption in women with fat thickness greater than 2 cm (RR, 0.66; 95% CI, 0.48–0.91).21
A recent systematic review of evidence-based guidelines for surgical decisions during cesarean delivery also recommended this practice based on results of 9 published studies.22 In this review, however, subcutaneous drain placement did not offer any additional benefit, regardless of tissue thickness.22
10 Avoid unproven techniques
Several commonly performed techniques have not been associated with a decreased risk of SSI after cesarean delivery
Dahlke JD, Mendez-Figueroa H, Rouse DJ, Berghella V, Baxter JK, Chauhan SP. Evidence-based surgery for cesarean delivery: an updated systematic review. Am J Obstet Gynecol. 2013;209(4):294–306.
CORONIS Trial Collaborative Group. The CORONIS Trial. International study of caesarean section surgical techniques: a randomised fractional, factorial trial. BMC Pregnancy Childbirth. 2007;7:24. doi:10.1186/1471-2393-7-24.
Familiarity with the obstetric literature will help providers determine which interventions prevent SSI and which do not. Well-designed clinical studies have demonstrated no significant difference in the rate of postcesarean infectious morbidity with the administration of high concentrations of perioperative oxygen,22 saline wound irrigation,22 placement of subcutaneous drains,22 blunt versus sharp abdominal entry,23 and exteriorization of the uterus for repair.23
Share your thoughts! Send your Letter to the Editor to [email protected]. Please include your name and the city and state in which you practice.
1. Creanga AA, Berg CJ, Syverson C, Seed K, Bruce FC, Callaghan WM. Pregnancy-related mortality in the United States, 2006–2010. Obstet Gynecol. 2015;125(1):5–12.
2. Leth RA, Moller JK, Thomsen RW, Uldbjerg N, Norgaard M. Risk of selected postpartum infections after cesarean section compared with vaginal birth: a five-year cohort study of 32,468 women. Acta Obstet Gynecol Scand. 2009;88(9):976–983.
3. Martin JA, Hamilton BE, Osterman JK, et al. Births: final data for 2013. Natl Vital Stat Rep. 2015;64(1):1–65.
4. American College of Obstetricians and Gynecologists. ACOG Committee Opinion No. 549: Obesity in pregnancy. Obstet Gynecol. 2013;121(1):213–217.
5. Dahlke JD, Mendez-Figueroa H, Rouse DJ, Berghella V, Baxter JK, Chauhan SP. Evidence-based surgery for cesarean delivery: an updated systematic review. Am J Obstet Gynecol. 2013;209(4):294–306.
6. Ramos M, Khalpey Z, Lipsitz S, et al. Relationship of perioperative hyperglycemia and postoperative infections in patients who undergo general and vascular surgery. Ann Surg. 2008;248(4):585–591.
7. Mangram AJ, Horan TC, Pearson ML, Silver LC, Jarvis WR. Hospital Infection Control Practices Advisory Committee: Guideline for prevention of surgical site infection, 1999. Infect Control Hosp Epidemiol. 1999;20(4):250–278.
8. Webster J, Osborne S. Preoperative bathing or showering with skin antiseptics to prevent surgical site infection. Cochrane Database Syst Rev. 2012;9:CD004985.
9. Hayek LJ, Emerson JM, Gardner AM. A placebo-controlled trial of the effect of two preoperative baths or showers with chlorhexidine detergent on post-operative wound infection rates. J Hosp Infect. 1987;10(2):165–172.
10. Wihlborg O. The effect of washing with chlorhexidine soap on wound infection rate in general surgery: a controlled clinical study. Ann Chir Gynaecol. 1987;76(5):263–265.
11. Chlebicki MP, Safdar N, O’Horo JC, Maki DG. Preoperative chlorhexidine shower or bath for prevention of surgical site infection: a meta-analysis. Am J Infect Control. 2013;41(2):167–173.
12. American College of Obstetricians and Gynecologists. ACOG Practice Bulletin No. 120: Use of prophylactic antibiotics in labor and delivery. Obstet Gynecol. 2011;117(6):1472–1483.
13. Costantine MM, Rahman M, Ghulmiyah L, et al. Timing of perioperative antibiotics for cesarean delivery: a meta-analysis. Am J Obstet Gynecol. 2008;199(3):301.e1–e6.
14. Robinson HE, O’Connell CM, Joseph KS, McLeod NL. Maternal outcomes in pregnancies complicated by obesity. Obstet Gynecol. 2005;106(6):1357–1364.
15. Pevzner L, Swank M, Krepel C, et al. Effects of maternal obesity on tissue concentrations of prophylactic cefazolin during cesarean delivery. Obstet Gynecol. 2011;117(4):877–882.
16. Tanner J, Norrie P, Melen K. Preoperative hair removal to reduce surgical site infection. Cochrane Database Syst Rev. 2011;11:CD004122.
17. Darouiche RO, Wall MJ Jr, Itani KM, et al. Chlorhexidine-alcohol versus povidone-iodine for surgical-site antisepsis. N Engl J Med. 2010;362(1):18–26.
18. Kunkle CM, Marchan J, Safadi S, Whitman S, Chmait RH. Chlorhexidine gluconate versus povidone iodine at cesarean delivery: a randomized controlled trial. J Matern Fetal Neonatal Med. 2014;18:1–5.
19. Shen NJ, Pan SC, Sheng WH, et al. Comparative antimicrobial efficacy of alcohol-based hand rub and conventional surgical scrub in a medical center [published online ahead of print September 21, 2013]. J Microbiol Immunol Infect. pii:S1684–1182(13)00150–3.
20. Tanner J, Swarbrook S, Stuart J. Surgical hand antisepsis to reduce surgical site infection. Cochrane Database Syst Rev. 2008;1:CD004288.
21. Mackeen AD, Schuster M, Berghella V. Suture versus staples for skin closure after cesarean: a meta-analysis [published online ahead of print December 19, 2014]. Am J Obstet Gynecol. doi:10.1016/j.ajog.2014.12.020.
22. Chelmow D, Rodriguez EJ, Sabatini MM. Suture closure of subcutaneous fat and wound disruption after cesarean delivery: a meta-analysis. Obstet Gynecol. 2004;103(5 Pt 1):974–980.
23. Hanazaki K, Maeda H, Okabayashi T. Relationship between perioperative glycemic control and postoperative infections. World J Gastroenterol. 2009;15(33):4122–4125.
Kelley Conroy, MD, and Errol R. Norwitz, MD, PhD

Dr. Conroy is Clinical Fellow, Division of Maternal-Fetal Medicine, Department of Obstetrics and Gynecology, Tufts Medical Center, Boston, Massachusetts.

Dr. Norwitz is Louis E. Phaneuf Professor of Obstetrics and Gynecology, Tufts University School of Medicine, and Chairman, Department of Obstetrics and Gynecology, Tufts Medical Center, Boston, Massachusetts. Dr. Norwitz serves on the OBG Management Board of Editors.
The authors report no financial relationships relevant to this article.
Kelley Conroy, MD, and Errol R. Norwitz, MD, PhD
Dr. Conroy is Clinical Fellow, Division of Maternal-Fetal Medicine, Department of Obstetrics and Gynecology, Tufts Medical Center, Boston, Massachusetts.
Dr. Norwitz is Louis E. Phaneuf Professor of Obstetrics and Gynecology, Tufts University School of Medicine, and Chairman, Department of Obstetrics and Gynecology, Tufts Medical Center, Boston, Massachusetts. Dr. Norwitz serves on the OBG Management Board of Editors.
The authors report no financial relationships relevant to this article.
Infection is the second leading cause of pregnancy-related mortality in the United States, responsible for 13.6% of all maternal deaths.1 Cesarean delivery is the single most important risk factor for puerperal infection, increasing its incidence approximately 5- to 20-fold.2
Given that cesarean deliveries represent 32.7% of all births in the United States,3 the overall health and socioeconomic burden of these infections is substantial. In addition, more than half of all pregnancies are complicated by maternal obesity, which is associated with an increased risk of cesarean delivery as well as subsequent wound complications.4
In this review, we offer 10 evidence-based strategies to prevent surgical site infection (SSI) after cesarean delivery.
1 Maintain strict glycemic control in women with diabetes
Perioperative hyperglycemia is associated with an increased risk of postoperative infection in patients with diabetes
Ramos M, Khalpey Z, Lipsitz S, et al. Relationship of perioperative hyperglycemia and postoperative infections in patients who undergo general and vascular surgery. Ann Surg. 2008;248(4):585–591.
Hanazaki K, Maeda H, Okabayashi T. Relationship between perioperative glycemic control and postoperative infections. World J Gastroenterol. 2009;15(33):4122–4125.
Although data are limited on the impact of perioperative glycemic control on postcesarean infection rates, the association has been well documented in the general surgery literature. Results of a retrospective cohort study of 995 patients undergoing general or vascular surgery demonstrated that postoperative hyperglycemia increased the risk of infection by 30% for every 40-point increase in serum glucose levels from normoglycemia (defined as <110 mg/dL) (odds ratio, 1.3; 95% confidence interval [CI], 1.03–1.64).5 Hyperglycemia causes abnormalities of leukocyte function, including impaired granulocyte adherence, impaired phagocytosis, delayed chemotaxis, and depressed bactericidal capacity. And all of these abnormalities in leukocyte function appear to improve with strict glycemic control, although the target range for blood glucose remains uncertain.6
2 Recommend preoperative antiseptic showering
Ask patients to shower with 4% chlorhexidine gluconate the night before surgery to reduce the presence of bacterial skin flora
Mangram AJ, Horan TC, Pearson ML, et al; Hospital Infection Control Practices Advisory Committee. Guideline for prevention of surgical site infection, 1999. Infect Control Hosp Epidemiol. 1999;20(4):247–278.
Chlebicki MP, Safdar N, O’Horo JC, Maki DG. Preoperative chlorhexidine shower or bath for prevention of surgical site infection: a meta-analysis. Am J Infect Control. 2013;41(2):167–173.
According to the Centers for Disease Control and Prevention, preoperative showering with chlorhexidine reduces the presence of bacterial skin flora. A study of more than 700 patients showed that preoperative showers with chlorhexidine reduced bacterial colony counts 9-fold, compared with only 1.3-fold for povidone-iodine.7 Whether this translates into a reduction in SSI remains controversial, in large part because of poor quality of the existing prospective trials, which used different agents, concentrations, and methods of skin preparation.8
Small clinical trials have found a benefit to chlorhexidine treatment the day before surgery.9,10 However, a recent meta-analysis of 16 randomized trials failed to show a significant reduction in the rate of SSI with chlorhexidine compared with soap, placebo, or no washing (relative risk [RR], 0.90; 95% CI, 0.77–1.05).11
3 Administer intravenous antibiotic prophylaxis
All patients who undergo cesarean delivery should be given appropriate antibiotic prophylaxis within 60 minutes before the skin incision
American College of Obstetricians and Gynecologists. ACOG Practice Bulletin No. 120: Use of prophylactic antibiotics in labor and delivery. Obstet Gynecol. 2011;117(6):1472–1483.
Costantine MM, Rahman M, Ghulmiyah L, et al. Timing of perioperative antibiotics for cesarean delivery: a meta-analysis. Am J Obstet Gynecol. 2008;199(3):301.e1–e6.
The American College of Obstetricians and Gynecologists (ACOG) recommends the use of a single dose of a narrow-spectrum, first-generation cephalosporin (or a single dose of clindamycin with an aminoglycoside for those with a significant penicillin allergy) as SSI chemoprophylaxis for cesarean delivery.12 Due to concerns about fetal antibiotic exposure, such prophylaxis traditionally has been given after clamping of the umbilical cord. However, results of a recent meta-analysis of 5 randomized controlled trials demonstrated that antibiotic prophylaxis significantly reduced infectious morbidity (RR, 0.50; 95% CI, 0.33–0.78) when it was given 60 minutes before the skin incision, with no significant effect on neonatal outcome.13
4 Give a higher dose of preoperative antibiotics in obese women
Given the increased volume of distribution and the increased risk of postcesarean infection in the obese population, a higher dose of preoperative antibiotic prophylaxis is recommended
Robinson HE, O’Connell CM, Joseph KS, McLeod NL. Maternal outcomes in pregnancies complicated by obesity. Obstet Gynecol. 2005;106(6):1357–1364.
Pevzner L, Swank M, Krepel C, et al. Effects of maternal obesity on tissue concentrations of prophylactic cefazolin during cesarean delivery. Obstet Gynecol. 2011;117(4):877–882.
The impact of maternal obesity on the risk of SSI after cesarean delivery was illustrated in a 2005 retrospective cohort study of 10,134 obese women. Moderately obese women with a prepregnancy weight of 90 to 100 kg were 1.6 times (95% CI, 1.31–1.95) more likely to have a wound infection, and severely obese women (>120 kg) were 4.45 times (95% CI, 3.00–6.61) more likely to have a wound infection after cesarean delivery, compared with women of normal weight.14
Moreover, a study of tissue concentrations of prophylactic cefazolin in obese women demonstrated that concentrations within adipose tissue at the site of the skin incision were inversely proportional to maternal body mass index (BMI).15 Given these findings, consideration should be given to using a higher dose of preoperative antibiotic prophylaxis in obese women, specifically 3 g of intravenous (IV) cefazolin for women with a BMI greater than 30 kg/m2 or an absolute weight of more than 100 kg.12
5 Use clippers for preoperative hair removal
If hair removal is necessary to perform the skin incision for cesarean delivery, the use of clippers is preferred
Tanner J, Norrie P, Melen K. Preoperative hair removal to reduce surgical site infection. Cochrane Database Syst Rev. 2011;11:CD004122.
In a Cochrane review of 3 randomized clinical trials comparing preoperative hair-removal techniques, shaving was associated with an increased risk of SSI, compared with clipping (RR, 2.09; 95% CI, 1.15–3.80).15 Shaving is thought to result in microscopic skin abrasions that can serve as foci for bacterial growth.
Interestingly, in this same Cochrane review, a separate analysis of 6 studies failed to show a benefit of preoperative hair removal by any means, compared with no hair removal,15 suggesting that routine hair removal may not be indicated for all patients.
6 Use chlorhexidine-alcohol for skin prep
Prepare the skin with chlorhexidine-alcohol immediately before surgery
Darouiche RO, Wall MJ Jr, Itani KM, et al. Chlorhexidine-alcohol versus povidone-iodine for surgical-site antisepsis. N Engl J Med. 2010;362(1):18–26.
Kunkle CM, Marchan J, Safadi S, Whitman S, Chmait RH. Chlorhexidine gluconate versus povidone iodine at cesarean delivery: a randomized controlled trial. J Matern Fetal Neonatal Med. 2014;18:1–5.
Data from a randomized multicenter trial of 849 patients showed that the use of a chlorhexidine-alcohol skin preparation immediately before surgery lowered the rate of SSI after clean-contaminated surgery, compared with povidone-iodine (RR, 0.59; 95% CI, 0.41–0.85).16 Studies focusing on cesarean delivery alone are limited, although 1 small randomized trial found that chlorhexidine treatment significantly reduced bacterial growth at 18 hours after cesarean, compared with povidone-iodine (RR, 0.23; 95% CI, 0.07–0.70).17
7 Consider an alcohol-based hand rub for preoperative antisepsis
Alcohol-based hand rubs may be more effective than conventional surgical scrub
Shen NJ, Pan SC, Sheng WH, et al. Comparative antimicrobial efficacy of alcohol-based hand rub and conventional surgical scrub in a medical center [published online ahead of print September 21, 2013]. J Microbiol Immunol Infect. pii:S1684–1182(13)00150–3.
Tanner J, Swarbrook S, Stuart J. Surgical hand antisepsis to reduce surgical site infection. Cochrane Database Syst Rev. 2008;1:CD004288.
Several agents are available for preoperative surgical hand antisepsis, including newer alcohol-based rubs and conventional aqueous scrubs that contain either chlorhexidine gluconate or povidone-iodine. In a prospective cohort study of 128 health care providers, use of an alcohol-based rub for surgical hand antisepsis was associated with a lower rate of positive bacterial culture (6.2%), compared with a chlorhexidine-based conventional scrub (47.6%; P<.001).18 However, if an aqueous-based scrub is the only option available for surgical hand antisepsis, a Cochrane review found that chlorhexidine gluconate scrubs were more effective than povidone-iodine scrubs in 3 trials, resulting in fewer colony-forming units of bacteria on the hands of the surgical team.19
8 Close the skin with subcuticular sutures
Use of subcuticular sutures for skin closure is associated with a lower risk of wound complications, compared with staples
Mackeen AD, Schuster M, Berghella V. Suture versus staples for skin closure after cesarean: a meta-analysis [published online ahead of print December 19, 2014]. Am J Obstet Gynecol. doi:10.1016/j.ajog.2014.12.020.
A meta-analysis of 12 randomized controlled trials including 3,112 women demonstrated that subcuticular closure is associated with a decreased risk of wound complications, compared with staple closure (RR, 0.49; 95% CI, 0.28–0.87). The reduced risk remained significant even when stratified by obesity. Both closure techniques were shown to be equivalent with regard to postoperative pain, cosmetic outcome, and patient satisfaction.20
9 Close the subcutaneous tissue
Closure of the subcutaneous fat is associated with a decreased risk of wound disruption for women with a tissue thickness of more than 2 cm
Chelmow D, Rodriguez EJ, Sabatini MM. Suture closure of subcutaneous fat and wound disruption after cesarean delivery: a meta-analysis. Obstet Gynecol. 2004;103(5 pt 1):974–980.
Dahlke JD, Mendez-Figueroa H, Rouse DJ, Berghella V, Baxter JK, Chauhan SP. Evidence-based surgery for cesarean delivery: an updated systematic review. Am J Obstet Gynecol. 2013;209(4):294–306.
A meta-analysis of 5 randomized controlled trials demonstrated that suture closure of subcutaneous fat is associated with a 34% decrease in the risk of wound disruption in women with fat thickness greater than 2 cm (RR, 0.66; 95% CI, 0.48–0.91).21
A recent systematic review of evidence-based guidelines for surgical decisions during cesarean delivery also recommended this practice based on results of 9 published studies.22 In this review, however, subcutaneous drain placement did not offer any additional benefit, regardless of tissue thickness.22
10 Avoid unproven techniques
Several commonly performed techniques have not been associated with a decreased risk of SSI after cesarean delivery
Dahlke JD, Mendez-Figueroa H, Rouse DJ, Berghella V, Baxter JK, Chauhan SP. Evidence-based surgery for cesarean delivery: an updated systematic review. Am J Obstet Gynecol. 2013;209(4):294–306.
CORONIS Trial Collaborative Group. The CORONIS Trial. International study of caesarean section surgical techniques: a randomised fractional, factorial trial. BMC Pregnancy Childbirth. 2007;7:24. doi:10.1186/1471-2393-7-24.
Familiarity with the obstetric literature will help providers determine which interventions prevent SSI and which do not. Well-designed clinical studies have demonstrated no significant difference in the rate of postcesarean infectious morbidity with the administration of high concentrations of perioperative oxygen,22 saline wound irrigation,22 placement of subcutaneous drains,22 blunt versus sharp abdominal entry,23 and exteriorization of the uterus for repair.23
Share your thoughts! Send your Letter to the Editor to [email protected]. Please include your name and the city and state in which you practice.
1. Creanga AA, Berg CJ, Syverson C, Seed K, Bruce FC, Callaghan WM. Pregnancy-related mortality in the United States, 2006–2010. Obstet Gynecol. 2015;125(1):5–12.
2. Leth RA, Moller JK, Thomsen RW, Uldbjerg N, Norgaard M. Risk of selected postpartum infections after cesarean section compared with vaginal birth: a five-year cohort study of 32,468 women. Acta Obstet Gynecol Scand. 2009;88(9):976–983.
3. Martin JA, Hamilton BE, Osterman JK, et al. Births: final data for 2013. Natl Vital Stat Rep. 2015;64(1):1–65.
4. American College of Obstetricians and Gynecologists. ACOG Committee Opinion No. 549: Obesity in pregnancy. Obstet Gynecol. 2013;121(1):213–217.
5. Dahlke JD, Mendez-Figueroa H, Rouse DJ, Berghella V, Baxter JK, Chauhan SP. Evidence-based surgery for cesarean delivery: an updated systematic review. Am J Obstet Gynecol. 2013;209(4):294–306.
6. Ramos M, Khalpey Z, Lipsitz S, et al. Relationship of perioperative hyperglycemia and postoperative infections in patients who undergo general and vascular surgery. Ann Surg. 2008;248(4):585–591.
7. Mangram AJ, Horan TC, Pearson ML, Silver LC, Jarvis WR. Hospital Infection Control Practices Advisory Committee: Guideline for prevention of surgical site infection, 1999. Infect Control Hosp Epidemiol. 1999;20(4):250–278.
8. Webster J, Osborne S. Preoperative bathing or showering with skin antiseptics to prevent surgical site infection. Cochrane Database Syst Rev. 2012;9:CD004985.
9. Hayek LJ, Emerson JM, Gardner AM. A placebo-controlled trial of the effect of two preoperative baths or showers with chlorhexidine detergent on post-operative wound infection rates. J Hosp Infect. 1987;10(2):165–172.
10. Wihlborg O. The effect of washing with chlorhexidine soap on wound infection rate in general surgery: a controlled clinical study. Ann Chir Gynaecol. 1987;76(5):263–265.
11. Chlebicki MP, Safdar N, O’Horo JC, Maki DG. Preoperative chlorhexidine shower or bath for prevention of surgical site infection: a meta-analysis. Am J Infect Control. 2013;41(2):167–173.
12. American College of Obstetricians and Gynecologists. ACOG Practice Bulletin No. 120: Use of prophylactic antibiotics in labor and delivery. Obstet Gynecol. 2011;117(6):1472–1483.
13. Costantine MM, Rahman M, Ghulmiyah L, et al. Timing of perioperative antibiotics for cesarean delivery: a meta-analysis. Am J Obstet Gynecol. 2008;199(3):301.e1–e6.
14. Robinson HE, O’Connell CM, Joseph KS, McLeod NL. Maternal outcomes in pregnancies complicated by obesity. Obstet Gynecol. 2005;106(6):1357–1364.
15. Pevzner L, Swank M, Krepel C, et al. Effects of maternal obesity on tissue concentrations of prophylactic cefazolin during cesarean delivery. Obstet Gynecol. 2011;117(4):877–882.
16. Tanner J, Norrie P, Melen K. Preoperative hair removal to reduce surgical site infection. Cochrane Database Syst Rev. 2011;11:CD004122.
17. Darouiche RO, Wall MJ Jr, Itani KM, et al. Chlorhexidine-alcohol versus povidone-iodine for surgical-site antisepsis. N Engl J Med. 2010;362(1):18–26.
18. Kunkle CM, Marchan J, Safadi S, Whitman S, Chmait RH. Chlorhexidine gluconate versus povidone iodine at cesarean delivery: a randomized controlled trial. J Matern Fetal Neonatal Med. 2014;18:1–5.
19. Shen NJ, Pan SC, Sheng WH, et al. Comparative antimicrobial efficacy of alcohol-based hand rub and conventional surgical scrub in a medical center [published online ahead of print September 21, 2013]. J Microbiol Immunol Infect. pii:S1684–1182(13)00150–3.
20. Tanner J, Swarbrook S, Stuart J. Surgical hand antisepsis to reduce surgical site infection. Cochrane Database Syst Rev. 2008;1:CD004288.
21. Mackeen AD, Schuster M, Berghella V. Suture versus staples for skin closure after cesarean: a meta-analysis [published online ahead of print December 19, 2014]. Am J Obstet Gynecol. doi:10.1016/j.ajog.2014.12.020.
22. Chelmow D, Rodriguez EJ, Sabatini MM. Suture closure of subcutaneous fat and wound disruption after cesarean delivery: a meta-analysis. Obstet Gynecol. 2004;103(5 Pt 1):974–980.
23. Hanazaki K, Maeda H, Okabayashi T. Relationship between perioperative glycemic control and postoperative infections. World J Gastroenterol. 2009;15(33):4122–4125.
Local anesthesia for uterine procedures
Surgical management of broad ligament fibroids
Although broad ligament fibroids are rare, their surgical management includes nuances of anatomical awareness, traction and counter-traction techniques, and proper hemostasis.
This month’s surgical video presents the case of a 40-year-old woman who presented to the emergency department with sudden-onset abdominal pain. She had a history of menorrhagia and dysmenorrhea and had undergone uterine artery embolization.
The objectives of this technique video are to provide:
- an overview of the background, clinical presentation, and imaging related to broad ligament fibroids
- pertinent anatomical landmarks
- a clinical case of robot-assisted laparoscopic myomectomy, demonstrating surgical technique
- key points for successful and safe surgical management.
I hope you find this video to be a useful tool for your practice and that you share it, and the other technique videos on my Video Channel, with your colleagues.
5 ways to wake up your Web site
Web sites are not like wine and cheese—they don’t necessarily get better with age. You may have started your Web page 20 years ago by moving your 3-color trifold brochure onto the Internet. It may have worked then, but to compete today you must have a robust, interactive, attractive Web site that is continuously being updated with new content. What prospective patients are looking for in a Web site has evolved rapidly. How to get these patients to take action and call for an appointment requires a process or a system.
Trying to keep your Web site current can be daunting for most medical practices. If you find that your Web site is not generating new patients and that your existing patients are not using the site in an interactive fashion, then it is time to upgrade. In this article we suggest 5 practical ways to make your Web site a useful adjunct to your medical practice—an automatic patient conversion system.

1. Go mobile
Make your Web site “thumb friendly.” Mobile technology has taken over the desktop and laptop worlds. Now nearly everyone is using a hand-held smartphone or tablet for their Internet needs.
To attract patients your Web page must be responsive to the screen size of a smartphone or tablet—very different from your Web site, which is accessed from a desktop or a laptop computer. The majority of users navigate not with a mouse but with their fingers and thumbs. To ensure they can find their way on your Web page on a mobile device, the screen view should adjust automatically to the mobile device being used. Whether that is accomplished through a mobile responsive design or an entirely different mobile Web site, you do not want the user to have to resize, zoom, or pinch their way through the page in order to read the content. All the buttons must be large enough to be easily pressed without having to zoom in, and the font should be easy-to-read in style and size.
Having your current Web site programmed to be responsive to these devices will increase the time a mobile user spends on your site and make it easier for her to make an appointment.

2. Add patient reviews
What others say about you is far more important than anything you can say about yourself. Almost half of prospective patients will check out your online reviews before calling you to schedule an appointment.1 Therefore, it is very important that you ask for positive feedback from your patients and post it to your Web site. We recommend that you capture compliments from your existing patients when they are in the office. Have a computer or iPad handy for them to create a positive review; patients who “promise” to do it when they get back to the office or home rarely follow through. Testimonials should be visible on your homepage and can link to another testimonial page or review site.
“as many as 8 out of 10 people will look online for information about individual doctors. And all of that happens long before they make an appointment … and what they find—positive, negative, neutral or nothing at all—influences their decision to call or not to call.”2
Always invite your patients to evaluate you, your practice partners, and the practice online. There are numerous patient review Web sites, including: Google Plus, http://www.RateMDs.com, http://www.Vitals.com, and http://www.HealthGrades.com. And check out what your patients are saying about you on a regular basis. Just type “Reviews for Dr. <your name>” into your search bar to find the results.
Although we hope they will, happy patients rarely fill out these online reviews. However, it takes just 2 or 3 unhappy patients to ruin your online reputation. That could be costing you tens of thousands of dollars in lost billing.

3. Share your videos
What’s hot and what’s not? To answer that, just take a look at how many people watch videos on YouTube every day! People don’t want to read anymore; they want to be entertained and spoon-fed information.
Take advantage of this trend by placing videos on your homepage. Post a video that introduces your practice, provides testimonials of satisfied patients, explains some of the procedures you perform, or shows you describing the latest breakthrough in medical technology.
Your videos don’t have to be long. One to 2 minutes is plenty. They don’t have to feature you talking about medical symptoms or procedures (what’s called a talking head video). Use a PowerPoint presentation with voice overlay—and you don’t have to be the one talking.
Your Web site isn’t the only place you’ll want to post your videos. YouTube is second only to Google as the most popular search engine.3 Just about everyone goes to YouTube to view videos on whatever interests them. See our April 2014 article, titled “Using the Internet in your practice. Part 2: Generating new patients using social media,” to learn more on getting started with YouTube.
Videos will improve your Web site rankings and will increase the time visitors spend on the site. When done properly—labeling the videos with relevant keywords, making the videos short, and presenting information in layman’s language with reasons why it is important to seek a professional if the viewer is experiencing these types of symptoms—they are a great way to convert visitors to patients.

4. Hook‘em on the homepage
If you want your Web site to create a favorable first impression, your homepage should reflect that positive impression. Remember, the homepage, as the face of your practice, is the first thing that a patient will see long before she picks up the phone or comes to the office.
A potential patient visiting your site will make a snap judgment within a few seconds. Think of your homepage as a highway billboard. There are about 3 seconds to make an impression and for a driver to decide whether or not she will exit the highway to buy gas or eat at a restaurant or even contact a business in the future by telephone or, most likely, online. A visit to your Web site has the same attraction timing.
Your homepage must be attractive; provide useful, current information; and have pleasing graphics—all without requiring the visitor to scroll down too far. Your Web site is your opportunity to create a good first impression—an opportunity that won’t happen again.
Use compelling headlines with keyword-related content. You want to make sure you use keywords that a prospective patient might search for in a main headline and in the main body of your homepage. But patients are not the only ones who spot those key terms. Search engines also crawl your Web site for keywords that prospective patients may type into the Google search bar—words like gynecologist, ObGyn, urinary leakage, breast lump, pelvic pain, menopause, etc. Using those keywords helps your site to be found more often by patients and helps those prospective patients find information relevant to their medical needs.

5. Place calls to action on every page
Contact us! This is so rudimentary, yet many Web sites do not have easy-to-find contact information on their homepages. Be sure to include your phone number (which could be different than your regular phone office number so you can track how many calls you get from your Web site).
Add a “schedule an appointment” icon in a prominent position on the homepage so the visitor does not have to scroll down to search for it. But don’t just stop at the homepage. Your contact information should be on every page so that, when the visitor is on a page reading about a condition or procedure, the “schedule an appointment” button is right there for her to click.
Be sure to evaluate your contact page. Make sure it’s easy for patients to find multiple ways to connect with you and your office: phone, fax, email, and snail mail.
Interactivity is important. Why not have an “Ask the doctor your question” field? It makes the site interactive and gives you the opportunity to communicate and develop a relationship with your patients.
Additional interactivity
Social media is the new buzz word-of-mouth. Your patients use Facebook, YouTube, blogging, and Twitter every day. It is the easiest way to stay connected and make your practice and your brand part of their daily lives. Social media builds loyalty. Integrating social media into your Web site provides new opportunities to engage your existing patients and to attract new ones to your practice.
Connect to medical records. Your Web site should have an easy portal for patients to connect to their medical records and laboratory results in a secure, encrypted fashion to comply with HIPAA regulations.
You can do this yourself!
You and your staff should be able to make changes on your Web site without having to contact your Web developer, even if you do not have full-time IT assistance. For example, in Dr. Baum’s practice, his support staff can add testimonials, content, and pictures without contacting the Web developer or knowing code.
Make sure that function is designed into your site and that your Web developer teaches you and your staff how to keep your site updated.
The bottom line
Web sites are like a farmer’s fence, they are always under construction. Merely having a Web site, regardless of the size, specialty, or location of your practice, is not enough. Be sure your site attracts, holds, and converts viewers into paying patients. We hope you will consider these 5 suggestions as a roadmap to develop a robust site, so that when you ask a patient who referred her to your practice, her answer will be “your Web site” or “the Internet.” This will bring cockles to your heart and bucks in your bank account.
Share your thoughts! Send your Letter to the Editor to [email protected]. Please include your name and the city and state in which you practice.
1. Online reputation management for doctors. Vanguard Communications Web site. http://vanguardcommuni cations.net/medical-marketing-portfolio/reputation-management. Accessed March 17, 2015.
2. Gandolf S. Ten commandments of online reputation management for physicians [Part one]. Healthcare Success Web site. http://www.healthcaresuccess.com/blog/internet-marketing-advertising/10-commandments-online-reputation-management-physicians-2.html. Published May 12, 2014. Accessed March 9, 2015.
3. YouTube—The 2nd Largest Search Engine. Mushroom Networks Web site. http://www.mushroomnetworks.com/infographics/youtube---the-2nd-largest-search-engine-infographic. Accessed March 17, 2015.
Ron Romano and Neil H. Baum, MD

Ron Romano is President of www.YourInternetDoctor.com and CEO of Instant Marketing Systems. He co-authored The Internet Survival Guide for Doctors (2014, Instant Marketing Systems) and No B.S. Direct Marketing (2006, Entrepreneur Press) and contributed to the Walking with the Wise series (2004, Mentors Publishing). He is an Internet marketing consultant, speaker, and creator of “The Implementation Blueprint System.”

Neil H. Baum, MD, practices urology in New Orleans, Louisiana. He is Associate Clinical Professor of Urology at Tulane Medical School and Louisiana State University School of Medicine, both in New Orleans. He is also on the medical staff at Touro Infirmary in New Orleans, and East Jefferson General Hospital in Metairie, Louisiana. He is the author of several books, including Social Media for the Healthcare Professional (2012, Greenbranch) and Marketing Your Clinical Practice: Ethically, Effectively, Economically (4th edition, 2009; Jones & Bartlett).
Mr. Romano reports that he is CEO of Instant Marketing Systems, which provides consulting advice, marketing plans, and Internet marketing services for businesses and medical practices. Dr. Baum reports no financial relationships relevant to this article.
Ron Romano and Neil H. Baum, MD
Ron Romano is President of www.YourInternetDoctor.com and CEO of Instant Marketing Systems. He co-authored The Internet Survival Guide for Doctors (2014, Instant Marketing Systems) and No B.S. Direct Marketing (2006, Entrepreneur Press) and contributed to the Walking with the Wise series (2004, Mentors Publishing). He is an Internet marketing consultant, speaker, and creator of “The Implementation Blueprint System.”
Neil H. Baum, MD, practices urology in New Orleans, Louisiana. He is Associate Clinical Professor of Urology at Tulane Medical School and Louisiana State University School of Medicine, both in New Orleans. He is also on the medical staff at Touro Infirmary in New Orleans, and East Jefferson General Hospital in Metairie, Louisiana. He is the author of several books, including Social Media for the Healthcare Professional (2012, Greenbranch) and Marketing Your Clinical Practice: Ethically, Effectively, Economically (4th edition, 2009; Jones & Bartlett).
Mr. Romano reports that he is CEO of Instant Marketing Systems, which provides consulting advice, marketing plans, and Internet marketing services for businesses and medical practices. Dr. Baum reports no financial relationships relevant to this article.
Web sites are not like wine and cheese—they don’t necessarily get better with age. You may have started your Web page 20 years ago by moving your 3-color trifold brochure onto the Internet. It may have worked then, but to compete today you must have a robust, interactive, attractive Web site that is continuously being updated with new content. What prospective patients are looking for in a Web site has evolved rapidly. How to get these patients to take action and call for an appointment requires a process or a system.
Trying to keep your Web site current can be daunting for most medical practices. If you find that your Web site is not generating new patients and that your existing patients are not using the site in an interactive fashion, then it is time to upgrade. In this article we suggest 5 practical ways to make your Web site a useful adjunct to your medical practice—an automatic patient conversion system.
1. Go mobile
Make your Web site “thumb friendly.” Mobile technology has taken over the desktop and laptop worlds. Now nearly everyone is using a hand-held smartphone or tablet for their Internet needs.
To attract patients your Web page must be responsive to the screen size of a smartphone or tablet—very different from your Web site, which is accessed from a desktop or a laptop computer. The majority of users navigate not with a mouse but with their fingers and thumbs. To ensure they can find their way on your Web page on a mobile device, the screen view should adjust automatically to the mobile device being used. Whether that is accomplished through a mobile responsive design or an entirely different mobile Web site, you do not want the user to have to resize, zoom, or pinch their way through the page in order to read the content. All the buttons must be large enough to be easily pressed without having to zoom in, and the font should be easy-to-read in style and size.
Having your current Web site programmed to be responsive to these devices will increase the time a mobile user spends on your site and make it easier for her to make an appointment.
2. Add patient reviews
What others say about you is far more important than anything you can say about yourself. Almost half of prospective patients will check out your online reviews before calling you to schedule an appointment.1 Therefore, it is very important that you ask for positive feedback from your patients and post it to your Web site. We recommend that you capture compliments from your existing patients when they are in the office. Have a computer or iPad handy for them to create a positive review; patients who “promise” to do it when they get back to the office or home rarely follow through. Testimonials should be visible on your homepage and can link to another testimonial page or review site.
“as many as 8 out of 10 people will look online for information about individual doctors. And all of that happens long before they make an appointment … and what they find—positive, negative, neutral or nothing at all—influences their decision to call or not to call.”2
Always invite your patients to evaluate you, your practice partners, and the practice online. There are numerous patient review Web sites, including: Google Plus, http://www.RateMDs.com, http://www.Vitals.com, and http://www.HealthGrades.com. And check out what your patients are saying about you on a regular basis. Just type “Reviews for Dr. <your name>” into your search bar to find the results.
Although we hope they will, happy patients rarely fill out these online reviews. However, it takes just 2 or 3 unhappy patients to ruin your online reputation. That could be costing you tens of thousands of dollars in lost billing.
3. Share your videos
What’s hot and what’s not? To answer that, just take a look at how many people watch videos on YouTube every day! People don’t want to read anymore; they want to be entertained and spoon-fed information.
Take advantage of this trend by placing videos on your homepage. Post a video that introduces your practice, provides testimonials of satisfied patients, explains some of the procedures you perform, or shows you describing the latest breakthrough in medical technology.
Your videos don’t have to be long. One to 2 minutes is plenty. They don’t have to feature you talking about medical symptoms or procedures (what’s called a talking head video). Use a PowerPoint presentation with voice overlay—and you don’t have to be the one talking.
Your Web site isn’t the only place you’ll want to post your videos. YouTube is second only to Google as the most popular search engine.3 Just about everyone goes to YouTube to view videos on whatever interests them. See our April 2014 article, titled “Using the Internet in your practice. Part 2: Generating new patients using social media,” to learn more on getting started with YouTube.
Videos will improve your Web site rankings and will increase the time visitors spend on the site. When done properly—labeling the videos with relevant keywords, making the videos short, and presenting information in layman’s language with reasons why it is important to seek a professional if the viewer is experiencing these types of symptoms—they are a great way to convert visitors to patients.
4. Hook‘em on the homepage
If you want your Web site to create a favorable first impression, your homepage should reflect that positive impression. Remember, the homepage, as the face of your practice, is the first thing that a patient will see long before she picks up the phone or comes to the office.
A potential patient visiting your site will make a snap judgment within a few seconds. Think of your homepage as a highway billboard. There are about 3 seconds to make an impression and for a driver to decide whether or not she will exit the highway to buy gas or eat at a restaurant or even contact a business in the future by telephone or, most likely, online. A visit to your Web site has the same attraction timing.
Your homepage must be attractive; provide useful, current information; and have pleasing graphics—all without requiring the visitor to scroll down too far. Your Web site is your opportunity to create a good first impression—an opportunity that won’t happen again.
Use compelling headlines with keyword-related content. You want to make sure you use keywords that a prospective patient might search for in a main headline and in the main body of your homepage. But patients are not the only ones who spot those key terms. Search engines also crawl your Web site for keywords that prospective patients may type into the Google search bar—words like gynecologist, ObGyn, urinary leakage, breast lump, pelvic pain, menopause, etc. Using those keywords helps your site to be found more often by patients and helps those prospective patients find information relevant to their medical needs.
5. Place calls to action on every page
Contact us! This is so rudimentary, yet many Web sites do not have easy-to-find contact information on their homepages. Be sure to include your phone number (which could be different than your regular phone office number so you can track how many calls you get from your Web site).
Add a “schedule an appointment” icon in a prominent position on the homepage so the visitor does not have to scroll down to search for it. But don’t just stop at the homepage. Your contact information should be on every page so that, when the visitor is on a page reading about a condition or procedure, the “schedule an appointment” button is right there for her to click.
Be sure to evaluate your contact page. Make sure it’s easy for patients to find multiple ways to connect with you and your office: phone, fax, email, and snail mail.
Interactivity is important. Why not have an “Ask the doctor your question” field? It makes the site interactive and gives you the opportunity to communicate and develop a relationship with your patients.
Additional interactivity
Social media is the new buzz word-of-mouth. Your patients use Facebook, YouTube, blogging, and Twitter every day. It is the easiest way to stay connected and make your practice and your brand part of their daily lives. Social media builds loyalty. Integrating social media into your Web site provides new opportunities to engage your existing patients and to attract new ones to your practice.
Connect to medical records. Your Web site should have an easy portal for patients to connect to their medical records and laboratory results in a secure, encrypted fashion to comply with HIPAA regulations.
You can do this yourself!
You and your staff should be able to make changes on your Web site without having to contact your Web developer, even if you do not have full-time IT assistance. For example, in Dr. Baum’s practice, his support staff can add testimonials, content, and pictures without contacting the Web developer or knowing code.
Make sure that function is designed into your site and that your Web developer teaches you and your staff how to keep your site updated.
The bottom line
Web sites are like a farmer’s fence, they are always under construction. Merely having a Web site, regardless of the size, specialty, or location of your practice, is not enough. Be sure your site attracts, holds, and converts viewers into paying patients. We hope you will consider these 5 suggestions as a roadmap to develop a robust site, so that when you ask a patient who referred her to your practice, her answer will be “your Web site” or “the Internet.” This will bring cockles to your heart and bucks in your bank account.
Share your thoughts! Send your Letter to the Editor to [email protected]. Please include your name and the city and state in which you practice.
1. Online reputation management for doctors. Vanguard Communications Web site. http://vanguardcommuni cations.net/medical-marketing-portfolio/reputation-management. Accessed March 17, 2015.
2. Gandolf S. Ten commandments of online reputation management for physicians [Part one]. Healthcare Success Web site. http://www.healthcaresuccess.com/blog/internet-marketing-advertising/10-commandments-online-reputation-management-physicians-2.html. Published May 12, 2014. Accessed March 9, 2015.
3. YouTube—The 2nd Largest Search Engine. Mushroom Networks Web site. http://www.mushroomnetworks.com/infographics/youtube---the-2nd-largest-search-engine-infographic. Accessed March 17, 2015.

FDA approves new formulation of deferasirox for iron chelation
The Food and Drug Administration approved a new formulation of deferasirox as a once-daily oral tablet for iron chelation, Novartis announced.
The product, to be marketed as Jadenu, is indicated for chronic iron overload due to blood transfusions in patients 2 years of age and older, and chronic iron overload in non–transfusion-dependent thalassemia in patients 10 years of age or older. Novartis said it is the only once-daily oral iron chelator that can be swallowed whole, with or without food.
Jadenu is a reformulation of Exjade, a dispersible tablet that must be mixed in liquid and taken on an empty stomach.
The new product received its green light under the FDA’s accelerated approval process based on a reduction of liver iron concentrations and serum ferritin levels. Continued approval may be contingent upon verification and description of clinical benefit in confirmatory trials, Novartis said.
Nausea, vomiting, diarrhea, stomach pain, increases in kidney laboratory values, and skin rash were the most common side effects reported in deferasirox clinical trials. Novartis warned that the drug may cause serious kidney problems, liver problems, and bleeding in the stomach or intestines, and in some cases, death from these complications. The company added that it is not known if Jadenu is safe or effective when taken with other iron chelation therapy, and controlled clinical trials of deferasirox for patients with myelodysplastic syndromes and chronic iron overload due to blood transfusions have not been performed.
Full prescribing information is available at http://tinyurl.com/nspjlek.
Mother dies after cesarean delivery: $4.5M verdict

Mother dies after cesarean delivery: $4.5M verdict
A 31-year-old woman gave birth to her first child by cesarean delivery. Over the next 3 days she reported nausea, vomiting, severe abdominal pain, and had an elevated heart rate. On day 4, she was discharged from the hospital. She went to the ObGyn’s office the next day and was told, after several hours, to return to the hospital. There she was found to have sepsis and acute renal failure. A transfer to another hospital was attempted that night, but she died during transport.
Estate's Claim: The ObGyn should have responded to her reported symptoms prior to discharge by ordering tests. The ObGyn should have called an ambulance to transport her to the hospital from his office.
Defendants’ Defense: The hospital settled for an undisclosed amount before the trial. The ObGyn claimed that there was no negligence in the patient’s treatment.
Verdict: A $4.5 million North Carolina verdict was returned.
Brain-damaged child dies at age 2
A woman was admitted to the hospital in labor. Ninety minutes later a nonreassuring fetal heart-rate tracing was noted. Two hours after that, the ObGyn decided to perform an emergency cesarean delivery.
The child was depressed at birth and required resuscitation. She was transferred to another hospital’s neonatal intensive care unit (NICU), where she was found to have had a severe and catastrophic brain injury. The child died at 2 years of age.
Parent's Claim: An emergency cesarean delivery should have been performed as soon as the fetal heart-rate tracing was found to be nonreassuring. The ObGyn failed to respond to phone calls from the nurses to report fetal distress.
Physician's Defense: The delivery was performed in a timely manner. Brain damage was due to encephalopathy that occurred prior to labor.
Verdict: A Mississippi defense verdict was returned.
Who or what was at fault for ureter injury?
A 45-year-old woman underwent hysterectomy performed by her ObGyn. During surgery, the patient’s ureter was injured. Several additional operations were needed to repair the injury.
Patient's Claim: The patient was not fully informed of the extent of the surgery or possible complications. The ObGyn was negligent in injuring the ureter.
Defendants' Defense: Three months after surgery, the physician entered notes into the patient’s chart that indicated that the ureter injuries were due to a defective monopolar device that had been provided by the hospital. Informed consent included surgical options and complications.
The hospital argued that its equipment was not defective; other surgeons had used the device without any problems. The ObGyn had not used the device before; any injuries were due to his inexperience and negligence.
Verdict: A $2 million South Carolina verdict was returned against the ObGyn. The hospital received a defense verdict.
Did excessive force cause child’s C7 injury?
During delivery, shoulder dystocia was encountered. The child has nerve root avulsion at C7 with damage to adjacent nerve trunks at C5–C6. As a result of the brachial plexus injury, the patient underwent cable grafting and muscle surgeries, but he has permanent weakness and dysfunction in his left arm.
Parent's Claim: Excessive force was used to deliver the child during manipulations for shoulder dystocia.
Physician's Defense: The ObGyn denied using excessive traction. She claimed that she had never used upward traction during a shoulder dystocia presentation. Suprapubic pressure, McRoberts’ maneuver, and delivery of the posterior arm were used. The damage occurred prior to delivery of the head.
Verdict An Illinois defense verdict was returned.

Laparoscopic sheath and coils found at exploratory surgery
In april 2007, a woman underwent a sterilization procedure (Essure) after which she reported pelvic pain. In September 2007, she consented to right salpingo-oophorectomy plus appendectomy. The ObGyn performed the surgery using a robotic device. After surgery, the pathology report indicated that the resected organs were normal and functional.
The patient moved to another state. She continued to have pain and sought treatment with another physician. A computed tomography (CT) scan more than 3 years after robotic surgery revealed foreign objects in the patient’s body. One full Essure coil, a non-fired coil, a second partial coil, and a robotic laparoscopy sheath were surgically removed.
Patient's Claim: The ObGyn was negligent in the performance of the sterilization and robotic surgery procedures. The healthy ovary and fallopian tube should not have been removed and caused her to have surgical menopause.
Physician's defense: The right ovary appeared diseased. The Essure device dropped the coils. The robot malfunctioned during the salpingo-oophorectomy.
Verdict: A $110,513 Oregon verdict was returned, including $10,500 in medical expenses and $100,000 for pain and mental anguish.
Discrepancy in fundal height; child has CP
During her second pregnancy, a 37-year-old woman saw Dr. A, her ObGyn, for regular prenatal care. At 37 weeks’ gestation, the fundal height was not consistent with the fetus’ gestational age: the measurement was higher by 2 cm. No additional testing was scheduled.
At 39.5 weeks’ gestation, the mother reported decreased fetal movement. Because her regular ObGyn was on vacation, she was evaluated by another ObGyn (Dr. B). The fetal heart-rate monitor showed nonreactive results with minimal variability. Dr. B told the mother to drive herself to the emergency department (ED) for additional evaluation. At the hospital, when fetal heart-rate monitoring confirmed fetal distress, an emergency cesarean delivery was performed.
At birth, the baby was not breathing and resuscitation began. The infant was taken to a transitional care unit and then to the NICU, where he was intubated. Cord blood testing confirmed metabolic acidosis. The baby was later found to have dystonic cerebral palsy (CP). He is unable to speak, walk, eat, or care for himself, and he requires 24/7 nursing care.
Parents' Claim: Dr. A failed to order testing after the fundal height discrepancy was found. Testing could have led to an earlier delivery and avoided the injury. The pediatrician failed to ensure adequate oxygenation after delivery. The baby should have been transferred immediately to the NICU and intubated.
Physician's Defense: The fundal height discrepancy was explained by the baby’s position within the uterus. The pediatrician acted heroically to save the child’s life.
Verdict: A $3.5 million Massachusetts settlement was reached.
NT scans misread, not reported; child has Down syndrome
At 13 weeks’ gestation, a 38-year-old woman saw a maternal-fetal medicine (MFM) specialist, who interpreted a nuchal translucency (NT) scan as normal. At 20 weeks’ gestation, an ObGyn performed a second screening that indicated the fetus was at high risk for Down syndrome. However, no further testing was ordered.
At 26.5 weeks’ gestation, amniocentesis was performed after ultrasonography and an echocardiogram revealed fetal abnormalities. A diagnosis of Down syndrome was made at 29 weeks’ gestation, too late for termination of pregnancy.
Parent's Claim: The MFM specialist misread the first NT scan. The ObGyn did not inform the mother of the results of the second screening. Proper interpretation and reporting would have initiated further testing and determination that the baby had Down syndrome before the deadline for termination of pregnancy.
Defendants' Defense: The case was settled during trial.
Verdict: A $3 million New Jersey settlement was reached, including $2 million from the medical center where the second test was performed, $940,000 from the ObGyn, and $60,000 from the MFM specialist.
Uterine rupture, baby dies: $2.15M award
At 38 weeks’ gestation, a mother was admitted to a hospital for induction of labor due to pregnancy-induced hypertension. The fetus was estimated to be large for its gestational age. A uterine rupture occurred during labor. The baby was stillborn.
Parents' Claim: The uterine rupture was not immediately recognized. The ObGyn failed to come to the mother’s bedside until after the fetus had receded up the birth canal, which indicated that a rupture was occurring. The ObGyn ordered oxytocin instead of performing an immediate cesarean delivery. Eleven minutes later, the cesarean was ordered, but the baby had died.
Physician's Defense: There was no negligence; proper protocols were followed. A uterine rupture cannot be predicted.
Verdict: A $650,000 settlement was reached with the hospital before trial. Because the ObGyn was employed by a federally qualified clinic, the matter was filed in federal court. The Illinois court issued a bench decision awarding $1.5 million.
Migrated IUD causes years of pain
In september 2006, an ObGyn inserted an intrauterine device (IUD) in a patient. In February 2007, the patient had an ectopic pregnancy. The IUD was not found during dilation and curettage. The patient continued to report pain to the ObGyn. She sought treatment from another physician in November 2010 due to continuing pain. A CT scan revealed that the IUD had migrated to her abdomen. The IUD was surgically removed.
Patient's Claim: The ObGyn was unwilling to figure out why the patient had continuing pain, and told her to “just deal with it.” He should have found and removed the IUD after the ectopic pregnancy.
Physician's Defense: It was reasonable to assume that the IUD had been expelled, as 2 ultrasonographies performed after ectopic pregnancy revealed nothing. Since the IUD had not caused an abscess, infection, or inflammation, the patient suffered no injury.
Verdict: A Virginia defense verdict was returned.
Profoundly disabled child dies at age 5
A 17-year-old woman with a history of miscarriage received prenatal care from her ObGyn. A July due date was established by ultrasonography in January.
In May, the mother went to the ED with pelvic pain. She was treated for preterm labor and discharged 2 days later.
In early July, ultrasonography showed a fetus in cephalic position with a posterior-located placenta.
At a prenatal examination a week later, the patient reported vaginal discharge. Her ObGyn suspected premature rupture of membranes (PROM) and admitted her to the hospital. Oxytocin was used to induce labor. Intact membranes were artificially ruptured and an internal fetal heart-rate monitor was placed. The ObGyn recorded that the pregnancy was at term.
Hours later, the mother told the nurses that she thought the fetal monitor had become disconnected; the monitor’s placement was not confirmed. The mother was given a sedative. After a few hours, she awoke with intense pain and dizziness. She used her call button, but no one immediately responded.
When full cervical dilation was reached, the fetus was at –1, 0 station. When the fetus reached +1 station, delivery was attempted. The baby was delivered using vacuum extraction.
The child’s Apgar score was 0 at 1 minute of life. Resuscitation was started with intubation and mechanical ventilation. The child’s birth weight was 6.87 lb; arterial blood gas pH measured 6.9; and gestational age was estimated at 38 to 39 weeks.
An electro-encephalogram performed in the NICU suggested intraventricular hemorrhage. The child was found to have perinatal asphyxia, hypoxic ischemic encephalopathy, left parietal skull fracture and cephalohematoma, severe metabolic acidosis, suspected sepsis, transient oliguria, and seizure episodes. The baby was hospitalized for 3.5 months and then followed regularly.
The mother and child moved from Puerto Rico to New York City to obtain better medical care. The child was regularly hospitalized until she died at age 5.
Parent's Claim: There was a discrepancy in gestational age assessment. The nurses failed to monitor fetal heart-rate tracings at proper intervals, and they were unresponsive to the mother. Informed consent did not include vacuum extraction.
Defendants' Defense: The case was settled during trial.
Verdict: A $1.125 million Puerto Rico settlement was reached.
These cases were selected by the editors of OBG Management from Medical Malpractice Verdicts, Settlements, & Experts, with permission of the editor, Lewis Laska (www.verdictslaska.com). The information available to the editors about the cases presented here is sometimes incomplete. Moreover, the cases may or may not have merit. Nevertheless, these cases represent the types of clinical situations that typically result in litigation and are meant to illustrate nationwide variation in jury verdicts and awards.
Share your thoughts! Send your Letter to the Editor to [email protected]. Please include your name and the city and state in which you practice.
Mother dies after cesarean delivery: $4.5M verdict
A 31-year-old woman gave birth to her first child by cesarean delivery. Over the next 3 days she reported nausea, vomiting, severe abdominal pain, and had an elevated heart rate. On day 4, she was discharged from the hospital. She went to the ObGyn’s office the next day and was told, after several hours, to return to the hospital. There she was found to have sepsis and acute renal failure. A transfer to another hospital was attempted that night, but she died during transport.
Estate's Claim: The ObGyn should have responded to her reported symptoms prior to discharge by ordering tests. The ObGyn should have called an ambulance to transport her to the hospital from his office.
Defendants’ Defense: The hospital settled for an undisclosed amount before the trial. The ObGyn claimed that there was no negligence in the patient’s treatment.
Verdict: A $4.5 million North Carolina verdict was returned.
Brain-damaged child dies at age 2
A woman was admitted to the hospital in labor. Ninety minutes later a nonreassuring fetal heart-rate tracing was noted. Two hours after that, the ObGyn decided to perform an emergency cesarean delivery.
The child was depressed at birth and required resuscitation. She was transferred to another hospital’s neonatal intensive care unit (NICU), where she was found to have had a severe and catastrophic brain injury. The child died at 2 years of age.
Parent's Claim: An emergency cesarean delivery should have been performed as soon as the fetal heart-rate tracing was found to be nonreassuring. The ObGyn failed to respond to phone calls from the nurses to report fetal distress.
Physician's Defense: The delivery was performed in a timely manner. Brain damage was due to encephalopathy that occurred prior to labor.
Verdict: A Mississippi defense verdict was returned.
Who or what was at fault for ureter injury?
A 45-year-old woman underwent hysterectomy performed by her ObGyn. During surgery, the patient’s ureter was injured. Several additional operations were needed to repair the injury.
Patient's Claim: The patient was not fully informed of the extent of the surgery or possible complications. The ObGyn was negligent in injuring the ureter.
Defendants' Defense: Three months after surgery, the physician entered notes into the patient’s chart that indicated that the ureter injuries were due to a defective monopolar device that had been provided by the hospital. Informed consent included surgical options and complications.
The hospital argued that its equipment was not defective; other surgeons had used the device without any problems. The ObGyn had not used the device before; any injuries were due to his inexperience and negligence.
Verdict: A $2 million South Carolina verdict was returned against the ObGyn. The hospital received a defense verdict.
Did excessive force cause child’s C7 injury?
During delivery, shoulder dystocia was encountered. The child has nerve root avulsion at C7 with damage to adjacent nerve trunks at C5–C6. As a result of the brachial plexus injury, the patient underwent cable grafting and muscle surgeries, but he has permanent weakness and dysfunction in his left arm.
Parent's Claim: Excessive force was used to deliver the child during manipulations for shoulder dystocia.
Physician's Defense: The ObGyn denied using excessive traction. She claimed that she had never used upward traction during a shoulder dystocia presentation. Suprapubic pressure, McRoberts’ maneuver, and delivery of the posterior arm were used. The damage occurred prior to delivery of the head.
Verdict An Illinois defense verdict was returned.
Laparoscopic sheath and coils found at exploratory surgery
In april 2007, a woman underwent a sterilization procedure (Essure) after which she reported pelvic pain. In September 2007, she consented to right salpingo-oophorectomy plus appendectomy. The ObGyn performed the surgery using a robotic device. After surgery, the pathology report indicated that the resected organs were normal and functional.
The patient moved to another state. She continued to have pain and sought treatment with another physician. A computed tomography (CT) scan more than 3 years after robotic surgery revealed foreign objects in the patient’s body. One full Essure coil, a non-fired coil, a second partial coil, and a robotic laparoscopy sheath were surgically removed.
Patient's Claim: The ObGyn was negligent in the performance of the sterilization and robotic surgery procedures. The healthy ovary and fallopian tube should not have been removed and caused her to have surgical menopause.
Physician's defense: The right ovary appeared diseased. The Essure device dropped the coils. The robot malfunctioned during the salpingo-oophorectomy.
Verdict: A $110,513 Oregon verdict was returned, including $10,500 in medical expenses and $100,000 for pain and mental anguish.
Discrepancy in fundal height; child has CP
During her second pregnancy, a 37-year-old woman saw Dr. A, her ObGyn, for regular prenatal care. At 37 weeks’ gestation, the fundal height was not consistent with the fetus’ gestational age: the measurement was higher by 2 cm. No additional testing was scheduled.
At 39.5 weeks’ gestation, the mother reported decreased fetal movement. Because her regular ObGyn was on vacation, she was evaluated by another ObGyn (Dr. B). The fetal heart-rate monitor showed nonreactive results with minimal variability. Dr. B told the mother to drive herself to the emergency department (ED) for additional evaluation. At the hospital, when fetal heart-rate monitoring confirmed fetal distress, an emergency cesarean delivery was performed.
At birth, the baby was not breathing and resuscitation began. The infant was taken to a transitional care unit and then to the NICU, where he was intubated. Cord blood testing confirmed metabolic acidosis. The baby was later found to have dystonic cerebral palsy (CP). He is unable to speak, walk, eat, or care for himself, and he requires 24/7 nursing care.
Parents' Claim: Dr. A failed to order testing after the fundal height discrepancy was found. Testing could have led to an earlier delivery and avoided the injury. The pediatrician failed to ensure adequate oxygenation after delivery. The baby should have been transferred immediately to the NICU and intubated.
Physician's Defense: The fundal height discrepancy was explained by the baby’s position within the uterus. The pediatrician acted heroically to save the child’s life.
Verdict: A $3.5 million Massachusetts settlement was reached.
NT scans misread, not reported; child has Down syndrome
At 13 weeks’ gestation, a 38-year-old woman saw a maternal-fetal medicine (MFM) specialist, who interpreted a nuchal translucency (NT) scan as normal. At 20 weeks’ gestation, an ObGyn performed a second screening that indicated the fetus was at high risk for Down syndrome. However, no further testing was ordered.
At 26.5 weeks’ gestation, amniocentesis was performed after ultrasonography and an echocardiogram revealed fetal abnormalities. A diagnosis of Down syndrome was made at 29 weeks’ gestation, too late for termination of pregnancy.
Parent's Claim: The MFM specialist misread the first NT scan. The ObGyn did not inform the mother of the results of the second screening. Proper interpretation and reporting would have initiated further testing and determination that the baby had Down syndrome before the deadline for termination of pregnancy.
Defendants' Defense: The case was settled during trial.
Verdict: A $3 million New Jersey settlement was reached, including $2 million from the medical center where the second test was performed, $940,000 from the ObGyn, and $60,000 from the MFM specialist.
Uterine rupture, baby dies: $2.15M award
At 38 weeks’ gestation, a mother was admitted to a hospital for induction of labor due to pregnancy-induced hypertension. The fetus was estimated to be large for its gestational age. A uterine rupture occurred during labor. The baby was stillborn.
Parents' Claim: The uterine rupture was not immediately recognized. The ObGyn failed to come to the mother’s bedside until after the fetus had receded up the birth canal, which indicated that a rupture was occurring. The ObGyn ordered oxytocin instead of performing an immediate cesarean delivery. Eleven minutes later, the cesarean was ordered, but the baby had died.
Physician's Defense: There was no negligence; proper protocols were followed. A uterine rupture cannot be predicted.
Verdict: A $650,000 settlement was reached with the hospital before trial. Because the ObGyn was employed by a federally qualified clinic, the matter was filed in federal court. The Illinois court issued a bench decision awarding $1.5 million.
Migrated IUD causes years of pain
In september 2006, an ObGyn inserted an intrauterine device (IUD) in a patient. In February 2007, the patient had an ectopic pregnancy. The IUD was not found during dilation and curettage. The patient continued to report pain to the ObGyn. She sought treatment from another physician in November 2010 due to continuing pain. A CT scan revealed that the IUD had migrated to her abdomen. The IUD was surgically removed.
Patient's Claim: The ObGyn was unwilling to figure out why the patient had continuing pain, and told her to “just deal with it.” He should have found and removed the IUD after the ectopic pregnancy.
Physician's Defense: It was reasonable to assume that the IUD had been expelled, as 2 ultrasonographies performed after ectopic pregnancy revealed nothing. Since the IUD had not caused an abscess, infection, or inflammation, the patient suffered no injury.
Verdict: A Virginia defense verdict was returned.
Profoundly disabled child dies at age 5
A 17-year-old woman with a history of miscarriage received prenatal care from her ObGyn. A July due date was established by ultrasonography in January.
In May, the mother went to the ED with pelvic pain. She was treated for preterm labor and discharged 2 days later.
In early July, ultrasonography showed a fetus in cephalic position with a posterior-located placenta.
At a prenatal examination a week later, the patient reported vaginal discharge. Her ObGyn suspected premature rupture of membranes (PROM) and admitted her to the hospital. Oxytocin was used to induce labor. Intact membranes were artificially ruptured and an internal fetal heart-rate monitor was placed. The ObGyn recorded that the pregnancy was at term.
Hours later, the mother told the nurses that she thought the fetal monitor had become disconnected; the monitor’s placement was not confirmed. The mother was given a sedative. After a few hours, she awoke with intense pain and dizziness. She used her call button, but no one immediately responded.
When full cervical dilation was reached, the fetus was at –1, 0 station. When the fetus reached +1 station, delivery was attempted. The baby was delivered using vacuum extraction.
The child’s Apgar score was 0 at 1 minute of life. Resuscitation was started with intubation and mechanical ventilation. The child’s birth weight was 6.87 lb; arterial blood gas pH measured 6.9; and gestational age was estimated at 38 to 39 weeks.
An electro-encephalogram performed in the NICU suggested intraventricular hemorrhage. The child was found to have perinatal asphyxia, hypoxic ischemic encephalopathy, left parietal skull fracture and cephalohematoma, severe metabolic acidosis, suspected sepsis, transient oliguria, and seizure episodes. The baby was hospitalized for 3.5 months and then followed regularly.
The mother and child moved from Puerto Rico to New York City to obtain better medical care. The child was regularly hospitalized until she died at age 5.
Parent's Claim: There was a discrepancy in gestational age assessment. The nurses failed to monitor fetal heart-rate tracings at proper intervals, and they were unresponsive to the mother. Informed consent did not include vacuum extraction.
Defendants' Defense: The case was settled during trial.
Verdict: A $1.125 million Puerto Rico settlement was reached.
These cases were selected by the editors of OBG Management from Medical Malpractice Verdicts, Settlements, & Experts, with permission of the editor, Lewis Laska (www.verdictslaska.com). The information available to the editors about the cases presented here is sometimes incomplete. Moreover, the cases may or may not have merit. Nevertheless, these cases represent the types of clinical situations that typically result in litigation and are meant to illustrate nationwide variation in jury verdicts and awards.
Share your thoughts! Send your Letter to the Editor to [email protected]. Please include your name and the city and state in which you practice.
IN THIS ARTICLE
- Brain-damaged child dies at age 2
- Who or what was at fault for ureter injury?
- Did excessive force cause child’s C7 injury?
- Laparoscopic sheath and coils found at exploratory surgery
- Discrepancy in fundal height; child has CP
- NT scans misread, not reported; child has Down syndrome
- Uterine rupture, baby dies: $2.15M award
- Migrated IUD causes years of pain
- Profoundly disabled child dies at age 5